
 Open Access Article
 This Open Access Article is licensed under a Creative Commons Attribution-Non Commercial 3.0 Unported Licence
Confining the spin between two metal atoms within the carbon cage: redox-active metal–metal bonds in dimetallofullerenes and their stable cation radicals†
Nataliya A.
Samoylova
 a,
Stanislav M.
Avdoshenko
a,
Denis S.
Krylov
a,
Hannah R.
Thompson
b,
Amelia C.
Kirkhorn
b,
Marco
Rosenkranz
a,
Sandra
Schiemenz
a,
Frank
Ziegs
a,
Anja U. B.
Wolter
a,
Shangfeng
Yang
c,
Steven
Stevenson
*b and
Alexey A.
Popov
*a
a,
Stanislav M.
Avdoshenko
a,
Denis S.
Krylov
a,
Hannah R.
Thompson
b,
Amelia C.
Kirkhorn
b,
Marco
Rosenkranz
a,
Sandra
Schiemenz
a,
Frank
Ziegs
a,
Anja U. B.
Wolter
a,
Shangfeng
Yang
c,
Steven
Stevenson
*b and
Alexey A.
Popov
*a
aLeibniz Institute for Solid State and Materials Research (IFW Dresden), Helmholtzstraße 20, 01069 Dresden, Germany. E-mail: a.popov@ifw-dresden.de
bIndiana-Purdue University Fort Wayne, Department of Chemistry, 2101 E. Coliseum Blvd, Fort Wayne, IN 46835, USA. E-mail: stevenss@ipfw.edu
cHefei National Laboratory for Physical Sciences at Microscale, CAS Key Laboratory of Materials for Energy Conversion, Department of Materials Science and Engineering, University of Science and Technology of China, Hefei 230026, China
First published on 5th May 2017
Abstract
Lanthanide–lanthanide bonds are exceptionally rare, and dimetallofullerenes provide a unique possibility to stabilize and study these unusual bonding patterns. The presence of metal–metal bonds and consequences thereof for the electronic properties of M2@C82 (M = Sc, Er, Lu) are addressed by electrochemistry, electron paramagnetic resonance, SQUID magnetometry and other spectroscopic techniques. A simplified non-chromatographic separation procedure is developed for the isolation of Er2@C82 (Cs(6) and C3v(8) cage isomers) and Sc2@C82 (C3v(8) isomer) from fullerene mixtures. Sulfide clusterfullerenes Er2S@C82 with Cs(6) and C3v(8) fullerene cages are synthesized for the first time. The metal–metal bonding orbital of the spd hybrid character in M2@C82 is shown to be the highest occupied molecular orbital, which undergoes reversible single-electron oxidation with a metal-dependent oxidation potential. Sulfide clusterfullerenes with a fullerene-based HOMO have more positive oxidation potentials. The metal-based oxidation of Sc2@C82-C3v is confirmed by the EPR spectrum of the cation radical [Sc2@C82-C3v]+ generated by chemical oxidation in solution. The spectrum exhibits an exceptionally large a(45Sc) hyperfine coupling constant of 199.2 G, indicating a substantial 4s contribution to the metal–metal bonding orbital. The cationic salt [Er2@C82-C3v]+SbCl6− is prepared, and its magnetization behavior is compared to that of pristine Er2@C82-C3v and Er2S@C82-C3v. The formation of the single-electron Er–Er bond in the cation dramatically changes the coupling between magnetic moments of Er ions.
Introduction
The magnetic and optical properties of lanthanides have earned them a plethora of practical applications and reinforce continuous exploration of the new possibilities the partially-filled 4f-shell can provide for academic and applied research in chemistry, physics, and materials science. The search for unusual oxidation states of lanthanides is one of the directions, in which the research is on-going. Over the last few years, compounds with a formal +2 oxidation state, in which the lanthanide ion has a 4fn5d1 electronic configuration, have been obtained for a majority of the lanthanide row.1–3 However, the synthesis of a molecular compound with covalent lanthanide–lanthanide bonds is still challenging for traditional organometallic chemistry. This obstacle can be circumvented by confining lanthanide ions within a limited space, such as the inner space of a fullerene molecule.The encapsulation of metal atoms by carbon cages in the formation of endohedral metallofullerenes (EMFs) leads to a number of interesting chemical and physical phenomena, which have been attracting attention to EMFs over the last few decades.4–7 In EMFs, metal atoms transfer their valence electrons to the carbon cage. The EMFs can be then described as non-dissociative “salts”, with endohedral metal atoms as cations and fullerene cages as anions. In dimetallofullerenes (di-EMFs, i.e. EMFs with two metal atoms), positively charged metal atoms repel each other. However, computational studies suggest that certain typically trivalent metal atoms form a metal–metal bonding orbital, whose energy is close to the energy of the frontier fullerene molecular orbitals (MOs).8,9 For early lanthanides such as La or Ce, this M–M bonding orbital is usually the LUMO of the di-EMFs, which then leads to the special redox behavior of such fullerenes with relatively high reduction potentials.10–13 Upon reduction, the M–M bonding MO is populated, and hence the metal–metal bond is formed.10 The formation of the single-occupied La–La bonding MO in the La2@C80− anion radical is confirmed by EPR spectroscopy.14 Furthermore, the single-electron La–La bond has been stabilized in some non-charged derivatives of La2@C80.15,16
In the case of Sc, Y, and late lanthanides (Er, Lu), the M–M bonding MO can be the HOMO of the respective di-EMF molecules, i.e., despite the strong Coulomb repulsion, there is a covalent bond between the metal atoms, which formally adopt a divalent state.8,17 The compounds with covalent lanthanide–lanthanide bonds are not well known (metallic bonds in metals are not considered herein). In a recent exhaustive monograph on metal–metal bonding, multiple examples of bonding between transition metals or even between lanthanide and transition metals are discussed, but not a single example of a lanthanide–lanthanide bond is mentioned.18 The reason for this is that lanthanides usually tend to give their valence electrons away to make compounds with largely ionic bonding. Thus, EMFs provide a unique possibility to stabilize the lanthanide–lanthanide bonds inside carbon cages, which are not available otherwise.
Whether the M–M bonding MO in a given di-EMF involves the HOMO or the LUMO depends on the relative energies of the cage frontier MO and the energy of the metal–metal bonding orbital. Fig. 1 shows how the M–M bonding MOs in Sc2@C82 and Lu2@C82 evolve from the molecular orbitals of Sc2 and Lu2 dimers, respectively. The ground state of the Sc2 dimer is a quintet (4s)σg2(3d)πu2(3d)σg1(4s)σu1, whereas Lu2 is a triplet (6s)σg2(6s)σu2(5d)πu2 (i.e., the high spin states result in a significant splitting of the spin-up and spin-down orbitals of the same type).19–22 The energy levels of the four highest-energy, singly-occupied MOs of both metal dimers are well above the energies of the LUMO and LUMO+1 of the empty C82-C3v(8) fullerene, and in the M2@C82-C3v(8) molecule these four electrons are transferred from the metal dimers to the fullerene cage. At the same time, the two remaining valence electrons, which occupy (4s)σg2 MO in Sc2 and (6s)σg2 MO in Lu2, remain intact in di-EMFs because the energy of the corresponding MO is below the energy of the LUMO+2 of the empty C82 fullerene. As a result, we have M2@C82 molecules with a 4-fold charged carbon cage and the M–M bonding HOMO resembling the (ns)σg2 MO of the corresponding metal dimer. Fig. 1 shows that the (4s)σg2 MO in Sc2 and the HOMO of Sc2@C82 have similar shapes. The dominant σ-character of the M–M bonds in di-EMFs can be illustrated by the bond ellipticity, which amounts to 0.022 in Sc2@C82-C3v(8), 0.042 in Y2@C82-C3v(8), and 0.050 in Lu2@C82-C3v(8).8 These values can be compared to the ideal σ-bond with zero ellipticity, or to C–C bonds in benzene and ethylene with ellipticities of 0.23 and 0.45, respectively.
 | ||
| Fig. 1 (a) DFT-computed molecular orbital levels of the metal dimers Sc2 and Lu2, dimetallofullerenes Sc2@C82 and Lu2@C82, and the empty fullerene C82; all fullerenes have the C3v(8) cage isomer. Occupied levels are shown as solid lines, whereas unoccupied ones as dashed lines. Electrons at the (ns)σg2 MOs in the M2 dimers and the corresponding M–M bonding orbital in the M2@C82 molecules are highlighted in magenta (M = Sc) and green (M = Lu). (b) (4s)σg2 MO in the Sc2 dimer. (c) The HOMO of the Sc2@C82 with a Sc–Sc bonding character. In (b) and (c), Sc atoms are magenta, carbons are light grey, and MO isosurfaces are shown in cyan and dark yellow. | ||
Thus, the HOMO energy in M2@C82 is largely determined by the energy of the (ns)σg2 orbital in the M2 dimer, which inversely correlates with the ns2(n − 1)d1 → ns1(n − 1)d2 excitation energy of the free metal atom: the higher the excitation energy, the lower the energy of the (ns)σg2 MO. For instance, in the row La–Sc(Y)–Lu, the ns2(n − 1)d1 → ns1(n − 1)d2 excitation energies increase from 0.33 eV in La to 1.43(1.36) eV in Sc(Y) to 2.34 eV in Lu. The (6s)σg2 MO in La2 has such a high energy that the vacant cage MOs are usually more stable and hence La adopts the true three-valent state in all known di-EMFs. The La–La bonding MO is then the LUMO. The opposite situation is found in the Lu-di-EMFs: the (6s)σg2 MO in Lu2 is so stabilized that Lu usually adopts a divalent state in Lu-di-EMFs, with the Lu–Lu MO being the HOMO or even lying below the HOMO level of the Lu2@C2n molecule. With an intermediate value of the excitation energy, Sc can be either +3 (as in Sc2@C66![[thin space (1/6-em)]](https://www.rsc.org/images/entities/char_2009.gif) 23) or +2 (as in Sc2@C829) depending on the fullerene cage. Similar behavior can be expected from Y and late lanthanides.
23) or +2 (as in Sc2@C829) depending on the fullerene cage. Similar behavior can be expected from Y and late lanthanides.
With the formal oxidation state of +2, metal atoms have sufficiently large atomic charges (Bader analysis gives +1.25 for Sc, +1.37 for Y, and +1.32 for Lu in respective M2@C82-C3v(8) molecules8), which lead to the large Coulomb repulsion between metal atoms. Evaluation of the “covalent” (exchange–correlation) and repulsion energies within the interacting-quantum-atom approach in ref. 8 showed that Coulomb repulsion energies in M2@C82-C3v(8) molecules are ca. 5 eV, which is opposed by the bonding energy of ca. 2 eV. Thus, the net M–M interaction in di-EMF with the M–M bond is still strongly repulsive (ca. 3 eV), and such bonds would immediately dissociate if it were not the rigid environment of the fullerene cage, which fixes the metal ions at the bonding distances.
This introduction describes the current theoretical understanding of the possible metal–metal bonding situation in fullerenes.8 Surprisingly little is known experimentally about these unique systems, and even the charge state of metal atoms in the M2@C82 molecules is a matter of debate.24–27 Meanwhile, if the M–M bonding orbital is indeed the HOMO of many dimetallofullerenes, it opens access to the manipulation of their spin state via redox chemistry. Creation of the single-electron bond between lanthanide ions having their own magnetic moment is an especially attractive goal. In this work, we report a detailed spectroscopic and electrochemical study of a series of M2@C82 di-EMFs in comparison to their clusterfullerene analogs that lack the M–M bonding MOs. To make this study possible, Er-sulfide clusterfullerenes, Er2S@C82 with Cs(6) and C3v(8) cage isomers, are synthesized for the first time; whereas for the dimetallofullerenes Sc2@C82 and Er2@C82, new non-chromatographic enrichment procedures have been developed to greatly simplify their isolation. Having the M–M bonding nature of the orbitals verified, we generate the cation radicals Sc2@C82+ and Er2@C82+ with single-electron metal–metal bonds and characterize their unprecedented spin states by EPR spectroscopy and SQUID magnetometry.
Results and discussion
Synthesis of EMFs
To understand the influence of the metal on the energy of the M–M bonding orbitals in di-EMFs, we studied a series of dimetallofullerenes with different metals (Sc, Er, Lu) and Er sulfide clusterfullerenes with the same fullerene cages. Lu dimetallofullerenes were synthesized as minor products in the synthesis of Lu nitride clusterfullerenes and Lu–Ti carbide clusterfullerenes in the Lu/Ti/melamine system as reported earlier.28 HPLC separation afforded two Lu2@C82 isomers. Likewise, small amounts of Er dimetallofullerenes and sulfide clusterfullerenes were isolated from an EMF mixture obtained by the arc-discharge synthesis of the Er metal and guanidine isocyanate. These synthetic conditions produce nitride clusterfullerenes Er3N@C2n as the dominant EMFs, accompanied by a number of minor EMFs that include two isomers of dimetallofullerenes Er2@C82 and two isomers of sulfide clusterfullerenes Er2S@C82. Details of the chromatographic isolation and mass-spectroscopic characterization are given in the ESI.†Non-chromatographic “catch and release” approach for Er2@C82
The HPLC separation of fullerene extract is often a tedious procedure that can easily require several weeks (see ref. 29 or the ESI† to this article for the separation of Er-EMFs using the conventional HPLC approach). Here we describe that a combination of non-chromatographic steps based on solubility and/or reactivity differences of EMFs can substantially simplify the isolation. The solubility of C60 and C70 empty-cage fullerenes has been known for several decades,30 but little literature exists for the solubility of stable, metal-encapsulated fullerenes. Zhou et al.31 used solubility differences between C60 and C70 and optimized the solvent temperature to develop a separation method for their purification.31 Solubility differences for closed shell C74 empty-cage fullerenes and Gd@C60 and Gd@C74 endohedrals were used in the isolation of small-band gap fullerenes and metallofullerenes.32 In contrast, there is a lack of reports on utilizing solubility differences for purifying closed shell, di-metal endohedral metallofullerenes. For Er2@C82, we report the benefit of using solubility differences to maximize its enrichment prior to HPLC fraction collection. We use the lower solubility of Er2@C82 in xylenes relative to that of the dominant fullerene contaminants, C60 and C70. These empty-cage fullerenes have a higher solubility in xylenes and are preferentially dissolved and removed by the sequential addition of minimal solvent amounts until only Er2@C82 isomers remain.The Er2@C82 and Sc2@C82 samples used in this study originated from our “green chemistry” approach.33 A by-product of our non-chromatographic purification SAFA (Stir and Filter Approach) method for Er3N@C80 and Sc3N@C80 is spent aminosilica, which used to be discarded. This waste silica contained amine-reactive fullerenes and metallofullerenes that became immobilized onto the aminosilica during the M3N@C80 purification process. Recovery of Er2@C82 and Sc2@C82 from the spent silica was reported by adding carbon disulfide33 to react with amine functionalized fullerenes to permit their release. As we describe herein, this “catch” of a fullerene with reactive silica and subsequent “release” of the fullerene can be developed into a non-chromatographic separation method.
The erbium metallofullerene extract was produced from the arc-synthesis method under a He/N234 atmosphere. Carbon disulfide extraction of the generated soot yielded a soluble extract containing >90% empty-cage fullerenes, with Er2@C82 and Er3N@C80 being the dominant endohedrals. Two grams of this soot extract was dissolved in 1.8 L of xylenes, soaked overnight and filtered. Upon addition of 250 mg of freshly vacuumed diaminosilica gel at 60 °C for 8 h, the slurry was stirred for 4 days, at which time the reaction mixture was filtered to yield a filtrate of isomerically pure Er3N@Ih-C80.33 Immediate washing of this spent silica with carbon disulfide and subsequent rotary evaporation provided 8 mg of dried, Er2@C82 enriched sample.33 HPLC analysis of this Er2@C82 enriched sample is shown in Fig. 2a.
 | ||
| Fig. 2 HPLC results for Er2@C82 samples obtained from the (a) first addition of xylenes to the dried sample of fullerenes recovered from spent aminosilica, (b) after three successive additions of xylenes to the residual insoluble material, (c) after six more successive additions of xylenes, (d) after a final HPLC pass for final purification, and (e) LDI mass spectrum of purified Er2@C82. HPLC conditions were 1.0 mL min−1 xylenes, BuckyPrep-M column, 360 nm UV detection and 250 μL injection. | ||
For this work, addition of 5 mL of the solvent was insufficient to dissolve the entirety of the 8 mg of dried sample. To the undissolved fullerenes, another 5 mL of xylenes was added, with aliquots of the fullerenes being transferred into solution for monitoring by HPLC. After three successive additions of xylenes, the soluble fullerenes are shown in Fig. 2b, in which a significant reduction of C60 and C70 is observed. Seeking further enrichment, this process of adding fresh xylenes to the undissolved fullerene sample was repeated six additional times to yield the chromatogram shown in Fig. 2c. Clearly the empty-cage contaminants have been removed. Being the dominant peak, purified Er2@C82 can easily be efficiently obtained with a quick, final HPLC pass (Fig. 2d). The LDI mass spectrum shown in Fig. 2e confirms highly purified Er2@C82 and matching experimental and theoretical isotope patterns.
Non-chromatographic “catch and release” approach for Sc2@C82
The isolation scheme for Sc2@C82 is also newly reported. The selective reaction of a mixture containing Sc2@C82 with MgCl2 yielded a significantly enriched sample of Sc2@C82. Further Sc2@C82 enrichment by the SAFA33,35–38 “catch and release” process provided a sample that contained primarily two species, Sc3C2@C80 and Sc2@C82. The scandium metallofullerene extract was also prepared and extracted in a similar manner to the erbium endohedrals.As a first stage, 1 L of CS2 was added to a flask containing 1.3 g of the Sc fullerene extract, soaked overnight, PTFE membrane filtered, and the solution was transferred to a 2 L round bottom flask. The LDI mass spectrum of this extract solution is shown in Fig. 3a. To this stirring solution was immediately added 2.1 g of freshly opened anhydrous MgCl2. The reaction proceeded for 30 h, at which time the reaction mixture was filtered. As previously described, fullerenes can be recovered from the precipitate via addition of multiple rinses with distilled water.38–44 Results from this work indicate three dominant fullerenes being recovered in decreasing order of the mass spectrum (Fig. 3b): Sc3C2@C80, Sc4C2@C80, and Sc2@C82.
 | ||
| Fig. 3 LDI mass spectra for scandium endohedral metallofullerenes (a) in soot extract, (b) decomplexed with H2O after precipitation with MgCl2, (c) released from spent aminosilica with CS2, and (d) unreactive Sc4C2@C80 to aminosilica after 20 h of Sc2@C82 uptake. | ||
Stage two for isolating Sc2@C82 was the “catch and release” of Sc2@C82 from aminosilica. The 8 mg of the Sc2@C82-containing sample obtained after MgCl2 treatment was dissolved in 100 mL of freshly opened xylenes since a wet solvent and/or wet aminosilica affects the SAFA process.37 To this stirring solution was added 5 g of diaminosilica gel, which was freshly vacuum-oven dried overnight at 60 °C. After 20 hours, the slurry was poured into a Buchner funnel. To the spent diaminosilica, still wet with xylenes, was added 600 mL of carbon disulfide to release the endohedrals as shown in Fig. 2c. The released sample contained a mixture of Sc2@C82 and Sc3C2@C80, which was then separated by HPLC giving pure Sc2@C82 (Fig. S6†). Containing the endohedral fullerenes the most inert to diaminosilica, the filtrate shows the chemical based isolation of Sc4C2@C80 (Fig. 2d). This is a significant achievement as a non-chromatographic separation method for isolating the interesting Sc4C2@C8045–48 has not yet been reported.
Molecular structures of EMFs
Molecular structures of two Er2@C82 isomers with Cs(6) and C3v(8) carbon cages were elucidated earlier by single crystal X-ray diffraction.49,50 The molecular structure of the other EMFs can be established by vis-NIR absorption spectroscopy. Absorption spectra of EMFs are dominated by the π–π* transitions in the fullerene-based π-system and hence are very sensitive to the isomeric structure and the formal charge of the fullerene cage. Fig. 4 compares the spectra of the set of EMFs studied in this work; additional spectra are shown in the ESI (Fig. S11†). Despite the different composition of the endohedral species, all spectra can be classified into two groups with very similar spectra as shown in Fig. 4. Fig. 4a shows the spectra of the isomer with a shorter retention time, identified by its absorption pattern as C82-Cs(6); these spectra are also very similar to the spectra of Sc2C2@C82-Cs(6),51 Sc2S@C82-Cs(6),52 and Y2C2@C82-Cs(6).53Fig. 4b shows the spectra of the isomer with a longer retention time, identified as C82-C3v(8); very similar spectra were also reported for Sc2S@C82-C3v(8),52,54 or carbide clusterfullerenes M2C2@C82-C3v(8) (M = Sc, Y, Er).26,53,55 Thus, absorption spectra allow unambiguous assignment of the isolated compounds to dimetallofullerenes or sulfide clusterfullerenes with Cs(6) and C3v(8) cage isomers with the 4-fold charged fullerene. We will omit the (6) and (8) cage numbers in our further discussion and use only Cs and C3v notations to denote the isomers. The C824− state is natural for Er2S@C82 when taking into account the formal 3+ charge of the erbium ion and the 2− charge of the sulfide ion. For the M2@C82 molecules, the 4-fold charge of the cage indicates that the metal atoms have to be assigned a formal charge of 2+, which agrees with the MO description depicted in Fig. 1 and implies the presence of the covalent M–M bond. | ||
| Fig. 4 Vis-NIR absorption spectra of EMFs: (a) isomers with a shorter retention time, assigned as C82-Cs(6) and (b) isomers with a longer retention time, assigned as C82-C3v(8). For Er2@C82-C3v(8), the molar extinction coefficients at 379 nm, 477 nm, and 899 nm are determined to be 23.4 × 10³, 7.2 × 10³, and 2.7 × 10³, respectively. | ||
13C NMR spectroscopy
Further confirmation of the molecular structure of Lu2@C82-C3v is provided by 13C NMR spectroscopy. The C82-C3v(8) fullerene is expected to have 17 13C NMR signals with an 11 × 6, 5 × 3, and 1 × 1 intensity pattern. In the experimental spectrum of Lu2@C82-C3v (Fig. 5a) we could identify all 6-fold and 3-fold intensity peaks, whereas the low-intensity peak due to the single carbon on the C3 axis cannot be identified with the available signal-to-noise ratio. Similar but not identical 13C NMR spectral patterns were reported for Y2@C82-C3v9 and Sc2@C82-C3v.53 The range of the 13C shifts tends to decrease with the increase of the metal size. Together with the results of UV-vis-NIR spectroscopy, these data prove that Lu2@C82 is a genuine dimetallofullerene and not the carbide clusterfullerene Lu2C2@C80.
 | ||
| Fig. 5 (a) 13C NMR spectrum of Lu2@C82-C3v(8) compared to the spectra of Sc2@C82-C3v(8) and Y2@C82-C3v(8) shown as vertical lines with the shifts taken from ref. 9 and 53 respectively; half-intensity peaks of Lu2@C82 are marked with dots. (b) 13C NMR spectra of Er2@C82-C3v(8) measured at 268 and 308 K, temperature shifts of the peaks are marked with grey lines. Asterisks denote the peaks assigned to impurities due to the lack of the temperature dependence; the strong peak at 131 ppm is due to the solvent (d4-o-dichlorobenzene). The shaded area denotes the range of the chemical shifts in diamagnetic M2@C82-C3v(8) molecules. (c) Pseudocontact chemical shifts computed for Er2@C82-C3v(8) and T = 300 K using eqn (2) and averaged over molecular dynamics trajectories. For the sake of comparison with experimental spectra, the zero point in (c) is positioned below the center of the range covering diamagnetic chemical shifts in M2@C82-C3v (M = Y, Lu). | ||
Paramagnetic 13C NMR has been successfully applied for a number of Ce-EMFs13,56–58 and lanthanide nitride clusterfullerenes,59–61 and in this work 13C NMR spectra have also been obtained for Er2@C82-C3v. Due to the paramagnetic influence of endohedral Er ions, 13C chemical shifts in Er2@C82-C3v span the range of several hundred ppm and exhibit a pronounced temperature dependence. 12 of the 17 peaks could be identified with a high degree of certainty after variable-temperature NMR measurements in d4-o-dichlorobenzene (Fig. 5b). Chemical shifts of paramagnetic molecules include two contributions, i.e., diamagnetic (δdia) and paramagnetic (δpara): δexp = δdia + δpara. The main contribution to the paramagnetic shifts in lanthanide-EMFs is the dipolar interactions of the lanthanide magnetic moment with carbon nuclear spins, also known as the pseudocontact shift δpc:
 | (1) |
jαα are components of the magnetic susceptibility tensor of the j-th lanthanide ion, whereas Rij, θij, and φij are polar coordinates of the i-th carbon atom in the coordinate system centered on the j-th lanthanide ion. In particular, Rij is the distance between them, and θij is an angle between the quantization axis z and the vector connecting the lanthanide ion and the i-th atom. In Er2@C82, the magnetic susceptibility tensor of both Er ions can be considered identical; the quantization axis is aligned along the Er–Er bond, and χjxx = χjyy (i.e. the ligand field is uniaxial). Then, eqn (1) is simplified to: | (2) |
Thus, interpretation of paramagnetic NMR spectra requires the knowledge of (i) the molecular structure and internal dynamics of the molecule and (ii) the magnetic anisotropy of the lanthanide ions. To address the first requirement, we performed DFT PBE/TZ2P calculations62,63 of the possible metal positions in the Y2@C82-C3v and Lu2@C82-C3v molecules, followed by Born–Oppenheimer molecular dynamics (BOMD) simulations for Y2@C82-C3v at 300 K using the CP2K code64,65 and PBE/DZVP level of theory. Y was used in simulations instead of Er to simplify the calculations. To obtain better statistics of the motion of metal atoms, three BOMD trajectories with different starting geometries were propagated for 75 ps. Fig. 6a shows the probability distribution of metal atoms inside the C82-C3v(8) cage obtained after joint analysis of all trajectories and taking the C3v symmetry of the cage into account. BOMD simulation shows that metal atoms rotate inside the cage, and high-probability metal positions form the belt around the equator of the molecule.
 | ||
| Fig. 6 (a) Probability distribution of metal atoms in Y2@C82-C3v at 300 K based on molecular dynamics simulations. The solid surface shows the high-probability regions (encompasses 60% of metal positions), transparent surface – lower probability (encompasses 98% of metal positions). (b) Pseudocontact chemical shift isosurfaces (at ±1500 ppm, solid surfaces, and +300 ppm, transparent surface) in Er2@C82-C3v for a fixed position of metal atoms. (c) Distribution of 13C pseudocontact chemical shifts in Er2@C82-C3v for a molecule with a rotating endohedral cluster. Color code: blue – negative values, red – positive; intensity of the color corresponds to the size of the shift. Visualization of the isosurfaces is done with the VMD package.69 | ||
The magnetic susceptibility tensor was computed using the PHI code,66 which employed crystal-field parameters obtained ab initio at the CASSCF/SO-RASSI level using the SINGLE_ANISO module67 implemented in MOLCAS 8.0.68 The magnetic anisotropy term in eqn (2) is negative, which is normal for Er ions tending to have an easy-plane magnetization. Fig. 6b shows the distribution of nuclear-independent chemical shifts in an Er2@C82-C3v molecule computed using eqn (2) for the low-energy conformer. The large negative lobe is directed toward nearby carbon atoms at the equator, whereas the positive lobes are affecting carbons above and below the equator region. When the rotational dynamics of metal atoms are taken into account, the distribution of chemical shifts shown in Fig. 6c is obtained. Large negative shifts are distributed over the whole equator, whereas positive values are concentrated on the poles of the fullerene cage. A comparison with the experimental spectra (Fig. 5b and c) shows that our computations are qualitatively correct as the computed chemical shifts span a similar range compared to experimental values, and pseudocontact shifts are equally distributed between positive and negative values. There are no very large shifts for any particular group of atoms, which proves that the internal dynamics of M2@C82-C3v is captured correctly. However, an exact peak-to-peak assignment is hardly possible at this moment. The model adopted for computations is probably oversimplified, and the anisotropy of the susceptibility tensor appears to be underestimated. We suggest that the susceptibility tensor is weakly changing during the rotational motion of metal atoms, which may be a source of errors.
Vibrational spectroscopy
EMFs are characterized by low-frequency metal-based modes and isomer-specific cage vibrational patterns. Fig. 7 compares the Raman spectra of Lu2@C82, Er2@C82, and Er2S@C82 with the C3v(8) cage. There is a pronounced similarity of the cage vibrations in the 200–1700 cm−1 frequency range, especially for dimetallofullerenes. A very close resemblance is also found for the IR spectra of Lu2@C82-C3v and Er2@C82-C3v (Fig. S12†), which serves as an additional proof of the same fullerene cage in both structures. The so-called “metal–cage stretching” vibrations of all three EMFs are found near 150 cm−1. The two peaks correspond to the in-phase and out-of-phase motions of metal atoms normal to the fullerene surface (Fig. 7b and c). In the spectrum of Lu2@C82-C3v, the frequencies of these two modes are somewhat lower (134/147 cm−1) than in Er2@C82-C3v (143/152 cm−1), which is mainly caused by a large atomic mass of Lu. Interestingly, very similar frequencies for these modes (144/155 cm−1) are also found for the sulfide cluster, i.e. the presence of the Er–S bonds has seemingly no effect on the frequencies. A more detailed analysis based on DFT calculations of vibrational spectra shows that in Er2S@C82-C3v, the out-of-phase motion occurs at a lower frequency than the in-phase motion of Er atoms; whereas in the dimetallofullerenes the in-phase vibration has a lower frequency (Fig. 7c). | ||
| Fig. 7 (a) Raman spectra of Lu2@C82-C3v, Er2@C82-C3v, and Er2S@C82-C3v measured at 78 K and excited with a 647 nm laser line of the Kr+ laser; note the change of the frequency scale at 310 cm−1. Black arrows denote the peaks corresponding to the “metal–cage stretching” vibrations; the strong peak at 672 cm−1 is an instrumental artifact. (b) and (c) show atomic displacement patterns and frequencies for such vibrations in Er2@C82-C3v (b) and Er2S@C82-C3v (c) (Er atoms are depicted in green, sulfur is yellow). | ||
Electrochemistry
The experimental confirmation of the metal–metal bonding in di-EMFs is not very straightforward. The variation of the redox potentials in the series of di-EMFs and comparison to the redox potentials of clusterfullerenes with the same fullerene cages may be a method to shed some light on the problem. Molecular orbital analysis (Fig. 1) implies that the HOMO of M2@C82-C3v molecules is the M–M bonding orbital. The same type of the HOMO is predicted for M2@C82-Cs. Therefore, at the first oxidation step, the electron should be removed from this orbital. Since the energy of the M–M bonding MO correlates with the ns2(n − 1)d1 → ns1(n − 1)d2 excitation energy of the metal atom, the oxidation potential in the M2@C82 compounds should be metal dependent (in both C3v and Cs cage isomers). In particular, Lu2@C82 with its low energy of the Lu–Lu bonding MO is expected to have higher oxidation potential than the M2@C82 molecules with other metals. On the other hand, the LUMO of M2@C82 is mainly localized on the fullerene cage, and hence the first reduction potential of M2@C82 should be a metal-independent property of the cage. Electrochemical studies of M2@C82-C3v and M2@C82-Cs di-EMFs described below fully agree with this reasoning.In the cathodic range, all M2@C82-C3v molecules behave similarly (Fig. 8a and Table 1). The first reduction near −1.15 V is metal independent and proceeds irreversibly (the re-oxidation peak is observed at −0.7 V). A double peak is observed at the second reduction step near −1.4/−1.5 V. For Lu2@C82-C3v, the third reversible reduction could also be observed at −1.77 V. The anodic behavior of M2@C82-C3v is quite different. The first oxidation step is fully reversible, demonstrating the reasonable chemical stability of the cation radicals. Importantly, the oxidation potentials exhibit a pronounced metal-dependence, as expected for the metal-based HOMO. The least positive potential, +0.02 V, is recorded for Sc2@C82-C3v (similar results were also reported for this molecule by Akasaka et al.9). Er2@C82-C3v is the next in the row with the oxidation potential of +0.13 V. The oxidation of Lu2@C82-C3v occurs at the much more positive potential of +0.50 V. Thus, whereas the first reduction potentials of the three M2@C82-C3v molecules are virtually identical, the first oxidation step spans the range from +0.02 to +0.50 V.
 | ||
| Fig. 8 Cyclic voltammetry of Lu2@C82, Er2@C82, and Er2S@C82 with C3v(8) (a) and Cs(6) (b) cage isomers. Scan rate 100 mV s−1, o-dichlorobenzene solution with the TBAPF6 electrolyte salt. Vertical dotted lines denote oxidation potentials of Lu2@C82 and Er2@C82. | ||
| EMF | Ox-II | Ox-I | Red-I | Red-II | Red-III | GapEC | Ref. |
|---|---|---|---|---|---|---|---|
| All values are measured by square-wave voltammetry in o-dichlorobenzene solution and are referenced versus Fe(Cp)2+/0 redox pair; “t.w.” denotes “this work”. | |||||||
| Er2@C82-Cs(6) | 0.65 | 0.02 | −1.01 | −1.31 | 1.03 | t.w. | |
| Lu2@C82-Cs(6) | 0.74 | 0.34 | −1.00 | −1.32 | −1.77 | 1.34 | t.w. |
| Er2S@C82-Cs(6) | 0.39 | −1.01 | −1.85 | −2.21 | 1.40 | t.w. | |
| Sc2C2@C82-Cs(6) | 0.64 | 0.42 | −0.93 | −1.30 | — | 1.35 | 51 |
| Sc2O@C82-Cs(6) | 0.72 | 0.35 | −0.96 | −1.28 | −1.74 | 1.31 | 73 |
| Sc2S@C82-Cs(6) | 0.65 | 0.39 | −0.98 | −1.12 | −1.73 | 1.37 | 73 |
| Sc2@C82-C3v(8) | 0.02 | −1.16 | −1.53 | −1.73 | 1.18 | t.w. | |
| ErSc@C82-C3v(8) | 0.08 | −1.11 | −1.49 | −1.72 | 1.19 | t.w. | |
| Er2@C82-C3v(8) | 0.13 | −1.14 | −1.41 | −1.83 | 1.27 | t.w. | |
| Lu2@C82-C3v(8) | 0.95 | 0.50 | −1.16 | −1.46 | −1.77 | 1.66 | t.w. |
| YLu@C82-C3v(8) | 0.23 | −1.13 | 1.36 | t.w. | |||
| Er2S@C82-C3v(8) | 0.88 | 0.51 | −0.98 | −1.21 | −1.70 | 1.49 | t.w. |
| Sc2C2@C82-C3v(8) | 0.93 | 0.47 | −0.94 | −1.15 | −1.60 | 1.41 | 74 |
| Sc2O@C82-C3v(8) | 1.09 | 0.54 | −1.17 | −1.44 | −1.55 | 1.71 | 75 |
| Sc2S@C82-C3v(8) | 0.96 | 0.52 | −1.04 | −1.19 | −1.63 | 1.56 | 73 |
The first reduction potentials of the M2@C82-Cs di-EMFs are −1.00 V (Lu) and −1.01 V (Er). Importantly, for this cage isomer, the process is reversible as well as the second reductions near −1.30 V (Fig. 8b). A reversible third reduction at −1.77 V is also observed for Lu2@C82-Cs. Thus, the M2@C82 isomers represent an interesting example of the isomer-dependent reversibility of the reduction. The irreversible reduction behavior of a majority of nitride clusterfullerenes was proved to be caused by the dimerization of their anion radicals.70,71 Presumably, EMFs with the C82-C3v(8) cage also dimerize in the anionic state, whereas the EMFs with the C82-Cs(6) cage do not. The cathodic behavior of M2@C82-Cs is similar to that of the M2@C82-C3v isomers. The first oxidation is reversible and shifts from +0.02 V in Er2@C82-Cs to +0.34 V in Lu2@C82-Cs.
The significant variation of oxidation potentials in the M2@C82-(C3v, Cs) series with the metal and simultaneous metal-independence of the reduction potentials strongly support the MO description in Fig. 1. Further confirmation comes from the comparison to the clusterfullerenes with the same cage isomers (under the term “clusterfullerenes” we understand the EMFs with non-metal atoms in the endohedral species). Here we use Er2S@C82 isomers isolated in this work as well as the literature data on Sc2S@C82, Sc2O@C82, and Sc2C2@C82 (Table 1). Fig. S13 in the ESI† compares the HOMO and LUMO of Sc-based clusterfullerenes with the C82-C3v cage to those of Sc2@C82-C3v. Unlike the metal-based HOMO of Sc2@C82-C3v, the HOMO of the clusterfullerenes is mainly localized on the fullerene. Therefore, their oxidation potentials are expected to be similar and give an upper bound for the di-EMFs. The LUMOs of the Sc2@C82-C3v, Sc2O@C82-C3v, and Sc2S@C82-C3v are predominantly localized on the fullerene cage, albeit with a small but noticeable metal contribution, whereas the LUMO of the Sc2C2@C82-C3v is localized on the carbide cluster. Thus, we can expect the reduction potentials of the di-EMFs and clusterfullerenes to be similar except for the Sc2C2@C82-C3v, which may have a more positive potential.
The experimental redox potentials listed in Table 1 are in line with the expectations based on the MO analysis. Er2S@C82-C3v and Sc-based clusterfullerenes with the C82-C3v cage all have their first oxidation near +0.5 V, and this potential may be considered as an intrinsic property of the C82-C3v fullerene cage. Note that the oxidation potential of Lu2@C82-C3v is quite close to this value. For Lu2@C82-C3v, DFT predicts that the metal-based HOMO and the next cage-based MO have similar energies. Thus, it is not possible to distinguish if the oxidation of Lu2@C82 proceeds via a cage- or metal-based MO, but for Sc2@C82 and Er2@C82, the metal-based oxidation is unquestionable.
Reduction potentials of Er2S@C82-C3v (−0.98 V), Sc2S@C82-C3v (−1.04 V), and Sc2C2@C82-C3v (−0.94 V) are somewhat more positive than those of M2@C82-C3v, whereas Sc2O@C82-C3v has the most negative first reduction potential at −1.17 V. The span of these values agrees with the metal contributions to the LUMOs, from negligible in Sc2O@C82-C3v to the dominant in Sc2C2@C82-C3v (Fig. S13†). Thus, we can postulate that −1.17 V is the intrinsic reduction potential of the C82-C3v cage in EMFs with the 4-fold charge cluster, and more positive values evidence for the certain contribution of the metal atoms to the LUMO. Reduction potentials of M2@C82-C3v at −(1.11–1.16) V indicate that metal atoms have a small contribution to the LUMO of these di-EMFs.
Very similar conclusions can be drawn from the redox potentials of EMFs with the C82-Cs cage isomer. The oxidation potentials of the clusterfullerenes at 0.35–0.42 V are slightly more positive than that of Lu2@C82-Cs (+0.34), which indicates that the latter is probably oxidized via its Lu–Lu bonding HOMO. The first reduction potentials of the clusterfullerenes are slightly more positive than those of the di-EMFs and show that the fullerene has the dominant contribution to the LUMO of all these molecules. We should note, however, that the EPR study of the anion-radical of Y2@C82-Cs(6) revealed a considerable 89Y hyperfine coupling constant of 34.3 G,72 which shows that the metal contribution to the LUMO is also substantial.
The metal dependence of the oxidation potential raises the question of how the HOMO energy will be affected in a mixed-metal system, especially when two metals with different electronic properties are combined in one molecule. To clarify this question, we isolated small amounts of YLu@C82-C3v and ErSc@C82-C3v from the fullerene mixtures obtained in the synthesis of Y–Lu and Er–Sc nitride clusterfullerenes (see ref. 76 for details and the ESI† for sample characterization). Unfortunately, we could not isolate Y2@C82-C3v; although the compound was present in the fullerene mixture according to mass-spectral analysis, its HPLC isolation was found impossible due to the low stability. DFT calculations show that the HOMO energy of the Y2@C82-C3v (−4.426 eV at the PBE/TZ2P level) is even higher than that of Sc2@C82-C3v (−4.676 eV), so for the former species, one can expect an oxidation potential near 0.0 V or more negative. Square-wave voltammetry shows that YLu@C82-C3v is oxidized at +0.23 V (Fig. 9), an intermediate value between the oxidation potential of Lu2@C82-C3v and expected potential of Y2@C82-C3v. Likewise, the HOMO energy of YLu@C82-C3v (−4.962 eV) is close to the mean value of the HOMO energies of Y2@C82-C3v (−4.426 eV) and Lu2@C82-C3v (−5.332 eV). Interestingly, the shape of the HOMO of YLu@C82-C3v has a pronounced asymmetry towards Lu (Fig. 9). Similarly, the oxidation potential of ErSc@C82-C3v at +0.08 V is found exactly between the potentials of Sc2@C82-C3v (+0.02 V) and Er2@C82-C3v (+0.13 V) (Fig. 9a).
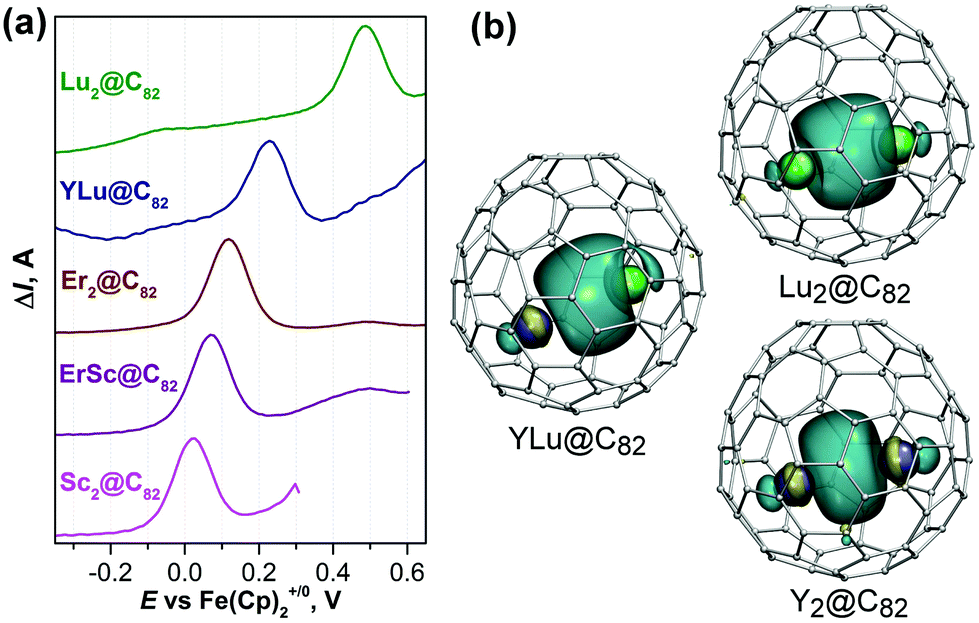 | ||
| Fig. 9 (a) Square wave voltammetry of Lu2@C82, YLu@C82, Er2@C82, ErSc@C82, and Sc2@C82, all with the C3v(8) cage, in the anodic range; (b) the HOMO isosurfaces in Lu2@C82-C3v, YLu@C82-C3v, and Y2@C82-C3v. | ||
EPR spectroscopy
Revealed in the electrochemical studies, the reversible oxidation of Sc2@C82 and Er2@C82 proves the stability of their cation radicals and opens the possibility for detailed studies of their properties. The oxidation of the M2@C82 molecule via removal of one electron from the M–M bonding MO leaves the cation radical with a large spin density localized on the metal atoms. When the metals are Sc, Y, or La, electron paramagnetic resonance (EPR) spectroscopy is especially convenient for the study of such radicals due to the rich hyperfine structure they may exhibit. The M–M bonding MO in di-EMFs inherits a large ns-contribution from the (ns)σg2 MO of the metal dimer, which leads to the large isotropic hyperfine coupling (hfc) constant. For instance, a huge a(139La) hfc constant in the anion radical of La2@C80-Ih as well as its paramagnetic derivatives prove the presence of the single-occupied La–La bonding MO in these species.14–16 Likewise, the EPR spectrum of Y2@C79N with its large a(89Y) constant of 81.2 G evidences the single-electron Y–Y bond in the azafullerene.77 The cation radical of Sc4O2@C80-Ih exhibits a rich hyperfine structure due to the two pairs of equivalent Sc atoms with substantially different hfc constants, 2 × 150.4 and 2 × 19.0 G.78 Particularly large a(45Sc) values are explained by the Sc–Sc bonding nature of the HOMO in Sc4O2@C80-Ih, which in fact resembles the HOMO of Sc2@C82-C3v from this work. Note that the oxidation potentials of Sc4O2@C80-Ih and Sc2@C82-C3v are also quite close, 0.00 and +0.02 V, respectively.The cation radical [Sc2@C82-C3v]+ was generated by a reaction of Sc2@C82-C3v with tris(4-bromophenyl)aminium hexachloroantimonate (also known as “magic blue”) in o-dichlorobenzene under the dry nitrogen atmosphere. The EPR spectrum measured at room temperature (Fig. 10) revealed a complex multi-line hyperfine structure spanning the range of 2800 G. Due to the large spectral width and relatively narrow line width of 1–3 G (requiring the use of a small modulation amplitude), acquisition of the spectrum took 2 days. After that, the intensity of the signal was found to decrease, presumably due to the degradation of the cation radical.
 | ||
| Fig. 10 (a) EPR of the [Sc2@C82-C3v]+ cation radical. Assignment of the peaks to |I,mI〉 states is shown in blue and red lines. Blue lines denote the states with I = |mI|, red lines show groups with identical mI values and I ≥ |mI| (an example of the assignment is shown for a series mI = 4 and I ≥ 4). (b) DFT-computed spin density distribution in [Sc2@C82-C3v]+. | ||
45Sc has the nuclear spin of 7/2, and the radical with two equivalent Sc atoms has a total nuclear spin of I = I1 + I2, which spans integer values from 0 to 7. In the first order of perturbation theory, positions of resonance lines in the EPR spectrum are dependent only on the projection of the total momentum, mI, and the Sc2 dimer is expected to have 15 resonances in the EPR spectrum corresponding to mI = 0, ±1,…,±7. However, the experimental spectrum of [Sc2@C82-C3v]+ is much more complex and has as many as 64 lines (Fig. 10). The reason is that for the large hfc constants, the resonance positions are also dependent on the total momentum I, which splits 15 mI-dependent lines into 64 lines with different |I,mI〉 values. Despite the seemingly very complex hyperfine pattern, positions of all peaks can be well reproduced with a single a(45Sc) constant of 2 × 199.2 G and a g-factor of 1.994 (see the ESI†). The a(45Sc) constant in [Sc2@C82-C3v]+ is the largest among all Sc-based EMF radicals and is one of the largest among all Sc-based radicals in general. The isotropic hfc constant can be used to estimate the contribution of s-atomic orbitals of Sc to the spin density (and hence to the Sc–Sc bonding orbital). A ScO radical with an a(45Sc) value of 630 G is known to be a pure Sc-4s1 system.79 Using this as a reference, the contribution of Sc atomic 4s-orbitals to the spin density in [Sc2@C82-C3v]+ is determined to be 32%, in reasonable agreement with the shape and orbital composition of the spin density calculated by DFT (Fig. 1). DFT calculations80,81 for the cation radical at the PBE/TZVP level also show that the position of the Sc2 unit has several minima with close energies, and the Sc2 dimer is probably rotating inside the cage. Average DFT-predicted a(45Sc) values for different conformers of [Sc2@C82-C3v]+ are in the range of 163–173 G, and g-factors are 1.9948–1.9949, in reasonable agreement with experimental data. The hybrid nature of the Sc–Sc bonding orbital reveals itself in the angular momentum composition of the spin density: the Mulliken population analysis gives 52/24/24% for the contributions of s/p/d atomic orbitals of Sc, respectively, whereas the analysis according to the Löwdin scheme gives 23/36/34% for the same orbitals. Thus, different approaches to population analysis give substantially different angular momentum compositions, but both methods agree that all three types of atomic orbitals have a comparably large contribution.
After lifting the degeneracy, the intensity of all 64 lines in the isotropic spectrum should be identical. The experimental data (Fig. 10) obviously deviate from this expectation as the peaks close to the center have an apparently higher intensity. The reason for this pattern is the variation of the line width across the spectrum from 1.1 G close to the center to 2.2/3.4 G on the high- and low-field wings, which is caused by the incomplete rotational averaging (tumbling). Kivelson et al. found a quadratic or even cubic dependence of the line width on mI in the fast-motional regime.82,83 Indeed, analysis of the line widths in the EPR spectrum of [Sc2@C82-C3v]+ reveals this quadratic dependence on mI for the resonances with the same total momentum. For the lines with the same mI values, a quadratic dependence is also found on I. We hypothesize that for such rare systems with very large hfc values, the line-width in the fast-motional regime depends quadratically on mI, and I and should also include a mixed term. Fig. S16 in the ESI† shows that after fitting experimental line widths to a quadratic function of mI and I, the experimental spectrum can be perfectly reproduced by a simulated one.
SQUID magnetometry
The cation radicals [Lu2@C82-C3v]+ and [Er2@C82-C3v]+ did not show measurable EPR spectra in solution at room temperature, presumably due to the strong lanthanide-induced broadening of the lines. In the absence of EPR evidence on the spin density localization in these cation radicals, we addressed the issue using SQUID magnetometry. Changing the two-fold occupied Er–Er bonding orbital in Er2@C82 to the single-occupied orbital in Er2@C82+ is expected to change the Er–Er exchange coupling and hence affect the magnetization behavior of the compound. For the magnetization studies, Er2@C82-C3v was oxidized by an excess of magic blue in o-dichlorobenzene. The solvent was evaporated, and the residue was washed with acetonitrile to remove the excess of magic blue and then with toluene to remove unreacted Er2@C82-C3v. The remaining [Er2@C82-C3v]+SbCl6− was then redissolved in o-dichlorobenzene and transferred to the SQUID capsule by drop-casting.Fig. 11 compares the normalized magnetization curves measured for the powder samples of pristine Er2@C82-C3v with the [Er2@C82-C3v]+ salt. The samples show a distinctly different magnetization behavior in magnetic fields below 2 T. The increase of the magnetization with the increase of the external magnetic field is much faster for the cation than for the neutral Er2@C82-C3v. Note that the magnetization curve of the magic blue measured at the same temperature follows the Brillouin function with the spin S = 1/2 and approaches the saturation value of the magnetization much slower than both EMF samples. Thus, the normalized magnetization curve for a mechanical mixture of magic blue and Er2@C82-C3v would be also reaching saturation slower than Er2@C82-C3v alone. Likewise, if oxidation would not affect the Er–Er interaction but only create an additional spin 1/2 localized on the carbon cage, the normalized magnetization curve of the [Er2@C82-C3v]+ cation would also be going below the curve of the pristine Er2@C82-C3v, similar to the mechanical mixture of Er2@C82-C3v and magic blue. These arguments clarify that the difference in the magnetization curves of Er2@C82-C3v and [Er2@C82-C3v]+ cannot be caused by an additional S = 1/2 center weakly interacting with the lanthanide spin system, but has to have a lanthanide-based nature.
 | ||
| Fig. 11 Magnetization curves of Er2S@C82-C3v, Er2@C82-C3v, [Er2@C82-C3v]+SbCl6−, and magic blue at T = 2 K. For each sample, the curve was normalized to the value measured at 7 T. The line shows Brillouin function with the spin S = 1/2 fitting the data points for magic blue. | ||
We can conclude that the oxidation of Er2@C82-C3v by magic blue strongly modifies the spin state of the endohedral Er2 unit, presumably creating a three-center [Er3+–e–Er3+] system with stronger exchange interactions. Thus, our magnetization measurements confirm that the single-electron oxidation of Er2@C82-C3v generates the cation with substantially modified Er–Er bonding, and can be interpreted in terms of the single-electron Er–Er bond. Interestingly, the magnetization curve of [Er2@C82-C3v]+ at 2 K closely follows that of the Er2S@C82-C3v (Fig. 11).
Ab initio calculations (see the ESI†) show that in both Er2@C82-C3v and Er2S@C82-C3v, the Er ions have an easy-plane single-ion anisotropy. The crystal field splitting in both systems is sufficient to ensure that the magnetization behavior at 2 K is determined solely by the ground-state properties. Therefore, the large difference between Er2@C82-C3v and Er2S@C82-C3v is caused by how magnetic moments of individual Er centers are coupled, and not by the single-ion properties. Non-collinear orientation of the magnetic axes in Er2S@C82-C3v should also play a certain role. The similarity of the magnetization behavior of [Er2@C82-C3v]+ and Er2S@C82-C3v in due turn indicates that the magnetic coupling between Er centers becomes comparable. A more detailed analysis of the magnetization data of Er2@C82-C3v and [Er2@C82-C3v]+ would be premature at this moment as it requires a better understanding of the crystal field splitting experienced by the Er ions in the neutral and cationic forms of Er2@C82-C3v as well as the modelling of the exchange interactions. Such measurements and calculations are currently underway in our group and will be reported in due time.
Conclusions
The unusual oxidation states of lanthanides have attracted considerable attention, and compounds with divalent states and 4fn5d1 electronic configurations have been reported for almost the entire lanthanide row.1–3 Compounds in which two lanthanide ions have an unusual oxidation state and form an intermetallic bond are synthesized so far only for dimetallofullerenes, such as the M2@C82 species studied in this work. For these molecules, two lanthanide ions in a formal divalent state form a lanthanide–lanthanide bond via a σ-bonding orbital of the spd-hybrid character. The metal–metal bonding MO is the HOMO in di-EMFs such as Er2@C82, and is prone to a one-electron oxidation with the formation of stable cation radicals with single-electron metal–metal bonding. Electrochemical studies of M2@C82 di-EMFs and a comparison to the redox behavior of clusterfullerenes having the same fullerene cages fully prove this point. The definitive proof of the metal-based oxidation of Sc2@C82-C3v is provided by EPR spectroscopy of the cation radical, which shows a giant isotropic 45Sc hyperfine coupling constant of 199.2 G. The unprecedented a(45Sc) value originates from the large contribution of 4s atomic orbitals of Sc to the Sc–Sc bonding MO in Sc2@C82-C3v, which transforms into a ca. 30% contribution of the 4s AOs to the spin density in the cation radical. For Er2@C82-C3v, the metal-based oxidation leads to the formation of a unique spin system, in which local magnetic moments of Er ions derived from 4f electrons are coupled to each other via a single unpaired spin delocalized between two ions. The oxidation of Er2@C82-C3v to [Er2@C82-C3v]+ hence results in strong changes in the magnetization behavior. Thus, our study shows that dimetallofullerenes with a metal–metal bonding orbital provide unique possibilities for creating unusual spin systems which may find their use in molecular magnetism, information storage and quantum computing.Acknowledgements
The authors acknowledge funding by the European Research Council (ERC) under the European Union's Horizon 2020 research and innovation programme (grant agreement no. 648295 “GraM3”) and the National Science Foundation under NSF RUI grant 1465173. Computational resources were provided by the Center for Information Services and High Performance Computing (ZIH) in TU Dresden. The authors thank Ulrike Nitzsche for technical assistance with computational resources in IFW Dresden, Sebastian Gaß for the help in magnetic measurements, and Runshuang Lu for help in the synthesis of Er-EMFs.References
- M. E. Fieser, M. R. MacDonald, B. T. Krull, J. E. Bates, J. W. Ziller, F. Furche and W. J. Evans, J. Am. Chem. Soc., 2015, 137, 369–382 CrossRef CAS PubMed.
- M. R. MacDonald, J. E. Bates, J. W. Ziller, F. Furche and W. J. Evans, J. Am. Chem. Soc., 2013, 135, 9857–9868 CrossRef CAS PubMed.
- K. R. Meihaus, M. E. Fieser, J. F. Corbey, W. J. Evans and J. R. Long, J. Am. Chem. Soc., 2015, 137, 9855–9860 CrossRef CAS PubMed.
- A. A. Popov, S. Yang and L. Dunsch, Chem. Rev., 2013, 113, 5989–6113 CrossRef CAS PubMed.
- X. Lu, L. Feng, T. Akasaka and S. Nagase, Chem. Soc. Rev., 2012, 41, 7723–7760 RSC.
- T. Wang and C. Wang, Acc. Chem. Res., 2014, 47, 450–458 CrossRef CAS PubMed.
- A. Rodriguez-Fortea, A. L. Balch and J. M. Poblet, Chem. Soc. Rev., 2011, 40, 3551–3563 RSC.
- A. A. Popov, S. M. Avdoshenko, A. M. Pendás and L. Dunsch, Chem. Commun., 2012, 48, 8031–8050 RSC.
- H. Kurihara, X. Lu, Y. Iiduka, N. Mizorogi, Z. Slanina, T. Tsuchiya, S. Nagase and T. Akasaka, Chem. Commun., 2012, 48, 1290–1292 RSC.
- T. Suzuki, Y. Maruyama, T. Kato, K. Kikuchi, Y. Nakao, Y. Achiba, K. Kobayashi and S. Nagase, Angew. Chem., Int. Ed. Engl., 1995, 34, 1094–1096 CrossRef CAS.
- X. Lu, H. Nikawa, T. Nakahodo, T. Tsuchiya, M. O. Ishitsuka, Y. Maeda, T. Akasaka, M. Toki, H. Sawa, Z. Slanina, N. Mizorogi and S. Nagase, J. Am. Chem. Soc., 2008, 130, 9129–9136 CrossRef CAS PubMed.
- B. P. Cao, T. Wakahara, T. Tsuchiya, M. Kondo, Y. Maeda, G. M. A. Rahman, T. Akasaka, K. Kobayashi, S. Nagase and K. Yamamoto, J. Am. Chem. Soc., 2004, 126, 9164–9165 CrossRef CAS PubMed.
- M. Yamada, N. Mizorogi, T. Tsuchiya, T. Akasaka and S. Nagase, Chem. – Eur. J., 2009, 15, 9486–9493 CrossRef CAS PubMed.
- T. Kato, J. Mol. Struct., 2007, 838, 84–88 CrossRef CAS.
- L. Bao, M. Chen, C. Pan, T. Yamaguchi, T. Kato, M. M. Olmstead, A. L. Balch, T. Akasaka and X. Lu, Angew. Chem., Int. Ed., 2016, 55, 4242–4246 CrossRef CAS PubMed.
- M. Yamada, H. Kurihara, M. Suzuki, M. Saito, Z. Slanina, F. Uhlik, T. Aizawa, T. Kato, M. M. Olmstead, A. L. Balch, Y. Maeda, S. Nagase, X. Lu and T. Akasaka, J. Am. Chem. Soc., 2015, 137, 232–238 CrossRef CAS PubMed.
- T. Yang, X. Zhao and E. Osawa, Chem. – Eur. J., 2011, 17, 10230–10234 CrossRef CAS PubMed.
- S. T. Liddle, Molecular Metal-Metal Bonds, Wiley-VCH Verlag GmbH & Co. KGaA, 2015 Search PubMed.
- A. Kalemos, I. G. Kaplan and A. Mavridis, J. Chem. Phys., 2010, 132, 024309–024307 CrossRef PubMed.
- C. Camacho, H. A. Witek and R. Cimiraglia, J. Chem. Phys., 2010, 132, 244306–244309 CrossRef PubMed.
- X. Cao and M. Dolg, Theor. Chem. Acc., 2002, 108, 143–149 CrossRef CAS.
- M. Dolg, H. Stoll and H. Preuss, J. Mol. Struct. (THEOCHEM), 1992, 277, 239–249 CrossRef.
- M. Yamada, H. Kurihara, M. Suzuki, J. D. Guo, M. Waelchli, M. M. Olmstead, A. L. Balch, S. Nagase, Y. Maeda, T. Hasegawa, X. Lu and T. Akasaka, J. Am. Chem. Soc., 2014, 136, 7611–7614 CrossRef CAS PubMed.
- T. Miyazaki, R. Sumii, H. Umemoto, H. Okimoto, Y. Ito, T. Sugai, H. Shinohara, T. Zaima, H. Yagi and S. Hino, Chem. Phys., 2012, 397, 87–91 CrossRef CAS.
- H. Okimoto, R. Kitaura, T. Nakamura, Y. Ito, Y. Kitamura, T. Akachi, D. Ogawa, N. Imazu, Y. Kato, Y. Asada, T. Sugai, H. Osawa, T. Matsushita, T. Muro and H. Shinohara, J. Phys. Chem. C, 2008, 112, 6103–6109 CAS.
- Y. Ito, T. Okazaki, S. Okubo, M. Akachi, Y. Ohno, T. Mizutani, T. Nakamura, R. Kitaura, T. Sugai and H. Shinohara, ACS Nano, 2007, 1, 456–462 CrossRef CAS PubMed.
- J. Wang and S. Irle, ECS Meeting Abstracts, 2011, 1101, 1782 Search PubMed.
- A. L. Svitova, K. Ghiassi, C. Schlesier, K. Junghans, Y. Zhang, M. Olmstead, A. Balch, L. Dunsch and A. A. Popov, Nat. Commun., 2014, 5, 3568, DOI:3510.1038/ncomms4568.
- N. Tagmatarchis, E. Aslanis, K. Prassides and H. Shinohara, Chem. Mater., 2001, 13, 2374–2379 CrossRef CAS.
- R. S. Ruoff, D. S. Tse, R. Malhotra and D. C. Lorents, J. Phys. Chem., 1993, 97, 3379–3383 CrossRef CAS.
- X. H. Zhou, Z. N. Gu, Y. Q. Wu, Y. L. Sun, Z. X. Jin, Y. Xiong, B. Y. Sun, Y. Wu, H. Fu and J. Z. Wang, Carbon, 1994, 32, 935–937 CrossRef CAS.
- M. D. Diener and J. M. Alford, Nature, 1998, 393, 668–671 CrossRef CAS.
- S. Stevenson, K. A. Rottinger and J. S. Field, Dalton Trans., 2014, 43, 7435–7441 RSC.
- S. Stevenson, G. Rice, T. Glass, K. Harich, F. Cromer, M. R. Jordan, J. Craft, E. Hadju, R. Bible, M. M. Olmstead, K. Maitra, A. J. Fisher, A. L. Balch and H. C. Dorn, Nature, 1999, 401, 55–57 CrossRef CAS.
- S. Stevenson, K. Harich, H. Yu, R. R. Stephen, D. Heaps, C. Coumbe and J. P. Phillips, J. Am. Chem. Soc., 2006, 128, 8829–8835 CrossRef CAS PubMed.
- S. Stevenson, M. A. Mackey, C. E. Coumbe, J. P. Phillips, B. Elliott and L. Echegoyen, J. Am. Chem. Soc., 2007, 129, 6072–6073 CrossRef CAS PubMed.
- S. Stevenson, C. B. Rose, A. A. Robson, D. T. Heaps and J. P. Buchanan, Fullerenes, Nanotubes, Carbon Nanostruct., 2014, 22, 182–189 CrossRef CAS.
- S. Stevenson, H. R. Thompson, K. D. Arvola, K. B. Ghiassi, M. M. Olmstead and A. L. Balch, Chem. – Eur. J., 2015, 21, 10362–10368 CrossRef CAS PubMed.
- S. Stevenson, M. A. Mackey, J. E. Pickens, M. A. Stuart, B. S. Confait and J. P. Phillips, Inorg. Chem., 2009, 48, 11685–11690 CrossRef CAS PubMed.
- S. Stevenson and K. A. Rottinger, Inorg. Chem., 2013, 52, 9606–9612 CrossRef CAS PubMed.
- S. Stevenson, K. A. Rottinger, M. Fahim, J. S. Field, B. R. Martin and K. D. Arvola, Inorg. Chem., 2014, 53, 12939–12946 CrossRef CAS PubMed.
- K. Akiyama, T. Hamano, Y. Nakanishi, E. Takeuchi, S. Noda, Z. Wang, S. Kubuki and H. Shinohara, J. Am. Chem. Soc., 2012, 134, 9762–9767 CrossRef CAS PubMed.
- Z. Wang, Y. Nakanishi, S. Noda, K. Akiyama and H. Shinohara, J. Phys. Chem. C, 2012, 116, 25563–25567 CAS.
- I. Bucsi, R. Aniszfeld, T. Shamma, G. K. S. Prakash and G. A. Olah, Proc. Natl. Acad. Sci. U. S. A., 1994, 91, 9019–9021 CrossRef CAS.
- K. Tan, X. Lu and C.-R. Wang, J. Phys. Chem. B, 2006, 110, 11098–11102 CrossRef CAS PubMed.
- T.-S. Wang, N. Chen, J.-F. Xiang, B. Li, J.-Y. Wu, W. Xu, L. Jiang, K. Tan, C.-Y. Shu, X. Lu and C.-R. Wang, J. Am. Chem. Soc., 2009, 131, 16646–16647 CrossRef CAS PubMed.
- C. B. Kah, J. Nathaniel, K. Suggs and X.-Q. Wang, J. Phys. Chem. C, 2010, 114, 13017–13019 CAS.
- Y. Feng, T. Wang, J. Wu, Z. Zhang, L. Jiang, H. Han and C. Wang, Chem. Commun., 2014, 50, 12166–12168 RSC.
- M. M. Olmstead, H. M. Lee, S. Stevenson, H. C. Dorn and A. L. Balch, Chem. Commun., 2002, 2688–2689 RSC.
- M. M. Olmstead, A. de Bettencourt-Dias, S. Stevenson, H. C. Dorn and A. L. Balch, J. Am. Chem. Soc., 2002, 124, 4172–4173 CrossRef CAS PubMed.
- X. Lu, K. Nakajima, Y. Iiduka, H. Nikawa, N. Mizorogi, Z. Slanina, T. Tsuchiya, S. Nagase and T. Akasaka, J. Am. Chem. Soc., 2011, 133, 19553–19558 CrossRef CAS PubMed.
- N. Chen, M. N. Chaur, C. Moore, J. R. Pinzon, R. Valencia, A. Rodriguez-Fortea, J. M. Poblet and L. Echegoyen, Chem. Commun., 2010, 46, 4818–4820 RSC.
- T. Inoue, T. Tomiyama, T. Sugai, T. Okazaki, T. Suematsu, N. Fujii, H. Utsumi, K. Nojima and H. Shinohara, J. Phys. Chem. B, 2004, 108, 7573–7579 CrossRef CAS.
- L. Dunsch, S. Yang, L. Zhang, A. Svitova, S. Oswald and A. A. Popov, J. Am. Chem. Soc., 2010, 132, 5413–5421 CrossRef CAS PubMed.
- Y. Iiduka, T. Wakahara, K. Nakajima, T. Tsuchiya, T. Nakahodo, Y. Maeda, T. Akasaka, N. Mizorogi and S. Nagase, Chem. Commun., 2006, 2057–2059 RSC.
- Y. Takano, R. Tashita, M. Suzuki, S. Nagase, H. Imahori and T. Akasaka, J. Am. Chem. Soc., 2016, 138, 8000–8006 CrossRef CAS PubMed.
- M. Yamada, T. Wakahara, T. Tsuchiya, Y. Maeda, T. Akasaka, N. Mizorogi and S. Nagase, J. Phys. Chem. A, 2008, 112, 7627–7631 CrossRef CAS PubMed.
- M. Yamada, T. Wakahara, Y. Lian, T. Tsuchiya, T. Akasaka, M. Waelchli, N. Mizorogi, S. Nagase and K. M. Kadish, J. Am. Chem. Soc., 2006, 128, 1400–1401 CrossRef CAS PubMed.
- Y. Zhang, D. Krylov, M. Rosenkranz, S. Schiemenz and A. A. Popov, Chem. Sci., 2015, 6, 2328–2341 RSC.
- Y. Zhang, D. Krylov, S. Schiemenz, M. Rosenkranz, R. Westerstrom, J. Dreiser, T. Greber, B. Buchner and A. A. Popov, Nanoscale, 2014, 6, 11431–11438 RSC.
- Y. Zhang, S. Schiemenz, A. A. Popov and L. Dunsch, J. Phys. Chem. Lett., 2013, 4, 2404–2409 CrossRef CAS.
- D. N. Laikov and Y. A. Ustynuk, Russ. Chem. Bull., 2005, 54, 820–826 CrossRef CAS.
- J. P. Perdew, K. Burke and M. Ernzerhof, Phys. Rev. Lett., 1996, 77, 3865–3868 CrossRef CAS PubMed.
- J. VandeVondele, M. Krack, F. Mohamed, M. Parrinello, T. Chassaing and J. Hutter, Comput. Phys. Commun., 2005, 167, 103–128 CrossRef CAS.
- J. Hutter, M. Iannuzzi, F. Schiffmann and J. VandeVondele, WIREs Comput. Mol. Sci., 2014, 4, 15–25 CrossRef CAS.
- N. F. Chilton, R. P. Anderson, L. D. Turner, A. Soncini and K. S. Murray, J. Comput. Chem., 2013, 34, 1164–1175 CrossRef CAS PubMed.
- L. F. Chibotaru and L. Ungur, J. Chem. Phys., 2012, 137, 064112 CrossRef CAS PubMed.
- F. Aquilante, J. Autschbach, R. K. Carlson, L. F. Chibotaru, M. G. Delcey, L. De Vico, I. F. Galván, N. Ferré, L. M. Frutos, L. Gagliardi, M. Garavelli, A. Giussani, C. E. Hoyer, G. Li Manni, H. Lischka, D. Ma, P. Å. Malmqvist, T. Müller, A. Nenov, M. Olivucci, T. B. Pedersen, D. Peng, F. Plasser, B. Pritchard, M. Reiher, I. Rivalta, I. Schapiro, J. Segarra-Martí, M. Stenrup, D. G. Truhlar, L. Ungur, A. Valentini, S. Vancoillie, V. Veryazov, V. P. Vysotskiy, O. Weingart, F. Zapata and R. Lindh, J. Comput. Chem., 2016, 37, 506–541 CrossRef CAS PubMed.
- W. Humphrey, A. Dalke and K. Schulten, J. Mol. Graphics, 1996, 14, 33–38 CrossRef CAS PubMed.
- A. A. Popov, S. M. Avdoshenko, G. Cuniberti and L. Dunsch, J. Phys. Chem. Lett., 2011, 1592–1600 CrossRef CAS.
- D. V. Konarev, L. V. Zorina, S. S. Khasanov, A. A. Popov, A. Otsuka, H. Yamochi, G. Saito and R. N. Lyubovskaya, Chem. Commun., 2016, 52, 10763–10766 RSC.
- Y. Ma, T. Wang, J. Wu, Y. Feng, H. Li, L. Jiang, C. Shu and C. Wang, J. Phys. Chem. Lett., 2013, 4, 464–467 CrossRef CAS PubMed.
- B. Q. Mercado, N. Chen, A. Rodriguez-Fortea, M. A. Mackey, S. Stevenson, L. Echegoyen, J. M. Poblet, M. M. Olmstead and A. L. Balch, J. Am. Chem. Soc., 2011, 133, 6752–6760 CrossRef CAS PubMed.
- Y. Iiduka, T. Wakahara, K. Nakajima, T. Nakahodo, T. Tsuchiya, Y. Maeda, T. Akasaka, K. Yoza, M. T. H. Liu, N. Mizorogi and S. Nagase, Angew. Chem., Int. Ed., 2007, 46, 5562–5564 CrossRef CAS PubMed.
- Q. Tang, L. Abella, Y. Hao, X. Li, Y. Wan, A. Rodríguez-Fortea, J. M. Poblet, L. Feng and N. Chen, Inorg. Chem., 2016, 55, 1926–1933 CrossRef CAS PubMed.
- S. Yang, A. A. Popov and L. Dunsch, Angew. Chem., Int. Ed., 2008, 47, 8196–8200 CrossRef CAS PubMed.
- T. Zuo, L. Xu, C. M. Beavers, M. M. Olmstead, W. Fu, T. D. Crawford, A. L. Balch and H. C. Dorn, J. Am. Chem. Soc., 2008, 130, 12992–12997 CrossRef CAS PubMed.
- A. A. Popov, N. Chen, J. R. Pinzón, S. Stevenson, L. A. Echegoyen and L. Dunsch, J. Am. Chem. Soc., 2012, 134, 19607–19618 CrossRef CAS PubMed.
- W. Weltner, D. McLeod and P. H. Kasai, J. Chem. Phys., 1967, 46, 3172–3184 CrossRef CAS.
- F. Neese, WIREs Comput. Mol. Sci., 2012, 2, 73–78 CrossRef CAS.
- F. Neese, J. Chem. Phys., 2005, 122, 034107 CrossRef PubMed.
- D. Kivelson, J. Chem. Phys., 1960, 33, 1094–1106 CrossRef CAS.
- P. H. Rieger, Electron Spin Resonance. Analysis and Interpretation, The Royal Society of Chemistry, Cambridge, 2007 Search PubMed.
Footnote |
| † Electronic supplementary information (ESI) available. See DOI: 10.1039/c7nr02288c |
| This journal is © The Royal Society of Chemistry 2017 |