
 Open Access Article
 This Open Access Article is licensed under a
 Creative Commons Attribution 3.0 Unported Licence
Cooperative and non-cooperative sensitization upconversion in lanthanide-doped LiYbF4 nanoparticles†
Qilin
Zou
ab,
Ping
Huang
a,
Wei
Zheng
 *ab,
Wenwu
You
a,
Renfu
Li
a,
Datao
Tu
ab,
Jin
Xu
a and
Xueyuan
Chen
*ab
*ab,
Wenwu
You
a,
Renfu
Li
a,
Datao
Tu
ab,
Jin
Xu
a and
Xueyuan
Chen
*ab
aCAS Key Laboratory of Design and Assembly of Functional Nanostructures, and State Key Laboratory of Structural Chemistry, Fujian Institute of Research on the Structure of Matter, Chinese Academy of Sciences, Fuzhou, Fujian 350002, China. E-mail: xchen@fjirsm.ac.cn; zhengwei@fjirsm.ac.cn; Fax: +86 591 63179421; Tel: +86 591 63179421
bCollege of Materials Science and Engineering, Fujian Normal University, Fuzhou, Fujian 350007, China
First published on 11th April 2017
Abstract
Lanthanide (Ln3+)-doped upconversion nanoparticles (UCNPs) have attracted tremendous interest owing to their potential bioapplications. However, the intrinsic photophysics responsible for upconversion (UC) especially the cooperative sensitization UC (CSU) in colloidal Ln3+-doped UCNPs has remained untouched so far. Herein, we report a unique strategy for the synthesis of high-quality LiYbF4:Ln3+ core-only and core/shell UCNPs with tunable particle sizes and shell thicknesses. Energy transfer UC from Er3+, Ho3+ and Tm3+ and CSU from Tb3+ were comprehensively surveyed under 980 nm excitation. Through surface passivation, we achieved efficient non-cooperative sensitization UC with absolute UC quantum yields (QYs) of 3.36%, 0.69% and 0.81% for Er3+, Ho3+ and Tm3+, respectively. Particularly, we for the first time quantitatively determined the CSU efficiency for Tb3+ with an absolute QY of 0.0085% under excitation at a power density of 70 W cm−2. By means of temperature-dependent steady-state and transient UC spectroscopy, we unraveled the dominant mechanisms of phonon-assisted cooperative energy transfer (T > 100 K) and sequential dimer ground-state absorption/excited-state absorption (T < 100 K) for the CSU process in LiYbF4:Tb3+ UCNPs.
1. Introduction
Lanthanide-doped upconversion nanoparticles (UCNPs) that are able to convert two or more low-energy pump photons into one high-energy output photon have recently attracted tremendous interest in the fields of biomedicine and nanomedicine because of their superior physicochemical features and unique optical properties.1–9 Yb3+, owing to its large absorption cross-section at ∼980 nm, is usually selected as a sensitizer in lanthanide (Ln3+)-doped UCNPs, which can effectively absorb near-infrared (NIR) photons and transfer the excitation energy to nearby activators to yield efficient upconversion (UC) luminescence.10–13 For Ln3+ activators with stepwise long-lived intermediate energy levels matching those of Yb3+, such as Er3+, Ho3+ and Tm3+, resonant or phonon-assisted energy transfer (ET) UC (ETU) occurs easily.14–17 While for those Ln3+ ions without metastable levels as the energy storage reservoir, such as Tb3+ and Eu3+, cooperative sensitization UC (CSU) takes place.18–22 In a typical CSU process, the excitation energy of two adjacent Yb3+ is simultaneously transferred to Tb3+ or Eu3+.19 CSU luminescence from activators such as Tb3+ or Eu3+ is less influenced by the deleterious surface quenching effect than ETU luminescence from Er3+ or Tm3+, due to the large energy gap between the emitting levels and their next low-lying levels of Tb3+ or Eu3+, thereby demonstrating unique advantages and promises for applications in UC-FRET biodetection and bioimaging.23–27 Thanks to the pioneering work reported by H. U. Güdel and others in theoretical and experimental studies on CSU,28–31 much of the spectroscopy and mechanism for the CSU process in bulk materials are well understood. However, in the case of colloidal Ln3+-doped UCNPs, their mechanism has remained unexplored so far.LiYbF4, due to its low phonon energy (∼460 cm−1) and high chemical stability, has been regarded as an efficient host material for UC luminescence (UCL).32,33 Meanwhile, the sensitizer Yb3+ ions as a constituent of the host can not only maximize the absorption but also facilitate energy migration among Yb3+ sub-lattices, which may promote ET processes between Yb3+ and the activators, thus resulting in distinct UCL characteristics and improved UCL efficiency compared to their low-concentration Yb3+-doped counterparts.34–36 However, due to the stringent synthetic conditions and the surface quenching effect, currently it remains difficult for the synthesis of high-quality LiYbF4:Ln3+ UCNPs with controlled particle size and efficient UCL.
Herein, we report a unique strategy for the synthesis of monodisperse LiYbF4:Ln3+ core-only and core/shell UCNPs with controlled particle sizes and shell thicknesses through a modified high-temperature co-precipitation method. Trioctylamine (TOA) instead of 1-octadecene (ODE), that is commonly used in the synthesis of other Ln3+-doped UCNPs, is utilized as a solvent to provide an elevated reaction temperature for the crystallization and ripening of the UCNPs,37,38 in view of its higher boiling temperature (365.8 °C) than ODE (314.2 °C) (Table S1†). The resulting core/shell UCNPs yield remarkably enhanced UCL. ETU from Er3+, Ho3+ and Tm3+ and CSU from Tb3+ are systematically surveyed by room-temperature (RT) spectroscopic characterization. Furthermore, by means of low-temperature (10 K) high-resolution steady-state and transient UC spectroscopy, we unravel the excited-state dynamics involved in the CSU process in LiYbF4:Tb3+ UCNPs.
2. Experimental
2.1. Chemicals and materials
CH3COOLi·2H2O, NH4F, cyclohexane, methanol, and ethanol were purchased from Sinopharm Chemical Reagent Co., China. Oleic acid (OA) and TOA were purchased from Alfa Aesar (China). Yb(CH3COO)3·4H2O (99.999%), Er(CH3COO)3·4H2O (99.99%), Tm(CH3COO)3·4H2O (99.99%), Ho(CH3COO)3·4H2O (99.99%), Tb(CH3COO)3·4H2O (99.99%) and Y(CH3COO)3·4H2O (99.99%) were purchased from Sigma-Aldrich (China). All chemicals were used as received without further purification.2.2. Synthesis of LiYbF4:Ln3+ core-only UCNPs
The LiYbF4:Ln3+ (Ln = Er, Tm, Ho, or Tb) core-only UCNPs were synthesized via a high-temperature co-precipitation method. In a typical synthesis of LiYbF4:30%Tb UCNPs, 1 mmol of CH3COOLi·2H2O, 0.7 mmol of Yb(CH3COO)3·4H2O and 0.3 mmol of Tb(CH3COO)3·4H2O were mixed with 8 mL of OA and 12 mL of TOA in a 100 mL three-necked round-bottom flask. The resulting mixture was heated to 160 °C under a N2 flow with constant stirring for 30 min to form a clear solution, and then cooled down to RT. Thereafter, 10 mL of methanol solution containing 4 mmol of NH4F was added and the solution was stirred at 60 °C for 30 min to remove methanol. After methanol was evaporated, the resulting solution was heated to 320 °C under a N2 flow with vigorous stirring for 60 min, and then cooled down to RT. The obtained UCNPs were precipitated by addition of 30 mL of ethanol, collected by centrifugation, washed with ethanol several times, and finally re-dispersed in cyclohexane. To control the size and morphology of the UCNPs, the mixed solution was allowed to react at different temperatures (e.g., 300 °C and 310 °C) and for different times (e.g., from 20 min to 120 min).2.3. Synthesis of LiYbF4:Ln3+@LiYF4 core/shell UCNPs
Briefly, 0.5 mmol of CH3COOLi·2H2O and 0.5 mmol of Y(CH3COO)3·4H2O were added to a 100 mL three-necked round-bottom flask containing 8 mL of OA and 12 mL of TOA. The mixed solution was then heated to 160 °C under a N2 flow with constant stirring for 30 min to form a clear solution. After cooling down to 80 °C, 0.5 mmol of LiYbF4:Ln3+ core-only UCNPs in 10 mL of cyclohexane was added and maintained at 80 °C for 30 min to remove cyclohexane. After the removal of cyclohexane, 10 mL of methanol solution containing 2 mmol of NH4F was added and stirred at 60 °C for another 30 min to remove methanol. After methanol was evaporated, the solution was heated to 320 °C under a N2 flow with vigorous stirring for 60 min, and then cooled down to RT. The resulting core/shell UCNPs were precipitated by addition of 30 mL of ethanol, collected by centrifugation, washed with ethanol several times, and finally re-dispersed in cyclohexane. To control the shell thickness, different amounts of the shell precursors were weighed for the synthesis.2.4. Characterization
Powder X-ray diffraction (XRD) patterns of the samples were collected with an X-ray diffractometer (MiniFlex2, Rigaku) with Cu Kα1 radiation (λ = 0.154187 nm). Both the low- and high-resolution transmission electron microscopy (TEM) measurements were performed by using a TECNAI G2 F20 TEM equipped with the energy dispersive X-ray spectrum (EDS). Downshifting luminescence (DSL) emission and excitation spectra and the corresponding photoluminescence (PL) lifetimes were recorded on a spectrometer (FLS980, Edinburgh) equipped with both continuous xenon (450 W) and pulsed flash lamps. UCL emission spectra were acquired under 980 nm excitation with a continuous-wave semiconductor NIR laser diode (2 W). UCL lifetimes were measured with a customized UV to mid-infrared steady-state and phosphorescence lifetime spectrometer (FSP920-C, Edinburgh) equipped with a digital oscilloscope (TDS3052B, Tektronix) and a tunable mid-band Optical Parametric Oscillator (OPO) pulse laser as the excitation source (410–2400 nm, 10 Hz, pulse width ≤5 ns, Vibrant 355II, OPOTEK). The absolute UC quantum yield (QY) was measured on a customized UCQY measurement system combined with a fiber optic spectrometer (QE65pro, Ocean Optics), a standard integrating sphere (150 mm in diameter, Edinburgh), a 980 nm diode laser (MDL-III-980-2W, Changchun New Industries Optoelectronics Tech Co., Ltd) as the excitation source, and a neutral density filter to attenuate the excitation light (for details, please see also the Experimental section and Fig. S1 in the ESI†). A tungsten lamp (100 W, Edinburgh) was used as a correction for the spectral response of the system, and the UCL emission peaks in the spectral region of 460–620 nm for Tb3+, 410–690 nm for Er3+, 330–840 nm for Tm3+ and 470–630 nm for Ho3+ were integrated for the QY determination. For low-temperature measurements, samples were mounted on a closed cycle cryostat (10–300 K, DE202, Advanced Research Systems). To avoid laser burning of the samples in a vacuum environment in the closed cycle cryostat, the as-synthesized UCNPs were washed with acid to yield ligand-free UCNPs. PL photographs of the UCNP solutions were taken by using a Canon 70D digital camera without using any filter. All the measurements were carried out by using powder samples, and all the spectral data were corrected for the spectral response of both the spectrometer and the integrating sphere.3. Results and discussion
3.1. Structure and morphology
The LiYbF4 crystal has a tetragonal structure (space group I41/a) with the Yb3+ ions surrounded by eight F− ions that form the edges of a slightly distorted dodecahedron (Fig. 1a).39 All Yb3+ ions occupy a single site with a symmetry of S4. High-quality LiYbF4:Ln3+ (Ln = Er, Tm, Ho, or Tb) core-only and core/shell UCNPs were synthesized via a modified high-temperature co-precipitation method in the presence of OA and TOA as the surfactant and the solvent, respectively. The as-synthesized UCNPs are hydrophobic and can readily disperse in a variety of nonpolar organic solvents because of the oleic ligands anchored to the surface of the UCNPs. The XRD patterns (Fig. 1b and S2†) show a set of intense and indexed diffraction peaks of tetragonal LiYbF4 (JCPDS No. 71-1211) for both LiYbF4:Ln3+ core-only and core/shell UCNPs, indicating the pure phase and the high crystallinity of the UCNPs. Slightly narrower diffraction peaks for core/shell UCNPs than for core-only UCNPs were observed, due to the increase in the particle size of core/shell UCNPs. The TEM images show that the LiYbF4:30%Tb core-only UCNPs are roughly spherical with a mean size of 12.2 ± 0.6 nm (Fig. 1c and S3†), while the LiYbF4:2%Er UCNPs synthesized under identical conditions are rhombohedral with a mean size of (16.9 ± 0.8) × (21.7 ± 1.3) nm (Fig. 1d and S4†). This indicates that the doping concentration of Ln3+ has a significant impact on the size and morphology of the resulting UCNPs. Meanwhile, it was found that the size and morphology of the UCNPs can be tuned through the control of reaction time and/or temperature. For example, the mean size of the resulting LiYbF4:2%Er UCNPs can be tuned from (12.5 ± 1.1) × (15.5 ± 0.9) nm to (16.9 ± 0.8) × (21.7 ± 1.3) nm by elevating the reaction temperature from 300 °C to 320 °C (Fig. S5†). Similarly, by lengthening the reaction time from 20 min to 2 h at 320 °C, the mean size of the UCNPs can be tuned from 7.5 ± 0.8 nm to (17.5 ± 1.4) × (22.4 ± 1.6) nm, with their morphology evolving from spherical to rhombohedral (Fig. S6†). Such a morphology evolution of LiYbF4:Ln3+ UCNPs is ascribed to the anisotropic growth of the tetragonal NPs, which agrees well with our previous observations in LiLuF4:Ln3+ and LiYF4:Ln3+.40,41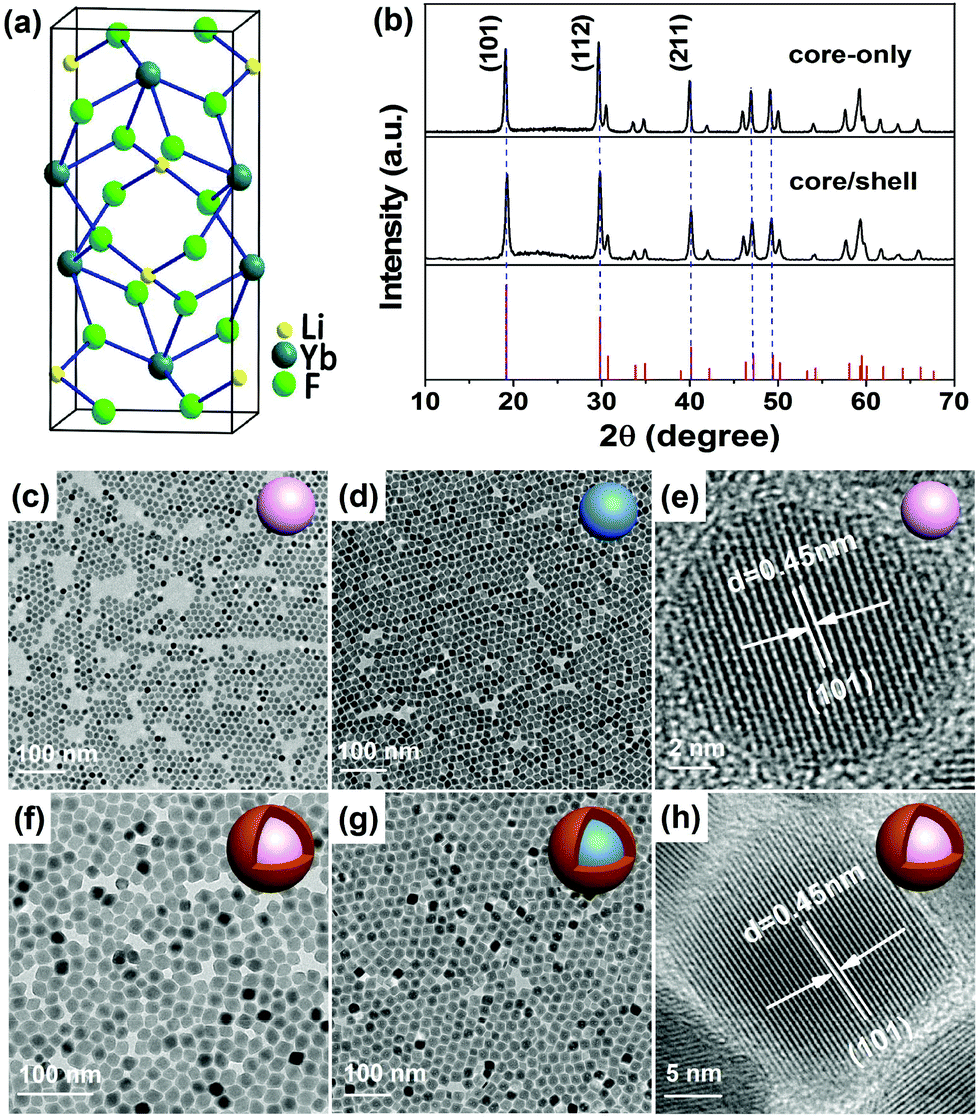 | ||
Fig. 1 (a) Crystal structure of tetragonal LiYbF4. (b) XRD patterns of LiYbF4:30%Tb core-only and LiYbF4:30%Tb@LiYF4 core/shell UCNPs. The bottom lines show the standard XRD pattern of tetragonal LiYbF4 (JCPDS No. 71-1211). TEM images of (c) LiYbF4:30%Tb and (d) LiYbF4:2%Er core-only UCNPs synthesized at 320 °C for 1 h, and (f) LiYbF4:30%Tb@LiYF4 and (g) LiYbF4:2%Er@LiYF4 core/shell UCNPs synthesized in a core/shell precursor ratio of 1![[thin space (1/6-em)]](https://www.rsc.org/images/entities/char_2009.gif) :1. (e, h) The corresponding HRTEM images for (c) and (f). :1. (e, h) The corresponding HRTEM images for (c) and (f). | ||
In addition to core-only UCNPs, core/shell UCNPs with a tunable shell thickness from ∼2 nm to ∼7 nm were also synthesized by controlling the ratio of the core/shell precursors through epitaxial growth of an inert LiYF4 shell around the core (Fig. S7†). The TEM images (Fig. 1f and g) show that both LiYbF4:30%Tb@LiYF4 and LiYbF4:2%Er@LiYF4 core/shell UCNPs synthesized in a core/shell precursor ratio of 1:1 are rhombohedral with their mean sizes of (20.0 ± 0.9) × (26.2 ± 1.2) nm and (25.3 ± 1.6) × (30.2 ± 1.7) nm (Fig. S3 and S4†), respectively. The core/shell structure can be verified by the discernible contrasted TEM image and high-angle annular dark-field scanning TEM (HAADF-STEM) analysis of the core/shell UCNPs (Fig. S3 and S4†). The high crystallinity of both core-only and core/shell UCNPs was further confirmed by the intense selected area electron diffraction (SAED) ring patterns (Fig. S3†) and the high-resolution TEM (HRTEM) images (Fig. 1e and h) which exhibit clear lattice fringes with an observed d spacing of 0.45 nm for the (101) plane of tetragonal LiYbF4. Compositional analysis by EDS revealed the Yb, Y and F elements of the matrix and the Tb and Er elements of the dopant (Fig. S3 and S4†). The absence of Li is because of its small atomic number (M = 3) that cannot be detected by EDS. More importantly, the modified high-temperature co-precipitation method can be extended to the synthesis of other Ln3+-doped UCNPs, especially those heterovalently doping with Ln3+ that were difficult to synthesize before, such as cubic KMgF3:Ln3+ and orthorhombic BaMgF4:Ln3+ (Fig. S8†).
3.2 Non-cooperative sensitization upconversion from Er3+, Ho3+, and Tm3+
Under 980 nm NIR laser irradiation, intense yellow, green and blue UCL can be observed in colloidal cyclohexane solution of the UCNPs doped with Er3+, Ho3+ and Tm3+, respectively, which became much brighter after coating by an inert LiYF4 shell (Fig. 2). The corresponding UCL spectra show that all the UCNPs exhibit sharp and characteristic emission peaks, which can be exclusively attributed to the intra-4fN electronic transitions of Er3+, Ho3+ and Tm3+, respectively (Fig. 2b–d). With increasing the particle size, the UCL intensity of the UCNPs was gradually enhanced due to the reduced surface quenching effect, as a result of the decreased surface-to-volume ratio of the UCNPs.42 For example, the integrated UCL intensity of LiYbF4:2%Er core-only UCNPs was remarkably enhanced by a factor of 14 upon increasing their particle size from ∼7.5 nm to ∼(17.5 × 22.4) nm (Fig. S9†). However, the corresponding UCL lifetimes of 4S3/2 (0.17 ms) and 4F9/2 (0.19 ms) of Er3+ were observed nearly unchanged (Fig. S10†), which contradicts with the common viewpoint that the UCL lifetime of Ln3+ generally decreases with the decrease in particle size.43,44 Such a size-independent UCL decay behavior in stoichiometric Yb-containing systems may originate from very fast energy migration among Yb3+ sub-lattices, as also evidenced by the observation of a nearly unchanged DSL lifetime (0.18 ms) of 2F5/2 of Yb3+ (Fig. S10†).23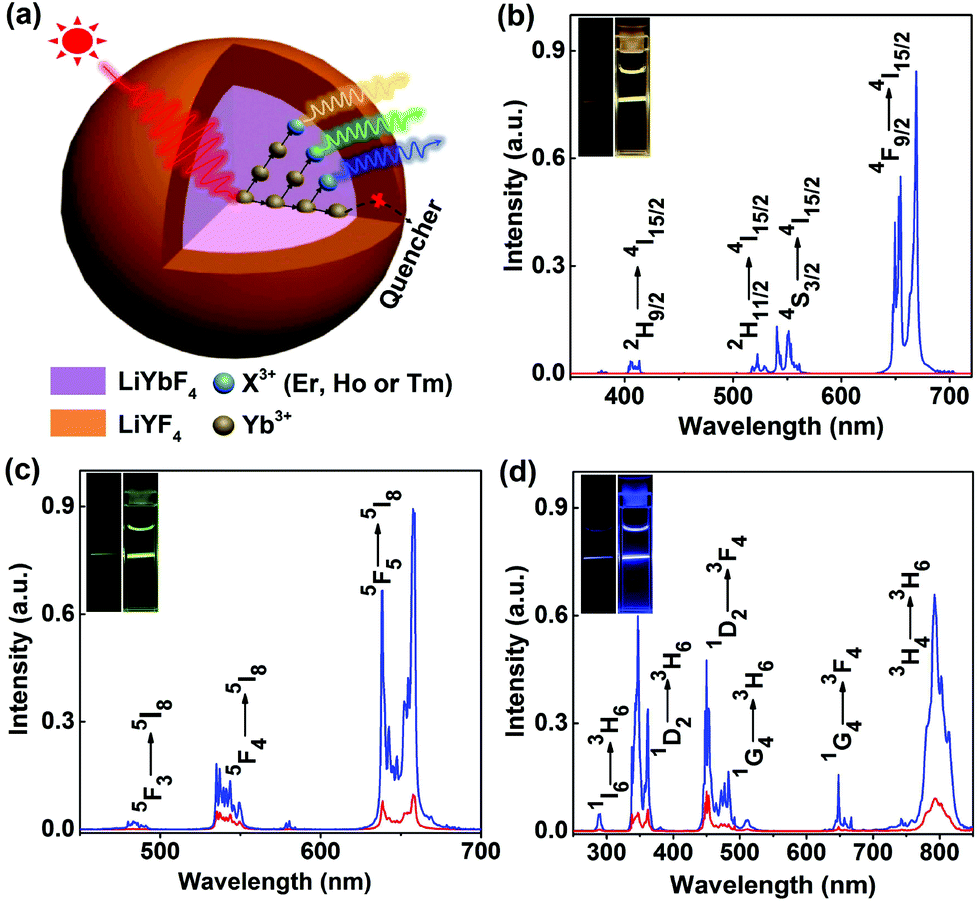 | ||
| Fig. 2 (a) Schematic illustration of the ET process in LiYbF4:Ln3+@LiYF4 core/shell UCNPs. RT UCL spectra of (b) LiYbF4:2%Er3+, (c) LiYbF4:2%Ho3+ and (d) LiYbF4:1%Tm3+ core-only (red) and core/shell (blue) UCNPs with an optimal shell thickness of LiYF4 upon NIR excitation at 980 nm. The insets show the corresponding UCL photographs for the colloidal cyclohexane solution of the UCNPs (∼5 mg mL−1) under 980 nm NIR laser irradiation at a power density of 10 W cm−2. | ||
To further improve the UCL, we passivated the surface of the UCNPs by growing an inert LiYF4 shell around the core (Fig. 2a). It was found that the integrated UCL intensity of LiYbF4:2%Er@LiYF4 core/shell UCNPs underwent an initial increase and then decreased with the increase in the shell thickness (Fig. S11†). This can be attributed to a synergic effect of the increased isolation of the core from its environment and the decreased Yb3+ absorption arising from the increased shell thickness.41,45 The integrated UCL intensity of the core/shell UCNPs with optimal shell thicknesses was enhanced by a factor of approximately 970, 7 and 6 for Er3+, Ho3+ and Tm3+, respectively, in comparison with their core-only counterparts (Fig. 2b–d). Accordingly, the UCL lifetimes of 4F9/2 of Er3+, 5F5 of Ho3+ and 1D2 of Tm3+ and the DSL lifetime of 2F5/2 of Yb3+ were found to increase from 0.19, 0.21, 0.19 and 0.18 ms to 0.35, 1.00, 0.43 and 1.20 ms, respectively (Fig. S12–S15†). Besides, it was observed that all the UCL decays displayed a rising edge in the initial stage, as a result of the slow population process of the emitting energy levels through ET from Yb3+, thus revealing the ETU mechanism for the non-cooperative sensitization UCL of Er3+, Ho3+ and Tm3+ in LiYbF4 (Fig. S16†).28,46 Both the enhanced UCL intensity and lengthened lifetime in core/shell UCNPs unequivocally confirm the effective surface passivation that alleviates the deleterious surface quenching effect. The absolute UCQY, defined as the ratio of the number of emitted photons to the number of absorbed photons, was determined to be 3.36 ± 0.06%, 0.69 ± 0.01% and 0.81 ± 0.06% for Er3+, Ho3+ and Tm3+, respectively, in core/shell UCNPs upon 980 nm NIR laser excitation at a power density of 70 W cm−2 (Table S2†).
More importantly, we observed that, under 980 nm excitation at a low power density of 5 W cm−2, the ratio of the UCL intensity of the UV emission at ∼362 nm to the NIR emission at ∼800 nm (RUV/NIR) in LiYbF4:1%Tm was unusually larger (e.g., 0.14 vs. 0.02 in NaYbF4:Tm) than that in other Tm3+-activated UCNPs, such as NaYF4:Yb,Tm, NaYbF4:Tm, and LiYF4:Yb,Tm (Fig. S17†).40,47,48 This can be attributed to the unique crystal structure of LiYbF4 and the energy migration process through Yb3+ sub-lattices to nearby Tm3+ ions that promotes the high-order multiphoton UCL of Tm3+.36,49 The intense UCL in the UV region is highly desired for triggering the photochemical reactions in several promising biomedical applications, such as the remote control of drug delivery and cell adhesion,50–52 thus offering the great potential of LiYbF4:Ln3+ UCNPs as effective UCL nano-bioprobes in the field of biomedicine.
3.3 Cooperative sensitization upconversion from Tb3+
Apart from ETU from Er3+, Ho3+ and Tm3+, we also investigated the CSU process in LiYbF4:Tb3+ UCNPs. To realize effective CSU in LiYbF4, the doping concentration of Tb3+ was first optimized to be 30 mol%, by considering the concentration quenching of Tb3+ and the doping-induced particle size variation (Fig. S18†). Under 980 nm NIR irradiation, green UCL can be explicitly observed in colloidal cyclohexane solution of both LiYbF4:30%Tb core-only and LiYbF4:30%Tb@LiYF4 core/shell UCNPs (Fig. 3b). The UCL spectra show that all the emission peaks can be exclusively assigned to the 5D4 (or 5D3) → 7FJ (J = 6, 5, 4 and 3) transitions of Tb3+, and the integrated UCL intensity of Tb3+ is ∼7 times enhanced for core/shell UCNPs relative to their core-only counterparts (Fig. 3b), as a result of the reduced surface quenching effect.42 The UCL decays from 5D4 of Tb3+ display a rising edge in the initial stage followed by a single-exponential decay with a fitted lifetime of 6.17 ± 0.01 ms for both core-only and core/shell UCNPs (Fig. 3c). The rising edge in the decay curve reflects the slow population process of 5D4 of Tb3+ through ET from Yb3+, which is dictated by the PL decay from 2F5/2 of Yb3+.28,46 The lengthening in the rising edge of the decay curve for core/shell UCNPs is consistent with the PL lifetime lengthening of Yb3+ (from 0.12 ms to 1.87 ms, Fig. 3d), thus confirming the ET process from Yb3+ to Tb3+. The exactly same decay time of 5D4 of Tb3+ for core-only and core/shell UCNPs is ascribed to the large energy gap (14714 cm−1) between 5D4 and its next low-lying level 7F0 of Tb3+, which requires more than 30 lattice phonons to bridge and thus prevents Tb3+ from surface quenching.53 The unchanged decay time of Tb3+ and the significantly lengthened decay time of Yb3+ confirm that the surface quenching effect in LiYbF4:Ln3+ core-only UCNPs originates mainly from energy migration through the Yb3+ sub-lattice to surface defects or high-energy vibrational groups surrounding the UCNPs (Fig. 3a).
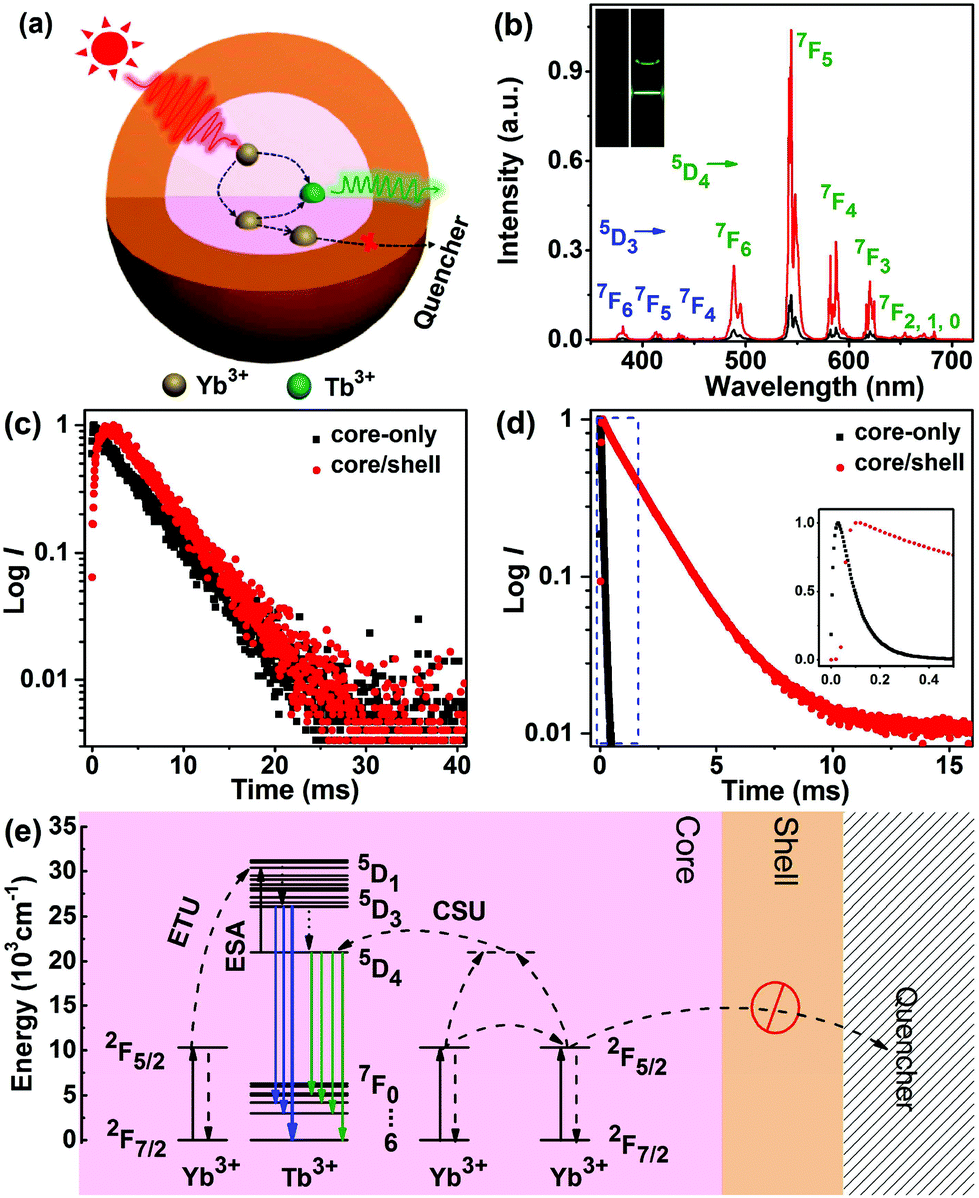 | ||
| Fig. 3 (a) Schematic illustration of the ET process in LiYbF4:Tb3+@LiYF4 core/shell UCNPs. (b) RT UCL spectra of LiYbF4:30%Tb3+ core-only and core/shell UCNPs upon NIR excitation at 980 nm. The insets show the corresponding UCL photographs for the colloidal cyclohexane solution of the UCNPs (∼5 mg mL−1) under 980 nm NIR laser irradiation at a power density of 20 W cm−2. (c) UCL decays from 5D4 of Tb3+ by monitoring the Tb3+ emission at 544 nm under 980 nm excitation, and (d) DSL decays from 2F5/2 of Yb3+ by monitoring the Yb3+ emission at 980 nm under 940 nm excitation in LiYbF4:30%Tb3+ core-only and LiYbF4:Tb3+@LiYF4 core/shell UCNPs. (e) Schematic energy level diagrams showing the CSU processes for Tb3+via the cooperative sensitization of Yb3+. The dashed, dotted and full arrows represent the ET, non-radiative relaxation and radiative transition processes, respectively. | ||
Because the energy difference between 5D4 of Tb3+ and 2F5/2 of Yb3+ is too large (∼10304 cm−1) to be compensated by lattice phonons of the matrix (e.g., 460 cm−1 in LiYbF4),54 resonant or phonon-assisted ET from Yb3+ to Tb3+ hardly occurs. Therefore, it is generally assumed that the ET from Yb3+ to Tb3+ is a second-order cooperative sensitization process, where the energy of a pair of excited Yb3+ is transferred simultaneously to an adjacent Tb3+.19 Once Tb3+ is excited to 5D4, it can be further excited to 5D1 through absorption of a pump photon (excited-state absorption, ESA) or through ET from a third Yb3+ (ETU), thus enabling the population of 5D3 and thereby its emission through non-radiative relaxation from 5D1 (Fig. 3e). The two-photon UCL from 5D4 and three-photon UCL from 5D3 of Tb3+ were further corroborated by the number of pump photons (n) responsible for the corresponding UC emissions, namely, 1.75 ± 0.05 and 2.28 ± 0.05 for 5D4 → 7FJ (J = 6, 5, 4 and 3) and 5D3 → 7FJ (J = 6, 5 and 4) transitions, respectively (Fig. S19†). The deviation from the theoretically predicted photon number for the population of 5D4 (n = 2) and 5D3 (n = 3) of Tb3+ is most probably due to the UC saturation caused by the middle-to-high pump power density regime we employed.55,56 The absolute UCQY for CSU, which had never been reported before, was determined to be 0.0085 ± 0.0035% in LiYbF4:Tb3+@LiYF4 core/shell UCNPs upon 980 nm NIR laser excitation at a power density of 70 W cm−2. This QY value for CSU is around 2–3 orders of magnitude lower than that for non-cooperative sensitization ETU in LiYbF4:Ln3+ UCNPs (Table S2†), which is in agreement with the theoretical prediction that CSU is 2–3 orders of magnitude less efficient than ETU.11
3.4 Excited-state dynamics involved in the CSU process
To gain more insights into the CSU process in LiYbF4:Tb3+ UCNPs, we recorded the temperature-dependent steady-state and transient UCL spectra of Tb3+. It was found that the integrated UCL intensity of Tb3+ increased significantly with temperature rise (Fig. 4a and b). Typically, the integrated UCL intensity of Tb3+ at RT is approximately one order of magnitude stronger than that at 10 K. This is in marked contrast with the observation that the integrated DSL intensities of Tb3+ and Yb3+ showed a decrease with temperature rise (Fig. 4b, S20 and S21†). The decrease in the DSL intensity is due mainly to the larger non-radiative transition probability at higher temperatures, as well documented in most Ln3+-doped phosphors.57 Because the only difference between the UCL and DSL from 5D4 of Tb3+ lies in their excitation channels, namely, cooperative ET (CET) from Yb3+ in UCL and non-radiative relaxation from 5D1 of Tb3+ in DSL, the anomalous increase in the integrated UCL intensity with temperature rise can be ascribed to the temperature-dependent CET process from Yb3+.29–31 By means of high-resolution optical spectroscopy at 10 K, the lowest Stark sub-levels of 5D4 of Tb3+ and 2F5/2 of Yb3+ were determined to be 20597 cm−1 and 10277 cm−1, respectively, by assuming that all Ln3+ ions occupy a single site with a symmetry of S4 in LiYbF4 (Fig. S21 and S22†). In fact, we have identified a single occupant site symmetry of S4 for Ln3+ ions in similar LiLuF4 nanocrystals by using Eu3+ as the structural probes (unpublished data). As a consequence, there exists an energy mismatch of 43 cm−1 between the lowest Tb3+ 5D4 level and twice the lowest Yb3+ 2F5/2 level, which indicates that the CET from Yb3+ to Tb3+ requires the assistance of lattice phonons. This value of energy mismatch is close to the UCL activation energy (∼128 cm−1) determined from the Arrhenius plot of the natural logarithm of the normalized integrated UCL intensity of Tb3+versus the inverse of temperature (Fig. S23†), thus verifying that the abnormal temperature-dependent UCL of Tb3+ is caused by the phonon-assisted CET process.30 At higher temperatures, higher Stark sub-levels of 2F5/2 of Yb3+ ions are thermally populated (Fig. S21†), from which CET occurs (Fig. 4e).29–31
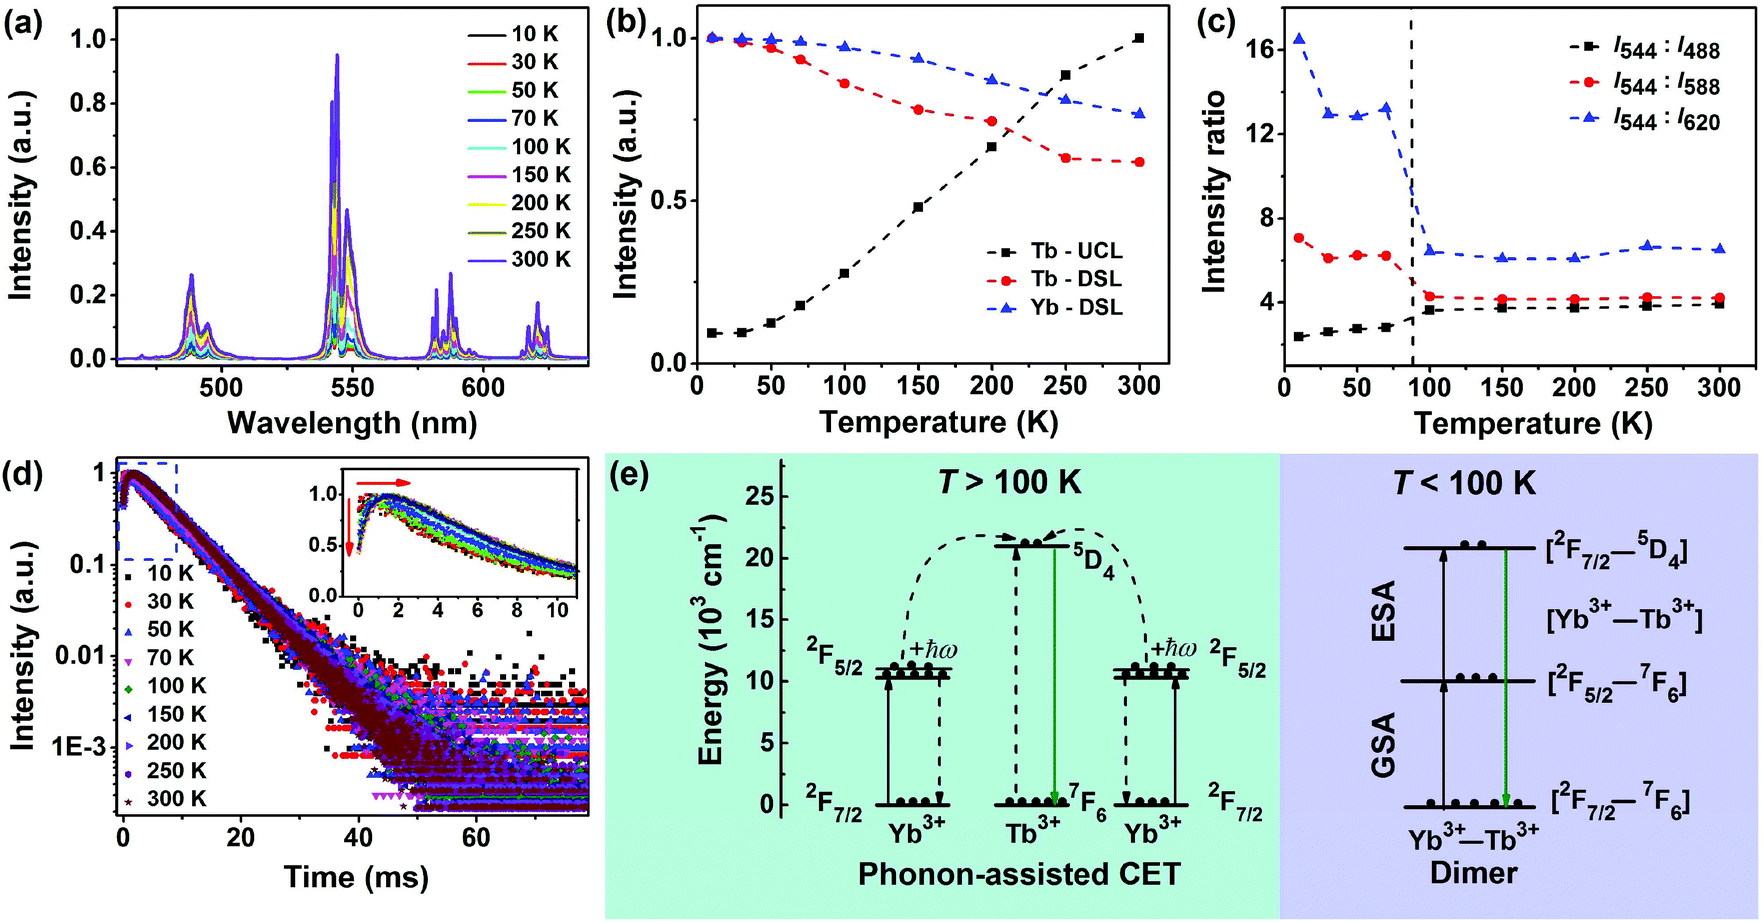 | ||
| Fig. 4 (a) Temperature-dependent UCL spectra of LiYbF4:30%Tb3+@LiYF4 core/shell UCNPs upon NIR excitation at 980 nm. (b) Normalized integrated UCL intensity of Tb3+ and DSL intensities of Tb3+ and Yb3+ as a function of temperature. (c) Ratio of the integrated UCL intensities of 5D4 → 7F5 (544 nm) to 5D4 → 7F6 (488 nm), 7F4 (588 nm), and 7F3 (620 nm) transitions of Tb3+ as a function of temperature. (d) Temperature-dependent UCL decays from 5D4 of Tb3+ by monitoring the Tb3+ emission at 544 nm under 980 nm excitation. The inset shows the rising edges of the decay curves. (e) Schematic illustration showing the simplified energy levels of Yb3+ and Tb3+, and the proposed ET processes for the population of 5D4 of Tb3+ involved in the CSU process in LiYbF4:Tb3+ UCNPs. | ||
Meanwhile, it is worth emphasizing that the UCL branching ratios of 5D4 → 7FJ (J = 6, 5, 4 and 3) transitions of Tb3+ exhibited also a dependence on temperature with a typical transition point at ∼100 K (Fig. 4c). For instance, the ratio of the integrated intensity of 5D4 → 7F5/5D4 → 7F3 transitions is nearly a constant with a value of ∼6.4 for T > 100 K, whereas it turns out to be ∼13.2 at 30–100 K and ∼16.5 at 10 K. This is very different from the DSL of Tb3+ where the PL branching ratios of 5D4 → 7FJ (J = 6, 5, 4 and 3) transitions show only slight changes with temperature rise (Fig. S20†). The change in the UCL branching ratios for T < 100 K indicates that the electronic configuration of Yb3+ could be mixed into the 5D4 multiplet of Tb3+ that modifies its transition probability to lower 7FJ levels.30,31,58 This can be further corroborated from the temperature-dependent UCL transients. It was observed that all the UCL decays from 5D4 of Tb3+ exhibited a single exponential decay with fitted decay times ranging from 6.39 ms to 6.97 ms at 10–300 K (Fig. 4d and Table S3†). The nearly identical decay time at different temperatures is ascribed to the large energy gap (14714 cm−1) between 5D4 and 7F0 of Tb3+, which makes Tb3+ less influenced by non-radiative relaxation. Furthermore, it was observed that the rising edge in the initial stage of the decay curve gradually shortened with the decrease of temperature, and disappeared when the temperature fell below 30 K (inset of Fig. 4d and Table S3†). The increase of rise time at higher temperatures is due to the increased population on 5D4 of Tb3+ from Yb3+,59 which agrees well with the improved UCL intensity of Tb3+, thus confirming the phonon-assisted CET process. The absence of the rising edge in the decay curves at temperatures below 30 K suggests that a direct ESA process is involved in the population of 5D4 of Tb3+.60 Since Tb3+ has no intermediate level matching that of Yb3+, a reasonable ESA channel within the pair levels of weakly coupled Yb3+–Tb3+ dimers is proposed: [Yb3+:2F7/2–Tb3+:7F6] → [Yb3+:2F5/2–Tb3+:7F6] → [Yb3+:2F7/2–Tb3+:5D4] (Fig. 4e), as established by Güdel et al. in Cs3Tb2Br9:Yb3+ single crystals.59,60 This well interprets the significant change in the UCL branching ratios of Tb3+ for T < 100 K, and also substantiates our assumption that the electronic configuration of Yb3+ could be mixed into the 5D4 multiplet of Tb3+. Based on the above analysis, we can now unambiguously unravel the underlying excited-state dynamics involved in the CSU process in LiYbF4:Tb3+ UCNPs: for T > 100 K, phonon-assisted CET is dominant; for T < 100 K, a sequence of two cooperative absorption steps, namely, ground-state absorption (GSA)/ESA within a weakly coupled Yb3+–Tb3+ dimer dominates (Fig. 4e). Typically, for T = 10 K, the role of phonon-assisted CET is negligible due to the very small occupation number of the phonon states in the host, as verified by the negligibly weak emission at 960 nm from the second higher Stark sub-level of 2F5/2 of Yb3+ (Fig. S21†).
4. Conclusions
In summary, we have systematically investigated the cooperative and non-cooperative sensitization UC in LiYbF4:Ln3+ core-only and core/shell UCNPs. Energy migration among Yb3+ sub-lattices has been demonstrated to play a key role in the UC processes of Ln3+ in LiYbF4, which not only resulted in the unusually strong ETU in the UV region from Tm3+, but also promoted the CSU from Tb3+. Particularly, we have quantified the first CSU efficiency with an absolute UCQY of 0.0085 ± 0.0035% and revealed the dominant mechanisms of phonon-assisted CET (T > 100 K) and sequential dimer GSA/ESA (T < 100 K) for the CSU process in LiYbF4:Tb3+ UCNPs. The NIR-triggered CSU luminescence from Tb3+ that is free of surface quenching might exhibit great potential for applications in a variety of UCL biosensing such as homogeneous UC-FRET bioassays, despite its current limitation with extremely low efficiency. We believe that such a limitation can be circumvented by screening host materials with suitable lattice constants and phonon energies, or by confining the energy migration in a Tb3+-doped shell based on smart core/shell nanostructured design, in an effort to markedly promote the three-body CSU process. The modified high-temperature co-precipitation method can be extended to the synthesis of other Ln3+-doped UCNPs that were difficult in the synthesis before, which may offer a new avenue for the exploration of Ln3+-doped UCNPs towards versatile biomedical applications.Acknowledgements
This study is supported by the 973 program of MOST (no. 2014CB845605), the NSFC (No. U1305244, 21325104, and 21501180), the CAS/SAFEA International Partnership Program for Creative Research Teams, the Strategic Priority Research Program of the CAS (No. XDB20000000), the Youth Innovation Promotion Association (No. 2016277), the Chunmiao Project of Haixi Institutes of the CAS (No. CMZX-2016-002), and Natural Science Foundation of Fujian Province (No. 2015J05116, 2017J05095, and 2017I0018).References
- G. F. Wang, Q. Peng and Y. D. Li, Acc. Chem. Res., 2011, 44, 322–332 CrossRef CAS PubMed.
- J. C. G. Bünzli and S. V. Eliseeva, Chem. Sci., 2013, 4, 1939–1949 RSC.
- G. Y. Chen, H. L. Qiu, P. N. Prasad and X. Y. Chen, Chem. Rev., 2014, 114, 5161–5214 CrossRef CAS PubMed.
- W. Zheng, P. Huang, D. T. Tu, E. Ma, H. M. Zhu and X. Y. Chen, Chem. Soc. Rev., 2015, 44, 1379–1415 RSC.
- B. Zhou, B. Y. Shi, D. Y. Jin and X. G. Liu, Nat. Nanotechnol., 2015, 10, 924–936 CrossRef CAS PubMed.
- D. M. Yang, P. A. Ma, Z. Y. Hou, Z. Y. Cheng, C. X. Li and J. Lin, Chem. Soc. Rev., 2015, 44, 1416–1448 RSC.
- X. J. Zhu, W. Feng, J. Chang, Y. W. Tan, J. C. Li, M. Chen, Y. Sun and F. Y. Li, Nat. Commun., 2016, 7, 10437 CrossRef CAS PubMed.
- M. K. Tsang, W. W. Ye, G. J. Wang, J. M. Li, M. Yang and J. H. Hao, ACS Nano, 2016, 10, 598–605 CrossRef CAS PubMed.
- Y. Li, J. L. Tang, D. X. Pan, L. D. Sun, C. Y. Chen, Y. Liu, Y. F. Wang, S. Shi and C. H. Yan, ACS Nano, 2016, 10, 2766–2773 CrossRef CAS PubMed.
- Y. Mita, J. Appl. Phys., 1972, 43, 1772–1778 CrossRef CAS.
- F. Auzel, Chem. Rev., 2004, 104, 139–173 CrossRef CAS PubMed.
- M. Haase and H. Schafer, Angew. Chem., Int. Ed., 2011, 50, 5808–5829 CrossRef CAS PubMed.
- G. K. Liu, Chem. Soc. Rev., 2015, 44, 1635–1652 RSC.
- J. F. Suyver, J. Grimm, M. K. van Veen, D. Biner, K. W. Krämer and H. U. Güdel, J. Lumin., 2006, 117, 1–12 CrossRef CAS.
- F. Wang, R. R. Deng, J. Wang, Q. X. Wang, Y. Han, H. M. Zhu, X. Y. Chen and X. G. Liu, Nat. Mater., 2011, 10, 968–973 CrossRef CAS PubMed.
- H. Dong, L.-D. Sun and C.-H. Yan, Chem. Soc. Rev., 2015, 44, 1608–1634 RSC.
- L. Tu, X. Liu, F. Wu and H. Zhang, Chem. Soc. Rev., 2015, 44, 1331–1345 RSC.
- F. W. Ostermayer and L. G. Van Uitert, Phys. Rev. B: Solid State, 1970, 1, 4208–4212 CrossRef.
- F. Auzel, J. Lumin., 1990, 45, 341–345 CrossRef CAS.
- G. S. Maciel, A. Biswas and P. N. Prasad, Opt. Commun., 2000, 178, 65–69 CrossRef CAS.
- H. S. Wang, C. K. Duan and P. A. Tanner, J. Phys. Chem. C, 2008, 112, 16651–16654 CAS.
- W.-P. Qin, Z.-Y. Liu, C.-N. Sin, C.-F. Wu, G.-S. Qin, Z. Chen and K.-Z. Zheng, Light: Sci. Appl., 2014, 3, e193 CrossRef CAS.
- Q. Q. Su, S. Y. Han, X. J. Xie, H. M. Zhu, H. Y. Chen, C.-K. Chen, R.-S. Liu, X. Y. Chen, F. Wang and X. G. Liu, J. Am. Chem. Soc., 2012, 134, 20849–20857 CrossRef CAS PubMed.
- R. R. Deng, J. Wang, R. F. Chen, W. Huang and X. G. Liu, J. Am. Chem. Soc., 2016, 138, 15972–15979 CrossRef CAS PubMed.
- M. Xue, X. J. Zhu, X. C. Qiu, Y. Y. Gu, W. Feng and F. Y. Li, ACS Appl. Mater. Interfaces, 2016, 8, 17894–17901 CAS.
- H. Dong, L. D. Sun, Y. F. Wang, J. W. Xiao, D. T. Tu, X. Y. Chen and C. H. Yan, J. Mater. Chem. C, 2016, 4, 4186–4192 RSC.
- K. Prorok, M. Pawlyta, W. Stręk and A. Bednarkiewicz, Chem. Mater., 2016, 28, 2295–2300 CrossRef CAS.
- D. R. Gamelin and H. U. Güdel, Top. Curr. Chem., 2001, 214, 1–56 CrossRef CAS.
- M. V. D. Vermelho, P. V. dos Santos, M. T. D. Araújo, A. S. Gouveia-Neto, F. C. Cassanjes, S. J. L. Ribeiro and Y. Messaddeq, J. Lumin., 2003, 102–103, 762–767 CrossRef CAS.
- G. M. Salley, R. Valiente and H. U. Güdel, J. Phys.: Condens. Matter, 2002, 14, 5461–5475 CrossRef CAS.
- L. D. Menezes, G. S. Maciel, C. B. de Araujo and Y. Messaddeq, J. Appl. Phys., 2003, 94, 863–866 CrossRef CAS.
- X. Y. Zhang, M. Q. Wang, J. J. Ding, D. L. Gao, Y. H. Shi and X. H. Song, CrystEngComm, 2012, 14, 8357–8360 RSC.
- S. Sarkar, V. Adusumalli, V. Mahalingam and J. A. Capobianco, Phys. Chem. Chem. Phys., 2015, 17, 17577–17583 RSC.
- J. Wang, R. R. Deng, M. A. Macdonald, B. L. Chen, J. K. Yuan, F. Wang, D. Z. Chi, T. S. Hor, P. Zhang, G. K. Liu, Y. Han and X. G. Liu, Nat. Mater., 2014, 13, 157–162 CrossRef CAS PubMed.
- W. Wei, Y. Zhang, R. Chen, J. L. Goggi, N. Ren, L. Huang, K. K. Bhakoo, H. D. Sun and T. T. Y. Tan, Chem. Mater., 2014, 26, 5183–5186 CrossRef CAS.
- X. Chen, L. M. Jin, W. Kong, T. Y. Sun, W. F. Zhang, X. H. Liu, J. Fan, S. F. Yu and F. Wang, Nat. Commun., 2016, 7, 10304 CrossRef CAS PubMed.
- X. Wang, J. Zhuang, Q. Peng and Y. D. Li, Nature, 2005, 437, 121–124 CrossRef CAS PubMed.
- D. M. Liu, X. X. Xu, Y. Du, X. Qin, Y. H. Zhang, C. S. Ma, S. H. Wen, W. Ren, E. M. Goldys, J. A. Piper, S. X. Dou, X. G. Liu and D. Y. Jin, Nat. Commun., 2016, 7, 10254 CrossRef CAS PubMed.
- S. Salaün, M. T. Fornoni, A. Bulou, M. Rousseau, P. Simon and J. Y. Gesland, J. Phys.: Condens. Matter, 1997, 9, 6941–6956 CrossRef.
- M. Wang, Z. Chen, W. Zheng, H. M. Zhu, S. Lu, E. Ma, D. T. Tu, S. Y. Zhou, M. D. Huang and X. Y. Chen, Nanoscale, 2014, 6, 8274–8282 RSC.
- P. Huang, W. Zheng, S. Y. Zhou, D. T. Tu, Z. Chen, H. M. Zhu, R. F. Li, E. Ma, M. D. Huang and X. Y. Chen, Angew. Chem., Int. Ed., 2014, 53, 1252–1257 CrossRef CAS PubMed.
- F. Wang, J. Wang and X. G. Liu, Angew. Chem., Int. Ed., 2010, 49, 7456–7460 CrossRef CAS PubMed.
- J. B. Zhao, Z. D. Lu, Y. D. Yin, C. Mcrae, J. A. Piper, J. M. Dawes, D. Y. Jin and E. M. Goldys, Nanoscale, 2013, 5, 944–952 RSC.
- W. Zheng, S. Y. Zhou, Z. Chen, P. Hu, Y. S. Liu, D. T. Tu, H. M. Zhu, R. F. Li, M. D. Huang and X. Y. Chen, Angew. Chem., Int. Ed., 2013, 52, 6671–6676 CrossRef CAS PubMed.
- X. M. Li, Z. Z. Guo, T. C. Zhao, Y. Lu, L. Zhou, D. Y. Zhao and F. Zhang, Angew. Chem., Int. Ed., 2016, 55, 2464–2469 CrossRef CAS PubMed.
- W. Q. Luo, C. Y. Fu, R. F. Li, Y. S. Liu, H. M. Zhu and X. Y. Chen, Small, 2011, 7, 3046–3056 CrossRef CAS PubMed.
- G. Y. Chen, T. Y. Ohulchanskyy, R. Kumar, H. Ågren and P. N. Prasad, ACS Nano, 2010, 4, 3163–3168 CrossRef CAS PubMed.
- H. Y. Xing, W. B. Bu, Q. G. Ren, X. P. Zheng, M. Li, S. J. Zhang, H. Y. Qu, Z. Wang, Y. Q. Hua, K. L. Zhao, L. P. Zhou, W. J. Peng and J. L. Shi, Biomaterials, 2012, 33, 5384–5393 CrossRef CAS PubMed.
- H. L. Qiu, C. H. Yang, W. Shao, J. Damasco, X. L. Wang, H. Ågren, P. Prasad and G. Y. Chen, Nanomaterials, 2014, 4, 55–68 CrossRef PubMed.
- W. Li, J. S. Wang, J. S. Ren and X. G. Qu, J. Am. Chem. Soc., 2014, 136, 2248–2251 CrossRef CAS PubMed.
- Z. Y. Hou, Y. X. Zhang, K. R. Deng, Y. Y. Chen, X. J. Li, X. R. Deng, Z. Y. Cheng, H. Z. Lian, C. X. Li and J. Lin, ACS Nano, 2015, 9, 2584–2599 CrossRef CAS PubMed.
- W. P. Fan, B. Shen, W. B. Bu, X. P. Zheng, Q. J. He, Z. W. Cui, K. L. Zhao, S. J. Zhang and J. L. Shi, Chem. Sci., 2015, 6, 1747–1753 RSC.
- T. Miyakawa and D. L. Dexter, Phys. Rev. B: Solid State, 1970, 1, 2961 CrossRef.
- S. A. Miller, H. E. Rast and H. H. Caspers, J. Chem. Phys., 1970, 52, 4172–4175 CrossRef CAS.
- M. Pollnau, D. R. Gamelin, S. R. Luthi, H. U. Güdel and M. P. Hehlen, Phys. Rev. B: Condens. Matter, 2000, 61, 3337–3346 CrossRef CAS.
- J. F. Suyver, A. Aebischer, S. Garcia-Revilla, P. Gerner and H. U. Güdel, Phys. Rev. B: Condens. Matter, 2005, 71, 125123 CrossRef.
- G. Blasse and B. C. Grabmaier, Luminescent Materials, Springer-Verlag, Berlin, 1994 Search PubMed.
- G. Amaranath, S. Buddhudu and F. J. Bryant, J. Non-Cryst. Solids, 1990, 122, 66–73 CrossRef CAS.
- G. M. Salley, R. Valiente and H. U. Güdel, J. Lumin., 2001, 94–95, 305–309 CrossRef.
- G. M. Salley, R. Valiente and H. U. Güdel, Phys. Rev. B: Condens. Matter, 2003, 67, 134111 CrossRef.
Footnote |
| † Electronic supplementary information (ESI) available: Tables S1–S3 and Fig. S1–S23. See DOI: 10.1039/c7nr02124k |
| This journal is © The Royal Society of Chemistry 2017 |