
 Open Access Article
 This Open Access Article is licensed under a Creative Commons Attribution-Non Commercial 3.0 Unported Licence
Internal potential mapping of charged solid-state-lithium ion batteries using in situ Kelvin probe force microscopy†
Hideki
Masuda
*a,
Nobuyuki
Ishida
ab,
Yoichiro
Ogata
c,
Daigo
Ito
c and
Daisuke
Fujita
a
aNational Institute for Materials Science, 1-2-1 Sengen, Tsukuba, Ibaraki 305-0047, Japan. E-mail: masuda.hideki@nims.go.jp
bGlobal Research Center for Environment and Energy Based on Nanomaterials Science (GREEN), National Institute for Materials Science, 1-2-1 Sengen, Tsukuba, Ibaraki 305-0047, Japan
cTAIYO YUDEN CO., LTD., 5607-2 Nakamuroda, Takasaki, Gunma 370-3347, Japan
First published on 30th November 2016
Abstract
Solid-state-lithium ion batteries (SS-LIBs) are a promising candidate for next-generation energy storage devices. Novel methods for characterizing electrochemical reactions occurring during battery operation at the nanoscale are highly required for understanding the fundamental working principle and improving the performance of the devices. In this work, we combined Ar ion milling under non-atmospheric conditions with in situ cross-sectional Kelvin probe force microscopy (KPFM) for direct imaging of the internal electrical potential distribution of the SS-LIBs. We succeeded in the direct visualization of the change in the potential distribution of a cathode composite electrode (a mixture of the active materials, solid electrolytes, and conductive additives) arising from battery charging (electrochemical reaction). The observed results provided several insights into battery operation, such as the behavior of Li ions and inhomogeneity of electrochemical reactions in the electrode. Our method paves the way to characterize the fundamental aspects of SS-LIBs for the improvement of device performance, including the evaluation of the distribution of the Li ion depleted regions, visualization of the conductive paths, and analysis of the cause of degradation.
1 Introduction
Lithium ion batteries (LIBs) are gaining much attention as the demands for high densification, capacity enlargement, and enhanced safety continue to rise.1,2 Solid-state-LIBs (SS-LIBs), in which combustible organic electrolytes are replaced with nonflammable solid inorganic electrolytes, show promise for satisfying these demands as next-generation batteries. However, solid electrolytes for the current SS-LIBs have various disadvantages, such as low power densities caused by high ionic resistivity at the interfaces between electrode active materials and solid electrolytes.3 A breakthrough on this point is essential in order to improve the performance of SS-LIBs. The high ionic resistivity has so far been attributed to the Li depleted layer (the so-called “space-charge layer”) developed during battery operation4–6 or defects at the interfacial layer due to damage and contamination occurring during fabrication processes.7 For the fundamental understanding of the origin of interfacial resistivity, novel in situ techniques for measuring the distribution of the internal potential and/or Li ion concentration of LIB cells are strongly required.To date, a few examples of the characterization of those properties have been reported for SS-LIBs using transmission electron microscopy (TEM)-electron holography8 and TEM-electron energy loss spectroscopy (EELS).9 However, in TEM experiments, only very thin specimens with a thickness of several tens of nanometers can be measured, which makes it difficult to apply the TEM-based techniques to a wide range of actual SS-LIBs.
Kelvin probe force microscopy (KPFM) has also been widely used for characterizing electrical potential distribution of various electronic and ionic devices, including LIBs. In the study of ceramic electronic devices, the potential distributions between two metal electrodes were measured under the voltage applied conditions to gain insight into electron transport properties.10–14 On the other hand, the studies of LIBs were restricted to measurements only at the surface of the top electrode (active materials) or at the cross-sections of single particles of the active materials,15–17i.e., not at the interface regions between active materials and electrolytes. For this reason, the information obtained to consider the fundamental properties of LIBs, such as high ionic resistivity at the interfaces (discussed above) and aging phenomena was very limited. Furthermore, in some cases the samples were prepared by disassembling the LIBs after operation, which made it difficult to investigate the correlation between the measured physicochemical properties and the battery performance. To overcome these issues, widely applicable in situ techniques for measuring electrical potential and/or Li ion distribution over the interface regions during device operation are essential.
In this work, we have succeeded in directly visualizing the charging-induced changes in electrical potential distribution at the interface regions between an electrode and electrolyte in a composite electrode using in situ cross-sectional KPFM. The key factors for this success were Ar ion milling of the LIB cross-section (which exposes clean and flat cross-sectional surfaces) while maintaining battery performance and a consecutive non-atmospheric treatment of the specimen from sample preparation to KPFM measurements. Our findings reveal important information pertaining to battery operation, such as the behavior of Li ions and inhomogeneity of electrochemical reactions in the composite electrode.
2 Results and discussion
We performed KPFM measurements on the cross-section of a cathode composite electrode before and after charging to characterize the change in internal potential distribution due to electrochemical reactions. KPFM measures the contact potential difference (CPD) between the tip and the sample, which reflects the work function and electrical potential distribution of the sample surfaces.14,18,19 The schematic structure of the SS-LIB used in this study is shown in Fig. 1(a). The cathode has a composite structure that is a mixture of LiCoPO4 (LCP) as a cathode active material, Li1+xAlxTi2−x(PO4)3 (LATP) as a solid electrolyte, and Pd as a conductive additive (Fig. 1(b); see the Methods section for details). Fig. 1(c) shows the schematic of the KPFM setup. The anode side current collector was ground and the cathode side opened. A dc-bias and a modulation voltage are applied to the tip (see the Methods section for details of the KPFM measurements).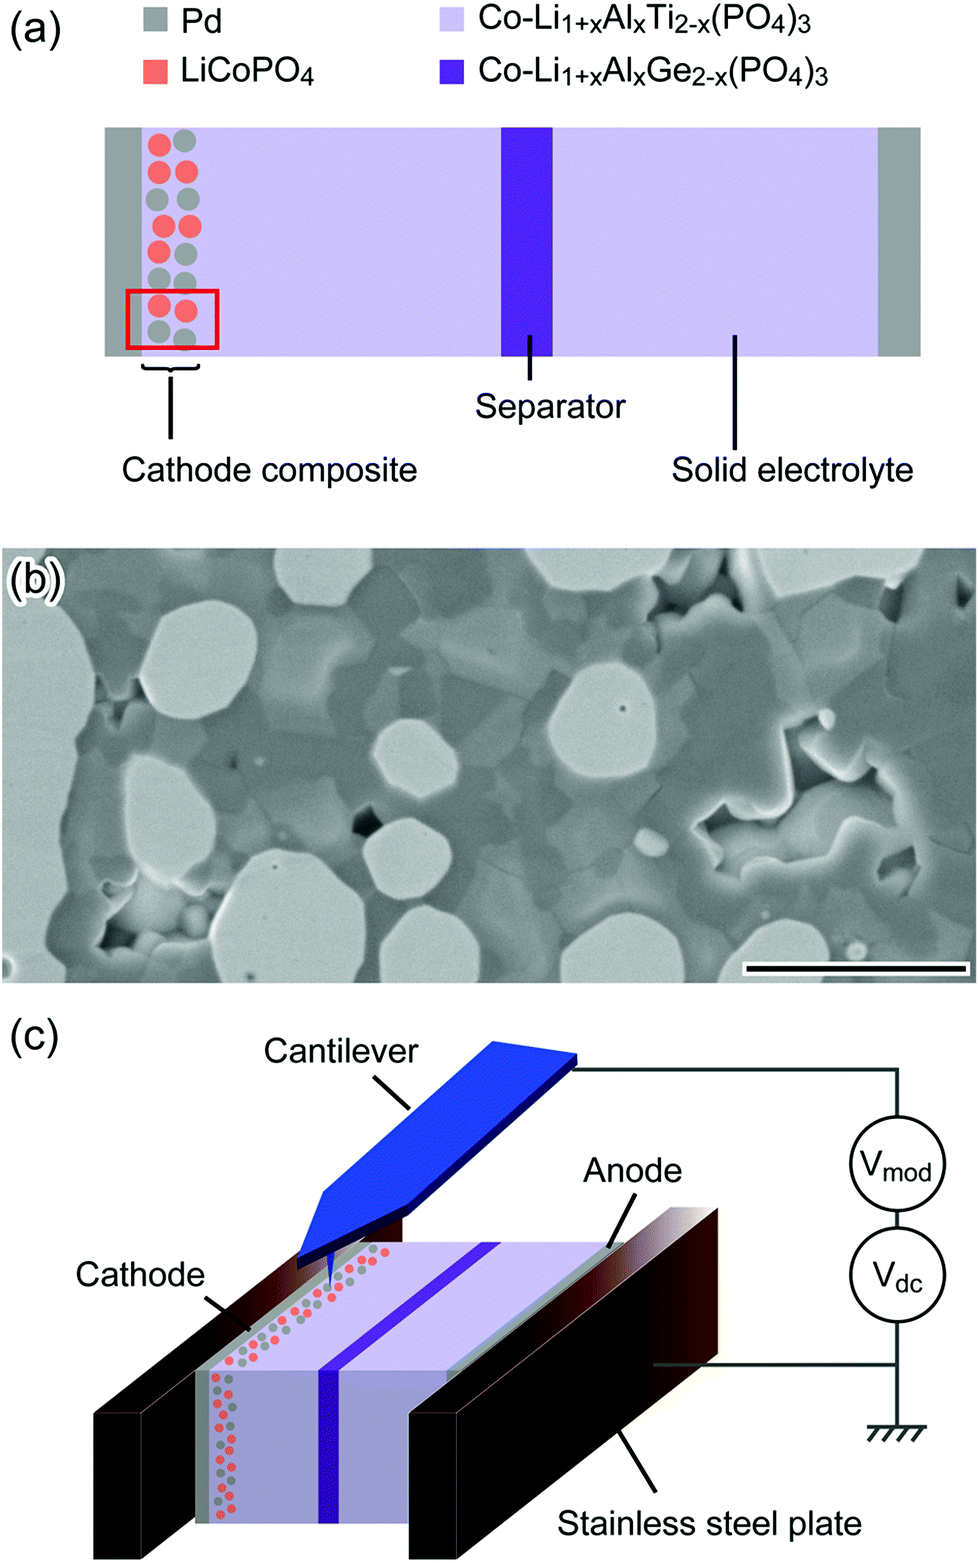 | ||
| Fig. 1 (a) Schematic structure of SS-LIB. The red frame corresponds to the area observed by KPFM. (b) SEM image of the cathode composite region. Scale bar is 2 μm. (c) Schematic illustration of cross-sectional KPFM setup inside the N2 flow glove box. | ||
Fig. 2(a) shows a charge characteristic of the LIB cell used in the KPFM measurement. Initially, the cell voltage between the two current collectors was 40 mV, and it increased to 2.39 V after charging. The KPFM measurements were carried out at positions A and B indicated by circles in Fig. 2(a). Fig. 2(b) and (d) respectively show the topographic and the CPD images of the cathode composite electrode before charging. The surface was smooth enough to perform atomic force microscopy (AFM) measurements except for the dark regions, which are holes derived from voids (Fig. 2(b)). The variation of the CPD in Fig. 2(d) can be attributed to the work function difference between the materials in the composite electrode,20,21 since the surface potential is expected to be homogeneous over the electrode before charging. Fig. 2(e) shows the CPD image with the boundary line of each material taken from the scanning electron microscope-energy dispersive X-ray spectroscopy (SEM-EDS) map obtained in the same area (Fig. 2(c)). The black broken line encloses Pd, and the red dotted line encloses the cathode active material. The Pd regions exhibited lower CPD values compared with other regions, and thus are clearly visible in the initial state. The regions of active material and solid electrolyte were difficult to distinguish but they showed slightly different CPD values (∼10 mV).
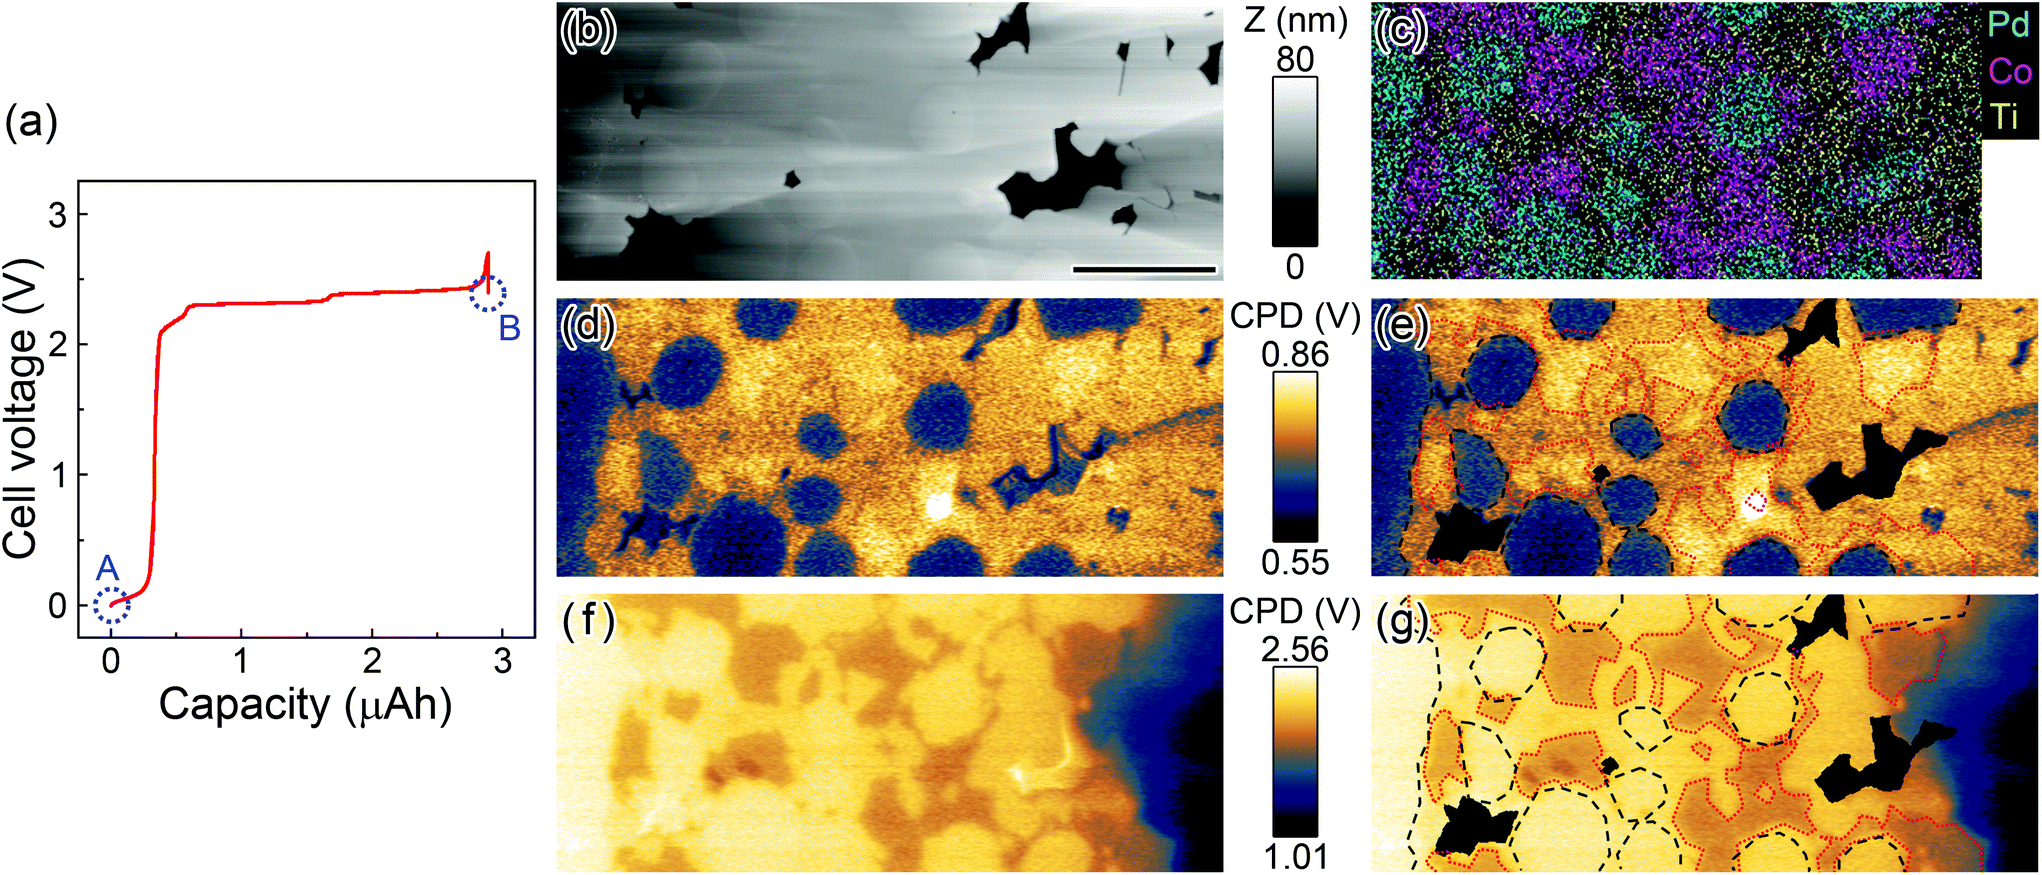 | ||
| Fig. 2 Results of in situ KPFM of the composite region. (a) Charging characteristics of the SS-LIB cell. Circles A and B show the points at which KPFM measurements were performed (before and after the charging). (b) Topographic image. (c) SEM-EDS map obtained in the same area as the KPFM measurements. (d) CPD image before charging (state A). (e) Duplicated CPD image of (d) with lines that show the boundary of each material taken from the EDS map. The black broken line encloses Pd, the red dotted line encloses LCP, and the black regions are topographic voids. (f), (g) CPD image and duplicated image with boundary lines after charging (state B). Scale bar is 2 μm. | ||
After charging, the distribution of CPD changed dramatically, as shown in Fig. 2(f). The CPD values at the composite electrode increased overall due to the increase in the electrical potential. Also, the contrast between each electrode material changed. Fig. 2(g) shows the CPD image with the boundary lines taken from the same EDS map. The black broken line encloses Pd and the red dotted line encloses the active material. In contrast to Fig. 2(d), the regions of Pd were imaged brighter than those of the active material. Also, the difference of CPD between the active material and solid electrolyte was increased to ∼200 mV. As a result, the interface between those two materials became clear.
First, we focus on the variation of the CPD values at the Pd current collector before and after charging. Since the change of the CPD value at this region was purely induced by the change of electrostatic potential (not by the electrochemical reaction and/or the change of work function), it is expected to correspond to the variation of the cell voltage. However, the variation (1.74 V: from 0.65 V to 2.39 V) was smaller than that of the cell voltage (2.35 V: from 0.04 to 2.39 V) by 26.0%. This discrepancy can be explained by the so-called tip averaging effect included in the amplitude modulation (AM)-KPFM measurements;22 namely in a previous work, the CPD difference between two Au electrodes (where bias voltages were applied) with an interval of 50 μm was smaller than the expected value by 27.6%. In our case, the solid electrolyte region (which has lower CPD values and thus can lower the CPD values measured at the Pd electrode) is about 10 μm away from the current collector regions.23 Considering the geometrical difference from the work in ref. 23, we consider the value of 26.0% to be within a reasonable range. Note that the influence of the tip averaging effect can be effectively suppressed by using a frequency modulation-KPFM mode,23 which thus enables more quantitative measurements.
Next, we consider the change in the CPD at the active material regions. The CPD values at these regions changed from 0.76 V to 2.05 V (total: 1.29 V). This variation can be explained by the electrochemical reactions at the cathode active material. During the charging reaction, Li ions deintercalate from LCP, resulting in the increase of the concentration ratio of [Co3+]/[Co2+] in each LCP particle.24,25 The variation of the CPD at this region was smaller than that at the Pd current collector regions, although these values should be comparable. We think this discrepancy mostly arises from the change in the work function followed by the stoichiometric change of LCP due to the electrochemical reactions.26 Note that to compensate for the charge in LCP, not only the oxidation state of [Co2+] but also the electronic structure around PO4 (which is interpreted by the hybridization effect between the Co 3d and O 2p orbitals) changes.27,28
Finally, we discuss the CPD variation at the LATP regions in the composite electrode. The CPD at this region changed from 0.75 to 2.25 V (total: 1.50 V). The electrostatic potential at the solid electrolyte is thought not to alter during the charging/discharging reactions, except for the region close to the interface between active material and the electrolyte.29 However, the CPD values within all the single particles of LATP in the composite electrode exhibited a homogeneous increase over the range of a few micrometers. This finding suggests that Li ions in LATP are depleted over the micrometer range and transferred into the anode side, since the oxidation–reduction reaction that can change electric potential in the electrolyte materials occurred only due to the movement of Li ions.
The LATP at the solid electrolyte regions showed different behavior than that at the composite electrode. Fig. 3(a) shows the CPD image obtained after charging with a wider view. Fig. 3(b) displays the line profile taken along the white line a–a′ in Fig. 3(a). The CPD value of LATP at the composite electrode increased by charging, while on the other hand, their change at the solid electrolyte regions was little (100–200 mV). This slight increase can also be explained by the tip averaging effect, which is induced by the higher CPD values at the composite electrode regions. This suggests that depletion of Li ions from LATP occurs only in the cathode composite region. Actually, a potential gradient was observed around the interface between the cathode composite and the solid electrolyte regions. However, it is difficult to define a clear interface between them, which makes it impossible to discuss whether a Li-depleted region exists in the solid electrolyte region from these data. For a detailed discussion of the Li-depleted region at there, additional experimentation on a well-defined interface is required.
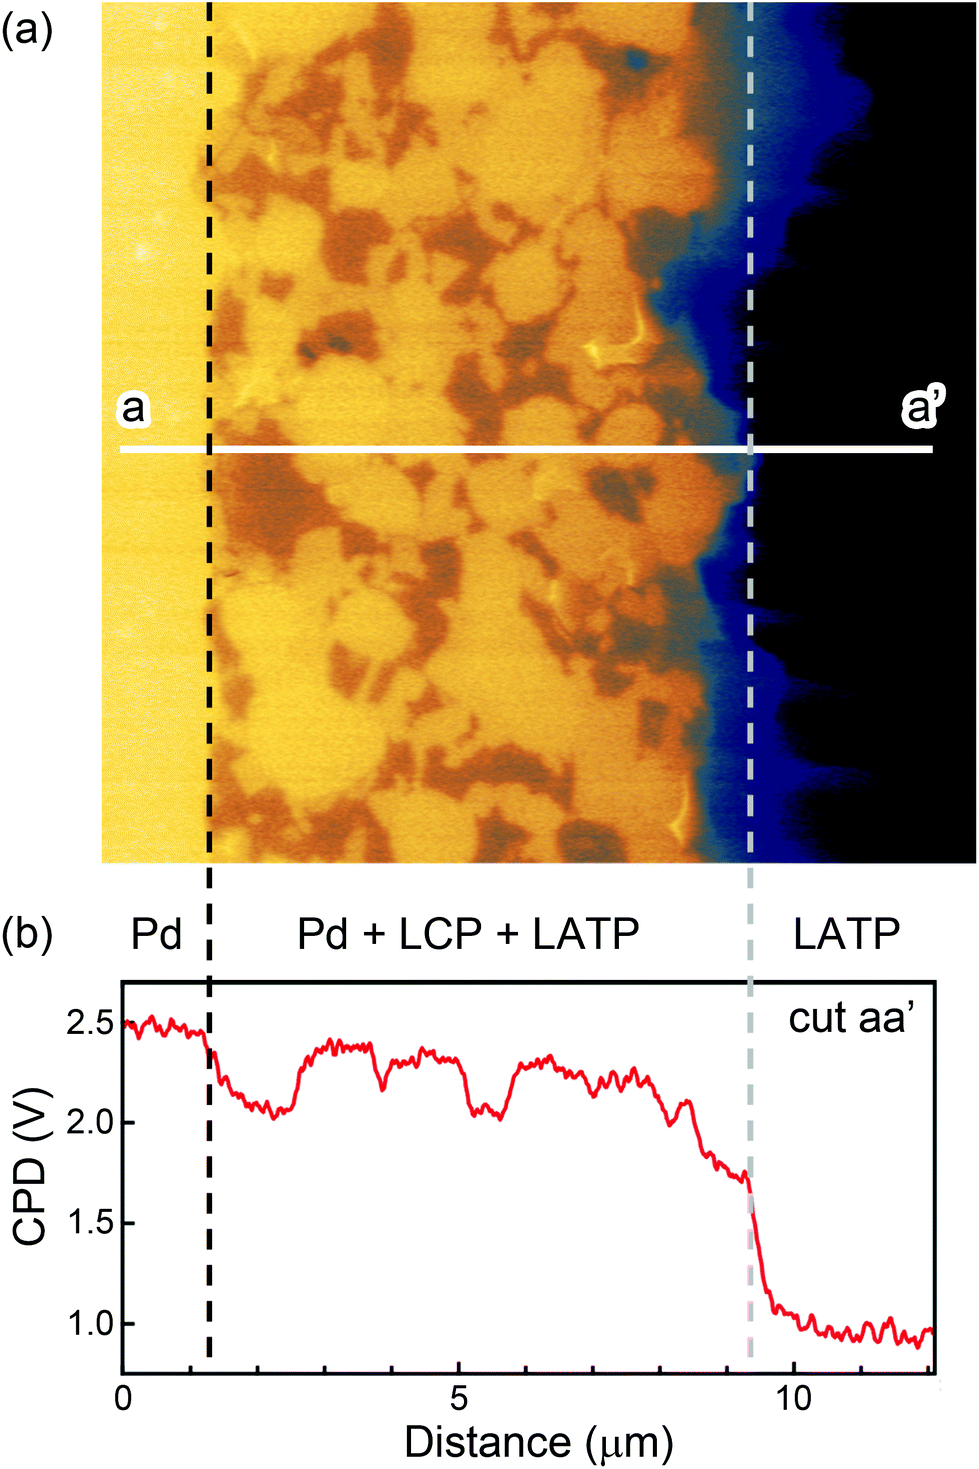 | ||
| Fig. 3 (a) Large view of the CPD image after charging. (b) CPD line profile along white line a–a′. The broken black line corresponds to the interface between the cathode composite region and the current collector. The broken gray line corresponds to the interface between the cathode composite and the solid electrolyte region. | ||
The thicknesses of space-charge layers at solid electrolyte regions in SS-LIBs are estimated to be 10–100 nm using a screening theory based on the Debye–Hückel approximation,30 and this estimation has been indirectly corroborated by some experimental results.31,32 On the other hand, direct observation of the electrical potential and Li ion distribution by TEM-electron holography8 and TEM-EELS9 suggested that its length was in the range of 1–2 μm, respectively, which is 1–2 orders of magnitude larger than the estimated values. Our KPFM experiment also indicated that it spread over the micrometer range at the LATP solid electrolyte region in the composite electrode. Since the screening theory cannot explain the micrometer-order length of the space-charge layer,30 this discrepancy implies that we need a new model to explain it. Anyway, a few experimental results might be insufficient to conclude the general trend of the length of the space charge layer in SS-LIBs. Systematic experimentation on a series of different solid electrolyte materials, especially on well-defined interfaces, is required for more detailed discussion.
In addition to the overall change of potential distribution on each material in the composite electrode, we also observed local inhomogeneity. Fig. 4(a) shows the KPFM image of a charged SS-LIB prepared from another lot of the SS-LIB. Fig. 4(b) displays the CPD image with the boundary line of each material taken from an EDS map obtained in the same area (Fig. 4(c)). An LATP particle indicated by an arrow in Fig. 4(b) exhibited a lower potential value than other LATP particles in the image. This particle comes into direct contact with the current collector at the left side without active materials in between. A similar tendency was observed on other LATP particles under the same conditions. The lower CPD value indicates that depletion of Li ions (discussed above) is less in those particles. This finding suggests that electrochemical reactions in the composite electrode are sensitive to the local structures. This measurement demonstrated that the cross-sectional KPFM can be used to image the inhomogeneity of the electrochemical reactions at the composite electrodes down to the nanometer scale and to acquire information about structure-correlated Li transport in the electrodes. Thus, our method would be powerful in the characterization of SS-LIBs in many respects, such as visualizing the conductivity network in composite electrodes and clarifying degradation mechanisms of battery performance. Furthermore, by extending our technique to the measurements in operando conditions (during charging/discharging processes), it would be possible to visualize and quantify the internal resistance of LIB cells.
 | ||
| Fig. 4 (a) CPD image of the cathode composite region after charging. (b) Duplicated image of (a) with boundary lines of each material taken from the EDS map. The black broken line encloses Pd. The red broken line encloses LCP. The white broken line encloses an LATP particle, which exhibited lower potential value than other LATP particles. (c) SEM-EDS map. Scale bar is 2 μm. | ||
3 Conclusion
We have succeeded in directly visualizing the potential distribution around the interface between the active material of LIB and a solid electrolyte and its change arising from battery charging using in situ KPFM. Ar ion milling of the cross-sections of the LIB under non-atmospheric conditions and consecutive non-atmospheric treatments of the specimen from sample preparation to KPFM measurements played key roles in this success. We observed an increase in electrical potential over the whole composite cathode electrode regions after charging, which suggests that Li ions were depleted even in LATP (solid electrolyte) regions over the micrometer range. Also, a local difference in electrical potential was observed, indicating the importance of the local structures of the composite electrodes in controlling Li ion behavior. Our experimental results demonstrate that cross-sectional KPFM is a powerful way to characterize various aspects of SS-LIBs, including evaluation of the distribution of the Li ion depleted region, visualization of the conductive path, and analysis of the cause of degradation.4 Methods
Sample preparation
The SS-LIB used in this study consists of Li1+xAlxTi2−x(PO4)3 (LATP) as a solid electrolyte, Li1+xAlxGe2−x(PO4)3 (LAGP) as a separator, LiCoPO4 (LCP) as a cathode active material, and Pd as a current collector and conductive additive. For the cathode, we use a composite cathode structure that is a mixture of the cathode active material, solid electrolyte, and conductive additives. For the anode, we use an in situ-formed electrode system.33,34 The LCP and LATP (NASICON type solid electrolytes) are known to react with each other during co-sintering at high temperature.35,36 In order to suppress this reaction, we used Co-doped LATP and LAGP.37 The SS LIB structure shown in Fig. 1(a) was fabricated by stacking the ceramic green sheets (on which each material is printed) and subsequent co-sintering. This battery works at ∼2.3 V (LCP (4.8 V vs. Li/Li+)38,39 to LATP (2.5 V vs. Li/Li+)40,41) at 120 °C (see details in the ESI S1†).The LIB cells had been stored in an Ar-filled glove box (O2: <0.8 ppm, H2O: <0.8 ppm) after the fabrication to avoid degradation due to oxygen and water in air. To prepare samples for the KPFM measurements, first the LIB cells were cut to the size of ∼1 mm × ∼2 mm in the Ar-filled glove box. Then, they were transferred into a vacuum chamber (∼10−4 Pa) without exposure to air using a transfer vessel for polishing the cross-sectional surface with Ar ion milling (JEOL IB-09020CP 8 kV). This process exposed the cross-sections of the particles of each material, as shown in Fig. 1(b), and made the whole cross-sectional surface smooth enough to perform KPFM measurements. We confirmed that this process did not alter the LIB performance (see details in the ESI S2†). After milling the samples were again transferred to the Ar-filled glove box without exposure to air and were clamped by using two stainless steel plates that were electrically isolated from each other. Finally, they were transferred to the N2 flow glove box for KPFM measurement using aluminum laminated bags.
KPFM measurements
KPFM measurements were performed using a commercial AFM (Park Systems XE-100) that was placed in a N2 flow glove box (O2: <1000 ppm, H2O: <250 ppm). We used Pt/Ir-coated Si cantilevers (NANOSENSORS PPP-EFM). The CPD between the tip and the sample was measured with an AM mode (17 kHz, 1VRMS) using a lock-in amplifier. The modulation voltage and a dc-voltage to minimize the electrostatic force between the tip and the sample were applied to the tip. The sample was set so that the anode side current collector of the LIB was electrically connected to the ground and the cathode side was opened (Fig. 1(c)). The KPFM measurements were carried out before and after charging. First, the sample was measured at room temperature (RT). Then, the sample was placed on a ceramic heater plate maintained at 120 °C in the N2 flow glove box and charged using a potentiostat/galvanostat (Princeton VersaSTAT3-200) in a constant current mode with a current density of ∼20 μA cm−2. After charging, the sample was again placed at the AFM stage for KPFM measurement. The measurement was carried out at RT in the same area as the one before the charging.SEM-EDS measurements
To identify the material of each particle in the composite electrode, we performed elemental mapping using a SEM-EDS (JEOL JSM-7800F 5 kV, Oxford X-Max 50, using characteristic X-rays of Pd Mζ, Co Lα, and Ti Lα). The sample was transferred to the SEM vacuum chamber (∼10−5 Pa) without exposure to air using the transfer vessel. The mapping measurements were carried out in the same area observed by KPFM. Although Co was not only included in the LCP but also doped in the solid electrolyte (LATP), the regions of the LCP were clearly distinguishable in the Co map due to the intensity difference of the spectrum.42Acknowledgements
We thank Kyosuke Matsushita for technical assistance. We are grateful for NIMS Battery Research Platform. This work was partly supported by CREST, the Japan Science and Technology Agency, and the MEXT Program for the “Development of Environmental Technology using Nanotechnology” from the Ministry of Education, Culture, Sports, Science and Technology of Japan.References
- J. B. Goodenough and Y. Kim, Chem. Mater., 2010, 22, 587–603 CrossRef CAS.
- A. G. Ritchie, J. Power Sources, 2004, 136, 285–289 CrossRef CAS.
- K. Takada, N. Ohta, L. Zhang, K. Fukuda, I. Sakaguchi, R. Ma, M. Osada and T. Sasaki, Solid State Ionics, 2008, 179, 1333–1337 CrossRef CAS.
- N. Ohta, K. Takada, L. Zhang, R. Ma, M. Osada and T. Sasaki, Adv. Mater., 2006, 18, 2226–2229 CrossRef CAS.
- K. Takada, N. Ohta and Y. Tateyama, J. Inorg. Organomet. Polym. Mater., 2015, 25, 205–213 CrossRef CAS.
- C. Yada, A. Ohmori, K. Ide, H. Yamasaki, T. Kato, T. Saito, F. Sagane and Y. Iriyama, Adv. Energy Mater., 2014, 4, 1301416 CrossRef.
- M. Haruta, S. Shiraki, T. Suzuki, A. Kumatani, T. Ohsawa, Y. Takagi, R. Shimizu and T. Hitosugi, Nano Lett., 2015, 15, 1498–1502 CrossRef CAS PubMed.
- K. Yamamoto, Y. Iriyama, T. Asaka, T. Hirayama, H. Fujita, C. A. J. Fisher, K. Nonaka, Y. Sugita and Z. Ogumi, Angew. Chem., Int. Ed., 2010, 49, 4414–4417 CrossRef CAS PubMed.
- K. Yamamoto, R. Yoshida, T. Sato, H. Matsumoto, H. Kurobe, T. Hamanaka, T. Kato, Y. Iriyama and T. Hirayama, J. Power Sources, 2014, 266, 414–421 CrossRef CAS.
- R. Shikler, T. Meoded, N. Fried, B. Mishori and Y. Rosenwaks, J. Appl. Phys., 1999, 86, 107–113 CrossRef CAS.
- S. V. Kalinin and D. A. Bonnell, Phys. Rev. B: Condens. Matter, 2000, 62, 10419–10430 CrossRef CAS.
- S. V. Kalinin and D. A. Bonnell, Phys. Rev. B: Condens. Matter, 2004, 70, 235304 CrossRef.
- A. Doukkali, S. Ledain, C. Guasch and J. Bonnet, Appl. Surf. Sci., 2004, 235, 507–512 CrossRef CAS.
- J. A. Hedberg, A. Lal, Y. Miyahara, P. Grütter, G. Gervais, M. Hilke, L. Pfeiffer and K. W. West, Appl. Phys. Lett., 2010, 97, 143107 CrossRef.
- J. Zhu, K. Zeng and L. Lu, J. Appl. Phys., 2012, 111, 063723 CrossRef.
- S. Y. Luchkin, H.-Y. Amanieu, D. Rosato and A. L. Kholkin, J. Power Sources, 2014, 268, 887–894 CrossRef CAS.
- S. C. Nagpure, B. Bhushan and S. S. Babu, J. Power Sources, 2011, 196, 1508–1512 CrossRef CAS.
- M. Nonnenmacher, M. P. O'Boyle and H. K. Wickramasinghe, Appl. Phys. Lett., 1991, 58, 2921–2923 CrossRef.
- S. Sadewasser, in Kelvin Probe Force Microscopy: Measuring and Compensating Electrostatic Forces, ed. S. Sadewasser and T. Glatzel, Springer Berlin Heidelberg, Berlin, Heidelberg, 2011, pp. 7–24 Search PubMed.
- A. Kikukawa, S. Hosaka and R. Imura, Appl. Phys. Lett., 1995, 66, 3510–3512 CrossRef CAS.
- M. Goryl, F. Krok, J. J. Kolodziej, P. Piatkowski, B. Such and M. Szymonski, Vacuum, 2004, 74, 223–227 CrossRef CAS.
- D. S. H. Charrier, M. Kemerink, B. E. Smalbrugge, T. de Vries and R. A. J. Janssen, ACS Nano, 2008, 2, 622–626 CrossRef CAS PubMed.
- V. Panchal, R. Pearce, R. Yakimova, A. Tzalenchuk and O. Kazakova, Sci. Rep., 2013, 3, 2597 Search PubMed.
- C. Delmas, M. Maccario, L. Croguennec, F. Le Cras and F. Weill, Nat. Mater., 2008, 7, 665–671 CrossRef CAS PubMed.
- S. Theil, M. Fleischhammer, P. Axmann and M. Wohlfahrt-Mehrens, J. Power Sources, 2013, 222, 72–78 CrossRef CAS.
- Y. Eguchi, S. Kishimoto and T. Mizutani, Jpn. J. Appl. Phys., 2001, 40, L589 CAS.
- M. Nakayama, S. Goto, Y. Uchimoto, M. Wakihara and Y. Kitajima, Chem. Mater., 2004, 16, 3399–3401 CrossRef CAS.
- M. Nakayama, S. Goto, Y. Uchimoto, M. Wakihara, Y. Kitajima, T. Miyanaga and I. Watanabe, J. Phys. Chem. B, 2005, 109, 11197–11203 CrossRef CAS PubMed.
- D. C. Grahame, Chem. Rev., 1947, 41, 441–501 CrossRef CAS PubMed.
- S. Braun, C. Yada and A. Latz, J. Phys. Chem. C, 2015, 119, 22281–22288 CAS.
- N. Sata, K. Eberman, K. Eberl and J. Maier, Nature, 2000, 408, 946–949 CrossRef CAS PubMed.
- K. Takada, N. Ohta, L. Zhang, X. Xu, B. T. Hang, T. Ohnishi, M. Osada and T. Sasaki, Solid State Ionics, 2012, 225, 594–597 CrossRef CAS.
- Y. Iriyama, C. Yada, T. Abe, Z. Ogumi and K. Kikuchi, Electrochem. Commun., 2006, 8, 1287–1291 CrossRef CAS.
- Y. Iriyama, in Lithium-Ion Batteries, ed. C. R. Park, InTech, Rijeka, 2010, ch. 4, pp. 75–92 Search PubMed.
- K. Nagata and T. Nanno, J. Power Sources, 2007, 174, 832–837 CrossRef CAS.
- J. Xie, N. Imanishi, T. Zhang, A. Hirano, Y. Takeda and O. Yamamoto, J. Power Sources, 2009, 192, 689–692 CrossRef CAS.
- M. Tomita, I. Daigo, K. Matsumoto, Y. Ogata and T. Suzuki, Kyoto, in The 55th Battery Symposium in Japan Abstracts, 2014, p. 398 Search PubMed.
- A. K. Padhi, K. S. Nanjundaswamy and J. B. Goodenough, J. Electrochem. Soc., 1997, 144, 1188–1194 CrossRef CAS.
- K. Amine, H. Yasuda and M. Yamachi, Electrochem. Solid-State Lett., 2000, 3, 178–179 CrossRef CAS.
- J. Fu, J. Am. Ceram. Soc., 1997, 80, 1901–1903 CrossRef CAS.
- S. Patoux and C. Masquelier, Chem. Mater., 2002, 14, 5057–5068 CrossRef CAS.
- B. S. Jeong, Y. W. Heo, D. P. Norton and A. F. Hebard, Physica B, 2005, 370, 46–51 CrossRef CAS.
Footnote |
| † Electronic supplementary information (ESI) available: Fig. S1: Typical charge discharge characteristic of the SS-LIB used in this study, Fig. S2: influence of sample preparation processes on the charge and discharge characteristics. See DOI: 10.1039/c6nr07971g |
| This journal is © The Royal Society of Chemistry 2017 |