
 Open Access Article
 This Open Access Article is licensed under a
 Creative Commons Attribution 3.0 Unported Licence
Chlorogenic acids and the acyl-quinic acids: discovery, biosynthesis, bioavailability and bioactivity†
Michael N.
Clifford
 a,
Indu B.
Jaganath
b,
Iziar A.
Ludwig
c and
Alan
Crozier
*d
a,
Indu B.
Jaganath
b,
Iziar A.
Ludwig
c and
Alan
Crozier
*d
aSchool of Biosciences and Medicine, Faculty of Health and Medical Sciences, University of Surrey, Guildford, UK. E-mail: M.Clifford@surrey.ac.uk
bMalaysian Agricultural Research and Development Institute, Kuala Lumpur, Malaysia. E-mail: indujaganath@gmail.com
cDepartment of Food Technology, University of Lleida, Lleida, Spain. E-mail: Iludwig@alumini.unav.es
dDepartment of Nutrition, University of California, Davis, CA 96616-5270, USA. E-mail: alan.crozier44@gmail.com
First published on 21st November 2017
Abstract
Covering: 2000 up to late 2017
This review is focussed upon the acyl-quinic acids, the most studied group within the ca. 400 chlorogenic acids so far reported. The acyl-quinic acids, the first of which was characterised in 1846, are a diverse group of plant-derived compounds produced principally through esterification of an hydroxycinnamic acid and 1L-(−)-quinic acid. Topics addressed in this review include the confusing nomenclature, quantification and characterisation by NMR and MS, biosynthesis and role in planta, and the occurrence of acyl-quinic acids in coffee, their transformation during roasting and delivery to the beverage. Coffee is the major human dietary source world-wide of acyl-quinic acids and consideration is given to their absorption and metabolism in the upper gastrointestinal tract, and the colon where the microbiota play a key role in the formation of catabolites. Evidence on the potential of the in vivo metabolites and catabolites of acyl-quinic acids to promote the consumer's health is evaluated.
 Michael N. Clifford | Mike Clifford is the Emeritus Professor of Food Safety at the University of Surrey and has investigated the analysis and characterisation, absorption and metabolism of phenols, polyphenols and tannins. He has published several books, including monographs on tea and coffee, over 250 research papers of which over 70 relate to chlorogenic acids. These latter include a new unambiguous nomenclature for the chlorogenic acids, plus several technical reports, citing in excess of 1500 references thereon, that are freely available on Researchgate. In 2009 he was awarded the Mars Prize for his research on “Polyphenol Analysis” at the Fourth International Conference on Polyphenols and Health, in Harrogate, UK. |
 Indu B. Jaganath | Indu Jaganath is a Principal Research Officer at the Malaysian Agricultural Research and Development Institute. She obtained her Master of Science from the University of California, Riverside and her PhD at University of Glasgow. Her research is focused on the discovery of chemically and biologically active natural compounds in tropical plants. Her main expertise lies in the area of metabolomics and nutrigenomics where she incorporates in multidisciplinary approach utilizing transcriptomics, metabolomics, pharmacokinetics and in vivo animal models to gain a holistic approach on how dietary compounds alters metabolism and affect various cellular pathways through gene regulation. |
 Iziar A. Ludwig | Iziar Ludwig obtained a bachelors degree in Food Science and Biotechnology at the University of Natural Resources and Life Sciences (BOKU, Vienna) in 2009 and her PhD in Physiology, Nutrition and Health at the University of Navarra (Pamplona) in 2013. She then work in Alan Crozier's group at the University of Glasgow and is currently a Research Associate at the Antioxidants Group, Department of Food Technology, at the University of Lleida. Her research is focussed on (poly)phenolic compounds in fruits and beverages, their metabolism, bioavailability and potential health effects. |
 Alan Crozier | Alan Crozier is Senior Researcher in the Department of Nutrition at the University of California, Davis and a consultant for Mars Inc. He is also an Honorary Senior Research Fellow in the School of Medicine, Dentistry and Nursing at the University of Glasgow where he was previously Professor of Plant Biochemistry and Human Nutrition. He has published over 300 papers and edited nine books. While retaining an interest in purine alkaloids, his research has centred on dietary flavonoids and related phenolic compounds in fruits, vegetables and beverages and their bioavailability following ingestion. He was elected an Eminent Scientist of RIKEN, the Institute of Physical and Chemical Research in Japan, in 1999 for his achievements in the field of plant hormones and secondary metabolites. In 2013 he was awarded the Mars Prize for his research on “Flavonoid Metabolism/Chemistry” at the Sixth International Conference on Polyphenols and Health, in Buenos Aires, Argentina. He was a Thomson Reuters Highly Cited Researcher in 2014, 2015, 2016 and 2017. |
1 Discovery of chlorogenic acids
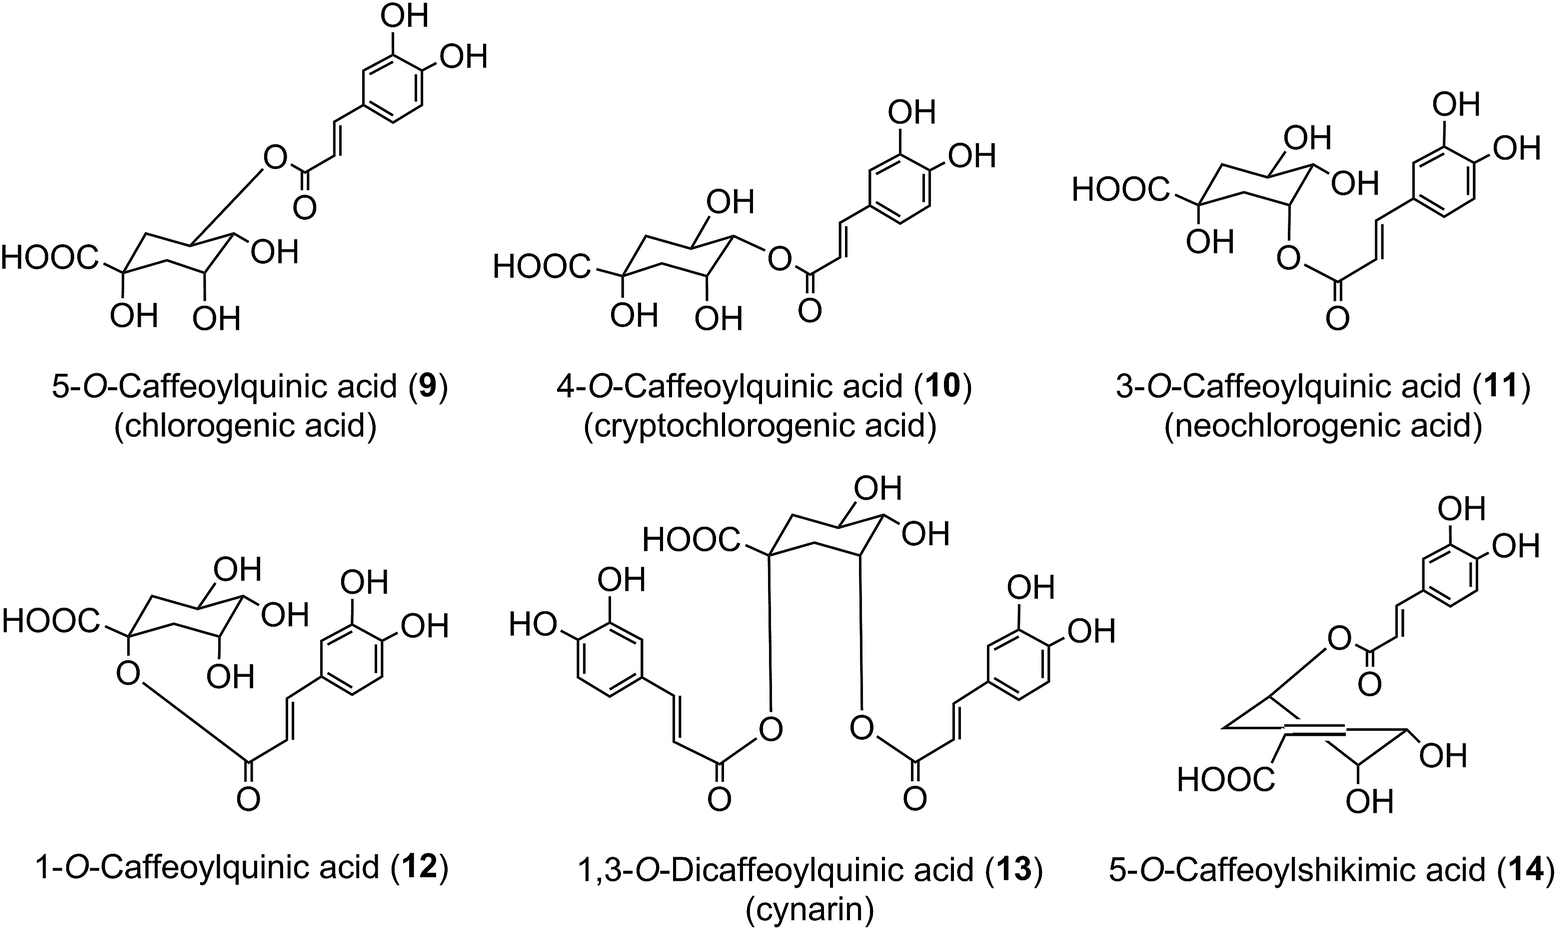
The term ‘chlorogenic acids’ (CGAs) encompasses a large group of naturally-occurring compounds of which the majority are synthesised in planta by esterification of a C6–C3trans-hydroxycinnamic acid with 1L-(−)-quinic acid (1). The main hydroxycinnamates are p-coumaric (2), caffeic (3), ferulic (4) and sinapic acids (5).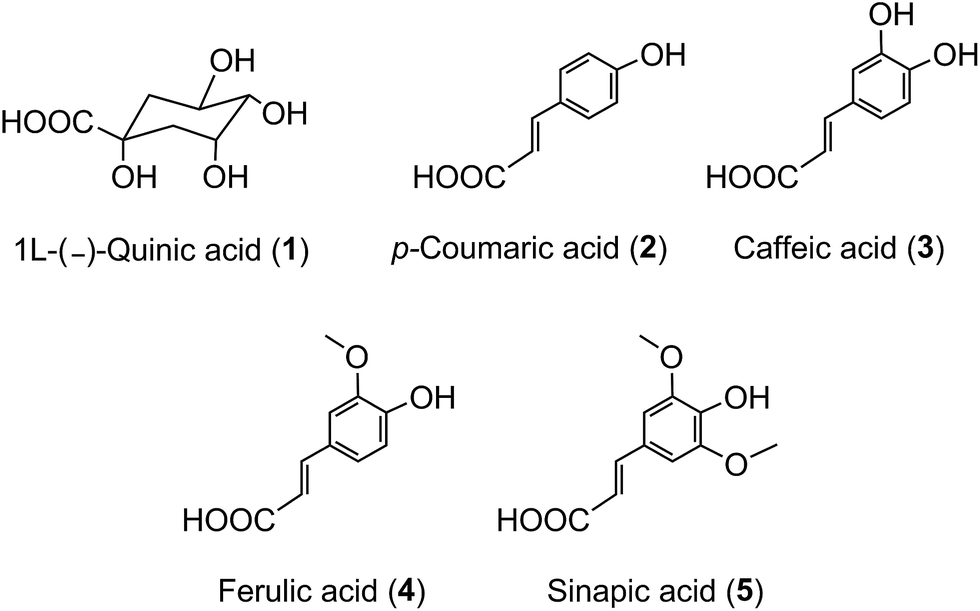
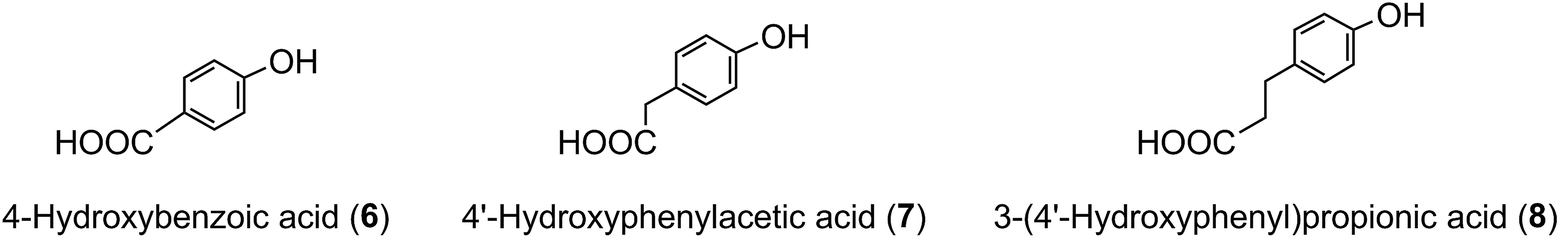
A wider definition of CGAs includes compounds formed with various quinic acid epimers, quinic acid methyl ethers, alkyl quinates, deoxyquinic acid, 2-hydroxyquinic acid and shikimic acid and its epimers, plus the analogous compounds that are esterified with a hydroxybenzoic acid (6), hydroxyphenylacetic acid (7) or 3-(4′-hydroxyphenyl)propionic acid (8). Aliphatic acid substituents may also be present, occasionally in the absence of an aromatic residue. A fuller account of these less common CGAs is available.1
The origin of ‘chlorogenic acid’ is probably related to the use of the term ‘chlorogen acid’ by Payen2,3 in 1846 (1846a, 1846b) who reported the isolation of a crystalline potassium caffeine chlorogenate that formed up to 5% of green coffee (Coffea arabica) beans. He proposed an empirical formula of C14H8O7 which is now known to be C16H18O9, and described its conversion to a green pigment on alkaline oxidation. In retrospect, one can deduce that there were a few earlier studies with the same or a very similar fraction prepared from green coffee beans. The earliest of these appears to be a paper by Robiquet and Boutron in 1837,4 in which they reported the isolation of an acidic substance that turned green when treated with ferric chloride. Rochleder5 isolated an acidic substance from green coffee beans in 1844 that associated with caffeine and which precipitated as a lead salt. In 1846 Rochleder further reported that this fraction was yellow in ammoniacal solution and became green on exposure to oxygen, and suggested C16H9O8 for the free acid.6 It was not until 1907 that pure white crystals were obtained which had a melting point of 206–207 °C, and from which quinic acid (1) and caffeic acid (3) were released by alkaline hydrolysis. An empirical formula of C32H38O19 was proposed in 1908 and to reconcile this with the evidence from hydrolysis Gorter7 proposed that quinic acid combined with caffeic acid to form hemichlorogenic acid, two molecules of which condensed losing one molecule of water to produce chlorogenic acid. This would correspond to an empirical formula of C16H20O10. Freudenberg8 reported in 1920 that chlorogenic acid was a substrate for the enzyme tannase and that hydrolysis released equimolar amounts of quinic acid and caffeic acid. In 1932 Fischer and Dangschat9 proposed that this substance was 3-O-caffeoylquinic acid (3-CQA).
In 1950 Barnes et al.10 reported the presence in coffee of 5-O-caffeoylquinic acid (9) (5-CQA), and over the next 15 years other isomers (10, 11, 12) and several related dicaffeoylquinic acids (diCQAs) were reported from various sources. Cynarin(e), now known to be (1,3-O-dicaffeoylquinic acid (13, 1,3-di-CQA)) from artichoke, characterised in 1954, was the first 1-acyl quinic acid to be reported.11 The same period saw the first reports of galloyl,12,13p-coumaroyl,14,15 feruloyl,16 caffeoyl-feruloyl,17 caffeoyl-succinoyl18 and sinapoyl19 esters of quinic acid. The first papers referring to caffeoylshikimic acids (14) were published by Maier et al. in 1964.20 During the last quarter of the 20th century, improvements in chromatographic procedures and the development of higher resolution NMR led to a steady increase in the number of CGAs and in the number of species in which they were found.21–29 With the arrival of the ion trap mass spectrometer coupled to HPLC in the first decade of the 21st century the total number of identified naturally occurring CGAs has increased markedly.30–33 Taking the wider definition of CGAs, and including non-food sources, over 400 CGAs have been reported in over 400 genera embracing some 44 botanical orders.34 This review will focus on the acyl-quinic acids which are the most studied of the extended CGA family.
Acyl-quinic acids are widespread dietary components being found, for instance, in coffee, cherries (Prunus avium), blueberries (Vaccinium spp.), aubergine (Solanum melongena), apples (Malus pumila) oregano (Origanum vulgare), spearmint (Mentha spicata), chicory (Cichorium intybus) and sunflower (Helianthus annus) seeds28,35–39 with high levels in globe artichoke.40,41 The herbal tea maté, made from infusion of dry leaves of Ilex paraguariensis, contains substantial amounts of CQAs and diCQAs (Table 1).42 Coffee beverage, rather than fruits and vegetables is probably the main dietary source of CQAs for many people with intakes in excess of 1 g per day being readily attained.43
| Product | Serving | Dose | Reference | |
|---|---|---|---|---|
| μmol | mg | |||
| a Data expressed as mean values (n = 3). | ||||
| Espresso coffee | 27 mL | 68 | 24 | Crozier et al.43 |
| 52 mL | 1195 | 422 | Crozier et al.43 | |
| Instant coffee | 200 mL | 412 | 146 | Stalmach et al.44 |
| Cloudy apple juice | 200 mL | 72 | 25 | Kahle et al.45 |
| Apple smoothie | 200 mL | 96 | 34 | Hagl et al.46 |
| Globe artichoke | 100 g | 762 | 268 | Pandino et al.41 |
| Maté | 200 mL | 270–320 | 94–111 | Clifford and Ramìrez-Martìnez42 |
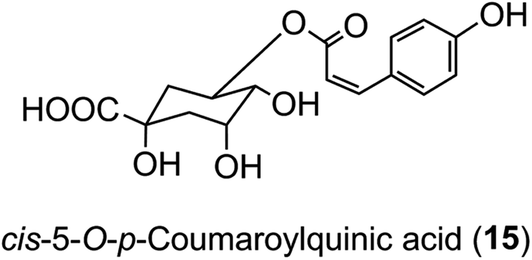
The hydroxycinnamic acid moiety of acyl-quinic acids is predominantly in the trans form. Some cis isomers are known, with cis-5-O-p-coumarylquinic acid (15) being detected in flower buds of herbal aster (Aster ageratoides Turcz).47 and a wide range of cis-isomers have now been detected in other species.34 It has been suggested that the cis derivatives originate from plant tissues where the trans isomer has been exposed to relatively strong UV-irradiation which induces geometric isomerisation.48 There is good experimental evidence to support this view.49 However, direct synthesis cannot be ruled out, and there is some evidence from research with cell culture to suggest that UV-irradiation is not essential.50
2 Nomenclature
Acyl-quinic acids exhibit configurational isomerism, conformational isomerism and regio-isomerism, plus geometric isomerism for those containing a cinnamic acid residue. Consequently, it is not easy to describe unambiguously the structures of acyl-quinic acids that may appear almost identical when drawn in 2D or projected in 3D. Various systems for cyclitols were evaluated by IUPAC who recommended that the most common natural form of quinic acid be described as 1L-1(OH),3,4/5-tetrahydroxycyclohexanecarboxylic acid, with the trivial names (−)-quinic acid or L-quinic acid.51 In the IUPAC system, Fischer and Dangschatt's 3-CQA9 became 5-CQA (9).Unfortunately, papers are still published in which non-IUPAC numbering is used, the numbering system used is not stated, or worse, the numbering is IUPAC but the structure shown is not, or vice versa. Kremr et al.52 commented that some published structures make no attempt to depict the spatial arrangement of the substituents, and Clifford recorded that some authors discuss previously published data unaware that different numbering systems have been used, for example 3-CQA (non-IUPAC) and 3-CQA (IUPAC) are treated as the same compound.34,53 Note that Wikipedia and many other online sources, plus many catalogues listing acyl-quinic acid preparations, use non-IUPAC nomenclature. Many examples of misleading or incorrect descriptions have been compiled.1,34,53 For the avoidance of doubt, the IUPAC and non-IUPAC structures are presented in Fig. 1. From this point onwards the IUPAC numbering system will be used in this review. Trivial names further complicate the literature but a glossary is available,1,54 and this is presented as Table S1 in the ESI.† To this must be added chrysanthemorimic acids, a series of recently discovered diCQAs, in which one caffeic acid residue has undergone a [5 + 2] cycloaddition of D-glucose.55
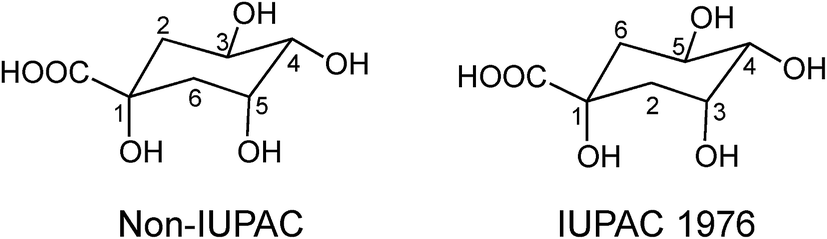 | ||
| Fig. 1 Non-IUPAC and IUPAC numbering of 1L-(−)-quinic acid. | ||
The IUPAC system, however, has limitations when applied to acyl-quinic acids and Abrankó and Clifford54 have proposed a combination of IUPAC cyclitol numbering51 the Cahn–Ingold–Prelog (CIP) sequence rules56 plus the use of α to define a hydroxyl trans to the quinic acid carboxyl (and β to define a hydroxyl cis to the quinic acid carboxyl) to describe the orientation of a substituent on a carbon atom which is not a centre of chirality, as favoured by Eliel and Ramirez.57 This approach can accommodate all eight quinic acid stereo-isomers, with, for example, IUPAC (−)-quinic acid described as 1L-(−)-quinic acid 3R,5R-(1α,3α,4α,5β).54 ESI Table S2† provides a comprehensive set of structures for the various quinic acids, which in addition to using different styles of presentation (Fischer–Tollens, 2D, alternative chair conformations), also considers the perspective from which a structure is viewed.
3 Characterisation and quantification of acyl-quinic acids
This section of the review draws on three open-access documents which contain extensive tabulations and discussion of the topics presented here.1,53,563.1 Extraction
Extraction of acyl-quinic acids from plant material generally employs aqueous alcohol, usually 70% MeOH. Artefacts may arise from acyl migration, alkylation, hydrolysis, water addition across the cinnamic acid double bond and/or trans–cis isomerisation.59 Acyl migration is favoured by higher water content in the solvent and sample, and when extracting undried plant material 100% MeOH is advisable for the first stage, especially if 1,5-diCQA might be present, as it rapidly converts to 1,3-diCQA. In contrast, controlled acyl migration and partial hydrolysis can usefully generate regio-isomers that are not otherwise conveniently available (e.g. 1,4-diCQA, 1-CQA),26,60,61 as can UV-irradiation for preparing cis-isomers.48 Any novel acyl-quinic acid should be examined by controlled acyl migration in order to access associated regio-isomers.3.2 1H-NMR
Acyl-quinic acids can be characterised by 1H-NMR, but this has limitations.53,63–65 The definitive studies of Pauli et al.,63,64 and the data tabulated by Clifford,53 show that if best practice is followed, mono- and di-acyl-quinic acids can be successfully identified – d4-MeOH is the preferred solvent, to which a small amount of D2O or d6-DMSO (not exceeding 10%) can be added, followed by analysis at not less than 500 MHz. Identification of the acyl residue(s) is straightforward, assignment of the quinic acid configuration and the position(s) of acylation less so, because signals for H2 and H6 methylenes and H3 and H5 methines often overlap, especially in tri- or tetra-acyl-quinic acids, and/or when an aliphatic substituent is present.Temperature, analyte concentration, and especially solvent influence the proton chemical shifts, the order in which the shifts occur, and the conformation of the quinic acid moiety, and hence the coupling constants for the relevant protons.63,64,66 Incomplete signal resolution, producing inaccurate coupling constants, has generated unconvincing structural assignments, notably reports of acyl-quinic acids containing a stereo-isomer of 1L-(−)-quinic acid.67–73
These novel compound(s) are rarely observed in company with a full set of the commoner 1L-(−)-quinic acid derivatives. This does not per se refute the claim, but might suggest that one of the commoner acyl-quinic acids has been wrongly identified. Reports by Wang et al.74,75 of an acyl-iso-quinic acid (= 4,5-diC-epi-QA IUPAC) are convincing because the quinic acid moiety released by saponification did not co-chromatograph with 1L-(−)-quinic acid, and subsequent 500 or 600 MHz NMR in d4-MeOH is distinctive.75,76 The biosynthesis of 1L-(−)-epi-quinic acid requires only that D-threose-4-phosphate replace D-erythrose-4-phosphate in the pathway to 1L-(−)-quinic acid.58 There are LC-MS data for four incompletely characterised CQA,32,77 which plausibly are derivatives of a quinic acid isomer. NMR data are available for 3-C-muco-QA and 3-F-muco-QA,78 plus (±)-epi-quinic acid and scyllo-quinic acid.79–81
3.3 Chromatography
A reverse-phase LC column packing and shallow linear solvent gradient providing structure-diagnostic relative capacity factors or relative retention times (RRTs) is the best strategy for characterising acyl-quinic acids. Once characterised, a revised gradient may speed up the separation for routine use. The behaviour of acyl-quinic acids is determined by (i) orientation of the free quinic acid hydroxyls, and (ii) number and hydrophobicity of the acyl moieties. For a given acyl moiety, 1-acyl and 3-acyl regio-isomers (two free equatorial hydroxyls) are well-resolved from the 4-acyl and 5-acyl regio-isomers (two free axial hydroxyls). 1-Acyl regio-isomers almost always elute first, but 4-acyl and 5-acyl regio-isomers vary with column packing. Similarly 1,3-diacyl regio-isomers (two free equatorial hydroxyls) elute first and 4,5-diacyl regio-isomers elute last (two free axial hydroxyls). The other four diacyl regio-isomers elute close together just before the 4,5-diacyl isomer, but their sequence varies with column packing.31,82 For diacyl-quinic acids with different substituents, the isomer with the more hydrophilic substituent more equatorially positioned, elutes first.58Relative to free quinic acid, acylation delays elution. Cinnamic and benzoic acids with more ring hydroxyls elute faster, and for a given number of ring substituents, methylation of the hydroxyl slows elution, i.e. for a given regio-isomer the sequence is CQA, p-coumaroylquinic acid (pCoQA), feruloylquinic acid (FQA), and (3′,4′-dimethoxycinnamoyl)quinic acid (DQA), etc. cis-3-Cinnamoyl and cis-4-cinnamoyl elute before their trans-counterparts but cis-5-cinnamoyl elute later. The methyl esters of the mono-acyl-quinic acid regio-isomers, but not the diacyl-quinic acid regio-isomers, elute in the reverse order compared with the free acids.83 Glycosidation of the acyl moiety markedly speeds the elution. Although the presence of an aliphatic dicarboxylic acid, e.g. succinic acid, may speed elution the behaviour is less predictable because of internal hydrogen bonding in some regio-isomers.84
With that exception, these RRTs are sufficiently consistent to be used as a structure-diagnostic tool, easily locating cis-5-CQA which is often reported as trans-1-CQA,85–89 and early-eluting CQA-glycosides which are often reported as diCQA.90,91 RRT values should always be considered when assigning the structure of a novel acyl-quinic acid.
3.4 LC-MS
Mass spectroscopy was long considered blind to isomers but the development of LC-ion trap-MS changed perceptions,92 especially with regard to acyl-quinic acids,58 for which negative ion MS is preferable. The methods and hierarchical keys developed by Clifford and Kuhnert using mild fragmentation conditions produce distinctive patterns at MS2, MS3 and MS4, allowing regio-isomers to be assigned confidently. Critically, these methods have been applied successfully to previously unknown acyl-quinic acids. The geometric isomers of cinnamoyl-quinic acids fragment identically,48 but the cis-isomers can be distinguished by UV-irradiation,62 sodium-adduct MS,93 and ion mobility-MS.94 Using the hierarchical keys it is possible to identify at regio-isomer level in excess of 20 acyl-quinic acids in a single run subject to adequate analyte concentration.31,77,78,83,95–115 It is false economy to characterise CGAs and flavonoids in a single run, because flavonoids require harsher MS conditions which mask the structure-diagnostic fragmentations of the acyl-quinic acids, and invalidate the hierarchical keys.The hydrogen-bonding networks responsible for these distinctive fragmentations have been deduced.58 For some regio-isomers the charge may be on a phenolic hydroxyl rather than the quinic acid carboxyl.116 Accurate mass may be helpful, but is not essential to distinguish diCQA from CQA-glycosides because the glycosides yield characteristic MS2 ions (m/z 341 and 323)84 the latter as the base peak indicating a 3′-glycoside.103,107 TriCQA, diCQA-glycosides and CQA-biosides, as well as acyl-isocitric acids and acyl-quinic acids, can be distinguished similarly, but only fragmentation can distinguish between isobaric methyl-CQ, FQA and isoFQA, and acyl-quinides and acyl-shikimic acids.58 Methyl-CQ and methyl-diCQ fragment very differently from CQA and diCQA,83 which coupled with the ‘reversed’ order of elution for the methyl CQ, necessitates care in regio-isomer assignment. Reports of FQA and caffeoyl-feruloylquinic acids (CFQA) producing fragments at m/z 179 or m/z 161, but not m/z 193 or m/z 367, might be methyl-CQ and methyl-diCQ.117–120
Full assignment of tri-acyl- and tetra-acyl-quinic acids requires MS4 and perhaps MS5 spectra, particularly where there are two or more different acyl moieties (e.g. dicaffeoyl-feruloylquinic acids or caffeoyl-sinapoyl-feruloylquinic acids). MS8 is required to characterise depsidic GQA bearing up to eight galloyl residues.98 Targeted rather than automated fragmentation may be essential with more complex structures such as 4-methoxyoxalyl-1,5-dicaffeoylquinic acid and 4-methoxyoxalyl-3,5-dicaffeoylquinic acid,112 or when a ‘dehydrated’ base peak (e.g. m/z 349 rather than m/z 367) occurs, more frequent with increasing methylation of the acyl moieties.58,102
These structure-diagnostic protocols were developed using a ThermoFinnigan LCQ deca+ or a Bruker Daltronics HCT Ultra ion trap mass spectrometer, but should be easily transferred to similar instruments provided that the ionisation potential and fragmentation energy are appropriate. Even on the instruments originally used changes to the instrument parameters, such as increasing the ion spray voltage from 3.5 kV to 4.5 kV, generates many additional fragments and invalidates the hierarchical keys as published.121,122
Some investigators have reported that with QTOF-MS all CQA regio-isomers fragment identically.123,124 However, Madala and co-workers have demonstrated that with careful control of the collision energy it is possible to obtain the same MS2 and MS3 fragmentation data as an ion trap.125,126 When adapting the ion trap-MS hierarchical key methods to a non-ion trap-MS, a surrogate standard, such as a green coffee extract,127 should be analysed and operating parameters adjusted until identical fragmentations are achieved.58 Whatever equipment is used there is scan-to-scan variation in fragment intensity, being most prominent for weak signals, i.e. low analyte concentrations, and higher order spectra, and for a reliable assignment at least 20 scans should be taken. If necessary use a more concentrated extract or larger injection.
Only limited success has been achieved with triple quadrupole instruments because of the much increased fragmentation energy employed. Matsui et al. successfully fingerprinted several CQA, FQA and diCQA regio-isomers using two different collision energies in positive ion mode (15 and 30 eV) and three different collision energies in negative ion mode (20, 40 and 60 eV),128 but this is too cumbersome for routine use. Similar limitations are apparent in the methods reported by Lin and Harnly,129,130 and Willems et al.131
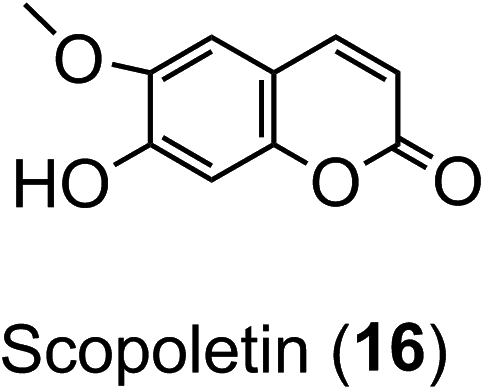
Ion-trap-MS has its limitations, most apparent where there is an aliphatic dicarboxylic acid substituent (e.g. succinic acid) because the fragmentations can be driven also by the distal carboxyl of that substituent in addition to the quinic acid carboxyl.84,95,111,112 Reproducible fingerprints are obtained, but even with targeted fragmentations, full regio-isomeric assignment is not always possible.58 Scopoletin (16) and the CQAs are indistinguishable by accurate mass, and there are currently insufficient fragmentation data for scopoletin to judge whether it could easily be distinguished.58
3.5 Calibrants
Quantification requires one or more pure calibrants. The molar absorbance of any set of acyl-quinic acid regio-isomers differs comparatively little, e.g. CQA ± 4% of mean (18![[thin space (1/6-em)]](https://www.rsc.org/images/entities/char_2009.gif) 500), pCoQA ± 2.5% of mean (20400), FQA ± 2.5% of mean (19000) and diCQA ± 6% of mean (33300). A good quality 5-CQA (for which the molar absorbance should be quoted) can be used for all of the foregoing with arithmetic corrections for the subgroups if required, although this is only significant for the diCQA and other acyl-quinic acids with two or more aromatic substituents.
500), pCoQA ± 2.5% of mean (20400), FQA ± 2.5% of mean (19000) and diCQA ± 6% of mean (33300). A good quality 5-CQA (for which the molar absorbance should be quoted) can be used for all of the foregoing with arithmetic corrections for the subgroups if required, although this is only significant for the diCQA and other acyl-quinic acids with two or more aromatic substituents.
In contrast to molar absorbance values obtained after meticulous purification with corrections for ash content, water content, etc., published calibration curve response factors for acyl-quinic acids can vary by some 300%, indicating that these commercial preparations are far from pure, containing non-UV-absorbing salts, solvents, etc.58 Such preparations are unsuitable for quantitative analysis. Some commercial standards are incorrectly described at regio-isomer level,1 and use of surrogate standards such as a green coffee extract, an alcoholic cider, or artichoke extract, characterised by LC-MS fragmentation and relative retention times should be considered.130
4 Biosynthesis of acyl-quinic acids
The initial steps in the biosynthesis of CQAs are via the phenylpropanoid pathway and the enzymes catalysing the conversions that produce 5-CQA (9) are well established but there is less clarity about the later stages of the pathway leading from 5-CQA to other acyl-quinic acids.The conversion of phenylalanine to p-coumaroyl-CoA, with cinnamic acid and p-coumaric acid acting as intermediates, is catalysed sequentially by phenylalanine ammonia lyase (PAL), cinnamate 4′-hydroxylase (C4H) and 4-cinnamoyl-CoA ligase (4CL) (Fig. 2). PAL is encoded by a multi-gene family and typically exists as multiple isoforms in plants, ranging from a few members, such as three in Arabica coffee (Coffea canephora),132 four in Arabidopsis thaliana, and nine in rice (Oryza sativa)133 to more than a dozen copies in tomato (Lycoperscion esculentum).134 Individual PAL isoforms might be associated with specific metabolic activity during plant growth and development, and in plant–environment interactions.135 In western balsam poplar (Populus trichocarpa), there are five genes (PtrPAL1–5) that are differentially expressed. PtrPAL2, 4 and 5 are mainly expressed in xylem and root tips, predominantly responsible for the production of lignin while PtrPAL1 and 3 are responsible principally for the production of condensed tannins.136 However, in plants such as tomato, most of the isoforms of PAL present are functionally redundant and underutilized. There are 20 PAL-encoding genes in tomato but only one is expressed strongly throughout the plant with others being silenced.134 Since PAL is the entry point enzyme, its control and regulation is crucial to mediate carbon flux from primary metabolism into biosynthesis of acyl-quinic acids. The regulation of PAL have been shown to occur at multiple levels, and has been reviewed in detail by Zhang and Liu.135
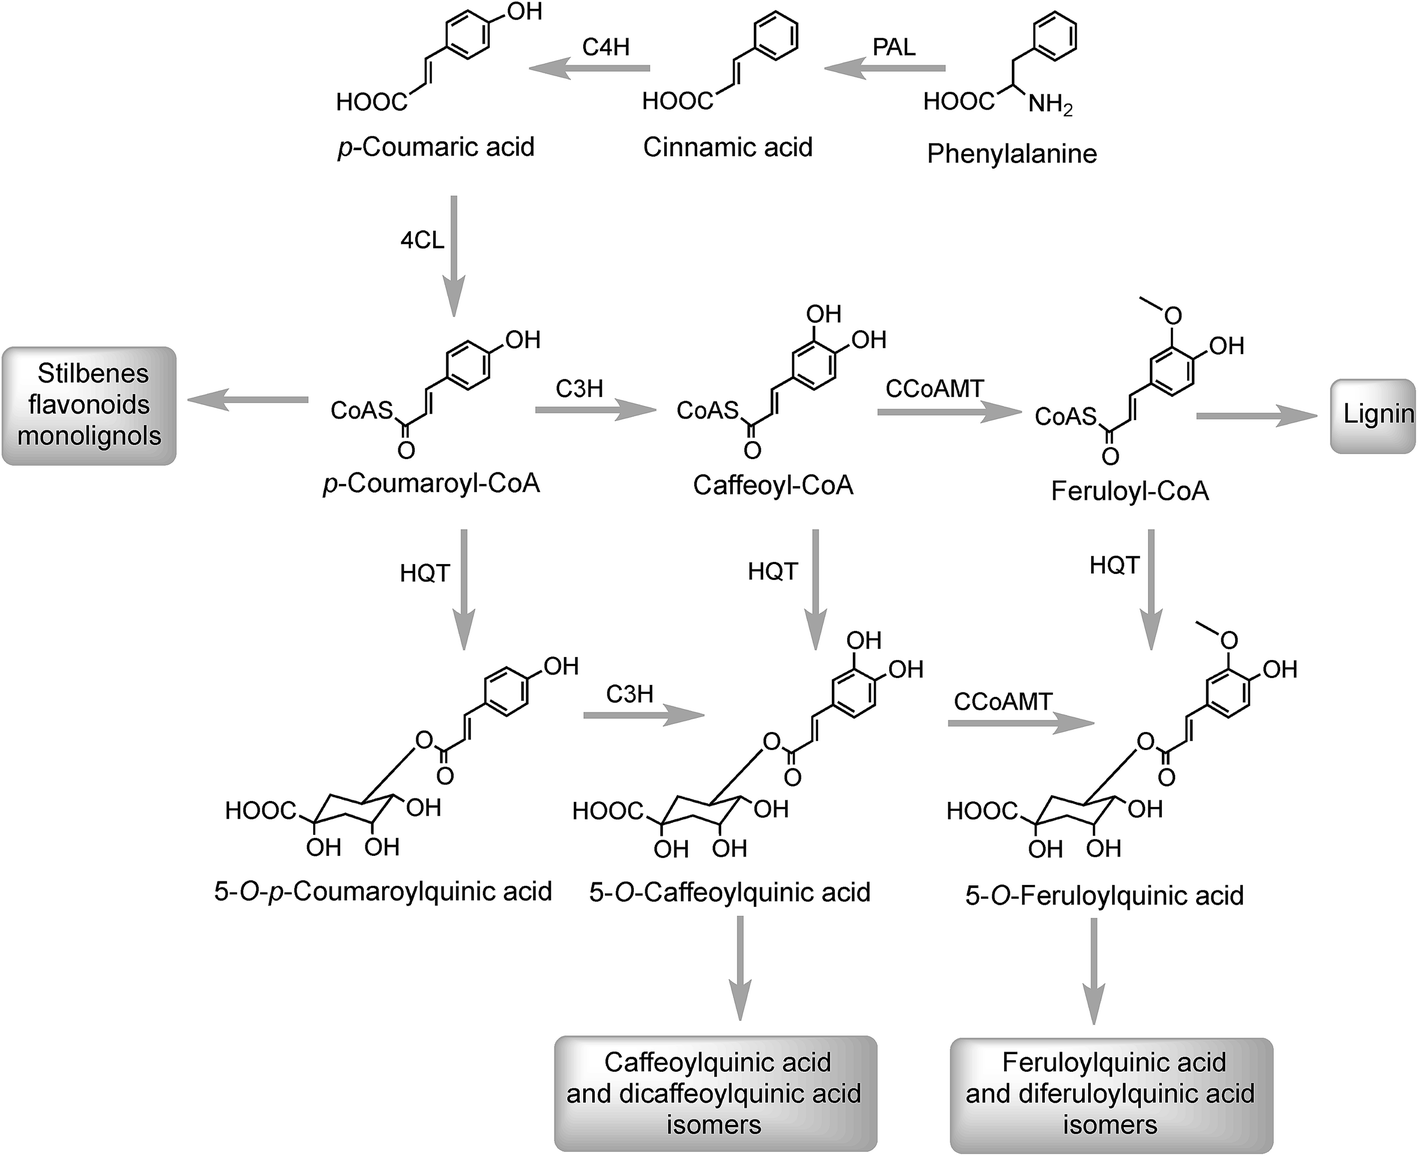 | ||
| Fig. 2 5-O-Caffeoylquinic acid biosynthesis pathways. Enzymes: phenylalanine ammonia lyase (PAL), cinnamate 4′-hydroxylase (C4H), 4-cinnamoyl CoA ligase (4CL), hydroxycinnamoyl CoA:quinate hydroxycinnamoyl transferase (HQT), p-coumaroyl-3′-hydroxylase (C3H), and caffeoyl-CoA-3-O-methyltransferase (CCoAMT). | ||
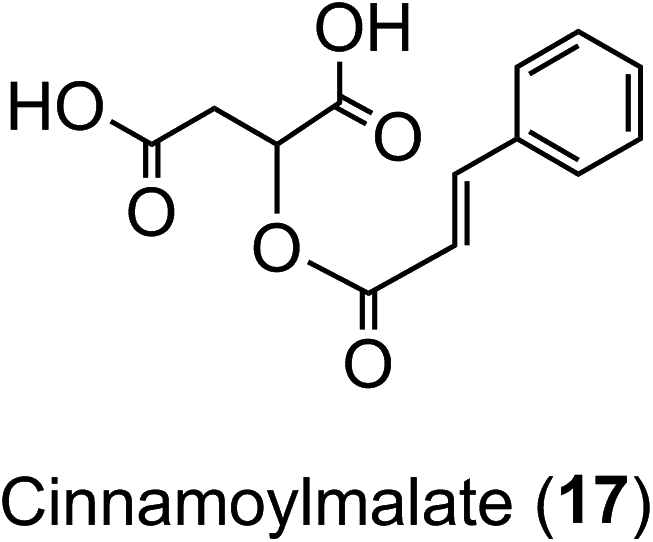
In Arabidopsis thalania the C4H catalysing the 4′-hydroxylation of cinnamic acid to p-coumaric acid (Fig. 2) is encoded by a single gene, mutation of which causes a dwarf phenotype, male sterility and swellings at branch junctions, and also results in the accumulation of cinnamoylmalate (17), which is not found in wild-type plants.137 However, when the gene encoding C4H in sweet sagewort (Artemisia annua) was silenced through RNAi technology, it caused accumulation of cinnamic acid accompanied with significant reductions in p-coumaric acid (1), total phenolics and anthocyanins, highlighting its role as a major flux controlling enzyme in the phenylpropanoid pathway (Kumar et al. 2016).138 The next step in the pathway is the conversion of p-coumaric acid to p-coumaroyl-CoA catalysed by a small gene family of 4CL ligases (Fig. 2). p-Coumaroyl-CoA is a key branch point in phenylpropanoid biosynthesis acting as the immediate precursor of flavonoids and stilbenes, as well as being channeled into the production of methoxy guaiacyl- and syringyl-monolignols.139 Four isoforms of 4CL have been identified in Morus notabilis (mulberry)140 and Arabidopsis.141 The subcellular localization of specific isoforms of 4CL plays a central role in redirecting the biosynthetic pathway either towards the p-coumaroyl-CoA or towards other branch points in the phenylpropanoid pathway.141
The conversion of p-coumaroyl-CoA to 5-CQA involves the enzymes hydroxycinnamoyl CoA:quinate hydroxycinnamoyl transferase (HQT) and a cytochrome P450 oxidase p-coumaroyl-3′-hydroxylase (C3H) (Fig. 2). The HQT-catalysed metabolism of p-coumaroyl-CoA produces 5-O-p-coumaroylquinic acid (5-pCoQA) which then undergoes C3H-mediated 3′-hydroxylation to yield 5-CQA. Alternatively, C3H-mediated hydroxylation of p-coumaroyl-CoA produces caffeoyl-CoA which is then converted to 5-CQA via the action of HQT (Fig. 2). Two HQT-encoding genes have been isolated from globe artichoke and when expressed in Escherichia coli each produced a recombinant protein, HQT1 and HQT2, with acyltransferase activity. Kinetic data and in silico homology modeling and docking analyses suggested that the two enzymes may be involved in different steps in the 5-CQA biosynthesis pathway with HQT1 catalysing the esterification of caffeoyl-CoA with quinic acid to produce 5-CQA, and HQT2 being involved in the conversion of p-coumaroyl-CoA to 5-pCoQA (Fig. 2).142 This esterification is reversible. However, as a result of the genome-wide identification of BAHD acyltransferases in globe artichoke, a third isoform of HQT enzyme was detected.143 When HQT1 was subjected to virus-induced gene silencing, a marked reduction of both CQAs and diCQAs occurred. In contrast, transient overexpression of all three isoforms in leaves of Nicotiana benthamiana had the opposite effect,63 highlighting the role of all three isoforms in the production of acyl-quinic acids.
5-CQA (9) is the dominant regio-isomer in most plants. However, most species also contain 4-CQA (10) and 3-CQA (11), while 1-CQA (12) is present in a limited number of plants, and 3-CQA is the dominant isomer in some species, most notably in plums (Prunus sp.) belonging to the Rosaceae family,27 and some Brassicaceae.144 From an enzymic perspective information is available only on the biosynthesis of 5-CQA (9) and the perceived wisdom is that other CQAs are derived from 5-CQA although there are no data on the seemingly specific isomerases involved in such conversions. Little is also known about the biosynthesis of di- and triCQAs or acyl-quinic acids containing substituents other than caffeic acid (3), although the in vitro synthesis of diCQAs from 5-CQA and CoA, mediated by a recombinant HCT enzyme cloned from coffee, has been reported.145 In tomato, the enzyme HQT converted 5-CQA to diCQAs in vitro. It was proposed that the HQT enzyme has a dual role in vivo catalysing different reactions in two subcellular compartments: in the cytoplasm acting as a quinate transferase while in the vacuole favouring chlorogenate:chlorogenate transferase (acyl-quinate:acyl-quinate transferase) activity producing diCQA.146
Research with globe artichoke, switchgrass (Panicum virgatum) and chicory has established a further route to acyl-quinic acids that contains a shikimic acid shunt142,147 It involves an hydroxycinnamoyl-CoA:shikimate hydroxycinnamoyl transferase (HCT1; EC 2.3.1.133), or possibly two such enzymes in switchgrass148 that catalyse the conversion of p-coumaroyl-CoA to 5-O-p-coumaroylshikimic acid, which is further converted to 5-O-caffeoylshikimic acid (dactylifric acid) by p-coumaroylshikimate-3′-hydroxylase (C3H) (Fig. 3). The caffeoylshikimate so generated could be converted to caffeoyl-CoA by an HCT acting in the reverse direction. In vivo functional analysis of the gene encoding HCT from chicory when transiently overexpressed in tobacco confirmed the involvement and the role of HCT in this step.147 Alternatively a caffeoylshikimate esterase could release caffeic acid which is converted to caffeoyl-CoA by a ligase. Conversion of caffeoyl-CoA to 5-CQA in globe artichoke and other dicots probably involves an HQT.143,147 The gene encoding this enzyme is not present in switchgrass and phylogenetic analysis suggests that in monocots the conversion may be catalysed by enzymes more closely related to HCT than HQT (Fig. 3).148
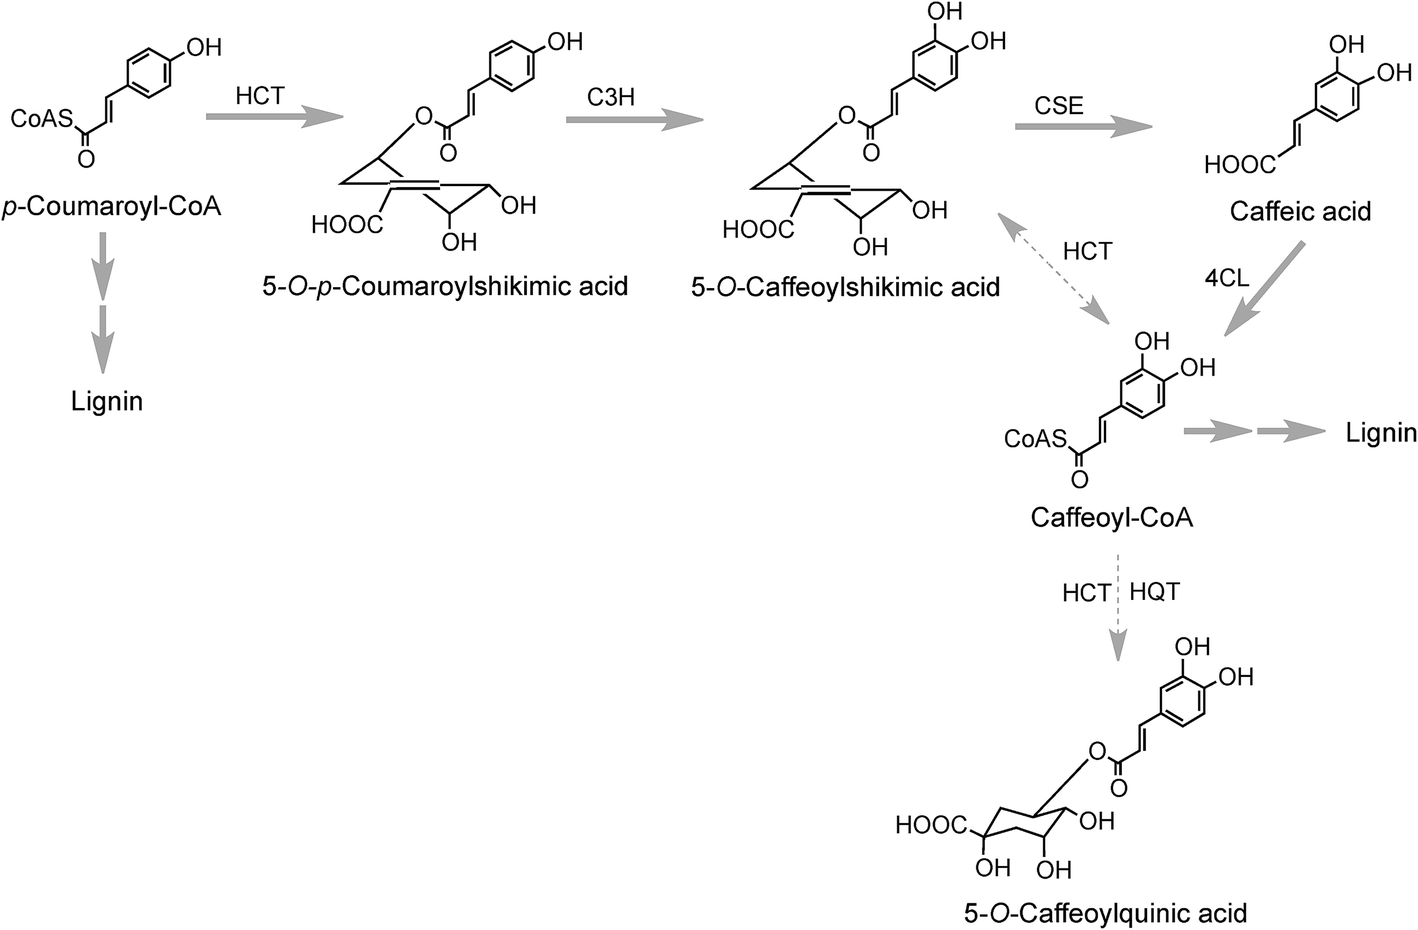 | ||
| Fig. 3 5-O-Caffeoylquinic acid biosynthesis by a shikimate shunt. The likely main routes are indicated with bold arrows and minor routes with dotted arrows. Enzymes: hydroxycinnamoyl-CoA:shikimate hydroxycinnamoyl transferase (HCT), p-coumaroyl-3′-hydroxylase (C3H), caffeoylshikimate esterase (CSE), 4-cinnamoyl CoA ligase (4CL), hydroxycinnamoyl CoA:quinate hydroxycinnamoyl transferase (HQT). | ||
As far as the production of FQAs, such as 5-FQA is concerned, cDNA encoding S-adenosyl-L-methionine:caffeoyl-CoA-3-O-methyltransferase (CCoAOMT) an enzyme which catalyses the conversion of caffeoyl-CoA to feruloyl-CoA (Fig. 2) has been cloned from oats (Avena sativa)149 and other plants, including Coffea species.150 Although the main role of the CCoAOMT family was initially ascribed to lignin biosynthesis,151 other studies have indicated its multifunctional role in catalysing steps in other biosynthetic pathways including those producing the coumarin, scopoletin (16),152 anthocyanins153 and other flavonoids.154 In the scopoletin biosynthetic pathway, a recombinant CCoAOMT1 protein possessed methylating activity in vitro targeting caffeoyl-CoA and converting it to feruloyl-CoA.152
A third pathway to 5-CQA from cinnamic acid has been proposed on the basis of data obtained with tubers of sweet potato (Ipomoea batatas Lam.) which converted [2-14C]cinnamic acid to a radiolabeled intermediate that was metabolized to 5-CQA and further converted to 3,5-diCQA155 both of which are major native acyl-quinic acids in sweet potato.156 The radiolabeled intermediate was identified as 1-O-cinnamoyl-glucose157 and it was proposed that it was converted to 5-CQA via 1-O-p-coumaroyl-glucose and 1-O-caffeoyl-glucose as illustrated in Fig. 4.157,158 Enzymes which catalyse the first three steps in this postulated pathway, a UDP-glucose:cinnamate glucosyltransferase,159 a p-coumaroyl-glucose hydroxylase160 and a hydroxycinnamoyl glucose:quinate hydroxycinnamoyltransferase have been detected in sweet potato roots.158,161 In addition, a partially purified enzyme has been isolated from sweet potato which catalyses the single step conversion of 5-CQA to 3,5-diCQA.162
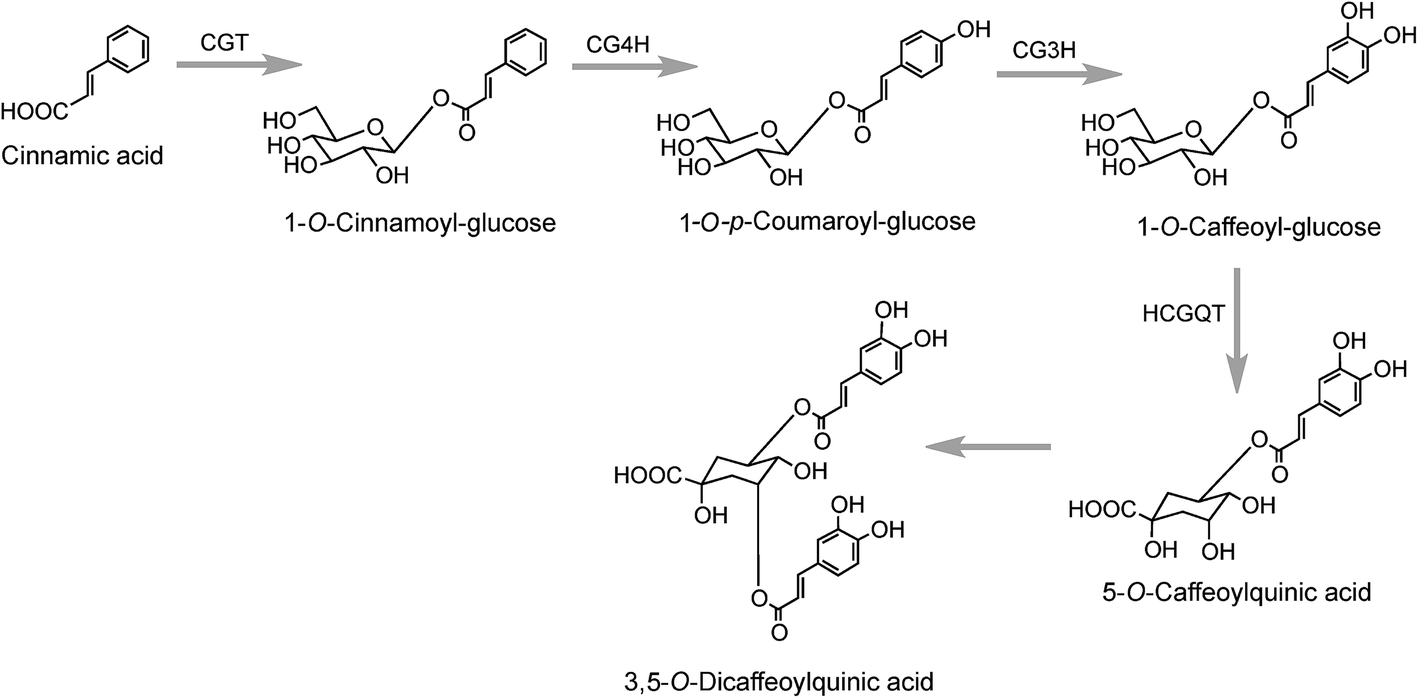 | ||
| Fig. 4 Proposed pathway for the biosynthesis of 5-O-caffeoylquinic acid in sweet potato. Enzymes: UDP-glucose:cinnamate glucosyltransferase (CGT), cinnamate-glucose 4′-hydroxylase (CG4H), p-coumaroyl-glucose 3′-hydroxylase (CG3H) and hydroxycinnamoyl glucose:quinate hydroxycinnamoyltransferase (HCGQT). | ||
The production of cinnamoyl-glucose has also been reported in strawberry (Fragaria × ananassa) where a cDNA encoding a UDP-glucose:cinnamate preferentially catalysed cinnamic acid in vitro. The cDNA transcript was found to accumulate during strawberry fruit ripening and this positively correlated with the in planta concentration of cinnamoyl, p-coumaroyl-, and caffeoyl-glucose.163 Similar results were obtained when the gene encoding this enzyme was overexpressed in transgenic Populus where it led to accumulation of hydroxycinnamate glucose esters which further increase under N-limiting conditions.164
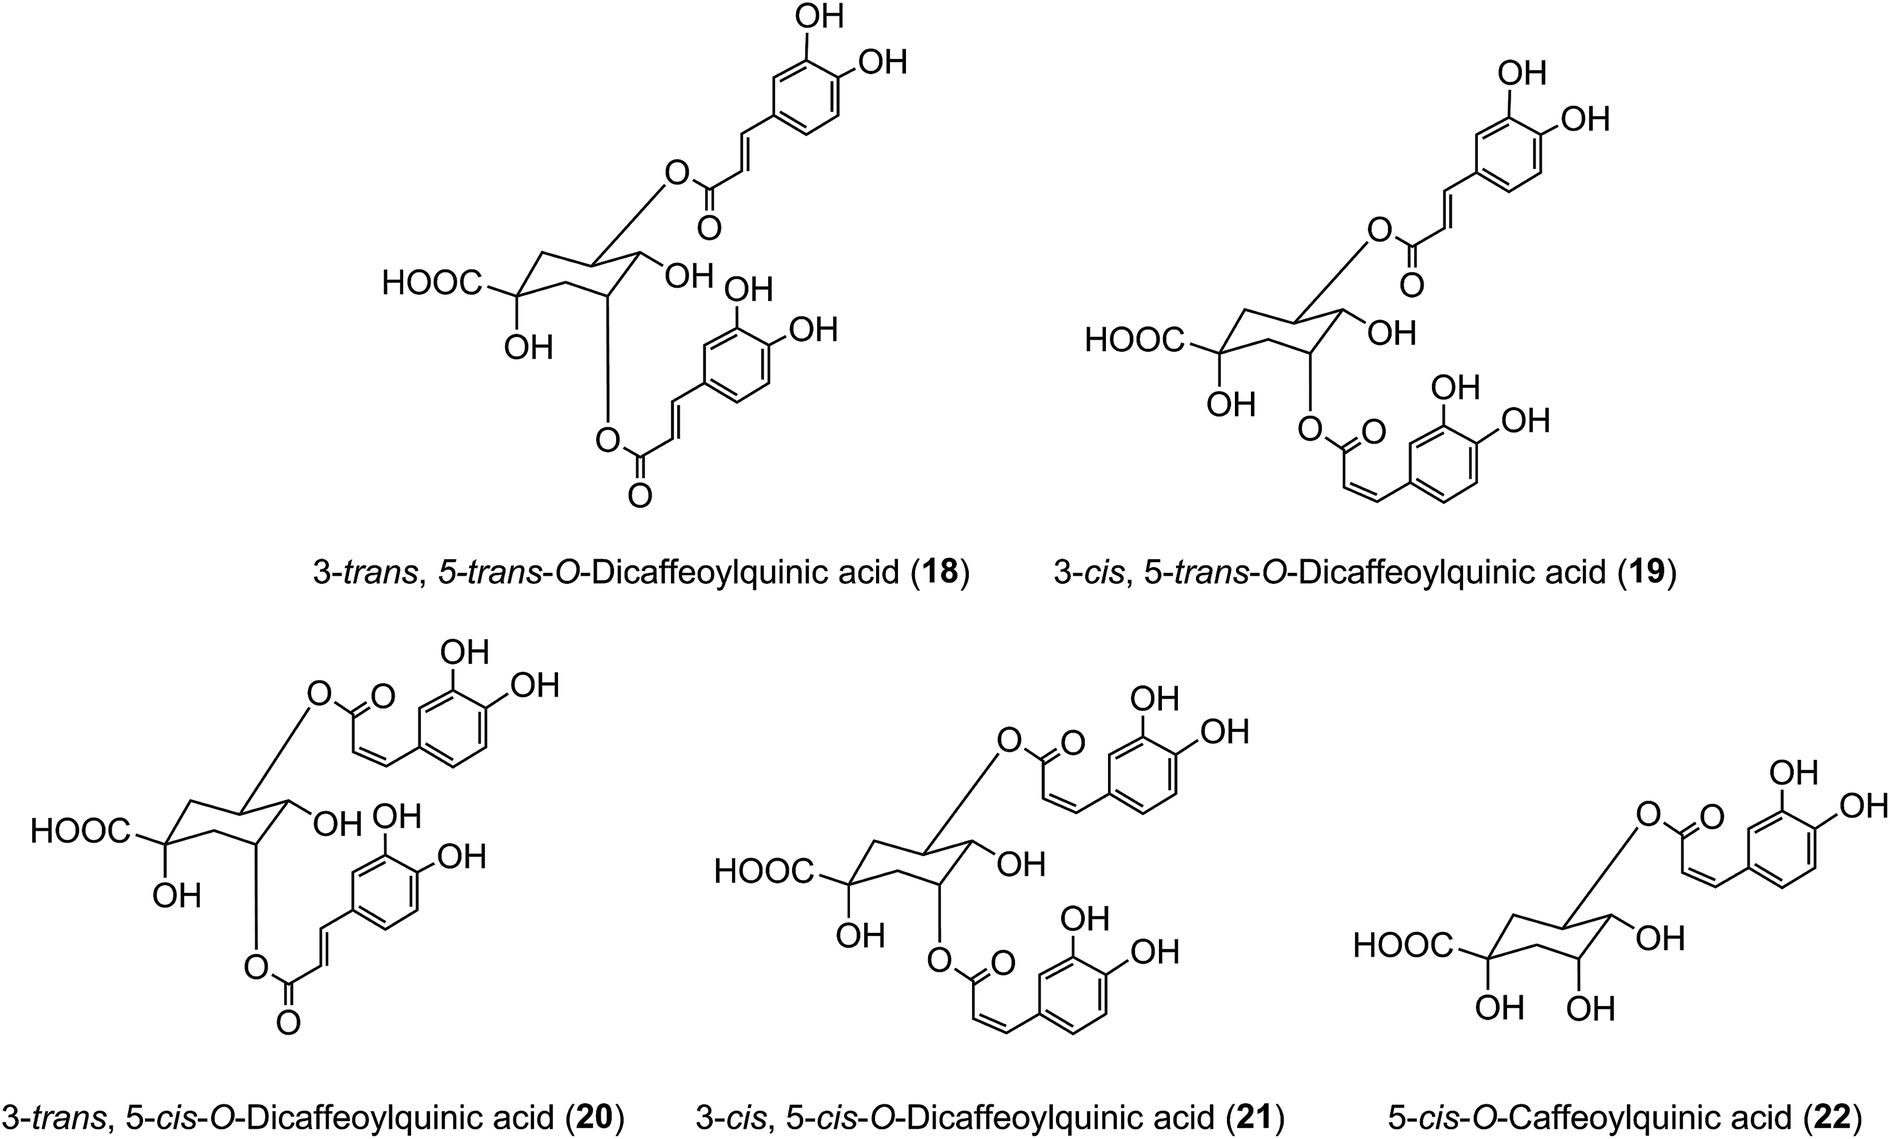
It has long been known that exposure of trans-cinnamoyl-quinic acids to UV light readily produces the associated cis isomers, and such isomers have been found in tissues, such as the leaves of tobacco and coffee, that are exposed to comparatively strong UV-irradiation, suggesting that such exposure might explain their presence.48 3,5-DiCQA has been shown to undergo isomerisation upon UV exposure where the naturally occurring 3-trans, 5-trans-diCQA isomer (18) gives rise to the 3-cis, 5-trans-diCQA (19), 3-trans, 5-cis-diCQA (20), and 3-cis, 5-cis-diCQA (21) isomers, allowing them to have a wider synergistic biological activity when present together.165 Recent studies of 120 samples of Stevia rebaudiana leaves have established a strong positive correlation between sunshine hours prior to harvesting and the content of cis isomers in the harvested leaves,166 effectively confirming this hypothesis. It has also been shown that treatment of cultured tobacco cells with several inducers of plant stress leads to an approximate doubling of cis 5-CQA (22) in the absence of UV irradiation.50
There are many other details yet to be elucidated and several intriguing questions remain to be answered regarding the factors that control the biosynthesis of acyl-quinic acids and the significance of the observed variations.
5 Role of acyl-quinic acids in planta
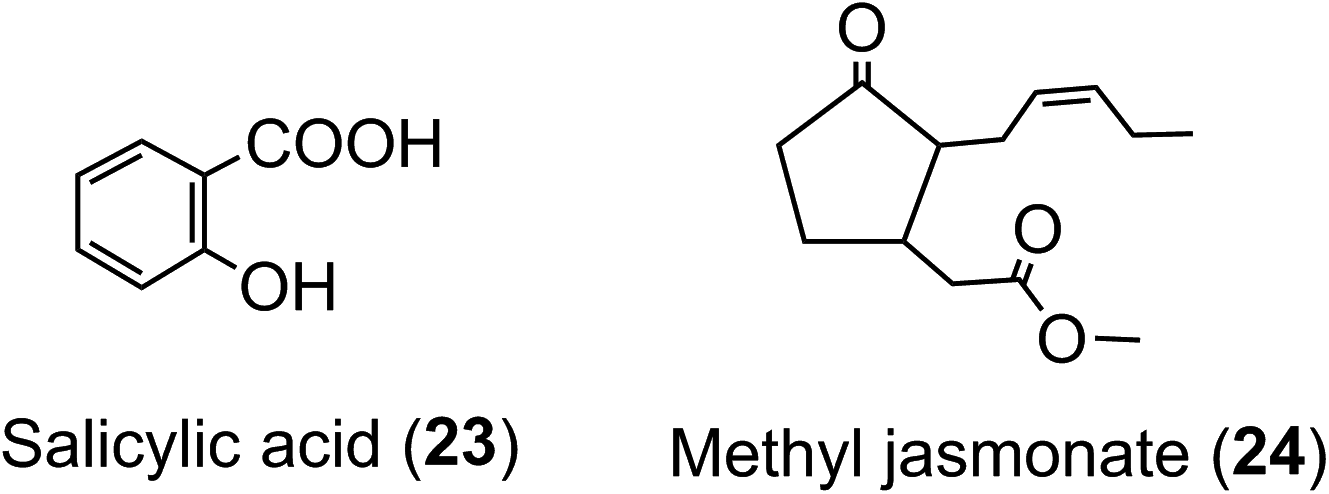
With one or two notable exceptions, the in planta role(s) of acyl-quinic acids are not known with any certainty. It seems almost certain that their function in tissues containing ca. 100 g kg−1 is different to their function in tissues containing only mg kg−1 concentrations. Radiotracer studies have shown that 5-CQA (9) is incorporated into lignin in Xanthium167 which suggests that 5-CQA may accumulate as a store of cinnamic acid for lignin biosynthesis. It has also been proposed that FQAs are important indirect plant defence agents acting as lignin precursors, the lignin per se making tissues more resistant to attack or invasion.168A high acyl-quinic acid content has been linked to the allelopathic potential and resistance to root disease of some sweet potato clones,169via an inhibition of fungal toxin production.170 An elevated 5-CQA content of transgenic tomato plants has been associated with enhanced tolerance to paraquat-induced oxidative stress and resistance to infection by the pathogen Pseudomonas syringae.171 Acyl-quinic acids acting as defence metabolites may have possible links to phytohormone-activated defense signaling networks as implied in Nicotiana tabacum cells treated with salicylic acid (23) and methyl-jasmonate (24).172 The defense signaling networks produce a range of acyl-quinic acids to combat pathogens and some are capable of inhibiting cell wall degrading enzymes, such as polygalacturonase and cutinase, produced by the pathogens.173
In tomato plants CQA has been associated with a protective ability against oxidative damage when exposed to salinity or a combination of salinity and heat.174 Studies with transgenic tobacco plants have demonstrated that inhibition of acyl-quinic acid biosynthesis makes the plants more susceptible to oxidative damage and accelerated cell death,175 while in tomato, globe artichoke and chamomile (Matricaria chamomilla), acyl-quinic acids appear to protect against UV damage.176–178 There is evidence that these compounds also protect against predators because those which are substrates for polyphenol oxidase and/or peroxidase, are readily converted to quinones which react readily with nucleophiles and link covalently to protein.179–182 This interaction is thought to have anti-feedant activity, for example, limiting the growth of herbivorous insect pests by impairing digestibility of the hosts' proteins.183–185
6 Acyl-quinic acids in coffee
Much of the literature on acyl-quinic acids focuses on coffee and green beans which contain substantial amounts. In addition to the major CQAs, FQAs, diCQAs and p-CoQAs (Fig. 5) many quantitatively minor acyl-quinic acids have also been identified.33,102,114,186,187 Currently, green coffee, with 72 acyl-quinic acids, is second only to Lonicera japonica (Japanese honeysuckle) which contains a record 111 in the form of 35 trans-cinnamoyl-quinic acids, 17 cis isomers and 49 acyl-quinic acid glucosides.188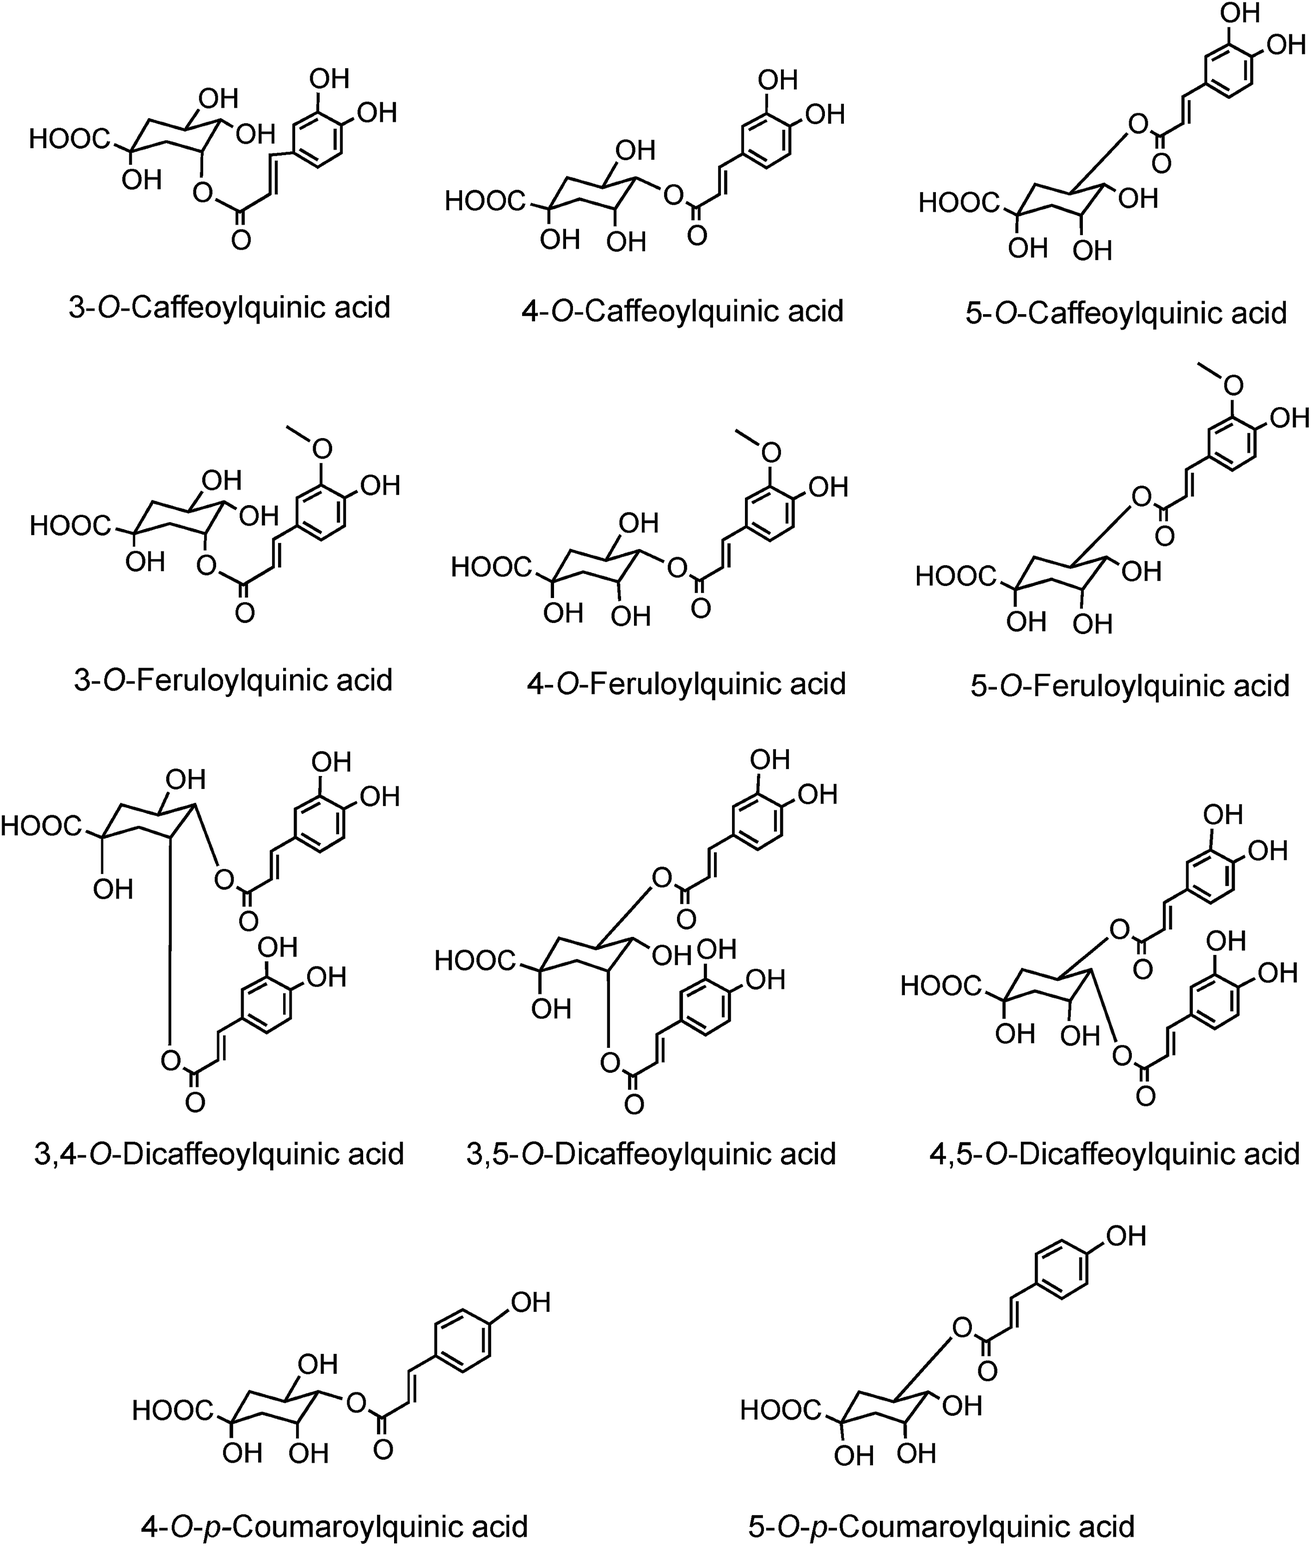 | ||
| Fig. 5 The main acyl-quinic acids in coffee beans. | ||
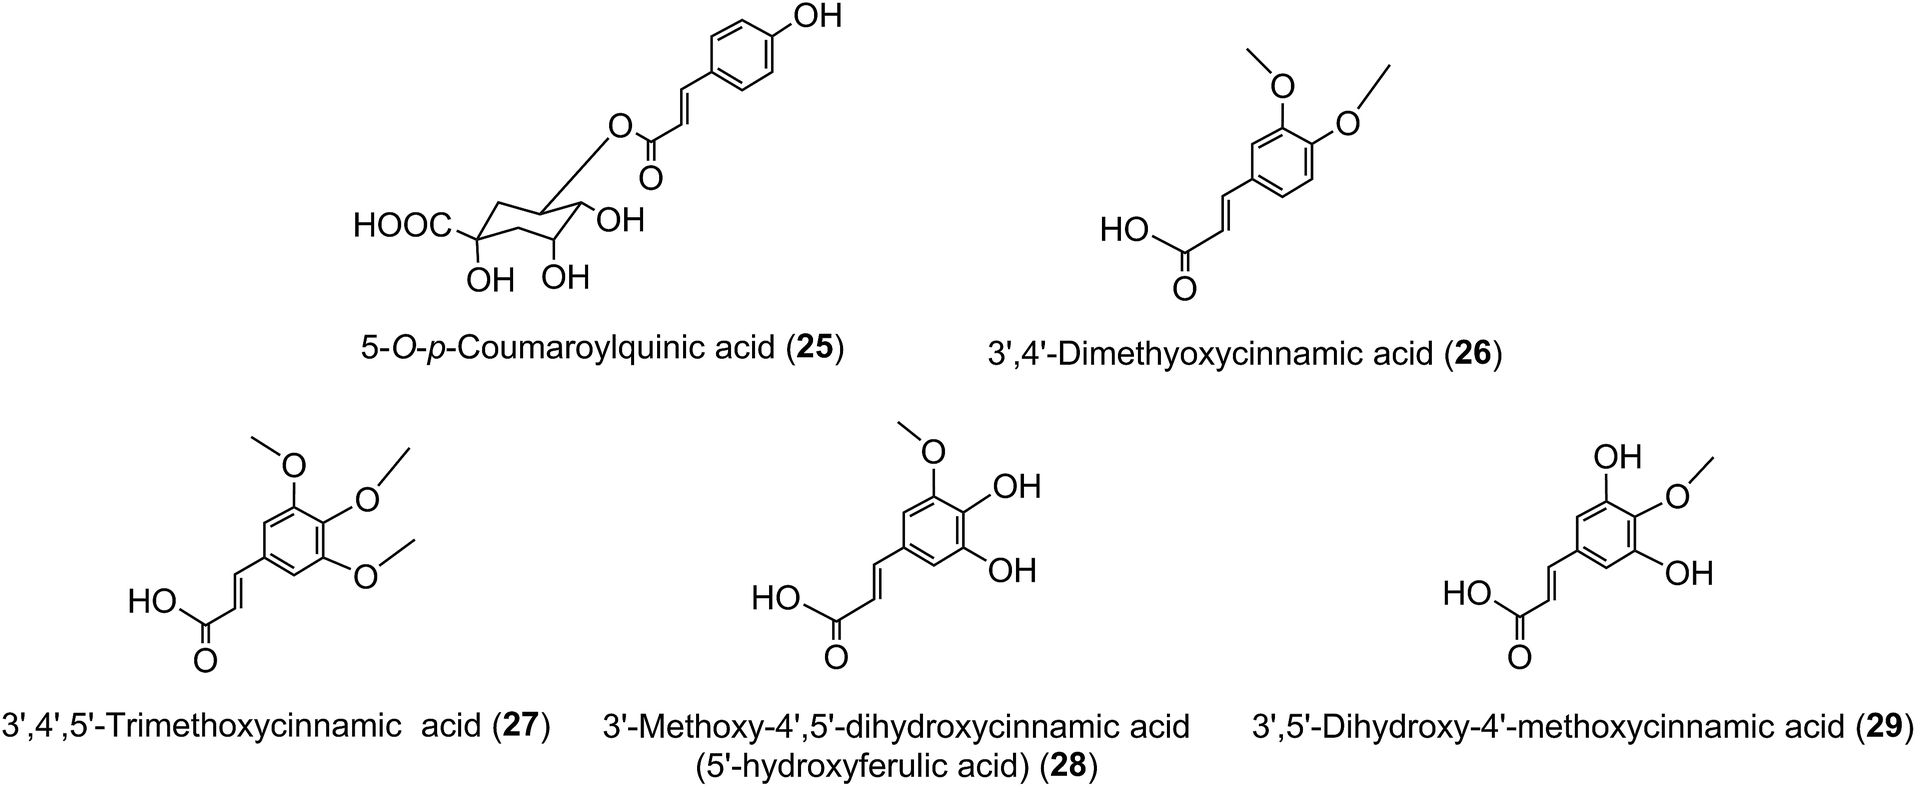
The principal component in green coffee beans is always 5-CQA (9) and is accompanied by numerous diacyl-quinic acids and some triacyl-quinic acids. All the cinnamic acid derivatives so far characterised in green coffee have the cinnamate moiety in the trans configuration. To date, no 1-acyl-quinic acids have been found in the green coffee bean. The triacyl-quinic acids have so far been found only in Robusta coffee beans.33 Robustas usually have a greater content of any isomer but there are exceptions, the best known being a tendency for Arabicas to contain more 5-p-CoQA (25) than Robustas. From a chemotaxonomic standpoint it is interesting to note that acyl-quinic acids containing 3′,4′-dimethoxycinnamic acid (26), 3′,4′,5′-trimethoxycinnamic acid (27), 3′-methoxy-4′,5′-dihydroxycinnamic acid (5-hydroxyferulic acid) (28), and 3′,5′-dihydroxy-4′-methoxycinnamic acid (29) are scarce in nature and may be unique to coffee. Cinnamoyl-amino acid conjugates also have been characterised,26,187,189,190 and together with the acyl-quinic acids have been used as criteria in chemo-taxonomic studies191,192 for distinguishing Robustas from Arabicas,193 and to some extent the profile can be used to define the geographic origin of green coffee beans, especially Robustas from Angola,25,197 Ethiopia,194 Uganda, Vietnam, Cameroun and Indonesia, and for distinguishing South American from African Arabicas.193
Tables 2 and 3 provide a comprehensive list of the acyl-quinic acids and cinnamoyl-amino acid conjugates occurring in green coffee beans. Although Robusta coffees contain all six CFQA and all six p-coumaroyl-caffeoylquinic acids, intriguingly, they only contain three caffeoyl-(3′,4′-dimethoxycinnamoyl)-quinic acids, feruloyl-(3′,4′-dimethoxycinnamoyl)quinic acids, p-coumaroyl-feruloylquinic acids and p-coumaroyl-(3′,4′-dimethoxycinnamoyl)quinic acids highlighting some subtle control of biosynthesis.
| a Tentative identification. b Identification correct but structure as illustrated in original paper is incorrect. | |
|---|---|
| Caffeic acid114 | Caffeoyl-hexose conjugatea114 |
| Ferulic acid114 | Dicaffeoyl-hexose conjugatea114 |
| 3,4-Dimethoxycinnamic acid114 | Dimethoxycinnamoyl-hexose conjugatea114 |
| 3-O-p-Coumaroylquinic acid30 | 3-O-Caffeoylquinic acid30 |
| 4-O-p-Coumaroylquinic acid30 | 4-O-Caffeoylquinic acid30 |
| 5-O-p-Coumaroylquinic acid30 | 5-O-Caffeoylquinic acid30 |
| 3-O-Feruloylquinic acid29 | 3-O-Dimethoxycinnamoylquinic acid102 |
| 4-O-Feruloylquinic acid29 | 4-O-Dimethoxycinnamoylquinic acid102 |
| 5-O-Feruloylquinic acid29 | 5-O-Dimethoxycinnamoylquinic acid102 |
| 3-O-Sinapoylquinic acid101 | 3,4-O-Di-p-coumaroylquinic acid111 |
| 4-O-Sinapoylquinic acid101 | 3,5-O-Di-p-coumaroylquinic acid111 |
| 5-O-Sinapoylquinic acid101 | 4,5-O-Di-p-coumaroylquinic acid111 |
| 3,4-O-Dicaffeoylquinic acid30 | 3,4-O-Diferuloylquinic acid110 |
| 3,5-O-Dicaffeoylquinic acid30 | 3,5-O-Diferuloylquinic acid110 |
| 4,5-O-Dicaffeoylquinic acid30 | 4,5-O-Diferuloylquinic acid110 |
| 3-O-Caffeoyl-4-O-feruloylquinic acid30 | 3-O-Caffeoyl-4-O-p-coumaroylquinic acid101 |
| 3-O-Feruloyl-4-O-caffeoylquinic acid30 | 3-O-p-Coumaroyl-4-O-caffeoylquinic acid101 |
| 3-O-Caffeoyl-5-O-feruloylquinic acid30 | 3-O-Caffeoyl-5-O-p-coumaroylquinic acid101 |
| 3-O-Feruloyl-5-O-caffeoylquinic acid30 | 3-O-p-Coumaroyl-5-O-caffeoylquinic acid101 |
| 4-O-Caffeoyl-5-O-feruloylquinic acid30 | 4-O-Caffeoyl-5-O-p-coumaroylquinic acid101 |
| 4-O-Feruloyl-5-O-caffeoylquinic acid30 | 4-O-p-Coumaroyl-5-O-caffeoylquinic acid101 |
| 3-O-Dimethoxycinnamoyl-4-O-caffeoylquinic acid102 | 3-O-Dimethoxycinnamoyl-4-O-feruloylquinic acid102 |
| 3-O-Caffeoyl-4-O-dimethoxycinnamoylquinic acid190 | 3-O-Dimethoxycinnamoyl-5-O-feruloylquinic acid102 |
| 3-O-Dimethoxycinnamoyl-5-O-caffeoylquinic acid102 | 4-O-Dimethoxycinnamoyl-5-O-feruloylquinic acid102 |
| 3-O-Caffeoyl-5-O-dimethoxycinnamoylquinic acid190 | |
| 4-O-Dimethoxycinnamoyl-5-O-caffeoylquinic acid102 | |
| 4-O-Caffeoyl-5-O-dimethoxycinnamoylquinic acid190 | |
| 3-O-p-Coumaroyl-4-O-feruloylquinic acid101 | 3-O-Caffeoyl-4-O-sinapoylquinic acid33 |
| 3-O-p-Coumaroyl-5-O-feruloylquinic acid101 | 3-O-Sinapoyl-5-O-caffeoylquinic acid33 |
| 4-O-p-Coumaroyl-5-O-feruloylquinic acid101 | 3-O-Sinapoyl-4-O-caffeoylquinic acid33 |
| 3-O-p-Coumaroyl-4-O-dimethoxycinnamoylquinic acid33 | 3-O-Sinapoyl-5-O-feruloylquinic acid33 |
| 3-O-p-Coumaroyl-5-O-dimethoxycinnamoylquinic acid33 | 3-O-Feruloyl-4-O-sinapoylquinic acidb33 |
| 4-O-Dimethoxycinnamoyl-5-O-p-coumaroylquinic acid101 | 4-O-Sinapoyl-5-O-feruloylquinic acid33 |
| 3-O-Trimethoxycinnamoyl-5-O-caffeoylquinic acid33 | 3-O-Trimethoxycinnamoyl-4-O-feruloylquinic acid33 |
| 4-O-Trimethoxycinnamoyl-5-O-caffeoylquinic acid33 | 3-O-Trimethoxycinnamoyl-5-O-feruloyl-quinic acid33 |
| 4-O-Trimethoxycinnamoyl-5-O-feruloylquinic acid33 | |
| 3-O-(3′,5′-dihydroxy-4′-methoxy)cinnamoyl-4-O-feruloylquinic acid33 | 3,4,5-O-Tricaffeoylquinic acid33 |
| 3,4-O-Dicaffeoyl-5-O-feruloylquinic acid33 | 3,4-O-Dicaffeoyl-5-O-sinapoylquinic acid33 |
| 3,5-O-Dicaffeoyl-4-O-feruloylquinic acid33 | 3-O-Sinapoyl-4,5-O-dicaffeoylquinic acid33 |
| 3-O-Feruloyl-4,5-O-dicaffeoylquinic acid33 | |
| 3-O-Dimethoxycinnamoyl-4-O-feruloyl-5-O-caffeoylquinic acidb33 | 3,4-O-Diferuloyl-5-O-caffeoylquinic acid33 |
| 3-O-Caffeoyl-4,5-O-diferuloylquinic acid33 | |
Roasting of green coffee beans can result in acyl-quinic acid losses of ∼90%.43 Substantial transformations also occur and the number of acyl-quinic acids detected in the roasted bean increases to over 200 as judged by the number of characteristic fragments observed in tandem mass spectrometry-based analyses, in comparison with the 72 derivatives detected in the green coffee bean.30,31,33,102,114,115,186,187,190 Acyl migration and hydrolysis during coffee roasting changes the relative proportions of each subgroup, being most obvious within the CQAs, FQAs and diCQAs, with 3-CQA being very susceptible to hydrolysis. For example, it has been reported that after 5 min of roasting the content of 5-CQA (9) decreased substantially while the levels of 4-CQA (10) and 3-CQA (11) increased to twice their original values. The same behavior was observed for FQAs. It is also noted that partial hydrolysis of diCQAs to CQAs occurs in addition to isomerization.22,195 The triacyl-quinic acid derivatives of the green coffee bean have not been found in the roasted bean, and presumably are lost via partial hydrolysis. The clearest evidence for acyl migration during coffee roasting is the appearance of 1-acyl derivatives, absent from the green beans,196 either as the free acids or as the lactones 1-O-caffeoylquinic-1,5-lactone (1-CQL) (30) and 1-O-feruloylquinic-1,5-lactone (1-FQL) (31)197 with similar transformations also occurring during brewing and instant coffee manufacture.198,199
Quantitatively, the main acyl-quinic acids in the roast bean and, instant coffee powder and beverage are CQAs, FQAs and diCQAs (Fig. 5).23 Despite the losses of acyl-quinic acids that occur during roasting, coffee beverage is still a rich, probably the richest, dietary source.200 However, because of the use of a diversity of roasting methods and infusion/manufacturing protocols, a ‘cup of coffee’ is an extremely variable commodity which is best illustrated by modern data for the acyl-quinic acids contents. Espresso coffees bought at 20 commercial outlets near the University of Glasgow in the UK delivered between 24 mg and 423 mg per serving (Table 4).43 A similar but more extensive study of coffees from 104 commercial outlets in Scotland, Italy and Spain observed that one cup delivered between 6 mg and 188 mg of acyl-quinic acids.201 Standardised brewing of eight commercial roast and ground coffees (20 g/900 mL) delivered between 27 and 95 mg of acyl-quinic acids per cup, whereas standardised preparation of ten commercial instant coffees available in the UK (1.8 g/200 mL) delivered between 37 and 121 mg.202 An individual preferring weak instant coffee would likely consume rather less than these figures suggest. It is well known that coffee brews consumed on the American west coast are appreciably weaker than on the American east coast. This variation is such that, conceivably, a person consuming 10 cups per day might actually receive less acyl-quinic acids than another consuming only one cup per day. While this is undoubtedly an extreme and rare event, a four to five-fold variation can surely be expected. Under such circumstances data from epidemiological studies that link ‘cups consumed’ with an effect on health, whether advantageous or otherwise, can only be treated as a hypothesis until further investigations are performed under conditions that are as controlled as possible.
| Coffee shop | Volume of coffee (mL) | 3-CQA (mg) | 4-CQA (mg) | 5-CQA (mg) | Total CQA per serving (mg) |
|---|---|---|---|---|---|
| a Data expressed as mean values (n = 3). SE = <10% of mean value. | |||||
| Pattiserie Francoise | 52 | 95 | 112 | 216 | 423 |
| S'mug | 32 | 62 | 78 | 160 | 300 |
| Costa coffee | 25 | 48 | 61 | 118 | 227 |
| Little Italy | 23 | 37 | 59 | 121 | 217 |
| Paperino's | 50 | 65 | 52 | 99 | 216 |
| Peckhams | 70 | 65 | 52 | 99 | 216 |
| Chapter 1 | 26 | 45 | 58 | 112 | 215 |
| University Cafe | 49 | 40 | 54 | 93 | 187 |
| Baguette express | 45 | 30 | 40 | 74 | 144 |
| Kember & Jones | 43 | 37 | 46 | 92 | 141 |
| Heart Buchanan | 24 | 22 | 37 | 67 | 126 |
| Jellyhill | 63 | 26 | 29 | 56 | 111 |
| Coffee @ 491 | 49 | 23 | 31 | 55 | 109 |
| Beanscene | 48 | 19 | 25 | 49 | 93 |
| Tinderbox | 25 | 19 | 24 | 46 | 89 |
| Café Cinnamon | 59 | 17 | 23 | 41 | 81 |
| Crepe á croissant | 34 | 17 | 23 | 41 | 81 |
| Morton's | 35 | 13 | 16 | 27 | 56 |
| Antipasti | 36 | 8 | 15 | 21 | 44 |
| Starbucks | 27 | 5 | 7 | 12 | 24 |
| Range | 23–70 | 5–95 | 7–112 | 12–216 | 24–423 |
| Median | 43 | 36 | 37 | 67 | 126 |
7 Bioavailability and metabolism of acyl-quinic acids in humans
Because of the dominance of coffee as the source of dietary acyl-quinic acids it has been used in most human studies on their absorption and metabolism, supported by in vitro investigations using cultured human cells. A study using cultured gastric epithelial cells established that CQAs, FQAs and CQLs cross the epithelium. The 3-acyl and 5-acyl regio-isomers probably cross by passive diffusion via the paracellular route, whereas facilitated transport might operate for 4-CQA and 4-FQA.203 DiCQAs crossed the membrane even more rapidly, a behaviour that could be attributable to their greater hydrophobicity, although in the case of 3,5-diCQA (18) there was evidence for a carrier-mediated efflux.203 These observations may help to explain the results of feeding studies, discussed below, where minor acyl-quinic acids in the coffee beverage had a higher peak plasma concentration (Cmax) than the dominant regio-isomers. For example, Stalmach et al.44 observed that 3-FQA (32) and 4-FQA (33) had Cmax values of 16 ± 2 nmol L−1 and 14 ± 2 nmol L−1, respectively, while the beverage dominant 5-FQA (34) peaked at 6 ± 2 nmol L−1.
In vitro studies have also shown that acyl-quinic acids differ in their susceptibility to intestinal chlorogenate esterase (acyl-quinate esterase), with 5-CQA (9) being hydrolysed more readily than 3-CQA (11), and 4-CQA (10) being particularly resistant to hydrolysis.204 Consistent with this enzymic hydrolysis occurring in the stomach or upper gastrointestinal (GI) tract, significant amounts of 1L-(−)-quinic acid, in excess of the amount consumed in the free form, were found in the ileostomy effluent of volunteers who consumed cloudy apple juice, apple smoothie, or coffee.205 Such in vivo resistance to enzymic and chemical hydrolysis post-absorption would also predispose to greater plasma concentrations of 4-acyl-quinic acids. It follows that commodities with acyl-quinic acid profiles substantially different from that of coffee beverage are likely to produce plasma profiles of acyl-quinic acid metabolites that differ quite markedly from those produced when coffee is consumed, as recently reported for maté which contains proportionately more 3-CQA (11) and diCQAs.206
The presence of low nmol L−1 concentrations of CQAs in plasma and their low level excretion in urine after oral intake of coffee,44,207–209 artichoke,210 and 5-CQA (9)211 suggest that the bioavailability of acyl-quinic acids per se is limited. In contrast, Monteiro et al.212 reported the presence of unmetabolised CQAs in the circulatory system with a Cmax of 7.7 μmol L−1, 2.3 h (Tmax) after acute ingestion of a coffee containing 3395 μmol of acyl-quinic acids. Despite the high Cmax of the CQAs, CQAs were not detected in urine collected 0–24 h after coffee intake. In a subsequent study by the same group, in which volunteers consumed a green coffee extract containing a much lower 451 μmol of acyl-quinic acids, 5-CQA (9) and 4-CQA (10) were detected in urine from some, but not all, subjects.213 The CQAs were also detected in plasma although there were unusually marked variations in the plasma pharmacokinetic profiles of the individual subjects with, in two instances, an exceedingly high Cmax of >20 μmol L−1 being recorded. The coffee used in this study contained 43.2 μmol of diCQAs which after consumption were reported to have attained a Cmax of 6.6 μmol L−1. Assuming an average plasma volume of 3 L per person, this corresponds to 45.8% of intake. Despite there being some evidence from in vitro studies that diCQAs are more rapidly absorbed than monoacyl-quinic acids.203 It is difficult to reconcile these studies with the results obtained by other investigators. After volunteers consumed maté delivering 210 μmol of diCQAs no diacyl-quinic acids were detect in plasma.206
Stalmach et al.44,214 carried out coffee feeding studies with healthy humans and ileostomists who have had their colon removed surgically for medical reasons, typically Crohn's disease or ulcerated colitis. In these investigations, samples were analysed using HPLC-MS2 without recourse to the use of the more typical glucuronidase/sulfatase treatments prior to analysis. It was observed that during passage through the body extensive metabolism of acyl-quinic acids occurs, with some compounds being absorbed in the stomach and/or small intestine and others in the colon. Studies with ileostomists have made a major contribution to our understanding of colonic (poly)phenol metabolism in humans with an intact colon. Viewed simply, a transformation associated with the colonic gut microflora will not be seen in ileostomists. In reality, it is important to recognise some colonisation of the upper GIT can occur in ileostomists and, as a consequence, some limited microbial transformations may persist. An ileostomy involves major surgery and is likely to have some patho-physiological effects on other organs and tissues, and although the consequences have barely been studied, it would not be surprising if there were some alteration to (poly)phenol metabolism in, for example, the upper GIT, liver and kidney of ileostomists.
7.1 Studies involving volunteers with and without a functioning colon
Stalmach et al.44 carried out a study in which healthy humans with an intact colon consumed a 200 mL serving of instant coffee, containing 412 μmol (146 mg) of acyl-quinic acids, with CQAs comprising 65% of the total (Table 5), after which plasma and urine samples were collected over a 24 h period. A total of 12 hydroxycinnamate derivatives, of which four were unchanged acyl-quinic acids and eight were metabolites, two of which were unconjugated, were identified and quantified in plasma. Their pharmacokinetic parameters are summarized in Table 6 and pharmacokinetic profiles are illustrated in Fig. 6.| Chlorogenic acids | μmol |
|---|---|
| a Data expressed as mean values ± SEM (n = 3). | |
| 3-O-Caffeoylquinic acid | 72 ± 1.3 |
| 4-O-Caffeoylquinic acid | 78 ± 1.5 |
| 5-O-Caffeoylquinic acid | 119 ± 2.1 |
| Total caffeoylquinic acids | 269 ± 4.9 |
| 3-O-Feruloylquinic acid | 20 ± 1.6 |
| 4-O-Feruloylquinic acid | 22 ± 1.8 |
| 5-O-Feruloylquinic acid | 25 ± 1.9 |
| Total feruloylquinic acids | 67 ± 5.3 |
| 3-O-Caffeoylquinic acid lactone | 34 ± 2.9 |
| 4-O-Caffeoylquinic acid lactone | 23 ± 2.0 |
| Total caffeoylquinic acid lactones | 57 ± 4.9 |
| 3,4-O-Dicaffeoylquinic acid | 5.8 ± 0.6 |
| 3,5-O-Dicaffeoylquinic acid | 2.8 ± 0.3 |
| 4,5-O-Dicaffeoylquinic acid | 4.0 ± 0.4 |
| Total dicaffeoylquinic acids | 12.6 ± 1.2 |
| 4-O-p-Coumaroylquinic acid | 3.8 ± 0.1 |
| 5-O-p-Coumaroylquinic acid | 3.1 ± 0.1 |
| Total p-coumaroylquinic acids | 6.8 ± 0.1 |
| Total acyl-quinic acids | 412 ± 9.3 |
| Chlorogenic acids and metabolites | C max (nmol L−1) | T max (h) | T 1/2 (h) |
|---|---|---|---|
| a Data expressed as mean values ± SEM (n = 11). b Double Cmax and Tmax values are due to the biphasic absorption profile of ferulic acid-4′-sulfate (see Fig. 4). c Apparent T1/2 estimated after oral intake rather than intravenous dosing. | |||
| 5-O-Caffeoylquinic acid | 2.2 ± 1.0 | 1.0 ± 0.2 | 0.3 ± 0.3 |
| 3-O-Caffeoylquinic lactone-sulfate | 27 ± 3 | 0.6 ± 0.1 | 0.5 ± 0.1 |
| 4-O-Caffeoylquinic lactone-sulfate | 21 ± 4 | 0.7 ± 0.1 | 0.4 ± 0.1 |
| 3-O-Feruloylquinic acid | 16 ± 2 | 0.7 ± 0.1 | 0.9 ± 0.1 |
| 4-O-Feruloylquinic acid | 14 ± 2 | 0.8 ± 0.1 | 0.9 ± 0.1 |
| 5-O-Feruloylquinic acid | 6.0 ± 1.5 | 0.9 ± 0.1 | 0.8 ± 0.1 |
| Caffeic acid-3′-sulfate | 92 ± 11 | 1.0 ± 0.2 | 1.9 ± 0.4 |
| Ferulic acid-4′-sulfateb | 76 ± 9 | 0.6 ± 0.1 | 4.9 ± 1.0 |
| 46 ± 13 | 4.3 ± 0.3 | ||
| Dihydroferulic acid | 385 ± 86 | 4.7 ± 0.3 | 1.4 ± 0.4 |
| Dihydroferulic acid-4′-sulfate | 145 ± 53 | 4.8 ± 0.5 | 4.7 ± 0.8 |
| Dihydrocaffeic acid | 41 ± 10 | 5.2 ± 0.5 | 1.0 ± 0.4 |
| Dihydrocaffeic acid-3′-sulfate | 325 ± 99 | 4.8 ± 0.6 | 3.1 ± 0.3 |
 | ||
| Fig. 6 Plasma pharmacokinetic profiles of circulating acyl-quinic acids and metabolites, following the ingestion of 200 mL of coffee by healthy human subjects (based on Stalmach et al.44). | ||
A similar array of metabolites has been detected in plasma after the consumption of coffee by Scherbl et al.209 Post-ingestion Cmax values in the Stalmach study ranged from 2.2 nM for 5-CQA (9) to 385 nM for dihydroferulic acid (35)44 with the duration for Tmax extending from 0.6 h (ferulic acid-4′-sulfate [36] and a 3-CQL-sulfate) to 5.2 h (dihydroferulic acid [35]). The compounds detected in highest concentrations in plasma were free and sulfated conjugates of dihydroferulic acid (35) and dihydrocaffeic acid (37) with Cmax values ranging from 41 to 385 nmol L−1. The Tmax for these compounds was in a narrow range from 4.7 to 5.2 h, implying absorption in the large intestine. Much shorter Tmax values of 0.6 to 1.0 h, indicative of stomach and/or small intestine absorption, were obtained with 5-CQA (9) and three FQAs (32–34) which had not been subject to phase II metabolism, plus ferulic acid-4′-sulfate (36), caffeic acid-3′-sulfate (38), and two CQL-sulfates, and all of which had relatively low Cmax values (Fig. 6 and Table 6).
As noted by Stalmach et al.44 most of the acyl-quinic acid-derived compounds were rapidly removed from the circulatory system with apparent elimination half-life (T1/2) values of 0.3 to 1.9 h (Table 6). The only compounds with an extended T1/2 were dihydroferulic acid-4′-sulfate (39) (4.7 h), dihydrocaffeic acid-3′-sulfate (40) (3.1 h) and ferulic acid-4′-sulfate (36) which had an unusual biphasic plasma profile with dual Tmax values at 0.6 h and 4.3 h. It is of note that the free acid, dihydroferulic acid (35), as opposed to the more typical glucuronide and sulfate metabolites, was the principal component to accumulate in plasma which also contained dihydrocaffeic acid (38) in a lower concentration.
The true T1/2 values can be determined only by intravenous dosing of the metabolite. Estimates based on elimination after oral intake overestimate the true Tmax because the metabolite is still entering the plasma when the elimination is being estimated. A further complication arising with gut flora metabolites for which absorption, and hence elimination, cannot commence until several hours after substrate ingestion, is the lack of sufficient data points in the declining period between 8 and 24 hours. The lack of a reliable value for the true Tmax effectively precludes modelling of multiple doses at say three hour intervals, i.e. the manner in which many people drink coffee. Nevertheless, with such a pattern of repeat consumption there is clearly a potential for a sizable accumulation of gut flora metabolites in the plasma because a subsequent dose of substrate will have entered the colon before the previous intake has been eliminated.
In a further study, ileostomists drank an instant coffee with a very similar 385 μmol (136 mg) acyl-quinic acid content and profile to that ingested by the healthy subjects.214 Plasma metabolites were not investigated, but data on the amounts of acyl-quinic acids and their metabolites in ileal fluid collected over a 0–24 h period after the ingestion of coffee are presented in Table 7. The highest recovery of unmetabolised acyl-quinic acids compared to their intake was FQAs (77%), followed by CQAs (59%) and p-CoQAs and diCQAs (46%). The recoveries of acyl-quinic acid metabolites were much lower, ranging from 3.6 to 8.8%, except for CQL metabolites which corresponds to 56% of CQL intake.
| Acyl-quinic acids and metabolites | Ileal fluid (μmol) | Recovery of amount ingested (%) |
|---|---|---|
| a Data presented as mean values ± standard error (n = 5). n.d – not detected. | ||
| 3-O-Caffeoylquinic acid | 55 ± 6 | |
| 4-O-Caffeoylquinic acid | 45 ± 6 | |
| 5-O-Caffeoylquinic acid | 64 ± 10 | |
| Total caffeoylquinic acids | 164 ± 22 | 59 ± 8 |
| 3-O-Caffeoylquinic acid-sulfate | 3.5 ± 0.5 | |
| 4-O-Caffeoylquinic acid-sulfate | 5.1 ± 0.6 | |
| 5-O-Caffeoylquinic acid-sulfate | 0.7 ± 0.2 | |
| 3-O-Caffeoylquinic acid-O-glucuronide | 0.7 ± 0.2 | |
| 4-O-Caffeoylquinic acid-O-glucuronide | 0.4 ± 0.2 | |
| Total caffeoylquinic acid metabolites | 10 ± 1 | 3.6 ± 0.4 |
| 3-O-Feruloylquinic acid | 12 ± 1 | |
| 4-O-Feruloylquinic acid | 12 ± 1 | |
| 5-O-Feruloylquinic acid | 13 ± 1 | |
| Total feruloylquinic acids | 37 ± 4 | 77 ± 8 |
| 3-O-Feruloylquinic acid-sulfate | 0.7 ± 0.2 | |
| 4-O-Feruloylquinic acid-sulfate | 0.8 ± 0.2 | |
| 5-O-Feruloylquinic acid-sulfate | 0.3 ± 0.1 | |
| 3-O-Feruloylquinic acid-O-glucuronide | 0.4 ± 0.1 | |
| 4-O-Feruloylquinic acid-O-glucuronide | 2.0 ± 0.3 | |
| Total feruloylquinic acid metabolites | 4.2 ± 0.6 | 8.8 ± 1.3 |
| 3-O-Caffeoylquinic lactone | 1.0 ± 0.3 | |
| 4-O-Caffeoylquinic lactone | 1.5 ± 0.1 | |
| Total caffeoylquinic lactones | 2.5 ± 0.3 | 6.4 ± 0.8 |
| 3-O-Caffeoylquinic lactone-sulfate | 13 ± 2.4 | |
| 4-O-Caffeoylquinic lactone-sulfate | 8.2 ± 1.7 | |
| 3-O-Caffeoylquinic lactone-O-glucuronide | 0.6 ± 0.2 | |
| 4-O-Caffeoylquinic lactone-O-glucuronide | 0.4 ± 0.1 | |
| Total caffeoylquinic lactone metabolites | 22 ± 4.4 | 56 ± 11 |
| 4-O-p-Coumaroylquinic acid | 1.1 ± 0.3 | |
| 5-O-p-Coumaroylquinic acid | 1.9 ± 0.2 | |
| Total p-coumaroylquinic acids | 3.0 ± 0.2 | 46 ± 3 |
| 3,4-O-Dicaffeoylquinic acid | 3.0 ± 0.3 | |
| 3,5-O-Dicaffeoylquinic acid | 1.3 ± 0.2 | |
| 4,5-O-Dicaffeoylquinic acid | 2.2 ± 0.2 | |
| Total dicaffeoylquinic acids | 6.5 ± 0.7 | 46 ± 5 |
| Caffeic acid | 9.0 ± 3.1 | |
| Caffeic acid-3′- and 4′-sulfates | 11 ± 2 | |
| Ferulic acid | 0.8 ± 0.3 | |
| Ferulic acid-4′-sulfate | 4.2 ± 1.0 | |
| Total caffeic and ferulic acids | 25 ± 5 | - |
| Total acyl-quinic acids and metabolites | 274 ± 28 | 71 ± 7 |
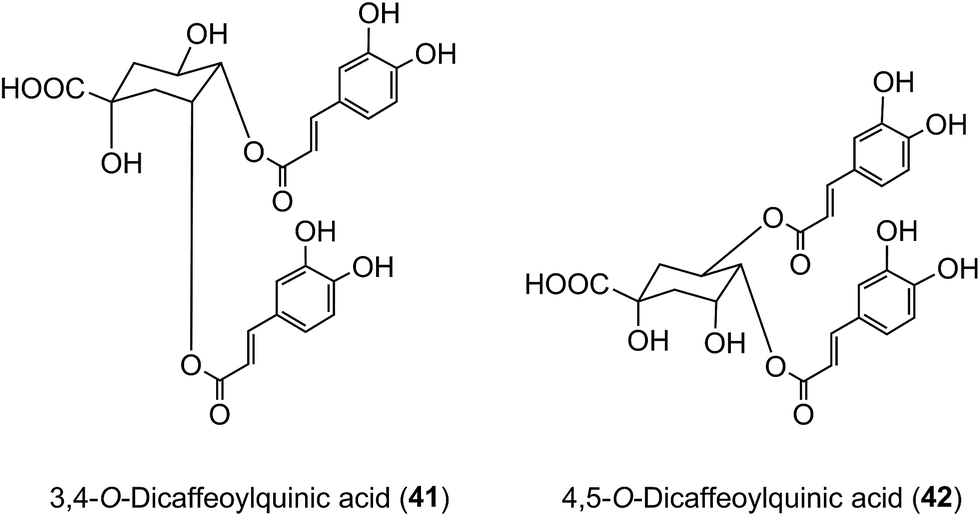
Of the 385 μmol of acyl-quinic acids ingested by the ileostomists, 274 μmol (71%) was recovered in the 0–24 h ileal fluid as the parent compounds and metabolites (Table 7). This indicates that ∼30% of intake is absorbed in the stomach and/or small intestine, and that in subjects with a functioning colon ∼70% of the ingested acyl-quinic acids pass from the small to the large intestine where they will be subjected to the action of the colonic microflora. These observations are in line with the findings of Olthof et al.211 who fed 2.8 mmol of 5-CQA (9) to humans with an ileostomy and recovered ∼70% of the CQA intake in ileal fluid. The data from both studies, albeit at substantially different doses, imply that around one third of ingested 5-CQA is absorbed and enters the bloodstream from the small intestine. In vitro studies support this conclusion as 5-CQA is not extensively degraded when incubated with gastric juice, duodenal fluid and ileostomy effluent211,215 although as noted below interesterification can occur.205 In keeping with these findings, when 3,5-, 3,4-, and 4,5-diCQAs (18, 41, 42) from Ilex kudingcha were incubated with artificial saliva, gastric and pancreatic fluids, they were not degraded. When incubated with a human fecal slurry under anaerobic conditions, the diCQAs were hydrolysed to CQAs and caffeic acid, which was then further catabolised to dihydrocaffeic acid.216
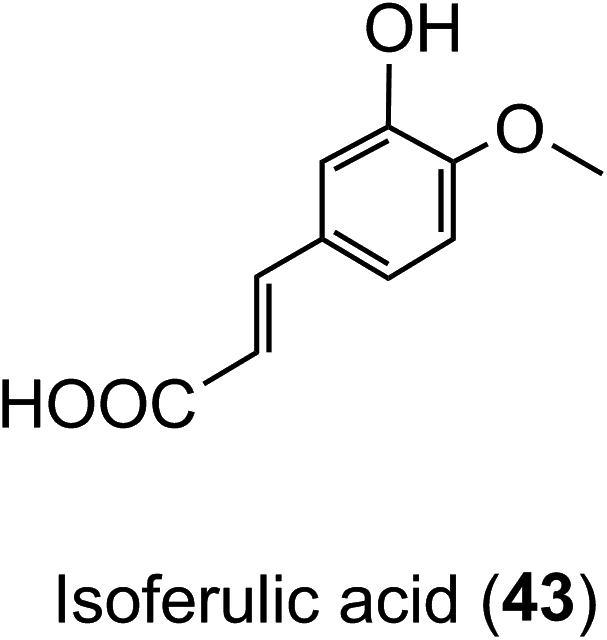
Animal and in vitro cell culture studies indicate that post-absorption acyl-quinic acids are subjected to the action of epithelial esterases in the stomach and small intestine.204,217,218 In incubations with cultured gastric epithelial cells, there is some release of caffeic acid (3), ferulic acid (4) and 3′,4′-dimethoxycinnamic acid (26) from CQAs, FQAs and dimethoxycinnamoylquinic acids (DQAs). Caffeic acid is metabolised primarily to isoferulic acid (43) and a lesser amount of ferulic acid but is not transported unchanged to the basal side. In contrast, ferulic, isoferulic and dimethoxycinnamic acids are transported, and this must be the primary source of these substrates in ileostomists.219,220
The absorption of ferulic acid and subsequent conjugation in the liver221 is consistent with the early plasma Tmax (0.6 h) for ferulic acid-4′-sulfate (36) observed in feeding studies44 while the later secondary Tmax (4.3 h) (Fig. 6 and Table 6) plausibly reflects the absorption and sulfation of ferulic acid released by gut microflora-mediated hydrolysis of unabsorbed FQA. Escherichia coli, Bifidobacterium lactis and Lactobacillus gasseri have the requisite cinnamoyl esterase activity.222 The plasma profile was not recorded for the ileostomists and, thus, it is not known whether that too was biphasic, but because ileostomists could not be absorbing ferulic acid released in the colon there would have to be another compensatory source to maintain ferulic acid-4′-sulfate excretion. The plasma profile (Fig. 6) and the excretion of substantial amounts of dihydroferulic acid (35) by volunteers with an intact colon continues until at least 8 h after coffee consumption,44 indicating that a significant part of this is derived from 77% of FQA intake that reaches the colon (Table 7). The necessary hydrolysis of FQAs and hydrogenation of ferulic acid to dihydroferulic acid could involve either microbial and/or human enzymes post absorption.223
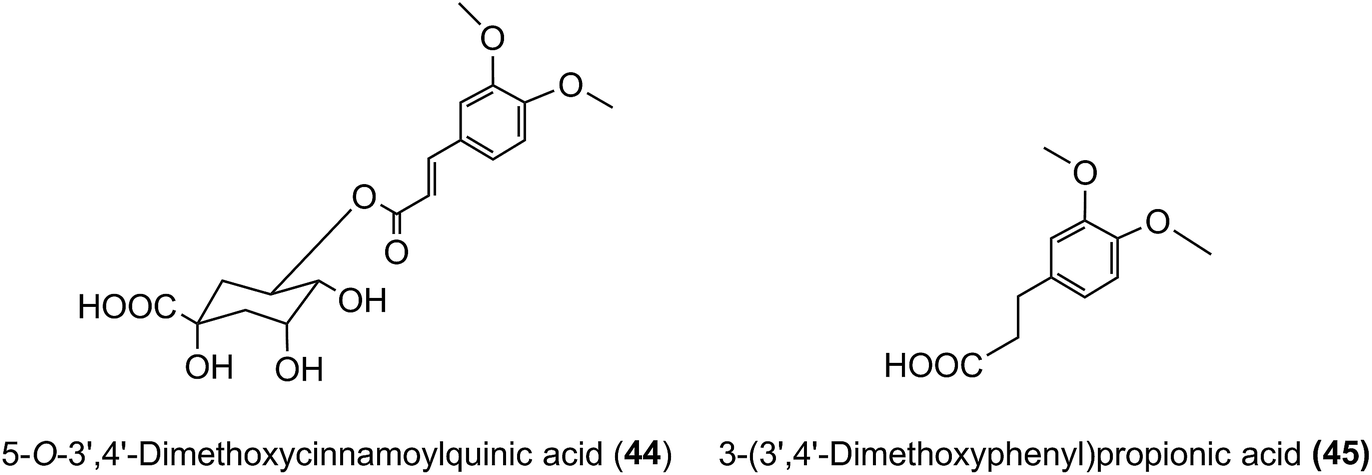
3′,4′-Dimethoxycinnamic acid (26) and 3′,4′-dimethoxycinnamoylquinic acid (44) are minor components in coffee. However, when a coffee containing ∼400 nmol of these compounds was ingested by volunteers free 3′,4′-dimethoxycinnamic acid was detected in plasma with a 500 nmol L−1Cmax and a Tmax of ∼0.5 h.219 The Cmax is higher than that of the metabolites derived from CQAs that occur in coffee in much higher quantities (see Fig. 6). 3-(3′,4′-Dimethoxyphenyl)propionic acid (45) appeared later, predominantly 8–12 h after coffee intake with a Cmax of 97 nmol L−1. The high Cmax relative to dose probably reflects the comparatively high hydrophobicity of dimethoxycinnamic acid derivatives facilitating passive absorption.225
In contrast to the behaviour of ferulic acid and dimethoxycinnamic acid, the failure of cultured gastric cells to transport caffeic acid (3)219 seemingly conflicts with the ∼1 h plasma Tmax for caffeic acid-3′-sulfate (39) (Table 6).44 The most plausible explanation is that absorbed CQAs may be hydrolysed and the caffeic acid conjugated in hepatocytes.
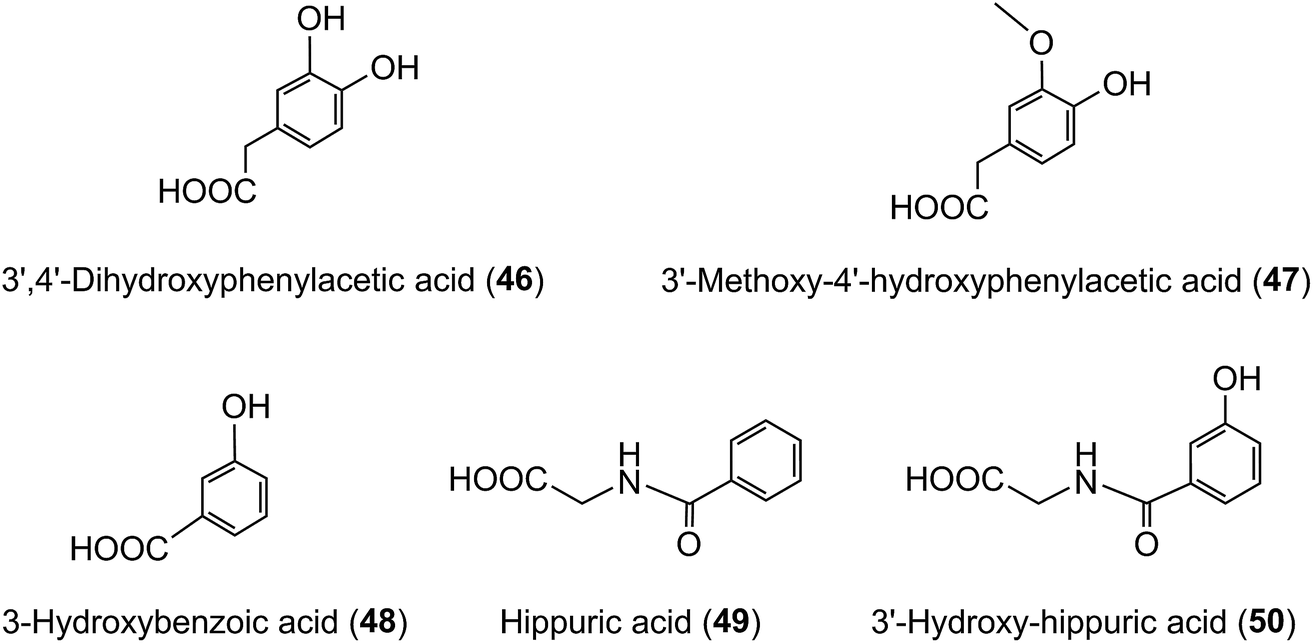
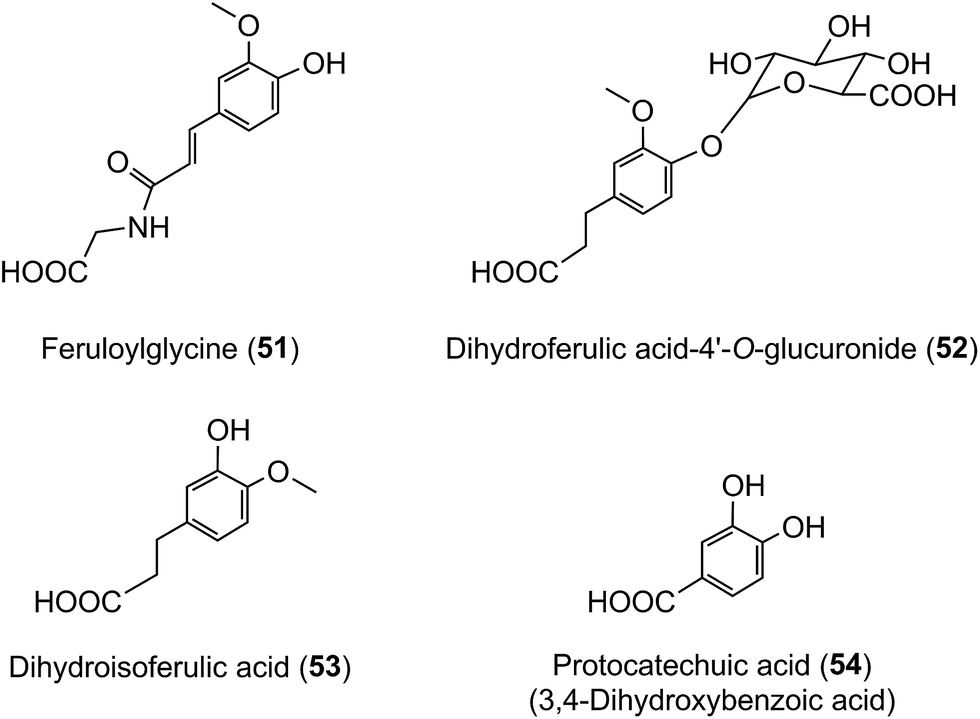
The quantities of acyl-quinic acids and their metabolites excreted in urine by healthy subjects and ileostomists over a 24 h period after ingestion of coffee are summarised in Table 8. It is apparent that absence of a colon had minimal impact on urinary excretion of CQL-sulfates and FQAs, as well as caffeic, ferulic and isoferulic acid sulfates. The ileostomists excreted in urine 30.8 μmol of acyl-quinic acid metabolites equivalent to 8.0% of the amount ingested. In contrast, the volunteers with an intact colon excreted a total of 120.2 μmol which corresponds to 29.2% of intake. This is almost certainly an under estimate of acyl-quinic acid bioavailability because in this study phenolic catabolites, such as C6–C2 hydroxy- and methoxy-phenylacetic acids (46, 47), C6–C1 benzoic acids (48) and hippuric acids (49, 50) were not quantified. As well as these phenolics being catabolites of caffeic acid,215,224–226 there is growing evidence that they are also a feature of the catabolism of many flavonoids including flavonols,224,227,228 anthocyanins,229–231 flavanones232–234 and flavan-3-ols.224,235,236
| Chlorogenic acid and metabolites | Subjects without a colon (385 μmol ingested) | Subjects with a colon (412 μmol ingested) |
|---|---|---|
| a Data represent mean values in μmol ± standard error. n.d. not detected. Different superscripts within rows indicate a statistical difference between the two sets of volunteers (two-sample t-test, P-value < 0.05). b Figures in bold italicised parentheses indicate excretion as a percentage of acyl-quinic acids intake. | ||
| 3-O-Caffeoylquinic lactone-sulfate | 0.6 ± 0.1 | 1.1 ± 0.1 |
| 4-O-Caffeoylquinic lactone-sulfate | 0.4 ± 0.1 | 1.0 ± 0.1 |
| 3-O-Feruloylquinic acid | 0.9 ± 0.2 | 1.2 ± 0.1 |
| 4-O-Feruloylquinic acid | 0.9 ± 0.2 | 1.1 ± 0.1 |
| 5-O-Feruloylquinic acid | 1.1 ± 0.2 | 1.0 ± 0.2 |
| Ferulic acid-4′-O-sulfate | 9.9 ± 1.9 | 11.1 ± 1.6 |
| Feruloylglycine | 2.1 ± 0.3a | 20.7 ± 3.9b |
| Dihydroferulic acid | n.d. a | 9.7 ± 2.0b |
| Dihydroferulic acid-4′-sulfate | 0.8 ± 0.2a | 12.4 ± 3.4b |
| Dihydroferulic acid-4′-O-glucuronide | n.d.a | 8.4 ± 1.9b |
| Isoferulic acid-3′-sulfate | 0.2 ± 0.0 | 0.4 ± 0.1 |
| Isoferulic acid-3′-O-glucuronide | 3.9 ± 0.8 | 4.8 ± 0.5 |
| Dihydroisoferulic acid-3′-O-glucuronide | n.d.a | 2.5 ± 0.4b |
| Caffeic acid-3′-sulfate | 6.2 ± 1.2 | 6.4 ± 0.8 |
| Caffeic acid-4′-sulfate | 0.6 ± 0.1 | 0.6 ± 0.1 |
| Dihydrocaffeic acid-3′-sulfate | 3.2 ± 0.9a | 37.1 ± 8.2b |
| Dihydrocaffeic acid-3′-O-glucuronide | n.da | 0.7 ± 0.2b |
| Total | 30.8 ± 4.3 (8.0%) | 120.2 ± 17.0 (29.2%) |
The data in Table 7 show that after coffee consumption a total of 46.2 μmol of ferulic acid-based compounds (ferulic acid [3], FQAs [32–34], ferulic acid-4′-sulfate [36], FQA-O-glucuronides FQA-sulfates) were present in the 0–24 h ileal fluid. In healthy subjects these compounds would pass to the large intestine and the quantity of ferulic acid metabolites excreted in the urine of volunteers with a functioning colon (feruloylglycine [51], and dihydroferulic acid [35] and its 4′-sulfate [39] and 4′-O-glucuronide [52]) totalled 51.2 μmol (Table 8). This is not greatly in excess of the 46.2 μmol of ferulic acid-based compounds entering the large intestine (Table 8). In contrast to in vitro cell culture studies,203 arguably, this suggests that in vivo the ferulic acid metabolites may be derived principally from the ingested FQAs rather than via 3′-methylation of caffeic acid derivatives, formed from CQAs, diCQAs and CQLs. However, the presence of isoferulic acid [43] and dihydroisoferulic acid [53] metabolites in urine signifies that caffeic acid undergoes 4′-methylation. Excretion of these metabolites by subjects with and without a colon (Table 9) points to 4′-methylation of caffeic acid [3] producing isoferulic acid [43] occurring in the upper GI tract. The human gastric epithelium is capable of such a methylation,203 while formation of dihydroisoferulic acid (54) takes place in the distal GI tract.
 :glucuronide (S:GlcUA) ratio, after ingestion of coffees and a fruit drink containing apple juice by ileostomistsa (after Stalmach et al.214 and Erk et al.205)
| Acyl-quinic acids intake | Ileal excretion | Urinary excretion | ||||
|---|---|---|---|---|---|---|
| % of intake | % conjugated metabolites | S:GlcUA ratio |
% of intake | % conjugated metabolites | S:GlcUA ratio |
|
| a Data presented as mean values ± standard error. | ||||||
| 385 μmol | 71 ± 7 | 22.3 | 15.5 | 8.0 ± 1.1 | 90 | 5.6 |
| 1053 μmol | 77 ± 2 | 8.9 | 13.4 | 14.6 ± 3.0 | 70 | 1.3 |
| 2219 μmol | 72 ± 2 | 7.7 | 10.4 | 12.1 ± 3.0 | 69 | 1.1 |
| 4525 μmol | 69 ± 4 | 6.7 | 8.2 | 8.0 ± 2.2 | 67 | 0.7 |
On the basis of coffee feeding studies with healthy volunteers and ileostomists, Stalmach et al.44,214 proposed a series of metabolic pathways. These have been extended to incorporate data obtained when coffee was incubated with fecal slurries and the breakdown of acyl-quinic acids monitored.226 The proposed pathways are illustrated in Fig. 7 and 8. In the preparation of these pathways the following points were taken into consideration. Some, but not complete hydrolysis of CQAs and CQLs can occur in the small intestine, catalysed by mammalian esterases releasing caffeic acid.237 Further, hydrolysis in the colon is probably due to the action of bacterial esterases. Small amounts of CQAs and more substantial amounts of FQAs and CQLs are absorbed in the small intestine with the CQLs appearing in the circulatory system as sulfates (Fig. 6). The released caffeic acid is subjected to sulfation forming caffeic acid-4′-sulfate and smaller quantities of caffeic acid-3′-sulfate. Caffeic acid is also methylated producing isoferulic acid, but also possibly ferulic acid, both of which in turn form glucuronide and sulfate derivatives.
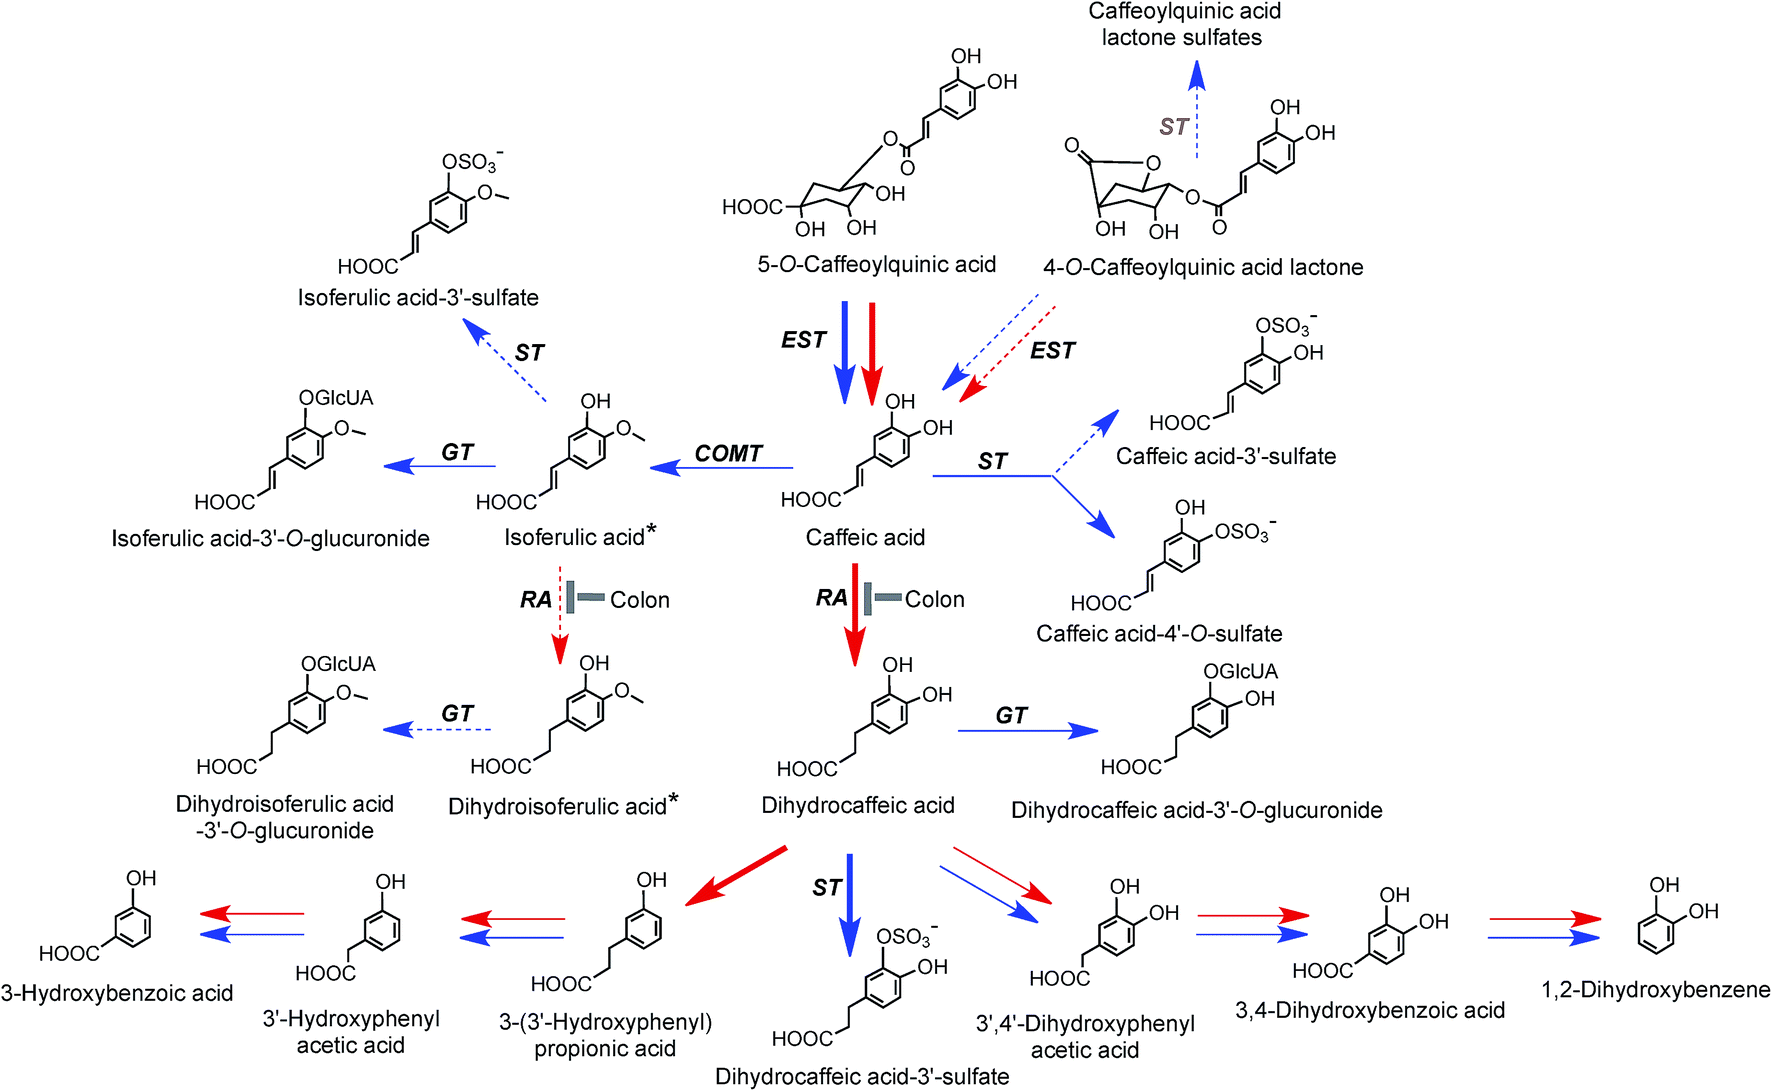 | ||
| Fig. 7 Proposed metabolism of caffeoylquinic acids and caffeoylquinic lactones following the ingestion of coffee by volunteers. 5-CQA is the illustrated structure but the respective 3′- and 4′-isomers and diCQAs would be metabolized in a similar manner. Likewise 4-CQAL is the illustrated lactone but 3-CQAL would be metabolised in a similar manner. COMT, catechol-O-methyltransferase; ET, esterase; RA, reductase; GT, UDP-glucuronyltransferase; ST, sulfuryltransferase; Co-A, co-enzyme A. Arrows: bold – major routes, dotted – minor pathways; red – microbial enzymes, blue – mammalian enzymes. Steps blocked in subjects with an ileostomy and hence occurring principally, but not necessarily exclusively, in the colon are indicated. * Intermediates that did not accumulate in detectable amounts (based on data of Stalmach et al.44,139 and Ludwig et al.226). | ||
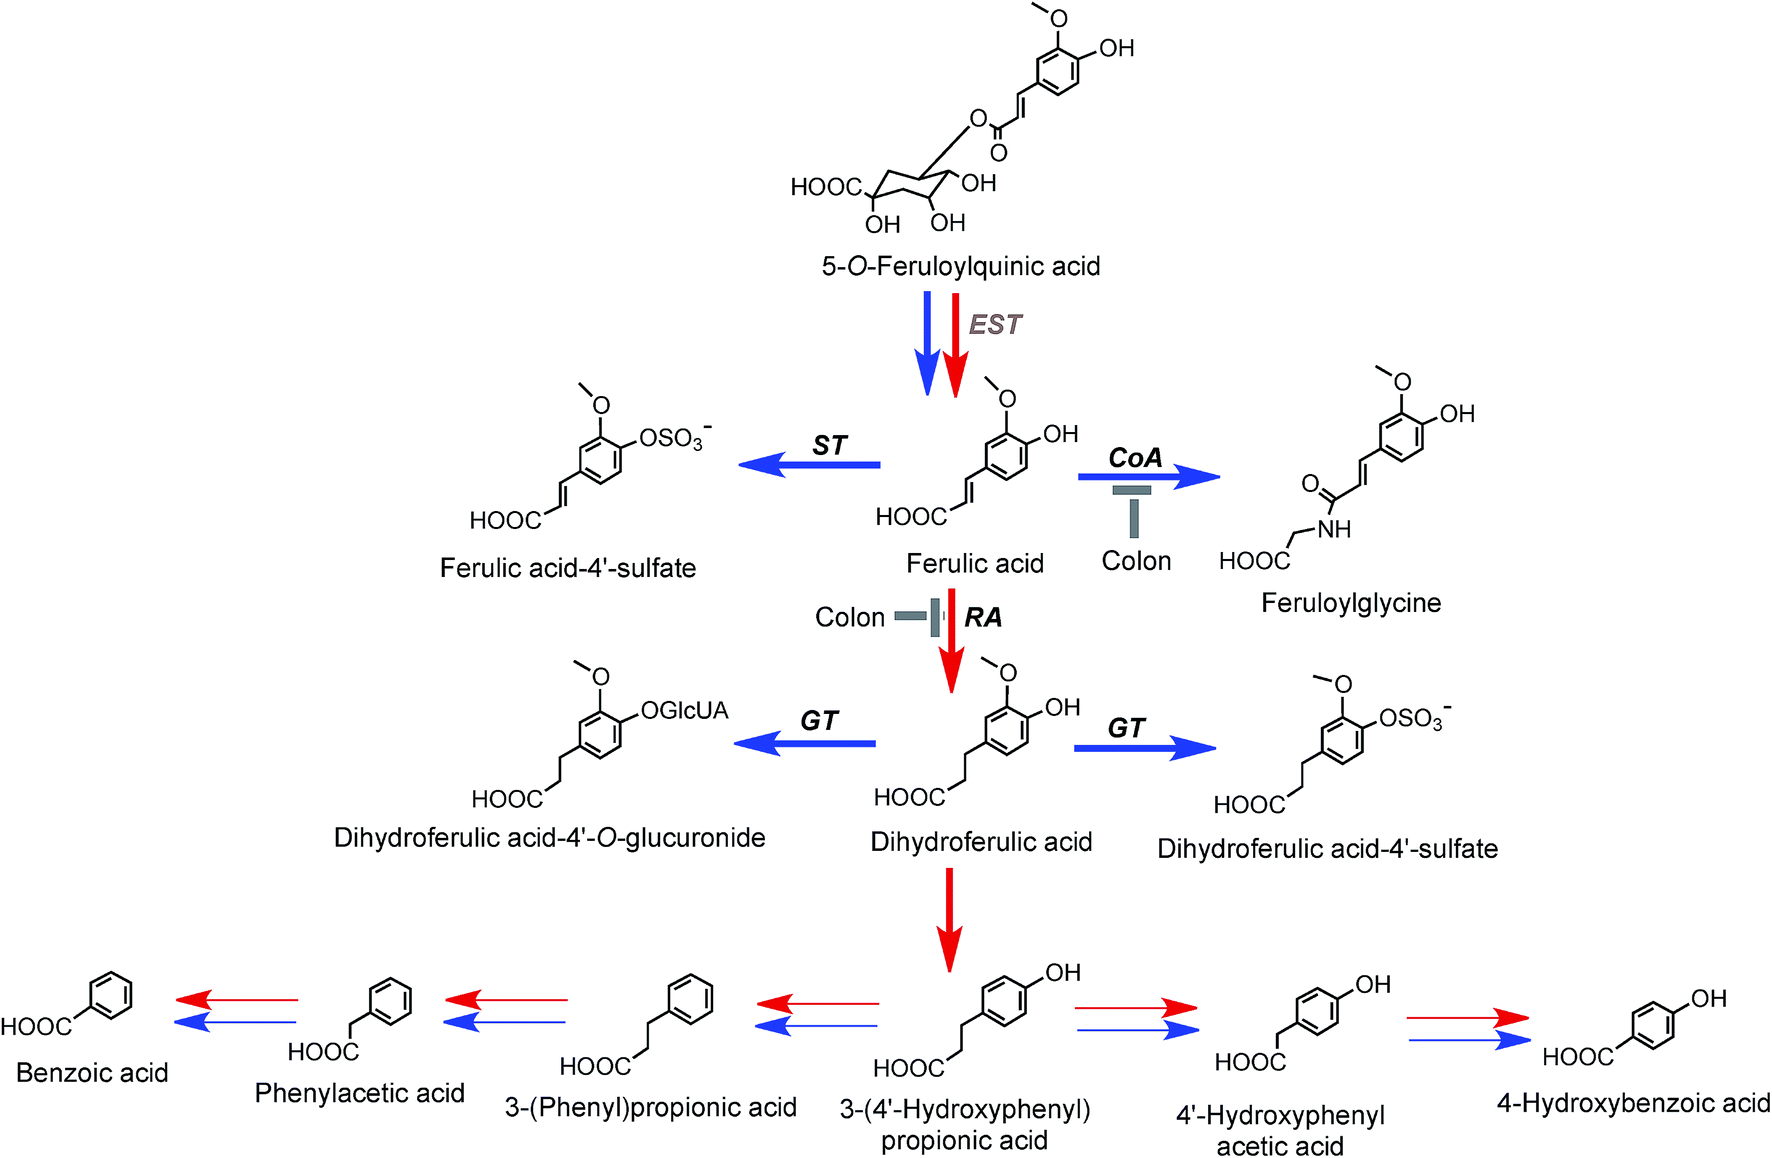 | ||
| Fig. 8 Proposed metabolism of feruloylquinic acids following the ingestion of coffee by volunteers. 5-FQA is the illustrated structure but the respective 3′- and 4′-isomers would be metabolized in a similar manner. EST, esterase; RA, reductase; GT, UDP-glucuronyltransferase; ST, sulfuryltransferase; Co-A, co-enzyme A. Arrows: bold – major routes; red – microbial enzymes, blue – mammalian enzymes. Steps blocked in subjects with an ileostomy and hence occurring principally, but not exclusively, in the colon are indicated (based on data of Stalmach et al.44,139 and Ludwig et al.226). | ||
FQAs are absorbed in the small intestine and are also hydrolysed to some degree with ferulic acid-4′-sulfate [36] appearing in the bloodstream with an initial Cmax of 0.6 ± 0.1 h. Ferulic acid (4) undergoes glycination forming feruloylglycine (51) and although this involves mammalian enzymes the conversion is reduced by 90% in ileostomists indicating that it is primarily colonic in origin. Methyl, glucuronyl, sulfate and glycine conjugation steps involve mammalian enzymes. Dehydroxylation and demethoxylation are almost certainly mediated by the gut microflora while demethylation and hydrogenation steps can be mediated by both microbial and mammalian enzymes. For convenience, the pathways in Fig. 7 and 8 show C6–C3 catabolites being converted by two α-oxidations to C6–C1 compounds by microflora and/or mammalian enzymes. However, it is possible the C6–C3 catabolites progress directly to C6–C1 structures via a mammalian catalysed β-oxidation and that C6–C2 catabolites arise independently. In reality, further complexity is introduced as there are multiple points at which catabolites might be absorbed. For example, a percentage of some C6–C3 catabolites could be absorbed and undergo β-oxidation and/or mammalian phase II conjugation while the balance is subjected to microbial hydrogenation and/or α-oxidation prior to absorption and mammalian conjugation. Also for some catabolites mammalian conjugation either does not occur or is incomplete.
As noted above, after feeding coffee containing trace levels of 3′,4′-dimethoxycinnamic acid (26) and dimethoxycinnamoylquinic acids to volunteers with a functioning colon, 3′,4′-dimethoxycinnamic acid appears rapidly in plasma and this is followed by a delayed appearance of a smaller amounts of 3-(3′,4′-dimethoxyphenyl)propionic acid (45).219 These observations are in keeping with esterases in the small intestine hydrolysing the dimethoxycinnamoylquinic acids releasing free dimethoxycinnamic acid which is readily absorbed in the upper GI tract, while the unabsorbed methoxy acid reaching the colon it is converted to 3-(3′,4′-dimethoxyphenyl)propionic acid. A potential pathway involved in such conversions is illustrated in Fig. 9. Currently there is no evidence for further phase II metabolism of these products.
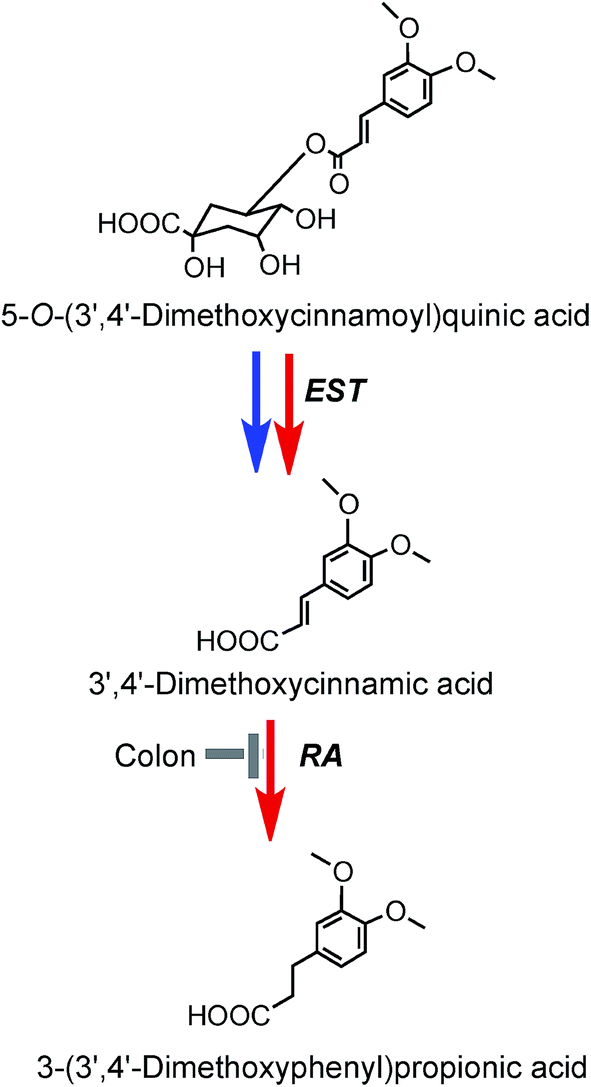 | ||
| Fig. 9 Potential metabolism of 5-O-(3′,4′-dimethoxycinnamoyl)quinic acid following the ingestion of coffee by volunteers. The 5-O-ester is the illustrated structure but the respective 3-O- and 4-O-isomers would be metabolized in a similar manner. EST, esterase; RA, reductase. Blue arrows mammalian enzymes, red arrow – microbial enzymes (based on data of Farrell et al.144). | ||
Sulfates are the main acyl-quinic acid metabolites and glucuronides are relatively minor components (Fig. 6 and Table 9). Transformations that occur in the colon facilitate the absorption, as microbial catabolites, of 70% or more of the acyl-quinic acids consumed, clearly highlighting the importance of the colon in their bioavailability. It is also apparent that ileostomists are less able to utilise acyl-quinic acids and other dietary phenolics and are, thus, less able to access any benefits that might otherwise accrue.
Further clarification of the proposed pathways in Fig. 7–9 will require feeding studies, not with coffee, but with substrates such as 5-CQA (9) and 5-FQA (34) in which the hydroxycinnamate moiety is labelled with 13C. This approach has been used successfully with [13C5]cyanidin-3-O-glucoside to obtain detailed profiles of the metabolism and catabolism of the anthocyanin in the small and large intestine and in the process provided novel details of involvement of the microbiota in the lower bowel.229,230 Human feeding studies are the gold standard and while animal studies can be helpful, because of species differences in gut microbiota and endogenous metabolism, they can produce data that are difficult to apply to human studies as has recently been shown with the radiolabelled flavan-3-ol [2-14C](−)-epicatchin.236 Likewise, data obtained in vitro with isolated cells and tissue extracts should be treated with caution as substrates can come into contact with enzymes and conditions to which they would not be exposed in vivo when cellular compartmentation is maintained.
7.2 Impact of dose on acyl-quinic acid bioavailability
The impact of dose on acyl-quinic acid absorption in the small intestine has been assessed in a study by Erk et al. on coffee consumption by ileostomists where acyl-quinic acid-derived compounds were analysed in plasma, urine and ileal fluid after the ingestion of coffees containing 1053, 2219 and 4525 μmole of CQAs, diCQAs and FQAs.238 The profile of acyl-quinic acids and their metabolites identified in ileal fluid and urine by HPLC-MS was very similar to that detected by Stalmach et al.214 after the ingestion of a coffee containing 385 μmol of acyl-quinic acids. Ileal excretion reported by Erk et al.238 was ∼70% of intake irrespective of dose (Table 9), which was also the level reported by Stalmach et al.214 In keeping with these observations the ∼3:1 ratio of urinary excretion of metabolites absorbed in the distal and proximal GI tract was not influenced to any extent by dose following coffee acyl-quinic acid intakes of 412–795 μmol (Table 10).239 Dose did, however, have a noticeable impact on the amount of conjugated metabolites appearing in ileal fluid where they were equivalent to 22.3% of the acyl-quinic acids at the lowest dose and 6.7–8.9% at the three higher intakes.238 Sulfated metabolites were 15.5 times more prevalent than glucuronides at the lowest dose but as intake increased this changed and with the ingestion of 4525 μmol of acyl-quinic acids the ratio of sulfated metabolites to glucuronides in ileal fluid fell to 8.2 (Table 10). In keeping with these observations, in a further study in which ileostomists consumed a (poly)phenol-rich drink containing 46 μmol of 5-CQA derived from apples, only sulfate metabolites of caffeic acid, dihydrocaffeic acid and ferulic acid were detected in urine 0–24 h after intake.240
| Acyl-quinic acids intake | |||
|---|---|---|---|
| 412 μmol | 635 μmol | 795 μmol | |
| a Data expressed as mean values in μmol ± SE (n = 11). Italicised figures in parentheses represent the percentage absorption taking place in the upper and lower gastrointestinal tract. | |||
| Upper gastrointestinal tract | 29 ± 2 (27%) | 37 ± 4 (24%) | 37 ± 4 (21%) |
| Lower gastrointestinal tract | 80 ± 14 (73%) | 119 ± 21 (76%) | 137 ± 23 (79%) |
These dose-related changes presumably reflect enzyme saturation, limited transport capacities into and out of the enterocyte in the small intestine and/or differences in GI tract transit times. The increasing proportion of glucuronidation with increasing acyl-quinic acid dose was even more marked in urine (Table 9), arguably indicative of phase II UDP-glucuronyltransferase activity in the small intestine epithelium and/or in the liver and kidneys.
Data on the effect of dose on plasma Cmax of acyl-quinic acids and metabolites absorbed in the small intestine after ingestion of coffee by healthy subjects with a colon (lowest dose) and ileostomists are presented in Table 11. This reveals a clear trend towards higher Cmax values with increasing acyl-quinic acids intakes.
| Acyl-quinic acids and metabolites | Acyl-quinic acid intake | |||
|---|---|---|---|---|
| 385 μmol | 1053 μmol | 2219 μmol | 4525 μmol | |
| a Data in nM ± standard error. Analysis of acyl-quinic acids at the three higher doses was after enzyme hydrolysis162 and without enzyme hydrolysis for the lowest dose.139 n.d., not detected; n.a., not analysed. | ||||
| 3-O-Caffeoylquinic acid | n.d. | 14 ± 3 | 33 ± 7 | 43 ± 5 |
| 4-O-Caffeoylquinic acid | n.d. | 20 ± 4 | 57 ± 12 | 73 ± 4 |
| 5-O-Caffeoylquinic acid | 2.2 ± 1.0 | 14 ± 3 | 30 ± 6 | 44 ± 4 |
| 3-O-Feruloylquinic acid | 16 ± 2 | 23 ± 5 | 56 ± 13 | 96 ± 20 |
| 4-O-Feruloylquinic acid | 14 ± 2 | 32 ± 5 | 62 ± 12 | 117 ± 16 |
| 5-O-Feruloylquinic acid | 6.0 ± 1.5 | 16 ± 3 | 41 ± 12 | 45 ± 4 |
| Caffeic acid | 92 ± 11 | 77 ± 12 | 162 ± 26 | 214 ± 11 |
| Ferulic acid | 76 ± 9 | 147 ± 14 | 214 ± 20 | 518 ± 38 |
| Dihydrocaffeic acid | n.d. | 53 ± 7 | 35 ± 6 | 63 ± 9 |
| Dihydroferulic acid | n.d. | 22 ± 8 | 34 ± 6 | 85 ± 6 |
| Dimethoxycinnamic acid | n.a. | 58 ± 11 | 129 ± 23 | 305 ± 32 |
7.3 Matrix effects and acyl-quinic acid bioavailability
There is one report on the consumption by humans of black coffee and black coffee made with milk rather than water in which urinary excretion of acyl-quinic acids and metabolites was 68% of intake with the black coffee and 40% after ingestion of coffee with milk. The two figures were not statistically different but it was hypothesized that milk may have impaired the absorption of coffee acyl-quinic acids.241 Although an in vitro investigation suggests that the addition of milk fat to coffee may increase acyl-quinic acids bioavailability,242 a feeding study by Renouf et al.243 revealed no difference in the pharmacokinetic profiles of plasma acyl-quinic acid metabolites after drinking black coffee with or without 10% whole milk. Thus, although 5-CQA has been reported to bind to certain proteins in vitro, such as albumin and casein,244,245 milk would appear not to have a significant impact on the overall absorption of coffee acyl-quinic acids. However, adding a mixture of sugar and non-dairy creamer to the black coffee resulted in lower Cmax values for caffeic acid (3) and isoferulic acid (43) accompanied by longer Tmax times for ferulic acid (4) and isoferulic acid.243 Sugar246 and lipids247 are known to delay gastric emptying and this may have delayed absorption of the coffee acyl-quinic acids resulting in an extended Tmax for two of the three metabolites.Changes in the CQA profile in the upper GI tract have been monitored by feeding ileostomists coffee, cloudy apple juice and an apple smoothie and analysing the CQAs excreted in ileal fluid over an 8 h period.205 The data obtained are summarised in Table 12. With coffee, in keeping with other investigations, there was an overall recovery of 76% of intake and the ratios of the individual CQA isomers were not affected by inter-esterification reactions during passage through the proximal GI tract.214,238 There was a similar 77% recovery of apple smoothie CQAs but whereas the drink contained only 5-CQA (9) and 4-CQA (10) while the ileal fluid also contained 3-CQA (11) and 1-CQA (12). The same occurred following consumption of cloudy apple juice but in this instance the overall recovery of CQAs was only 26%.
| Caffeoylquinic acids | Coffee | Apple smoothie | Cloudy apple juice | |||
|---|---|---|---|---|---|---|
| Intake | Ileal excretion | Intake | Ileal excretion | Intake | Ileal excretion | |
| a Data presented in μmoles as mean values. Bold figures in parentheses represent total caffeoylquinic acid recovery in ileal fluid as a percentage of intake. n.d., not detected. | ||||||
| 1-O-Caffeoylquinic acid | 8.0 | 5.1 | n.d. | 2.0 | n.d. | 16 |
| 3-O-Caffeoylquinic acid | 231 | 179 | n.d. | 14 | n.d. | 34 |
| 4-O-Caffeoylquinic acid | 209 | 157 | 26 | 27 | 40 | 9.2 |
| 5-O-Caffeoylquinic acid | 298 | 227 (76%) | 309 | 216 (77%) | 318 | 32 (26%) |
The matrix in which the CQAs were ingested, therefore, appears to have had an impact on their fate as they pass through the proximal GI tract with interesterification of CQAs occurring with the apple products but not coffee. Such reactions have been reported previously248,249 and seemingly are caused by the pH increasing to above pH 6 during passage through the small intestine. Erk et al.238 suggest that the CQA profile of the coffee was closer to the interesterification equilibrium reported by Trugo and Macrae250 and so did not alter substantially during gastric transport (Table 12). The susceptibility of individual acyl-quinic acids to inter-esterification and hydrolysis was discussed in Section 3.1.
There was also a ∼3-fold lower recovery of CQAs in ileal fluid after cloudy apple juice consumption compared with the apple smoothie (Table 12).205 The CQA content of the two beverages was similar and the drinks differed only in that cloudy apple juice was pressed and unfiltered whereas the smoothie comprised 60% cloudy juice and 40% apple purée which contains a much higher proportion of cell wall constituents. How this resulted in the enhanced ileal recovery of CQAs from the apple smoothie is unclear. Although neither plasma nor urine were analysed in this study to confirm the point, it appears unlikely that it is a consequence of enhanced absorption in the small intestine of the cloudy apple juice CQAs. It is also unclear as to what constituents in the smoothie result in the CQAs being less prone to degradation and/or irreversible binding in the apple matrix.
Scherbl et al. reported on a study in which volunteers consumed (i) black coffee, (ii) a carbohydrate-rich black coffee and two bread rolls and honey (∼626 kcal) and (iii) a fat-rich black coffee and one bread roll and peanut butter (∼626 kcal).209 Plasma and urine collected 0–24 h post-ingestion were analysed and a detailed spectrum of acyl-quinic acid metabolites was obtained. The fat-and carbohydrate-rich supplements resulted in a statistically significant, but relatively small, reduction in the levels of acyl-quinic acid metabolites. This contrast with more marked effects obtained in an anthocyanin study in which a strawberry drink was ingested either 2 h before or 2 h after a breakfast meal which comprised a croissant with butter and apple jelly, cereal, whole milk and sausages (838 kcal).251 Co-ingestion of the drink with the meal resulted in the Cmax of the main anthocyanin, a pelargonidin-O-glucuronide, falling significantly to 12.8 ± 2.1 nmol L−1 compared to 38.0 ± 6.6 and 35.5 ± 2.1 nmol L−1 when the drink was ingested, respectively, before and after the meal. Co-ingestion with the meal also extended the Tmax from ∼1.8 h to 2.9 h.
7.4 Inter-individual variations in acyl-quinic acids excretion after coffee intake
Data obtained on urinary excretion of acyl-quinic acids and their metabolites following coffee consumption showed substantial inter-individual variation. With a 412 μmole intake by 11 volunteers the mean excretion was equivalent to 26 ± 4% of intake while individual values ranged from 12 to 58% urinary recoveries. Similar figures were obtained with intakes of 635 and 793 μmole (Table 13). It is noteworthy that while there was some variation, high excretors such as volunteer 4, maintained the condition at all three doses as did low excretors such as volunteers 1–3. Much of this person-to-person variation probably reflects variation in the composition and biochemical competence of the gut microbiota.239 The inter-individual variation in the bioavailability of dietary (poly)phenols in general, is an area of increasing interest because the knowledge of the variation in the capacity to absorb and metabolize these compounds is thought to be a key factor in obtaining a better knowledge of the beneficial effects of plant bioactive compounds against diseases, and particularly, an understanding of their role in healthy ageing and cardiometabolic risk reduction.252| Acyl-quinic acid intake | Volunteers | Mean ± SE | Range | ||||||||||
|---|---|---|---|---|---|---|---|---|---|---|---|---|---|
| 1 | 2 | 3 | 4 | 5 | 6 | 7 | 8 | 9 | 10 | 11 | |||
| a Data expressed as a percentage of intake. | |||||||||||||
| 412 μmol | 12 | 17 | 16 | 58 | 29 | 24 | 22 | 30 | 28 | 28 | 23 | 26 ± 4 | 12–58 |
| 635 μmol | 10 | 12 | 11 | 35 | 25 | 17 | 52 | 29 | 36 | 19 | 31 | 25 ± 4 | 10–52 |
| 795 μmol | 18 | 14 | 15 | 47 | 19 | 16 | 48 | 20 | 28 | 25 | 50 | 27 ± 4 | 14–48 |
8 Biomarkers of acyl-quinic acids intake
The data presented in Table 8, and that of Gomez-Juaristi et al.206 on urinary excretion of hydroxycinnamate metabolites after the respective ingestion of coffee and maté by healthy volunteers clearly show that dihydrocaffeic acid-3′-sulfate (40) and feruloylglycine (51) would serve as very sensitive biomarkers for the consumption of relatively small amounts of acyl-quinic acids. A more detailed fingerprint for coffee could be obtained by the additional analysis of 3′,4′-dimethoxycinnamic acid (26), dihydroferulic acid (35), dihydroferulic acid-4′-sulfate (39), ferulic acid-4′-sulfate (36) and dihydroferulic acid-4′-O-glucuronide (52). However, whether coffee and/or maté consumption can be accurately assessed in population studies from measurements of urinary biomarkers is doubtful. These colonic catabolites are not unique to acyl-quinic acids as some can be derived from other (poly)phenols including orange juice flavanones and berry anthocyanins. Intake of CQAs from coffee or maté is, however, likely to yield much higher levels of the catabolites than consumption from alternative sources. Of more importance, is the 4–5-fold inter-individual variation in the quantity of acyl-quinic acids metabolites excreted by volunteers who consume the same coffee (Table 13) which is further compounded by the large variations in the acyl-quinic acids content of seemingly similar coffees consumed by the general public, as noted in Section 6.43,201,2029 Bioactivity
Potential health benefits have been associated with coffee consumption, including a reduced incidence of several chronic and degenerative diseases, such as cancer, cardiovascular disorders, diabetes, and Parkinson's disease and the protective effects have been ascribed, at least in part, to the acyl-quinic acids present in the brew.253–255 However, relatively little information exists about their mechanisms of action. For many years, mechanistic studies linked the protective effects of dietary (poly)phenols to their antioxidant activity. Acyl-quinic acids, particularly the dominating CQAs, are frequently referred to as powerful antioxidants, and this might be true in vitro. After coffee consumption by humans, unmetabolised CQAs achieve transient and very low nmol L−1 peak plasma concentrations (Table 6), thus, they cannot realistically compete with the much more substantial concentrations of other dietary antioxidants, such as the far more powerful ascorbate and α-tocopherol.256 As discussed in Section 7.1, after ingestion acyl-quinic acids are extensively metabolised and the concept that health benefits might arise from direct-antioxidant activity has been challenged repeatedly,256–258 and it has now been discarded and alternative mechanisms are being investigated.(Poly)phenols have been found to exert modulatory effects in cells through selective action on multiple cell-signalling pathways involved in the pathogenesis of degenerative diseases, indicating that the health effects go beyond simple antioxidant activity.259,260 However, most in vitro studies investigating the biological activity of acyl-quinic acids have used the un-metabolised parent compounds present in foods and beverages and, in many cases, at supra-physiological concentrations that are never attained in the circulatory system, and organs or tissues, except perhaps in the GI tract. This section will, therefore, cover studies using catabolites of acyl-quinic acids and their phase II metabolites that have been tested at physiologically relevant sub- and low μmol L−1 concentrations. As noted in Section 8, the relevant catabolites are not unique to acyl-quinic acids so studies that originally focussed on other dietary polyphenols are included.
Several such studies have investigated beneficial effects, on markers of cardiovascular diseases and the possible molecular mechanisms involved., Van Rymenant et al.261 compared the effects of ferulic acid (4) and ferulic acid-4′-sulfate (36) on vasorelaxation ex vivo using mice saphenous artery, femoral artery and aorta. While ferulic acid was inactive, its ferulic acid-4′-sulfate, caused a concentration-dependent relaxation in all three tissues that were significant at sub-μmol L−1 concentrations. Further analyses demonstrated that soluble guanylate cyclase (sGC) and voltage-gated K+-channels, are involved in the ferulic acid-4′-sulfate-dependent vasorelaxation. Whether these effects also occur with human test systems remains to be determined. It is of interest, however, that following human consumption of coffee containing 412 μmol of acyl-quinic acids, ferulic acid-4′-sulfate, but not ferulic acid, appears in the circulatory system with a dual Cmax of 76 nmol L−1 after 0.6 h and 46 nmol L−1 after 4.3 h (Fig. 6 and Table 6).44
Amin et al.262 studied the anti-inflammatory effects of ferulic acid, and protocatechuic acid (3,4-dihydroxybenzoic acid) (54) and its glucuronide and sulfate conjugates in human umbilical vein endothelial cells (HUVECs) stimulated with either oxidized LDL or a cluster of differentiation 40 ligand. Protocatechuic acid and its phase II metabolites were effective in modulating the production of key inflammatory mediators IL-6 and vascular cell adhesion molecule-1 (VCAM-1) at dietary relevant concentrations as low as 100 nmol L−1, with maximum reduction observed for the sulfate conjugates. In keeping with the data of Van Rymenant et al.261 these results indicate that phase II conjugation may unexpectedly increase bioactivity. However, in a similar study by Warner et al.263 that analysed the effects of phenolic catabolites on secretion of VCAM-1 in HUVEC-stimulated with tumor necrosis factor alpha (TNF-α), a statistically significant reduction of 17.2% was observed with 1 μmol L−1 protocatechuic acid, but not its phase II metabolites. Protocatechuic acid at 0.5 μmol L−1 has also been shown to significantly reduce adhesion of monocytes to HUVECs by 28.7%. Protocatechuic acid-3-sulfate (55) and protocatechuic acid-4-sulfate (56) also significantly reduced VCAM-1 secretion but at the much higher concentrations of 10 and 100 μmol L−1, respectively.264 In the same study, 1 μmol L−1 ferulic acid (4) significantly reduced monocyte adhesion by 21.3%. Adhesion of monocytes to endothelial cells and their subsequent trans-endothelial migration into the vascular wall initiate the atheroma formation which leads to cardiovascular diseases.
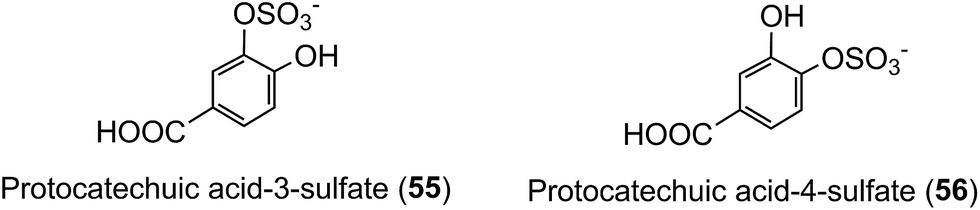
A study using lipopolysaccharide (LPS)-stimulated human peripheral blood mononuclear cells, demonstrated that dihydrocaffeic acid (37) and 3′,4′-dihydroxyphenylacetic acid (48) at 1 μmol L−1 significantly reduced secretion of the main pro-inflammatory cytokines TNF-α, IL-1β and IL-6 by 84.9–97.9% compared to control cells.265 In a study in which 300 g of raspberries were consumed by volunteers, after 6 h, 3′4′-dihydroxyphenylacetic acid (46) attained a plasma Cmax of 180 nmol L−1, while after consuming coffee, dihydrocaffeic acid (37) reached a Cmax of 41 nmol L−1 (Table 6).
Baeza et al.266 studied the inhibitory effects of caffeic acid (3), ferulic acid (4), dihydrocaffeic acid (37), and dihydroferulic acid (35) on platelet activation in human blood samples by measuring ADP-induced P-selectin expression. Excessive platelet activation has been associated with development of chronic inflammation and has, therefore, been proposed as a risk factor for cardiovascular diseases.267 A significant decrease in P-selectin expression was observed with dihydrocaffeic acid at 1 μmol L−1 while ferulic acid and dihydroferulic acid were without effect at concentrations up to 10 and 20 μmol L−1, respectively.
González-Sarrías et al.268 evaluated the potential neuroprotective effects of 19 (poly)phenol-derived metabolites, including dihydrocaffeic acid (37) and 3′,4′-dihydroxyphenylacetic acid (46). At 1 μmol L−1 no protective effects were observed but at 5 μmol L−1 both CQA catabolites significantly attenuated the H2O2-induced cytotoxicity in SH-SYS neuroblastoma cells. The strongest neuroprotective effects occurred at 10 μmol L−1 and at this concentration they were also able to significantly reduce ROS levels in the SH-SY5Y cells and decrease oxidative stress-induced apoptosis by preventing caspase 3-activation via mitochondrial apoptotic pathway.
In a similar study Verzelloni et al.269 investigated the ability of an array of (poly)phenol catabolites generated in vivo from different food sources, including coffee, to counteract neurotoxicity linked to oxidative stress in human SK-N-MC neuroblastoma cells. The compounds were tested at concentrations ranging from 0.1 to 20 μmol L−1. Dihydrocaffeic acid (37) exhibited significant protective effects at 0.5 μmol L−1, while at the highest tested concentration dihydroferulic acid (35) and feruloylglycine (51) also protected neurons against 2,3-dimethoxy-1,4-naphthoquinone-induced toxicity, with increased survival after oxidative stress ranging from 6.5 to 17.0%. The possible synergistic effects were investigated by evaluating the neuroprotective effects of different combinations of catabolites. When assayed in this manner at concentrations of 0.5 μmol L−1, the three acyl-quinic acids catabolites induced a statistically significant 16% increase in cell viability.
It is unfortunate that there are still comparatively few studies of relevant in vitro metabolites and catabolites at concentrations close to those known to occur in humans consuming real-world diets. Nevertheless, the results summarised here suggest that at least some gut flora catabolites and their phase II metabolites may indeed have anti-inflammatory and neuroprotective effects at such concentrations. Although the consumption of acyl-quinic acids is not an absolute pre-requisite for the production of these catabolites and metabolites, the fact that acyl-quinic acids-rich beverages such as coffee and maté are typically consumed repeatedly at short intervals throughout the day, day after day, makes the acyl-quinic acids particularly important. This frequent and long term consumption results in several bolus doses being available simultaneously to the gut microbiota and greatly increasing the period of time during which catabolite absorption can occur. Accordingly there is a potential for a somewhat higher plasma Cmax than would be achieved by a single bolus dose, but more importantly, a significant concentration is achieved for several hours rather than a few minutes.270 For these reasons plasma AUC values and 24 hour urinary excretion values are better indicators of physiological relevance than Cmax values per se. Such data for free-living healthy and clinically compromised volunteers, in addition to volunteers given defined supplements, would be a valuable adjunct to epidemiological and in vitro studies.
10 Conflicts of interest
There are no conflicts to declare.11 Acknowledgements
IAL was supported by a postdoctoral research contract “Juan de la Cierva-Formación” funded by the Spanish Ministry of Economy and Competitiveness (FJCI-2014-20689).12 References
- M. N. Clifford and L. Abranko, Researchgate, 2017, https://www.researchgate.net/publication/312647842.
- S. Payen, Comptes rendus hebdomadaires des séances de l'Académie des Sciences, 1846, 23, 244–251 Search PubMed.
- S. Payen, Ann. Chem. Pharm., 1846, 60, 286–294 CrossRef.
- P.-J. Robiquet and A. Boutron-Charlard, Justus Liebigs Ann. Chem., 1837, 23, 93–95 Search PubMed.
- F. Rochleder, Justus Liebigs Ann. Chem., 1844, 50, 224–234 CrossRef.
- F. Rochleder, Justus Liebigs Ann. Chem., 1846, 59, 300–310 CrossRef.
- K. Gorter, Justus Liebigs Ann. Chem., 1908, 358, 327–348 CrossRef CAS.
- K. Freudenberg, Ber. Dtsch. Chem. Ges. A, 1920, 53, 232–239 CrossRef.
- H. O. L. Fischer and G. Dangschat, Ber. Dtsch. Chem. Ges. A, 1932, 65, 1037–1040 CrossRef.
- H. M. Barnes, J. R. Feldman and W. V. White, J. Am. Chem. Soc., 1950, 72, 4178–4182 CrossRef CAS.
- L. Panizzi and M. l. Scarpati, Nature, 1954, 174, 1062–1063 CrossRef CAS.
- R. A. Cartwright and E. A. H. Roberts, J. Sci. Food Agric., 1954, 5, 593–597 CrossRef CAS.
- R. A. Cartwright and E. A. H. Roberts, Chem. Ind., 1955, 230–231 CAS.
- R. A. Cartwright, E. A. H. Roberts and E. A. Flood, Chem. Ind., 1955, 1062–1063 CAS.
- E. A. H. Roberts, J. Sci. Food Agric., 1958, 9, 381–390 CrossRef CAS.
- J. Corse, R. Lundin and E. Sondheimer, Tetrahedron, 1962, 18, 2107–2108 CrossRef.
- J. Corse, R. E. Lundin and A. C. Waiss, Phytochemistry, 1965, 4, 527–529 CrossRef CAS.
- T. Tsuchida, M. Suzuki and M. Kurogi, J. Jpn. Soc. Food Sci. Technol., 1968, 13, 199–206 Search PubMed.
- J. Corse and D. C. Patterson, Phytochemistry, 1969, 8, 203–205 CrossRef CAS.
- V. P. Maier, D. M. Metzler and A. F. Huber, Biochem. Biophys. Res. Commun., 1964, 14, 124–128 CrossRef CAS PubMed.
- G. G. Gross, in The Biochemistry of Plants Volume 7, ed. E. E. Conn, Academic Press, London, 1981, pp. 301−316 Search PubMed.
- M. N. Clifford, in Coffee 1. Chemistry, ed. R. J. Clarke and R. Macrae, Elsevier Applied Science, London, 1985, pp. 153−202 Search PubMed.
- M. N. Clifford, in Coffee: Botany, Biochemistry and Production of Beans and Beverage, ed. M. N. Clifford and K. C. Willson, Croom Helm, London, 1985, pp. 305–374 Search PubMed.
- P. Mølgaard and H. Ravn, Phytochemistry, 1988, 27, 2411–2421 CrossRef.
- M. N. Clifford, B. Kellard and E. Ah-Sing, Phytochemistry, 1989, 28, 1989–1990 CrossRef CAS.
- M. N. Clifford, B. Kellard and G. G. Birch, Food Chem., 1989, 33, 115–123 CrossRef CAS.
- M. N. Clifford, J. Sci. Food Agric., 1999, 79, 362–372 CrossRef CAS.
- M. N. Clifford, J. Sci. Food Agric., 2000, 80, 1033–1043 CrossRef CAS.
- M. N. Clifford, in Methods in Polyphenol Analysis, ed. C. Santos-Buelga and G. Williamson, Royal Society of Chemistry, Cambridge, 2003, pp. 314−337 Search PubMed.
- M. N. Clifford, K. L. Johnston, S. Knight and N. Kuhnert, J. Agric. Food Chem., 2003, 51, 2900–2911 CrossRef CAS PubMed.
- M. N. Clifford, S. Knight and N. Kuhnert, J. Agric. Food Chem., 2005, 53, 3821–3832 CrossRef CAS PubMed.
- R. Jaiswal, T. Sovdat, F. Vivan and N. Kuhnert, J. Agric. Food Chem., 2010, 58, 5471–5484 CrossRef CAS PubMed.
- R. Jaiswal and N. Kuhnert, Rapid Commun. Mass Spectrom., 2010, 24, 2283–2294 CrossRef CAS PubMed.
- M. N. Clifford, Researchgate, 2017, https://www.researchgate.net/publication/312591202.
- K. Hermann, Occurrence and content of hydroxycinnamic and hydroxybenzoic acid compounds in foods, Crit. Rev. Food Sci. Nutr., 1989, 28, 315–347 CrossRef PubMed.
- C. Manach, A. Scalbert and G. Williamson, Am. J. Clin. Nutr., 2004, 79, 727–747 CAS.
- A. Crozier, T. Yokota, I. B. Jaganath, S. C. Marks, M. Saltmarsh and M. N. Clifford, in Plant Secondary Metabolites. Occurrence, Structure and Role in the Human Diet, ed. A. Crozier, M. N. Clifford and H. Ashihara, Blackwell Publishing, Oxford, UK, 2006, pp. 208−302 Search PubMed.
- A. Crozier, I. B. Jaganath and M. N. Clifford, Nat. Prod. Rep., 2009, 26, 1001–1043 RSC.
- Phenol-Explorer, Database on polyphenol content of foods (phenol-explorer.eu), 2015.
- K. Schütz, D. Kammerer, R. Carle and A. Schieber, J. Agric. Food Chem., 2004, 52, 4090–4096 CrossRef PubMed.
- G. Pandino, F. L. Courts, S. Lombado, S. Lombardo, G. Mauromicale and G. Williamson, J. Agric. Food Chem., 2010, 58, 1026–1031 CrossRef CAS PubMed.
- M. N. Clifford and J. R. Ramìrez-Martìnez, Food Chem., 1990, 35, 13–21 CrossRef CAS.
- T. W. M. Crozier, A. Stalmach, M. E. J. Lean and A. Crozier, Food Funct., 2012, 3, 30–33 CAS.
- A. Stalmach, W. Mullen, D. Barron, K. Uchida, T. Yokota, C. Cavin, H. Steiling, G. Williamson and A. Crozier, Drug Metab. Dispos., 2009, 37, 1749–1758 CrossRef CAS PubMed.
- K. Kahle, W. Huemmer, W. Scheppach, T. Erk and E. Richling, J. Agric. Food Chem., 2007, 55, 10605–10614 CrossRef CAS PubMed.
- S. Hagl, H. Deusser, B. Soyalan, C. Janzowski, F. Will, H. Dietrich, F. W. Albert, S. Rohner and E. Richling, Mol. Nutr. Food Res., 55, 368–377 CAS.
- M. N. Clifford, W. Zheng and N. Kuhnert, Phytochem. Anal., 2006, 7, 384–393 CrossRef.
- M. N. Clifford, J. Kirkpatrick, N. Kuhnert, H. Roozendaal and P. R. Salgado, Food Chem., 2008, 106, 379–385 CrossRef CAS.
- H. Karaköse, R. Jaiswal, S. Deshpande and N. Kuhnert, J. Agric. Food Chem., 2015, 63, 3338–3347 CrossRef PubMed.
- M. I. Mhlongo, L. A. Piater, P. A. Steenkamp, N. E. Madala and I. A. Dubery, Biotechnol. Lett., 2015, 37, 205–209 CrossRef CAS PubMed.
- IUPAC, Biochem. J., 1976, 153, 23–31 CrossRef.
- D. Kremr, T. Bajer, P. Bajerova, S. Surmova and K. Ventura, Quím. Nova, 2016, 39, 530–533 CAS.
- M. N. Clifford, Researchgate, 2017, https://www.researchgate.net/publication/312590923.
- L. Abrankó and M. N. Clifford, J. Agric. Food Chem., 2017, 65, 3602–3608 CrossRef PubMed.
- P. F. Yang, Z. M. Feng, Y. N. Yang, J. S. Jiang and P. C. Zhang, J. Nat. Prod., 2017, 80, 1028–1033 CrossRef CAS PubMed.
- R. S. Cahn, J. Chem. Educ., 1964, 41, 116–125 CrossRef CAS.
- E. L. Eliel and M. B. Ramirez, Tetrahedron: Asymmetry, 1997, 8, 3551–3554 CrossRef CAS.
- M. N. Clifford, Researchgate, 2017, https://www.researchgate.net/publication/312590947.
- D. Wianowska, R. Typek and A. L. Dawidowicz, Phytochemistry, 2015, 117, 489–499 CrossRef CAS PubMed.
- M. N. Clifford, B. Kellard and G. G. Birch, Food Chem., 1989, 34, 81–88 CrossRef CAS.
- M. N. Clifford, B. Kellard and G. G. Birch, Food Chem., 1989, 33, 115–123 CrossRef CAS.
- M. N. Clifford, J. Kirkpatrick, N. Kuhnert, H. Roozendaal and P. R. Salgado, Food Chem., 2008, 106, 379–385 CrossRef CAS.
- G. F. Pauli, U. Kuczkowiak and A. Nahrstedt, Magn. Reson. Chem., 1999, 37, 827–836 CrossRef CAS.
- G. F. Pauli, F. Poetsch and A. Nahrstedt, Phytochem. Anal., 1998, 9, 177–185 CrossRef CAS.
- A. Könczöl, Z. Beni, M. M. Sipos, A. Rill, V. Hada, J. Hohmann, I. Mathe, C. Szantay Jr, G. M. Keseru and G. T. Balogh, J. Pharm. Biomed. Anal., 2012, 59, 83–89 CrossRef PubMed.
- N. Armesto, S. Ferrera and M. Ferrero, Tetrahedron, 2006, 62, 5401–5410 CrossRef CAS.
- M. Haribal, P. Feeny and C. C. Lester, Phytochemistry, 1998, 49, 103–108 CrossRef CAS.
- H. C. Kwon, C. M. Jung, C. G. Shin, J. K. Lee, S. U. Choi, S. Y. Kim and K. R. Lee, Chem. Pharm. Bull., 2000, 48, 1796–1798 CrossRef CAS PubMed.
- J. Y. Hur, P. Lee, H. Kim, I. Kang, K. R. Lee and S. Y. Kim, Biochem. Biophys. Res. Commun., 2004, 313, 948–953 CrossRef CAS PubMed.
- K. H. Kim, Y. Kim and K. R. Lee, Bioorg. Med. Chem. Lett., 2007, 17, 6739–6743 CrossRef CAS PubMed.
- A. Nugroho, K. H. Kim, K. R. Lee, M. B. Alam, J. S. Choi, W. B. Kim and H. J. Park, Arch. Pharmacal Res., 2009, 32, 1361–1367 CrossRef CAS PubMed.
- A. Nugroho, K. R. Lee, M. B. Alam, J. S. Choi and H. J. Park, Arch. Pharmacal Res., 2010, 33, 703–708 CrossRef CAS PubMed.
- H. J. Park, Arch. Pharmacal Res., 2010, 33, 1703–1720 CrossRef CAS PubMed.
- Y. Wang, M. Hamburger, J. Gueho and K. Hostettmann, Helv. Chim. Acta, 1992, 75, 269–275 CrossRef CAS.
- Y. Wang, V. Wray, N. Tsevegsuren, W. Lin and P. Proksch, Z. Naturforsch., C: J. Biosci., 2012, 67, 135–143 CrossRef CAS.
- M. Ono, C. Masuoka, Y. Odake, S. Ikegashira, Y. Ito and T. Nohara, Food Sci. Technol. Res., 2000, 6, 106–114 CrossRef CAS.
- R. Jaiswal, S. Deshpande and N. Kuhnert, Phytochem. Anal., 2011, 22, 432–441 CrossRef CAS PubMed.
- R. Jaiswal, M. F. Matei, A. Golon, M. Witt and N. Kuhnert, Food Funct., 2012, 3, 976–984 CAS.
- S. Deshpande, Ph.D. thesis, Jacobs University Bremen, Germany, 2014.
- B. M. Scholz and H. G. Maier, Z. Lebensm.-Unters. Forsch., 1990, 190, 132–134 CrossRef CAS.
- B. M. Scholz-Böttcher, E. Ludger and H. G. Maier, Liebigs Ann. Chem., 1991, 1029–1036 CrossRef.
- L. Z. Lin and J. M. Harnly, J. Agric. Food Chem., 2008, 56, 10105–10114 CrossRef CAS PubMed.
- R. Jaiswal and N. Kuhnert, J. Mass Spectrom., 2011, 46, 269–281 CrossRef CAS PubMed.
- M. N. Clifford, W. Wu, J. Kirkpatrick and N. Kuhnert, J. Agric. Food Chem., 2007, 55, 929–936 CrossRef CAS PubMed.
- L. Siracusa, T. Kulisic-Bilusic, O. Politeo, I. Krause, B. Dejanovic and G. Ruberto, J. Agric. Food Chem., 2011, 59, 12453–12459 CrossRef CAS PubMed.
- L. Zhang, Z. C. Tu, H. Wang, Z. F. Fu, Q. H. Wen and D. Fan, Food Chem., 2015, 186, 123–132 CrossRef CAS PubMed.
- D. X. Zhao, B. Q. Hu, M. Zhang, C. F. Zhang and H. X. Xu, J. Sep. Sci., 2015, 38, 571–575 CrossRef CAS PubMed.
- E. M. Sanchez-Salcedo, P. Mena, C. Garcia-Viguera, F. Hernandez and J. Jose Martinez, J. Funct. Foods, 2015, 18, 1039–1046 CrossRef CAS.
- P. Dugo, F. Cacciola, P. Donato, R. A. Jacques, E. B. Caramao and L. Mondello, J. Chromatogr. A, 2009, 1216, 7213–7221 CrossRef CAS PubMed.
- F. J. Herraiz, D. Villano, M. Plazas, S. Vilanova, F. Ferreres, J. Prohens and D. A. Moreno, Int. J. Mol. Sci., 2016, 17(3), 394, DOI:10.3390/ijms17030394.
- B. Abdennacer, M. Karim, M. Yassine, R. Nesrine, D. Mouna and B. Mohamed, Food Chem., 2015, 174, 577–584 CrossRef CAS PubMed.
- N. Kuhnert, I. Hakeem Said and R. Jaiswal, in Studies in Natural Products Chemistry, ed. U. R. Atta, Elsevier, Amsterdam, 2014, vol. 42, pp. 305–339 Search PubMed.
- M. M. Makola, P. Steenkamp, I. A. Dubery, M. M. Kabanda and N. E. Madala, Rapid Commun. Mass Spectrom., 2016, 30, 1011–1018 CrossRef CAS PubMed.
- X. Y. Zheng, R. S. Renslow, M. M. Makola, I. K. Webb, L. L. Deng, D. G. Thomas, N. Govind, Y. M. Ibrahim, M. M. Kabanda, I. A. Dubery, H. M. Heyman, R. D. Smith, N. E. Madala and E. S. Baker, J. Phys. Chem. Lett., 2017, 8, 1381–1388 CrossRef CAS PubMed.
- M. N. Clifford, W. Wu, J. Kirkpatrick, R. Jaiswal and N. Kuhnert, Rapid Commun. Mass Spectrom., 2010, 24, 3109–3120 CrossRef CAS PubMed.
- Z. Wang, M. N. Clifford and P. Sharp, Food Chem., 2008, 108, 379–383 Search PubMed.
- Z. Wang and M. N. Clifford, Food Chem., 2008, 106, 147–152 CrossRef CAS.
- M. N. Clifford, S. Stoupi and N. Kuhnert, J. Agric. Food Chem., 2007, 55, 2797–2807 CrossRef CAS PubMed.
- M. N. Clifford, W. Zheng and N. Kuhnert, Phytochem. Anal., 2006, 17, 384–393 CrossRef CAS PubMed.
- M. N. Clifford, W. Wu and N. Kuhnert, Food Chem., 2006, 95, 574–578 CrossRef CAS.
- M. N. Clifford, S. Marks, S. Knight and N. Kuhnert, J. Agric. Food Chem., 2006, 54, 4095–4101 CrossRef CAS PubMed.
- M. N. Clifford, S. Knight, B. Surucu and N. Kuhnert, J. Agric. Food Chem., 2006, 54, 1957–1969 CrossRef CAS PubMed.
- R. Jaiswal, H. Müller, A. Müller, M. G. E. Karar and N. Kuhnert, Phytochemistry, 2014, 108, 252–263 CrossRef CAS PubMed.
- R. Jaiswal, M. F. Matei, P. Subedi and N. Kuhnert, Food Res. Int., 2014, 61, 214–227 CrossRef CAS.
- R. Jaiswal, M. F. Matei, S. Deshpande and N. Kuhnert, in Handbook of Chemical and Biological Plant Analytical Methods Volume 2, ed. K. Hostettmann, S. Chen, A. Marston and H. Stuppner, Wiley, Oxford, 2014, pp. 505–524 Search PubMed.
- R. Jaiswal, M. G. E. Karar, H. A. Gadir and N. Kuhnert, Phytochem. Anal., 2014, 25, 567–576 CrossRef CAS PubMed.
- R. Jaiswal, E. A. Halabi, M. G. Karar and N. Kuhnert, Phytochemistry, 2014, 106, 141–155 CrossRef CAS PubMed.
- R. Jaiswal, H. Karakose, S. Ruhmann, K. Goldner, M. Neumuller, D. Treutter and N. Kuhnert, J. Agric. Food Chem., 2013, 61, 12020–12031 CrossRef CAS PubMed.
- M. F. Matei, R. Jaiswal and N. Kuhnert, J. Agric. Food Chem., 2012, 60, 12105–12115 CrossRef CAS PubMed.
- H. Karaköse, R. Jaiswal and N. Kuhnert, Characterization and quantification of hydroxycinnamate derivatives in Stevia rebaudiana leaves by LC–MSn, J. Agric. Food Chem., 2011, 59, 10143–10150 CrossRef PubMed.
- R. Jaiswal and N. Kuhnert, Food Funct., 2011, 2, 63–71 CAS.
- R. Jaiswal, J. Kiprotich and N. Kuhnert, Phytochemistry, 2011, 72, 781–790 CrossRef CAS PubMed.
- N. Kuhnert, R. Jaiswal, M. F. Matei, T. Sovdat and S. Deshpande, Rapid Commun. Mass Spectrom., 2010, 24, 1575–1582 CrossRef CAS PubMed.
- R. Jaiswal, M. A. Patras, P. J. Eravuchira and N. Kuhnert, J. Agric. Food Chem., 2010, 58, 8722–8737 CrossRef CAS PubMed.
- R. Jaiswal and N. Kuhnert, Rapid Commun. Mass Spectrom., 2010, 24, 2283–2294 CrossRef CAS PubMed.
- N. Kuhnert, G. H. Yassin, R. Jaiswal, M. F. Matei and C. H. Grun, Rapid Commun. Mass Spectrom., 2015, 29, 675–680 CrossRef CAS PubMed.
- R. Li, S. K. Liu, W. Song, Y. Wang, Y. J. Li, X. Qiao, H. Liang and M. Ye, Anal. Methods, 2014, 6, 7181–7189 RSC.
- F. Ferreres, D. M. Pereira, P. Valentao, P. B. Andrade, R. M. Seabra and M. Sottomayor, J. Agric. Food Chem., 2008, 56, 9967–9974 CrossRef PubMed.
- G. Stefkov, S. Hristovski, J. Petreska Stanoeva, M. Stefova, L. Melovski and S. Kulevanova, Ind. Crops Prod., 2014, 61, 145–150 CrossRef CAS.
- V. M. Jimenez, M. Gruschwitz, R. M. Schweiggert, R. Carle and P. Esquivel, Food Res. Int., 2014, 65, 42–46 CrossRef CAS.
- J. Han, M. Ye, X. Qiao, M. Xu, B. R. Wang and D. A. Guo, J. Pharm. Biomed. Anal., 2008, 47, 516–525 CrossRef CAS PubMed.
- Y. Y. Xie, J. L. Qu, Q. L. Wang, Y. Wang, M. Yoshikawa and D. Yuan, J. Agric. Food Chem., 2012, 60, 12574–12583 CrossRef CAS PubMed.
- M. Ramirez-Ambrosi, B. Abad-Garcia, M. Viloria-Bernal, S. Garmon-Lobato, L. A. Berrueta and B. A. Gallo, J. Chromatogr. A, 2013, 1316, 78–91 CrossRef CAS PubMed.
- L. W. Qi, C. Y. Chen and P. Li, Rapid Commun. Mass Spectrom., 2009, 23, 3227–3242 CrossRef CAS PubMed.
- E. N. Ncube, M. I. Mhlongo, L. A. Piater, P. A. Steenkamp, I. A. Dubery and N. E. Madala, Chem. Cent. J., 2014, 8, 66–75 CrossRef PubMed.
- N. E. Madala, F. Tugizimana and P. Steenkamp, J. Anal. Methods Chem., 2014, 2014, 650879 CAS.
- M. N. Clifford and N. E. Madala, J. Agric. Food Chem., 2017, 65, 3589–3590 CrossRef CAS PubMed.
- Y. Matsui, S. Nakamura, N. Kondou, Y. Takasu, R. Ochiai and Y. Masukawa, J. Chromatogr. B: Anal. Technol. Biomed. Life Sci., 2007, 858, 96–105 CrossRef CAS PubMed.
- L. Z. Lin and J. M. Harnly, J. Agric. Food Chem., 2008, 56, 10105–10114 CrossRef CAS PubMed.
- L. Z. Lin and J. M. Harnly, J. Agric. Food Chem., 2007, 55, 1084–1096 CrossRef CAS PubMed.
- J. Willems, M. M. Khamis, W. Mohammed Saeid, R. W. Purves, G. Katselis, N. Low and A. El-Aneed, Anal. Chim. Acta, 2016, 933, 164–174 CrossRef CAS PubMed.
- M. Lepelley, V. Mahesh, J. McCarthy, M. Rigoreau, D. Crouzillat, N. K. A. de Chabrillange and C. Campa, Planta, 2012, 236, 313–326 CrossRef CAS PubMed.
- B. Hamberger, M. Ellis, M. Friedman, C. de Azevedo Sousa, B. Barbasuk and C. Douglas, Can. J. Bot., 2007, 85, 1182–1201 CrossRef CAS.
- A. Chang, M. H. Lim, S. W. Lee, E. J. Robb and R. N. Nazar, J. Biol. Chem., 2008, 283, 33591–33601 CrossRef CAS PubMed.
- X. Zhang and C.-J. Liu, Mol. Plant, 2015, 8, 17–27 CrossRef CAS PubMed.
- R. Shi, C. M. Shuford, J. P.Wang, Y. H. Sun, Z. Yang, H. C. Chen, S. Tunlaya-Anukit, Q. Li, J. Liu, D. C. Muddiman, R. R. Sederoff and V. L. Chiang, Planta, 2013, 238, 487–497 CrossRef CAS PubMed.
- A. L. Schilmiller, J. Stout, J. K. Weng, J. Humphreys, M. O. Rueger and C. C. S. Chapple, Plant J., 2009, 60, 771–782 CrossRef CAS PubMed.
- R. Kumar, D. Vashisth, A. Misra, M. Q. Akhtar, S. U. Jalil, K. Shanker, M. M. Gupta, P. K. Rout, A. K. Gupta and A. K. Shasany, Sci. Rep., 2016, 6, 26458 CrossRef CAS PubMed.
- T. Vogt, Mol. Plant, 2010, 3, 2–20 CrossRef CAS PubMed.
- C.-H. Wang, J. Yu, Y.-X. Cai, P.-P. Zhu, C.-Y. Liu, A.-C. Zhao, R.-H. Lu, M. J. Li, F. X. Xu and M.-D. Yu, PLoS One, 2016, 11(5), e0155814 Search PubMed.
- M. M. Rigano, A. Raiola, T. Docimo, V. Ruggieri, R. Calafiore, P. Vitaglione, R. Ferracane, L. Frusciante and A. Barone, Front. Plant Sci., 2016, 7, 1484, DOI:10.3389/fpls.2016.01484.
- G. Sonannte, R. d'Amore, E. Blanco, C. L. Pierri, M. de Palma, J. Luo, M. Tucci and C. Martin, Plant Physiol., 2010, 153, 1224–1238 CrossRef PubMed.
- A. Moglia, A. Acquadro, K. Eljounaidi, A. M. Milani, C. Cagliero, P. Rubiolo, A. Genre, K. Cankar, J. Beekwilder and C. Comino, Front. Plant Sci., 2016, 2, 1424 Search PubMed.
- L. Z. Lin and J. M. Harnly, J. Agric. Food Chem., 2009, 57, 7401–7408 CrossRef CAS PubMed.
- L. A. Lallemand, C. Zubieta, S. G. Lee, Y. Wang, S. Acajjaoui, J. Timmins, S. McSweeney, J. M. Jez, J. G. McCarthy and A. A. A. McCarthy, Plant Physiol., 2012, 160, 249–260 CrossRef CAS PubMed.
- A. Moglia, S. Lanteri, C. Comino, L. Hill, D. Knevitt, C. Cagliero, P. Rubiolo, S. Bornemann and C. Martin, Plant Physiol., 2014, 166, 1777–1787 CrossRef PubMed.
- G. Legrand, M. Delporte, C. Khelif, A. Harant, C. Vuylsteker, M. Mörchen, P. Hance, J.-L. Hilbert and D. Gagneul, Front. Plant Sci., 2016, 7, 741, DOI:10.3389/fpls.2016.00741.
- L. L. Escamilla-Trevino, H. Shen, T. Hernandez, Y. Yin, Y. Xu and R. A. Dixon, Plant Mol. Biol., 2014, 84, 565–576 CrossRef CAS PubMed.
- Q. Yang, H. X. Trinh, S. Imai, A. Ishihara, L. Zhang, H. Nakayashiki, Y. Tosa and S. Mayama, Mol. Plant-Microbe Interact., 2004, 7, 81–89 CrossRef PubMed.
- C. Campa, M. Noirot, M. Bourgeois, M. Pervent, C. L. Ky, H. Chrestin, S. Hamon and A. De Kochko, Theor. Appl. Genet., 2003, 107, 751–757 CrossRef CAS PubMed.
- T. Joet, J. Salmona, A. Laffargue, F. Descroix and S. Dussert, Plant, Cell Environ., 2010, 33, 1220–1233 CAS.
- K. Kai, M. Mizutani, N. Kawamura, R. Yamamoto, M. Tamai, H. Yamaguchi, K. Sakata and B. Shimizu, Plant J., 2008, 55, 989–999 CrossRef CAS PubMed.
- D. Giordano, S. Provenzano, A. Ferrandino, M. Vitali, C. Pagliarani, F. Roman, F. Cardinale, S. D. Castellarin and A. Schubert, Plant Physiol. Biochem., 2016, 101, 23–32 CrossRef CAS PubMed.
- N. Itoh, C. Iwata and H. Toda, BMC Plant Biol., 2016, 16, 180, DOI:10.1186/s12870-016-0870-9.
- M. Kojima and I. Uritani, Plant Cell Physiol., 1972, 13, 1075–1084 CrossRef CAS.
- M. Takenaka, K. Nanayama, S. Isobe and M. Murata, Biosci., Biotechnol., Biochem., 2006, 70, 172–177 CrossRef CAS PubMed.
- M. Kojima and I. Uritani, Plant Physiol., 1973, 51, 768–771 CrossRef CAS PubMed.
- R. J. A. Villegas and M. Kojima, J. Biol. Chem., 1986, 261, 8729–8733 CAS.
- T. Shimizu and M. Kojima, J. Biochem., 1984, 95, 205–212 CrossRef CAS PubMed.
- M. Tanaka and M. Kojima, Arch. Biochem. Biophys., 1991, 284, 151–157 CrossRef CAS PubMed.
- M. Kojima and R. J. A. Villegas, Agric. Biol. Chem., 1984, 48, 2397–2399 CAS.
- M. Kojima and T. Kondo, Agric. Biol. Chem., 1985, 49, 2467–2469 CAS.
- S. Lunkenbein, M. Bellido, A. Aharoni, E. M. Salentijn, R. Kaldenhoff, H. A. Coiner, J. Muñoz-Blanco and W. Schwabe, Plant Physiol., 2006, 140, 1047–1058 CrossRef CAS PubMed.
- B. A. Babst, H. Y. Chen, H. Q. Wang, R. S. Payyavula, T. P. Thomas, S. A. Harding and C. J. Tsai, J. Exp. Bot., 2014, 65, 4191–4200 CrossRef CAS PubMed.
- M. M. Makola, I. A. Dubery, G. Koorsen, P. A. Steenkamp, M. M. Kabanda, L. L. du Preez and N. E. Madala, Evid. base. Compl. Alternative Med., 2016, 4138263, DOI:10:1155/2016/4138263.
- H. Karaköse, R. Jaiswal, S. Deshpande and N. Kuhnert, J. Agric. Food Chem., 2015, 63, 3338–3347 CrossRef PubMed.
- A. O. Taylor, Phytochemistry, 1968, 7, 63–71 CrossRef CAS.
- T. R. Nuringtyas, Y. H. Choi, R. Verpoorte, P. G. Klinkhammer and K. A. Leiss, Phytochemistry, 2012, 78, 89–97 CrossRef CAS PubMed.
- H. F. Harrison, T. R. Mitchell, J. K. Petersen, W. P. Wechter, G. F. Majetich and M. E. Smook, J. Am. Soc. Hort. Res., 2008, 113, 492–500 Search PubMed.
- E. Wojciechowska, C. H. Weinert, B. Egert, B. Trierweiler, M. Schmidt-Heydt, B. Horneburg, S. Graeff-Hönninger, S. E. Kulling and R. Geisen, Eur. J. Plant Pathol., 2014, 139, 735–747 CrossRef CAS.
- R. Niggeweg, A. J. Michael and C. Martin, Nat. Biotechnol., 2004, 22, 746–754 CrossRef CAS PubMed.
- M. I. Mhlongo, P. A. Steenkamp, L. A. Piater, N. E. Madala and I. A. Dubery, Front. Plant Sci., 2016, 7, 1527 Search PubMed.
- M.-H. Lee and R. M. Bostock, Phytopathology, 2007, 3, 269–277 CrossRef PubMed.
- V. Martinez, T. C. Mestre, F. Rubio, A. Girones-Vilaplana, D. A. Moreno, R. Mittler and R. M. Rivero, Front. Plant Sci., 2016, 7, 838, DOI:10.3389/fpls.2016.00838.
- L. Tamagnone, A. Merida, N. Stacey, K. Plaskitt, A. Parr, C. F. Chang, D. Lynn, J. M. Dow, K. Roberts and C. Martin, Plant Cell, 1998, 10, 1801–1816 CrossRef CAS.
- C. Cle, L. M. Hill, R. Niggeweg, C. R. Martin, Y. Guisez, E. Prinsen and M. A. Jansen, Phytochemistry, 2008, 69, 2149–2156 CrossRef CAS PubMed.
- A. Moglia, S. Lanteri, C. Comino, A. de Acquadro, R. de Vos and J. Beekwilder, J. Agric. Food Chem., 2008, 56, 8641–8649 CrossRef CAS PubMed.
- V. Petrulova, Z. Ducaiova and M. Repcak, Photochem. Photobiol., 2014, 90, 1061–1068 CAS.
- W. S. Pierpoint, Biochem. J., 1969, 112, 619–629 CrossRef CAS PubMed.
- R. F. Hurrell, P. A. Finot and J. L. Cuq, Br. J. Nutr., 1982, 47, 91–211 CrossRef.
- T. F. Kuijpers, C. E. Narvaez-Cuenca, J. P. Vincken, A. J. Verloop, W. J. van Berkel and H. Gruppen, J. Agric. Food Chem., 2012, 60, 3507–3514 CrossRef CAS PubMed.
- C. E. Narvaez-Cuenca, J. P. Vincken and H. Gruppen, J. Agric. Food Chem., 2013, 61, 1563–1572 CrossRef CAS PubMed.
- G. W. Felton, K. Donato, R. J. Del Vecchio and S. S. Duffey, J. Chem. Ecol., 1989, 15, 2667–2694 CrossRef CAS PubMed.
- G. W. Felton and S. S. Duffey, J. Chem. Ecol., 16, 1221–1236 CrossRef CAS PubMed.
- G. W. Felton, J. Workman and S. S. Duffey, J. Chem. Ecol., 1992, 18, 571–583 CrossRef CAS PubMed.
- M. N. Clifford, S. Marks, S. Knight and N. Kuhnert, J. Agric. Food Chem., 2006, 54, 4095–4101 CrossRef CAS PubMed.
- M. N. Clifford and S. Knight, Food Chem., 2004, 87, 457–463 CrossRef CAS.
- J. Y. Zhang, Z. J. Wang, Y. Li, Y. Li, W. Cai, C. Li, J. Q. Lu and Y. J. Qiao, Talanta, 2016, 47, 16–27 CrossRef PubMed.
- T. Stark, H. Justus and T. Hofmann, J. Agric. Food Chem., 2006, 54, 2859–2867 CrossRef CAS PubMed.
- R. M. Alonso-Salces, C. Guillou and L. A. Berrueta, Rapid Commun. Mass Spectrom., 2009, 23, 363–383 CrossRef CAS PubMed.
- M. N. Clifford and T. Jarvis, Food Chem., 1988, 9, 291–298 CrossRef.
- F. Anthony, M. N. Clifford and M. Noirot, Genet. Resour. Crop Evol., 1993, 40, 61–70 CrossRef.
- R. M. Alonso-Salces, F. Serra, F. Reniero and K. Héberger, J. Agric. Food Chem., 2009, 57, 4224–4235 CrossRef CAS PubMed.
- B. Mehari, M. Redi-Abshiro, B. S. Chandravanshi, S. Combrinck, M. Atlabachew and R. McCrindle, J. Food Comp. Anal., 2016, 45, 16–25 CrossRef CAS.
- L. C. Trugo and R. Macrae, Food Chem., 1984, 15, 219–227 CrossRef CAS.
- R. Jaiswal, M. F. Matei, A. Golon, M. Witt and N. Kuhnert, Food Funct., 2012, 3, 976–984 CAS.
- R. Jaiswal, M. F. Matei, P. Subedi and N. Kuhnert, Food Res. Int., 2014, 61, 214–227 CrossRef CAS.
- M. F. Matei, R. Jaiswal and N. Kuhnert, J. Agric. Food Chem., 2012, 60, 12105–12115 CrossRef CAS PubMed.
- S. Deshpande, R. Jaiswal, M. F. Matei and N. Kuhnert, J. Agric. Food Chem., 2014, 62, 9160–9170 CrossRef CAS PubMed.
- A. Stalmach, M. N. Clifford, G. Williamson and A. Crozier, in Tea, Cocoa and Coffee. Secondary Plant Metabolites and Health, ed. A. Crozier, H. Ashihara and F. Tomás-Barbéran, Wiley-Blackwell, Chichester, UK, 2012, pp. 169–192 Search PubMed.
- I. A. Ludwig, P. Mena, L. Calani, C. Cid, D. Del Rio, M. E. J. Lean and A. Crozier, Food Funct., 2014, 5, 1718–1726 CAS.
- C. E. Mills, M. J. Oruna-Concha, D. S. Mottram, G. R. Gibson and J. P. Spencer, The effect of processing on chlorogenic acid content of commercially available coffee, Food Chem., 2013, 141, 3335–3340 CrossRef CAS PubMed.
- T. L. Farrell, T. P. Dew, L. Poquet, P. Hanson and G. Williamson, Drug Metab. Dispos., 2011, 39, 2338–2346 CrossRef CAS PubMed.
- P. A. Guy, M. Renouf, D. Barron, C. Cavin, F. Dionisi, S. Kochhar, S. Rezzi, G. Williamson and H. Steiling, J. Chromatogr. B: Anal. Technol. Biomed. Life Sci., 2009, 877, 3965–3974 CrossRef CAS PubMed.
- T. Erk, M. Renouf, G. Williamson, R. Melcher, H. Steiling and E. Richling, Eur. J. Nutr., 2014, 53, 159–166 CrossRef CAS PubMed.
- M. Gomez-Juaristi, S. Martinez-Lopez, B. Sarria, L. Bravo and R. Mateos, Food Chem., 2018, 240, 1028–1038 CrossRef CAS PubMed.
- H. Ito, M. P. Gonthier, C. Manach, C. Morand, L. Mennen, C. Rémésy and A. Scalbert, Br. J. Nutr., 2005, 94, 500–509 CrossRef CAS PubMed.
- Y. Matsui, S. Nakamura, N. Kondou, Y. Takasu, R. Ochiai and Y. Masukawa, J. Chromatogr. B: Anal. Technol. Biomed. Life Sci., 2007, 858, 96–105 CrossRef CAS PubMed.
- D. Scherbl, M. Renouf, C. Marmet, L. Poquet, I. Cristiani, S. Dahbane, S. Emandy-Azar, J. Sauser, J. Galan, F. Dionisi and E. Richling, Eur. Food Res. Technol., 2017, 243, 791–806 CrossRef CAS.
- E. Azzini, R. Bugianesi, F. Romano, D. Di Venere, S. Miccadei, A. Durazzo, M. S. Foddai, G. Catasta, V. Linsalata and G. Maiani, Br. J. Nutr., 2007, 97, 963–969 CrossRef CAS PubMed.
- M. R. Olthof, P. C. Hollman and M. B. Katan, J. Nutr., 2001, 131, 66–71 CAS.
- M. Monteiro, D. Farah, D. Perrone, L. C. Trugo and C. Donangelo, Chlorogenic acid compounds from coffee are differentially absorbed and metabolized in humans, J. Nutr., 2007, 137, 2196–2201 CAS.
- A. Farah, M. Monteiro, C. M. Donangelo and S. Lafay, J. Nutr., 2008, 138, 2309–2315 CrossRef CAS PubMed.
- A. Stalmach, H. Steiling, G. Williamson and A. Crozier, Arch. Biochem. Biophys., 2010, 501, 98–105 CrossRef CAS PubMed.
- A. R. Rechner, J. P. Spencer, G. Kuhnle, U. Hahn and C. A. Rice-Evans, Free Radical Biol. Med., 2001, 30, 1213–1222 CrossRef CAS PubMed.
- M. Xie, G. Chen, B. Hu, L. Zhou, S. Ou, X. Zeng and Y. Sun, J. Agric. Food Chem., 2016, 64, 9624–9630 CrossRef CAS PubMed.
- C. Buchanan, G. Wallace and S. C. Fry, J. Sci. Food Agric., 1996, 71, 459–469 CrossRef CAS.
- M. F. Andreasen, P. A. Kroon, G. Williamson and M. T. Garcia-Conesa, J. Agric. Food Chem., 2001, 49, 5679–5684 CrossRef CAS PubMed.
- T. L. Farrell, M. Gomez-Juaristi, L. Poquet, K. Redeuil, K. Nagy, M. Renouf and G. Williamson, Mol. Nutr. Food Res., 2012, 56, 1413–1423 CAS.
- J. A. da Encarnaçao, T. L. Farrell, A. Ryder, N. U. Kraut and G. Williamson, Mol. Nutr. Food Res., 2015, 59, 231–239 Search PubMed.
- C. C. Wong, W. Meinl, H. R. Glatt, D. Barron, A. Stalmach, H. Steiling, A. Crozier and G. Williamson, J. Nutr. Biochem., 2010, 21, 1060–1068 CrossRef CAS PubMed.
- D. Couteau, A. L.McCartney, G. R. Gibson, G. Williamson and C. B. Faulds, J. Appl. Microbiol., 2001, 90, 873–881 CrossRef CAS PubMed.
- L. Poquet, M. N. Clifford and G. Williamson, Drug Metab. Dispos., 2008, 36, 190–197 CrossRef CAS PubMed.
- M. R. Olthof, P. C. Hollman, M. N. Buijsman, J. M. van Amelsvoort and M. B. Katan, J. Nutr., 2003, 133, 1806–1814 CAS.
- R. Suri and A. Crozier, J. Trop. Agric. Food Sci., 2012, 40, 221–232 Search PubMed.
- I. A. Ludwig, M. P. de Pēna, C. Cid and A. Crozier, BioFactors, 2013, 39, 623–632 CrossRef CAS PubMed.
- I. B. Jaganath, W. Mullen, C. A. Edwards and A. Crozier, Free Radical Biol. Med., 2006, 40, 1035–1046 CrossRef CAS PubMed.
- I. B. Jaganath, W. Mullen, M. E. J. Lean, C. A. Edwards and A. Crozier, Free Radical Biol. Med., 2009, 47, 1180–1189 CrossRef CAS PubMed.
- C. Czank, A. Cassidy, Q. Zhang, D. J. Morrison, T. Preston, P. A. Kroon, N. P. Botting and C. D. Kay, Am. J. Clin. Nutr., 2013, 97, 995–1003 CrossRef CAS PubMed.
- R. M. de Ferrars, C. Czank, Q. Zhang, N. P. Botting, P. A. Kroon, A. Cassidy and C. D. Kay, Br. J. Pharmacol., 2014, 171, 3268–3282 CrossRef CAS PubMed.
- I. A. Ludwig, P. Mena, L. Calani, G. Borges, G. Pereira-Caro, L. Bresciani, D. Del Rio, M. E. J. Lean and A. Crozier, Free Radical Biol. Med., 2015, 89, 758–769 CrossRef CAS PubMed.
- G. Pereira-Caro, G. Borges, J. J. J. van der Hooft, M. N. Clifford, M. E. J. Lean, D. Del Rio, S. A. Roberts, M. Kallerhals and A. Crozier, Am. J. Clin. Nutr., 2014, 100, 1385–1391 CrossRef PubMed.
- G. Pereira-Caro, G. Borges, I. Ky, A. Ribas, D. Del Rio, M. N. Clifford, S. A. Roberts and A. Crozier, Mol. Nutr. Food Res., 2015, 59, 465–475 CAS.
- G. Pereira-Caro, I. A. Ludwig, T. Polyviou, D. Malkova, A. Garcia, J. M. Morenon-Rojas and A. Crozier, J. Agric. Food Chem., 2016, 64, 5724–5735 CrossRef CAS PubMed.
- S. Roowi, A. Stalmach, W. Mullen, M. E. J. Lean, C. A. Edwards and A. Crozier, J. Agric. Food Chem., 58, 1296–1304 CrossRef CAS PubMed.
- J. I. Ottaviani, G. Borges, T. Momma, J. P. E. Spencer, C. L. Keen, A. Crozier and H. Schroeter, Sci. Rep., 2016, 6, 29034, DOI:101038/srep29034.
- J. A. da Encarnacao, T. L. Farrell, A. Ryder, N. U. Kraut and G. Williamson, Mol. Nutr. Food Res., 2015, 59, 231–239 Search PubMed.
- T. Erk, G. Williamson, M. Renouf, C. Marmet, H. Steiling, F. Dionisi, D. Barron, R. Melcher and E. Richling, Mol. Nutr. Food Res., 2012, 56, 1488–1500 CAS.
- A. Stalmach, G. Williamson and A. Crozier, Food Funct., 2014, 5, 1727–1737 CAS.
- G. Borges, M. E. J. Lean, S. A. Roberts and A. Crozier, Food Funct., 2013, 4, 754–762 CAS.
- G. S. Duarte and A. Farah, J. Agric. Food Chem., 2001, 59, 7925–7931 CrossRef PubMed.
- D. Tagliazucchi, A. Helal, E. Verzelloni and A. Conte, J. Agric. Food Chem., 2012, 60, 11056–11064 CrossRef CAS PubMed.
- M. Renouf, C. Marmet, P. Guy, A. L. Fraering, K. Longet, J. Moulin, M. Enslen, D. Barron, C. Cavin, F. Dionisi, S. Rezzi, S. Kochhar, H. Steiling and G. Williamson, J. Nutr., 2010, 140, 259–263 CrossRef CAS PubMed.
- S. V. Prigent, H. Gruppen, A. J. Visser, G. A. van Koningsveld, G. A. de Jong and G. A. Voragen, J. Agric. Food Chem., 2003, 51, 5088–5095 CrossRef CAS PubMed.
- C. Dupas, A. Marsset Baglieri, C. Ordonaud, D. Tome and M. N. Maillard, Mol. Nutr. Food Res., 2006, 50, 1053–1060 CAS.
- W. T. Phillips, J. G. Schwartz, R. Blumhardt and C. A. McMahan, J. Nucl. Med., 1991, 32, 377–381 CAS.
- D. Gentilcore, R. Chaikomin, K. L. Jones, A. Russo, C. Feinle-Bisset, J. M. Wishart, C. K. Rayner and M. Horowitz, J. Clin. Endocrinol. Metab., 2006, 91, 2062–2067 CrossRef CAS PubMed.
- A. Farah, T. De Paulis, D. P. Moreira, L. C. Trugo and P. R. Martin, J. Agric. Food Chem., 2006, 54, 374–381 CrossRef CAS PubMed.
- R. Mateos, L. Goya and L. Bravo, J. Agric. Food Chem., 2006, 54, 8724–8732 CrossRef CAS PubMed.
- L. C. Trugo and R. Macrae, Analyst, 1984, 109, 263–266 RSC.
- A. K. Sandhu, Y. Huang, D. Xiao, E. Park, I. Edirisinghe and B. Burton-Freeman, J. Agric. Food Chem., 2016, 64, 4891–4899 CrossRef CAS PubMed.
- C. Manach, D. Milenkovic, T. Van de Wiele, A. Rodrigues-Mateos, B. de Roos, M. T. Garcia-Conesa, R. Landberg, E. R. Gibney, M. Heinonen, F. Tomaa-Barberan and C. Morand, Mol. Nutr. Food Res., 2017, 61(6), 1600557 Search PubMed.
- A. Nkondjock, Cancer Lett., 2009, 277, 121–125 CrossRef CAS PubMed.
- S. K. Bøhn, N. C. Ward, J. M. Hodgson and C. D. Croft, Food Funct., 2012, 3, 575–591 Search PubMed.
- I. A. Ludwig, M. N. Clifford, M. E. J. Lean and A. Crozier, Food Funct., 2014, 5, 1695–1717 CAS.
- M. N. Clifford, Planta Med., 2004, 12, 1103–1114 CrossRef PubMed.
- B. Halliwell, J. Rafter and A. Jenner, Am. J. Clin. Nutr., 2005, 81, 268S–276S CAS.
- A. Scalbert, I. T. Johnson and M. Saltmarsh, Am. J. Clin. Nutr., 2005, 81, 215S–217S CAS.
- D. Del Rio, A. Rodrigues-Mateos, J. P. E. Spencer, M. Tognolini, G. Borges and A. Crozier, Antioxid. Redox Signaling, 2013, 18, 1818–1892 CrossRef CAS PubMed.
- A. M. Rodriguez-Mateos, D. Vauzour, C. G. Kreuger, D. Shanmuganayagam, J. Reed, L. Calani, P. Mena, D. Del Rio and A. Crozier, Arch. Toxicol., 2014, 88, 1803–1853 CrossRef CAS PubMed.
- E. Van Rymenant, J. Van Camp, C. Boydens, L. Vanden Daele, P. Beerens, P. Brouckaert, G. Smagghe, A. Kerimi, G. Williamson, C. Grootaert and J. Van der Voorde, J. Nutr. Biochem., 2017, 44, 44–51 CrossRef CAS PubMed.
- H. P. Amin, C. Czank, S. Raheem, Q. Zhang, N. P. Botting, A. Cassidy and C. D. Kay, Mol. Nutr. Food Res., 2015, 59, 1095–1106 CAS.
- E. F. Warner, Q. Zhang, K. S. Raheem, D. O'Hagan, M. A. O'Connell and C. Kay, J. Nutr., 2015, 146, 465–473 CrossRef PubMed.
- I. Krga, L.-E. Monfoulet, A. Konic-Ristic, S. Mercier, M. Glibetic, C. Morand and D. Milenkovic, Arch. Biochem. Biophys., 2016, 599, 51–59 CrossRef CAS PubMed.
- M. Monagas, N. Khan, C. Andrés-Lacueva, M. Urpí-Sardá, M. Vázquez-Agell, R. M. Lamuela-Raventós and R. Estruch, Br. J. Nutr., 2009, 102, 201–206 CrossRef CAS PubMed.
- G. Baeza, E.-M. Bachmair, S. Wood, R. Mateos, L. Bravo and B. de Roos, Food Funct., 2017, 8, 1333–1342 CAS.
- G. Assmann, P. Cullen, F. Jossa, B. Lewis and M. Mancini, Arterioscler., Thromb., Vasc. Biol., 1999, 19, 1819–1824 CrossRef CAS.
- A. González-Sarrías, M. A. Núñez-Sáchez, F. A. Tómas-Barberán and J. C. Espin, J. Agric. Food Chem., 2016, 65, 752–758 CrossRef PubMed.
- E. Verzelloni, C. Pellacani, D. Tagliazucchi, S. Tagliaferri, L. Calani, L. G. Costa, F. Brighenti, G. Borges, A. Crozier, A. Conte and D. del Rio, Mol. Nutr. Food Res., 2011, 55, S35–S43 CAS.
- G. Williamson and M. N. Clifford, Biochem. Pharmacol., 2017, 139, 24–39 CrossRef CAS PubMed.
Footnote |
| † Electronic supplementary information (ESI) available. See DOI: 10.1039/c7np00030h |
| This journal is © The Royal Society of Chemistry 2017 |