
 Open Access Article
 This Open Access Article is licensed under a
 Creative Commons Attribution 3.0 Unported Licence
Particle size, morphology and phase transitions in hydrothermally produced VO2(D)†
Diana
Teixeira
 ab,
Raul
Quesada-Cabrera
a,
Michael J.
Powell
a,
G. K. L.
Goh
b,
G.
Sankar
a,
I. P.
Parkin
a and
R. G.
Palgrave
*a
ab,
Raul
Quesada-Cabrera
a,
Michael J.
Powell
a,
G. K. L.
Goh
b,
G.
Sankar
a,
I. P.
Parkin
a and
R. G.
Palgrave
*a
aDepartment of Chemistry, Materials Chemistry Centre, University College London, 20 Gordon St., London WC1H 0AJ, UK. E-mail: r.palgrave@ucl.ac.u
bInstitute of Materials Research and Engineering, Agency for Science, Technology and Research (A*STAR), 2 Fusionopolis Way, Singapore 138634, Singapore
First published on 21st July 2017
Abstract
Different morphologies and sizes of VO2(D) particles were synthesised via hydrothermal synthesis using ammonium metavanadate (NH4VO3) or vanadium pentoxide (V2O5) as a vanadium precursor. By adjusting the concentration of vanadium precursors and the pH of the starting solution, a variety of morphologies and sizes of VO2(D) particles from 20 nm to 3 μm could be produced. A flower-shape morphology was obtained under strongly acidic conditions, passing through star-shape particles of 1 μm at pH 2.5 and finally obtaining homogeneous round balls of around 3 μm at pH 6.9. Nanoparticles were produced hydrothermally using V2O5 as a precursor and hydrazine as a reducing agent. The transition from VO2(D) to thermochromic VO2(R) in micron scale particles occurred at 350 °C under vacuum. However, the nanoparticles of VO2(D) had a significantly lower VO2(D) to thermochromic VO2(R) transition temperature of 165 °C after annealing for only a few minutes. This is, to our knowledge, the lowest annealing temperature and time reported in the literature in order to obtain a thermochromic VO2 material via another VO2 phase. After the conversion of VO2(D) microparticles to thermochromic VO2(R), the metal to insulator transition temperature is 61 ± 1 °C for the heating cycle and 53 ± 1 °C for the cooling cycle. However, VO2(R) nanoparticles showed a significantly reduced metal insulator transition temperature of 59 ± 1 °C and 42 ± 1 °C for the cooling cycle lower than that reported in the literature for bulk VO2. This is important due to the need for having a compound with a switching temperature closer to room temperature to be used in smart window devices for energy consumption. W-VO2(D) star shape microparticle samples were prepared using 2–7 at% of the dopant (using ammonium metavanadate as a precursor), although unexpectedly this does not seem to be a viable route to a reduced metal to insulator transition in this system.
1. Introduction
VO2 has been investigated for a wide range of technological applications, including optical and electrical switching devices, multifunctional spintronics,1 IR sensors and vision equipment, as coatings to prevent detection by reducing the IR transmittance of blackbody emitters,2 to missile seeker sensors, and various other applications.3 VO2 nanorods have been used to prepare Li-ion batteries with a discharge capacity of 152 mA h g−1.4 W-Doped VO2(B) nanobelts are used in supercapacitors.5 VO2 nano-flowers were synthesized by Kang et al. for energy-storage devices and supercapacitors.6 TiO2/VO2 nanofibers are reported to photocatalyze the degradation of pollutants from wastewater by Zhao et al.7 VO2(B) nanosheets were fabricated as a cathode electrode presenting a high initial discharge and stable cyclability compared to bulk VO2(B) as Want et al. reported in their work.8VO2 has also been widely studied for architectural applications due to its thermochromic properties: VO2 displays a reversible phase transition from a low temperature, monoclinic insulating phase, VO2(M) to a high temperature, rutile, metallic phase, VO2(R) at 68 °C.9 This metal to semiconductor phase transition (MST) is associated with an increase in reflectivity in the near infrared which has led to the use of VO2 as a thermochromic material, able to change its optical properties with temperature. Specifically, VO2 films coated onto windows can actively switch between a high IR transmittance state below the MST temperature to a low IR transmittance state above the MST temperature.
The transition temperature of undoped VO2(M) is 68 °C, which is too high for solar control coating applications. The transition temperature, however, can be reduced by doping with W, Ti, Mg or other ions; W doping is the most effective dopant, with a reduction of ∼25 °C per at% W incorporated. Therefore, doping is seen as an effective method to achieve Tc in the optimum range for thermochromic windows.10–12 Being able to reduce the phase transition temperature, towards room temperature, would allow for the maximum energy saving potential of solar control coatings.
Vanadium dioxide (VO2) has a well-known range of stable phases, such as VO2(M) and VO2(R), as well as metastable phases, such as VO2(A), VO2(B) and VO2(C).13,14 Most of these phases consist of octahedrally coordinated V4+ ions with different linkages of octahedra leading to different crystal structures.15 VO2(A) has a MST temperature of 162 °C. The solid has a good thermal stability and oxidation resistance in air below 408 °C.16 VO2(B) has been commonly used as a convenient route to achieving the VO2(M) phase by annealing at 450 °C or above under an inert atmosphere.17
VO2(D) is a newly discovered meta-stable phase17,18 that has gained attention in the VO2 field as it allows the direct transition to VO2(M) at relatively low temperatures (250–400 °C).13,18 Moreover, once the monoclinic phase is obtained from the VO2(D) phase, the MST temperature of the resulting VO2(M) material is lower (61 °C) than that widely reported in the literature (68 °C).13
VO2 can be produced from a wide range of methods, including atmospheric pressure chemical vapour deposition (APCVD),10,19 sputtering and spin coating20 and, continuous hydrothermal flow synthesis21 (CHFS) and hydrothermal synthesis22 among others. Nevertheless, the challenge to find an easy, scalable and affordable process to produce VO2(M) at low temperatures remains. A new approach to obtain VO2(M) in one step via hydrothermal synthesis has been reported recently;11,22 however the process is not easily reproducible due to the strict control required over experimental conditions such as temperature, pressure, time, pH, etc.
Here we report the synthesis of the VO2(D) phase. A range of particle sizes, from nano- to micro-particles, were observed. The particle size and shape could be easily tailored by varying the pH; furthermore, when in the form of nanoparticles, the VO2(D) to (M) phase transition could be achieved at annealing temperatures as low as 165 °C, significantly lower that previous reports on the VO2(D) to (M) phase transformation (ca. 400 °C). Moreover, the VO2(R) particles thus produced show a lower thermochromic transition temperature than expected for bulk vanadium dioxide. Finally we highlight the importance of particle size in controlling the phase behaviour of this important material. The advantages of producing nanoparticles of VO2 are that they can give superior luminous transmittance and solar energy transmittance modulation compared to VO2 films, as is reported in the literature by S.-Y. Li et al.23
2. Experimental section
2.1 Synthesis of VO2(D) microparticles
All reagents were obtained from Sigma Aldrich except for sodium hydroxide which was purchased from Alfa Aesar and were used without any further purification. In a typical reaction 0.625 g [0.0024 mol] of ammonium metavanadate (NH4VO3), 2.52 g of oxalic acid (C2H2O4) used as a reducing agent, and 0.5 g of polyvinylpyrrolidone (PVP) were mixed into 50 mL of deionized water under continuous stirring until a green solution was obtained, indicating the presence of V3 in the solution. The pH of the solution was adjusted using NaOH (1 M) (Table 1). Hydrothermal treatment was carried out using 27 mL of the resultant solution into a 45 mL Teflon lined autoclave and heated at 220 °C for 24 hours. Further studies were carried out using W-doped VO2(D) microparticles synthesised using 2–7 at% of WCl4 (relative to the vanadium precursor) added to the initial solution. The reaction conditions were the same as used for the undoped samples. After hydrothermal synthesis, particles were filtered and washed with deionized water and ethanol.| Sample | pH of the starting solution |
|---|---|
| S01 | 0.65 |
| S02 | 0.98 |
| S03 | 1.05 |
| S04 | 1.52 |
| S05 | 2.5 |
| S06 | 3.51 |
| S07 | 4.6 |
| S08 | 5.5 |
| S09 | 6.91 |
2.2 Synthesis of VO2(D) nanoparticles
To prepare VO2(D) nanoparticles, 0.45 g [0.0024 mol] of vanadium pentoxide (V2O5), 0.75 mL of sulfuric acid (H2SO4) and 0.25 mL of hydrazine hydrate were added to 10 mL of deionized water and stirred for 3–5 minutes. The pH of the solution was adjusted to 6.6–6.9 using NaOH (1 M) and finally the solution was centrifuged to obtain a grey paste. The grey paste was dissolved in 19 mL of DI water and poured into a 45 mL teflon lined autoclave and heated to 240 °C for 48 hours. The product was isolated by centrifugation and washed with deionized water and ethanol.In Table 2 the conditions used to prepare the VO2(D) nanoparticles are stated. The pH range must be controlled within a narrow range to avoid an undesired phase. Three samples are presented here to show the pH range that can be used.
| Sample | pH of the starting solution |
|---|---|
| S16 | 6.62 |
| S17 | 6.75 |
| S18 | 6.84 |
2.3 Materials characterisation
X-ray diffraction studies were carried out using a D8 GADDS Bruker diffractometer, utilising Cu Kα radiation (λ = 1.541 Å) between 10 and 60, 2θ. Field Emission Scanning Electron Microscopy (FESEM) analysis was performed using a JEOL JSM-6700Ff instrument with an accelerating voltage of 5 keV and Transmission Electron Microscopy (TEM) analysis was performed using a Phillips CM300 FEG TEM, operated at 300 kV. Differential scanning calorimetry (DSC) analysis was obtained on a DSC 1 instrument from Mettler Toledo. These experiments were carried out between 0 and 300 °C under a controlled nitrogen atmosphere with a heating ramp of 5 °C min−1. Raman spectroscopy was performed using a Renishaw 1000 spectrometer with a 633 nm laser. The equipment was calibrated using a silicon reference.3. Results and discussion
3.1 VO2 powder characterization
VO2 microparticles were produced through the hydrothermal reaction of ammonium metavanadate with oxalic acid in the presence of polyvinylpyrrolidone (PVP). Adjusting the pH of the initial reactant mixture with 1.0 M NaOH proved to be an easy and reproducible route to obtain microparticles of the VO2(D) phase with different morphologies. The conditions used in the VO2(D) microparticle synthesis are summarized in Table 1.Fig. 1 shows the XRD pattern of the prepared VO2(D) phase using NH4VO3 as a precursor with different pH values of the starting solution. All peaks shown in the as-prepared samples are indexed to the D phase of VO2. Fig. 1 presents the VO2(D) pattern reported in the literature for comparison purposes. All the VO2(D) peaks of the prepared samples match with the literature pattern.17
 | ||
| Fig. 1 XRD patterns of the VO2(D) microparticles as synthesised from the ammonium metavanadate precursor under different pH conditions. A reference XRD pattern of VO2(D) has been obtained from the literature.17 | ||
VO2(D) nanoparticles (20–40 nm) were obtained by hydrothermal synthesis using V2O5, hydrazine hydrate and sulfuric acid as starting reagents. In this case, changing the pH appears to affect the phase of vanadium oxide produced rather than the morphology. VO2(D) is formed only at pH between 6.6 and 6.9, outside this range, other phases, VO2(B) and VO2(A), or mixed phases of VO2 are obtained.
Fig. 2 shows the XRD of three as-prepared samples of VO2(D) nanoparticles with different pH values compared to the VO2(D) pattern reported in the literature.17
 | ||
| Fig. 2 XRD pattern of the prepared samples using vanadium pentoxide as a precursor and NaOH to adjust the pH of the solution. All peaks correspond to the VO2(D) phase shown in the literature.17 | ||
Raman spectroscopy was performed for the as-prepared samples with different pH values of the starting solution. The result obtained in all cases was the typical Raman spectroscopy bands for V2O5.24 When VO2 powder is exposed to air the surface of the sample tends to oxidize, thus when performing surface analysis as Raman, it is not unusual to obtain V2O5 in the results, which represent the 5+ oxidation state, the most stable one. In this case, Raman spectroscopy bands show typical bands of V2O5, indicating that some degree of oxidation has taken place in our samples.
SEM images of the VO2 microparticles are shown in Fig. 3, as can be seen, increasing the pH of the starting solution without changing any other condition results in the growth of the particle size, and also a change in the morphology. At pH 0.65 a “flower shape” morphology made of small attached long particles is seen, while moving towards neutral pH, larger smooth spheres are obtained.
 | ||
| Fig. 3 SEM of the prepared samples using ammonium metavanadate as a precursor with different pH values: (A) 0.65 (B) 0.98 (C) 1.05 (D) 1.52 (E) 2.50 (F) 3.51 (G) 4.60 (H) 6.91. | ||
In the present work ammonium metavanadate reacts with oxalic acid to produce vanadium(IV) oxide, carbon monoxide and carbon dioxide as can be seen in eqn (1)–(3), this solution have an acid pH, thus, small particle size, good homogeneity and low agglomeration are expected (and obtained in the as prepared samples):
| 2NH4VO3 + 4C2H2O4 → (NH4)2[(VO)2(C2O4)3] + 2CO2 + 4H2O | (1) |
| (NH4)2[(VO)2(C2O4)3] → 2VOC2O4 + 2NH3 + CO + CO2 + H2O | (2) |
| VOC2O4 → VO2 + CO + CO2 | (3) |
| NH4VO3 + 3NaOH → Na3VO4 + NH3 + 2H2 | (4) |
The pH of the starting precursor solution had a dramatic effect on the morphology observed in the synthesized VO2 particles Fig. 3. At a pH of 0.65, Fig. 3(A), a star/flower shape can be seen, similar to the desert rose formation of minerals. This morphology has been previously observed in other hydrothermally produced materials4,25 Increasing the pH of the starting solution to 0.98, Fig. 3(B), causes the flower shape to disappear and a series of circular fused plates can be seen, apparently formed by small long particles well attached to one another, almost forming a solid sphere. At a pH of 1.05, Fig. 3(C), the particles appear to be more spherical, with ridges present on the surface of the particles. Further increasing the pH to 1.52, Fig. 3(D), results in the formation of small cross-shape structures that are well defined can be seen to overlap to form larger structures. At a pH of 2.50, Fig. 3(E), the individual well-defined structures can still be seen; however it seems like their growth rate has being retarded. At pH values above 3.5, the particle shapes become more homogeneous, eventually adopting a sphere like shape. This can be seen in Fig. 3(F–H), where the higher pH of the starting precursor solution can be clearly seen to prevent the formation of smaller crystallite structures.
Particle sizes range from 1 μm at the most acidic pH to ∼4 μm when pH is close to neutral. It is interesting that the morphology in most of the cases has a round shape but always present a “Ball-shape” made of small long rods attached; the round shape can be attributed to the use of PVP as this has been reported as a crystal growth modifier.17 The presence of PVP in this experiments seems to be essential in the formation of the VO2(D) phase as reported by Liu Liang et al;17 if no PVP is added the product shows a pure VO2(B) phase.
The nanoparticles of VO2(D) were prepared using V2O5 as a precursor. In Fig. 4 SEM and TEM images of the as-prepared samples can be seen. The particle size is around 20–40 nm and presents mainly a round shape. The VO2(D) nanoparticles do not show any growth after heat treatment to convert to VO2(R), meaning that the final products remain as nanoparticles.
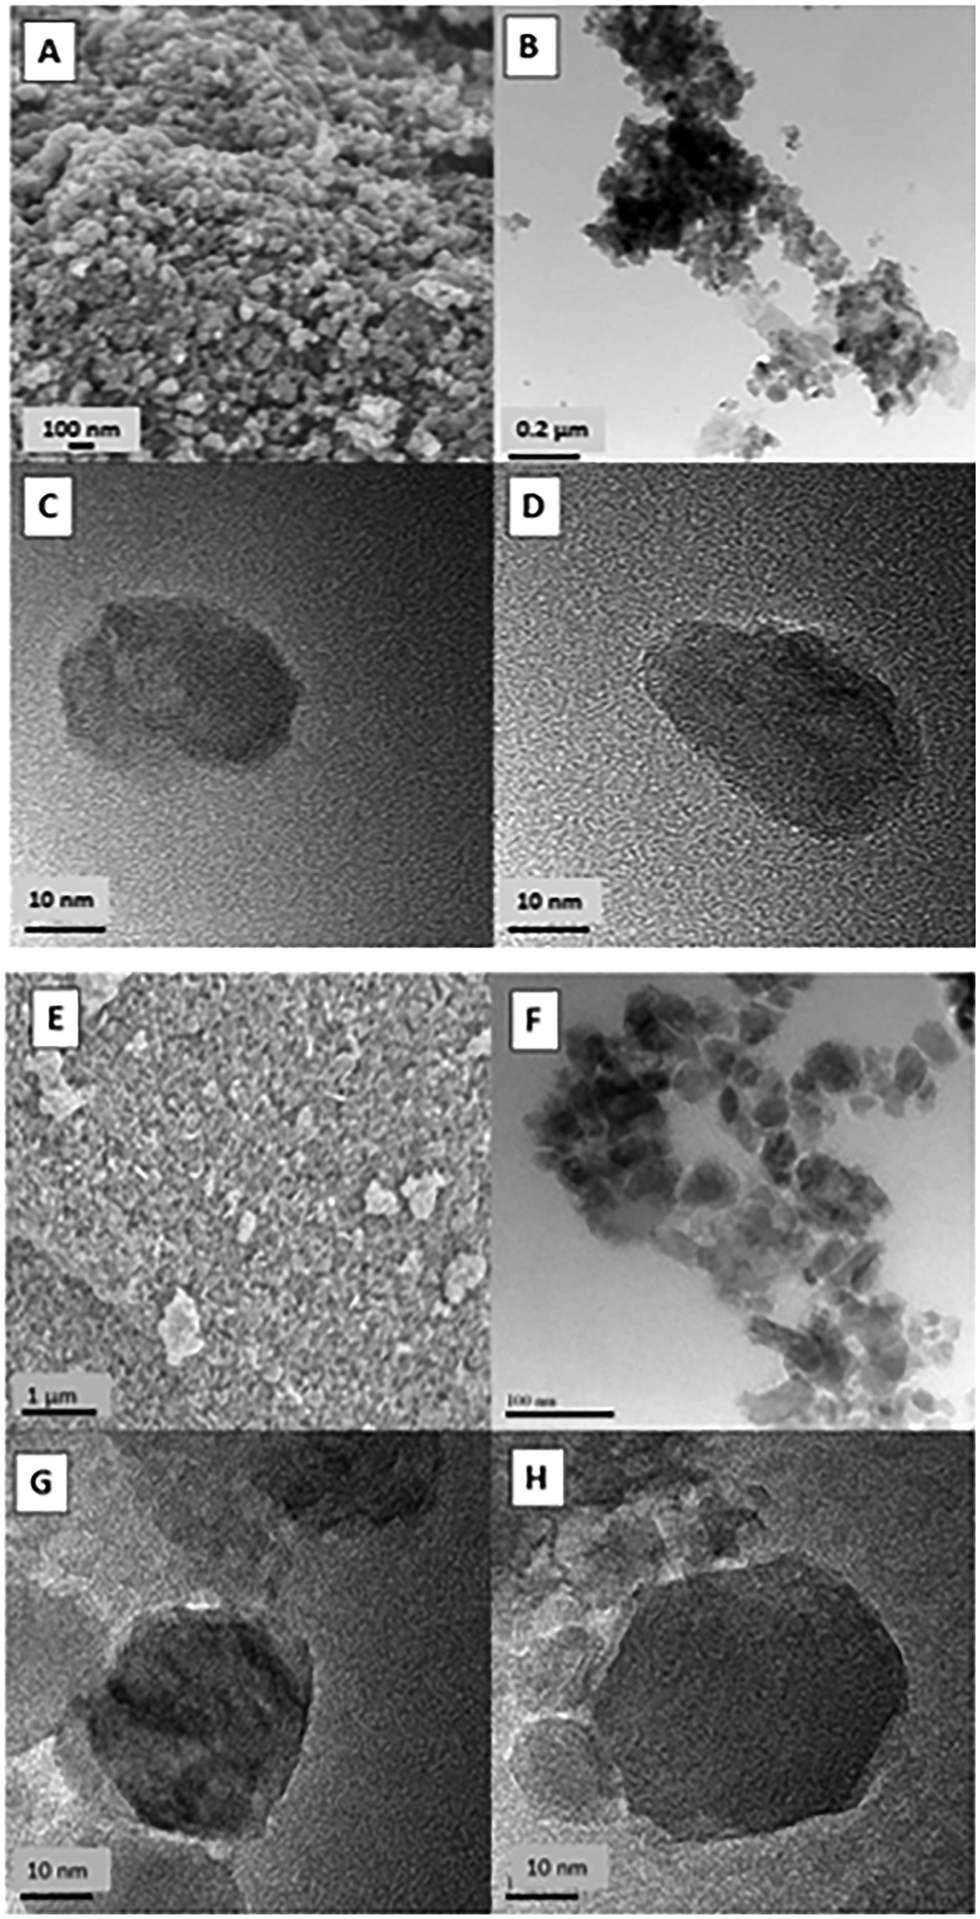 | ||
| Fig. 4 (A) SEM image of sample 16 (B–D) TEM images of sample 16 (E) SEM image of sample 17 (F–H) TEM images of sample 17. | ||
Hydrazine is well known to promote nanoparticle formation as it can coordinate to metal ions during hydrothermal synthesis.26 Hence we believe that hydrazine plays a critical role in the production of VO2(D) nanoparticles here.
3.2 Functional properties
The typical approach to obtain VO2(R) for thermochromic applications is by annealing the VO2(B) phase under vacuum at temperatures that range between 420 and 700 °C.27,28 The actual transformation temperature depends on the morphology of the VO2(B) particles; we noticed in this work that nanoparticles of VO2(D) require less time/temperature to transform into VO2(M) than VO2(D) microparticles. Importantly, the VO2(D) phase can be converted to thermochromic VO2(R) by thermal treatment at temperatures as low as 250 °C29 This is highly significant, as low temperature conversion allows preservation of the nanostructure of the parent phase, and as mentioned before, nanostructures show superior luminous transmittance and solar energy transmittance modulation, with this being a key point of the production of thermochromic VO2. The nano and microparticles produced in this work showed a significantly different phase transition behaviour. DSC was attempted to study the VO2(D) → VO2(R) transition in our microparticles. However, the maximum temperature of our DSC was 300 °C, and the desired transition did not occur in this temperature range. It was found that by annealing under vacuum the VO2(D) → VO2(M) transition occurred in our microparticles at around 350 °C. Once converted to thermochromic VO2(R), cooling to room temperature will cause a further transition to VO2(M). This VO2(M) material was then subjected to DSC to study the VO2(M) → VO2(R) transition, and the results are shown in Fig. 5. All studied samples present the same Tc to within 5 °C and for convenience only two samples are shown. As is shown in Fig. 5 there is a slight difference between the critical temperature for each sample, this may be due to morphology. In general the Tc is at 61 ± 3 °C for the heating cycle and 55 ± 2 °C for the cooling cycle, thus the thermal hysteresis width calculated from DSC is 6 ± 1 °C. | ||
| Fig. 5 DSC curves of VO2(R) obtained via micro-VO2(D) after heat treatment. | ||
Reported DSC in the literature of VO2(R) obtained in one step via hydrothermal synthesis shows a Tc temperature at 65 °C for the heating cycle and 53.5 °C for the cooling sample,30 while samples of VO2(R) obtained via VO2(A) using the hydrothermal synthesis method have a Tc for the heating cycle of 69 °C and 61 °C for the cooling sample.31 Samples of VO2(R) obtained via VO2(D) have a Tc of 67.5 °C for the heating cycle and 59.7 °C for the cooling cycle,13 while our results, using the same method present a Tc for the heating cycle of 61 ± 3 °C and 55 ± 2 °C for the cooling cycle, this represents 4–6 °C lower than that reported previously. The difference can be explained due to particle size and strain effect on our samples; it has to be noted that the microparticles shown here are formed by the accumulation of nanoparticles.
In the literature Lopez et al. reported the fabrication of VO2 nanoparticles using the ion implantation method, in their work it is demonstrated that the transition temperature it is decreased due particle size effects and moreover as a result of defects in VO2 that causes nucleation spots for the phase transition.32
Phase nucleation is reported to be due to vacancies, substitutions, etc.,33 oxygen vacancies are usually reported in the literature as defects on nanostructure surfaces;34 therefore while the size of the particles decreased, the surface ratio increased, consequently the nucleation defect density is higher in smaller particles causing the diminution of the transition temperature in the as-prepared nanoparticles, compared to the as-prepared microparticles.
In Table 3 DSC measurements of critical temperatures for the mentioned VO2(R) reported in the literature and in the present work are shown.
| Process | T c heating cycle (°C) | T c cooling sample (°C) | Hysteresis (°C) |
|---|---|---|---|
| VO2(R) one step hydrothermal synthesis11 | 65 | 53.5 | 12.5 |
| VO2(B) → VO2(R) hydrothermal synthesis35 | 68.75 | 59.77 | 8.98 |
| VO2(D) → VO2(R) hydrothermal synthesis29 | 67.5 | 57.9 | 9.6 |
| VO2(D) → VO2(R) hydrothermal synthesis (present work) | 61 ± 3 | 55 ± 2 | 8 |
Tungsten doped VO2(D) microparticles samples were synthesized in order to study the change in the transition temperature once the rutile phase is obtained after heat treatment of the prepared sample. It is well known in the literature that the addition of tungsten to the vanadium thermochromic samples decreases the transition temperature. In our case samples were doped with 2, 3 and 4 at% of tunsgten(IV) chloride.
Fig. 6 shows the DSC of three tungsten doped (2, 3 and 4 at%) VO2(M) samples, obtained via VO2(D). In all three samples the Tc for the heating cycle is at 62 ± 1 °C and the Tc for the cooling cycle in all cases is at 52 ± 1 °C. It is surprising that there is no significant change in the transition temperature as expected. It appears as if pre-doping of VO2(D) particles with W is not an effective method to lower the Tc in subsequently produced VO2(M); our results in fact suggest that W is not incorporated into the VO2(D) lattice using the hydrothermal approach used here, see the ESI,† for full details of W doping experiments.
 | ||
| Fig. 6 DSC curves of tungsten doped VO2(R) obtained via tungsten dope micro-VO2(D) after heat treatment. | ||
As discussed above, VO2(D) microparticle samples required annealing at 350 °C to obtain VO2(R). However for VO2(D) nanoparticles, a much lower annealing temperature is required. DSC illustrating the phase transitions occurring upon annealing under N2 of VO2(D) nanoparticles is shown in Fig. 7. In the first heating cycle of the as made materials, the first significant feature in the DSC curve occurs at 163 ± 2 °C, where a strong endothermic peak is seen. This is assigned to the VO2(D) → VO2(R) transition. No further transitions are seen upon heating up to 300 °C. In the first cooling cycle, no feature is seen at around 163 °C, showing that the phase transition observed in the heating cycle is irreversible. Upon further cooling, an exothermic peak is observed at 42 ± 1 °C; this is assigned to the VO2(R) → VO2(M) transition. In the second heating cycle, the system displays typical thermochromic behaviour. An endotherm peak is now observed at 59 ± 1 °C (VO2(M)–VO2(R)). No further signals are seen up to 300 °C. In the second cooling cycle, an exothermic peak is again observed at 42 ± 1 °C (VO2(R)–VO2(M)). It is noteworthy that in these samples the VO2(D) → VO2(R) transition temperature of 163 °C is significantly lower than that previously reported (250 °C),5 which we attribute to the small size of the particles. The thermochromic material thus produced also shows a lower MST temperature than expected from bulk vanadium dioxide. This has also been seen previously with nanoscale VO2.25
 | ||
| Fig. 7 DSC curves of VO2(R) obtained via nano-VO2(D) samples showing the transition from the D to R phase and then, the reversible thermochromic behaviour of VO2(R). | ||
4. Conclusion
VO2(D) microparticles were synthesised using NH4VO3 and oxalic acid as a precursor and a reducing agent, respectively via a hydrothermal synthesis reaction. We demonstrate in this work that it is possible to obtain pure VO2(D) with different morphologies by simply changing the pH of the starting solution using NaOH at 1 M concentration. A phase transformation from D to M is possible at 350 °C under vacuum obtaining a pure monoclinic phase with MST reported at 61 °C for the heating cycle and at 55 °C for the cooling cycle.W doping of VO2(D) microparticles was attempted, yet the MST temperature for each nominally doped sample was unchanged from undoped VO2, indicating that W doping of VO2(D) followed by conversion into VO2(R) does not appear to be successful.
VO2(D) nanoparticles were synthesized using vanadium pentoxide and sulfuric acid as a precursor and a reducing agent respectively. The size of the obtained particles oscillates between 20 and 40 nm. To obtain VO2(M) in this case the heat treatment of the sample is required at 165 °C for a few minutes under a nitrogen atmosphere. After the samples are heat treated a fully thermochromic sample is obtained with a MST for the heating cycle at 59 °C and 42 °C for the cooling cycle. This is the lowest VO2(D) → VO2(R) transition temperature reported in the literature, and shows the importance of particle size on phase transition temperatures. In addition the reported MST temperature in this work for VO2(M) nanoparticles obtained from VO2(D) is lower than that reported for bulk VO2. We attribute this to the particle size and strain in nanoparticles of VO2(R) produced from VO2(D).
References
- R. Molaei, R. Bayati, S. Nori, D. Kumar, J. T. Prater and J. Narayan, Appl. Phys. Lett., 2013, 103, 2–6 CrossRef.
- C. Moffatt and A. Wigstein, Sol-gel synthesis of VO2 thin films and the effects of W and Re doping, 2005 Search PubMed.
- H. Jerominek, F. Picard, N. R. Swart, M. Renaud, M. Lévesque, M. Lehoux, S. Castonguay, M. Pelletier, G. Bilodeau, D. Audet, T. D. Pope and P. Lambert, Proc. SPIE, 1996, 2746, 60–71 CrossRef CAS.
- C. V Subba, E. H. Walker, S. A. W. Sr, Q. L. Williams and R. R. Kalluru, Curr. Appl. Phys., 2009, 9, 1195–1198 CrossRef.
- Y. Zhang and Y. Huang, Mater. Lett., 2016, 182, 285–288 CrossRef CAS.
- X. Juan, J. Ming, X. Wen, F. Rui and Y. Xin, Ceram. Int., 2016, 42, 7883–7887 CrossRef.
- K. Zhao, L. Teng, Y. Tang and X. Chen, Ceram. Int., 2014, 40, 15335–15340 CrossRef CAS.
- Q. Wang, J. Pan, M. Li, Y. Luo, H. Wu, L. Zhong and G. Li, J. Mater. Sci. Technol., 2015, 31, 630–633 Search PubMed.
- Z. Chen, Y. Gao, L. Kang, C. Cao, S. Chen and H. Luo, J. Mater. Chem. A, 2014, 2, 2718 CAS.
- M. J. Powell, R. Quesada-cabrera, A. Taylor, D. Teixeira, I. Papakonstantinou, R. G. Palgrave, G. Sankar and I. P. Parkin, Chem. Mater., 2016, 28, 1369–1376 CrossRef CAS.
- J. Zhu, Y. Zhou, B. Wang, J. Zheng, S. Ji, H. Yao, H. Luo and P. Jin, Appl. Mater. Interfaces, 2015, 7, 27796–27803 CrossRef CAS PubMed.
- Y. Gao, S. Wang, H. Luo, L. Dai, C. Cao, Y. Liu, Z. Chen and M. Kanehira, Energy Environ. Sci., 2012, 6104–6110 CAS.
- Z. Song, L. Zhang, F. Xia and N. A. S. Webster, Inorg. Chem. Front., 2016, 3, 1035–1042 RSC.
- D. Hagrman, J. Zubieta, C. J. Warren, L. M. Meyer, M. M. J. Treacy and R. C. Haushalter, J. Solid State Chem., 1998, 182, 178–182 CrossRef.
- J. H. Park, J. M. Coy, T. S. Kasirga, C. Huang, Z. Fei, S. Hunter and D. H. Cobden, Nature, 2013, 500, 431–434 CrossRef CAS PubMed.
- Y. Zhang, X. Tan, C. Huang, C. Meng, Y. Zhang, X. Tan, C. Huang and C. Meng, Mater. Res. Innovations, 2016, 10, 295–302 Search PubMed.
- L. Liu, F. Cao, T. Yao, Y. Xu, M. Zhou, B. Qu, B. Pan, C. Wu, S. Wei and Y. Xie, New J. Chem., 2012, 36, 619 RSC.
- L. Zhong, M. Li, H. Wang, Y. Luo, J. Pan and G. Li, CrystEngComm, 2015, 17, 5614–5619 RSC.
- D. Louloudakis, D. Vernardou, E. Spanakis, S. Dokianakis, M. Panagopoulou, G. Raptis, E. Aperathitis, G. Kiriakidis, N. Katsarakis and E. Koudoumas, Phys. Status Solidi C., 2015, 860, 856–860 CrossRef.
- Y. Shimizu, K. Nagase, N. Miura and N. Yamazoe, Jpn. J. Appl. Phys., 1990, 29, 1708–1711 CrossRef.
- M. J. Powell, P. Marchand, C. J. Denis, J. C. Bear, J. A. Darr and I. P. Parkin, Nanoscale, 2015, 7, 18686–18693 RSC.
- J. H. Son, J. Wei, D. Cobden, G. Cao and Y. Xia, Chem. Mater., 2010, 22, 3043–3050 CrossRef CAS.
- S. Y. Li, G. A. Niklasson and C. G. Granqvist, J. Appl. Phys., 2010, 108, 1–8 CrossRef PubMed.
- C. Sanchez, J. Livage and G. Lucazeau, J. Raman Spectrosc., 1982, 12, 3–7 CrossRef.
- B. Lei, W. Qin, G. Kang, C. Peng and J. Wu, J. Am. Ceram. Soc., 2015, 1633, 1626–1633 CrossRef.
- H. Zhu, D. Yang, G. Yu and H. Zhang, Nanotechnology, 2006, 17, 2386–2389 CrossRef CAS.
- C. Wang, X. Wang, P. Gong and T. Yao, Chemosphere, 2016, 149, 358–365 CrossRef CAS PubMed.
- S. A. Corr, M. Grossman, Y. Shi, K. R. Heier, D. Stucky and R. Seshadri, J. Mater. Chem., 2009, 2, 4362–4367 RSC.
- G. Z. Song, L. Zhang, F. Xia, N. A. S. Webster, J. Song, B. Liu, H. Luoa and Y. Gao, Inorg. Chem., 2016, 3, 1035–1042 Search PubMed.
- W. Li, S. Ji, Y. Li, A. Huang, H. Luo and P. Jin, RSC Adv., 2014, 4, 13026 RSC.
- S. Rao, A. Artemenko, C. Labrugere and M. Miclau, J. Solid State Chem., 2014, 213, 79–86 CrossRef.
- R. Lopez, T. E. Haynes and L. A. Boatner, Phys. Rev. B: Condens. Matter Mater. Phys., 2002, 65, 1–5 CrossRef.
- L. Hongwei, L. Junpeng, Z. Minrui, T. S. Hai, S. C. Haur, Z. Xinhai and K. Lin, Opt. Express, 2014, 22, 30748–30755 CrossRef PubMed.
- J. Jeong, N. Aetukuri, T. Graf, T. D. Schladt, M. G. Samant and S. S. P. Parkin, Science, 2013, 339, 1402–1406 CrossRef CAS PubMed.
- M. Li, F. Kong, Y. Zhang and G. Li, CrystEngComm, 2011, 13, 2204 RSC.
Footnote |
| † Electronic supplementary information (ESI) available. See DOI: 10.1039/c7nj02165h |
| This journal is © The Royal Society of Chemistry and the Centre National de la Recherche Scientifique 2017 |