 Open Access Article
Creative Commons Attribution 3.0 Unported Licence
Control of structure, stability and catechol oxidase activity of copper(II) complexes by the denticity of tripodal platforms†
Ferenc
Matyuska
a,
Nóra V.
May
b,
Attila
Bényei
c and
Tamás
Gajda
 *a
*a
aDepartment of Inorganic and Analytical Chemistry, University of Szeged, Dóm tér 7, H-6720 Szeged, Hungary. E-mail: gajda@chem.u-szeged.hu
bResearch Centre for Natural Sciences HAS, Magyar tudósok körútja 2, H-1117 Budapest, Hungary
cDepartment of Pharmaceutical Chemistry, University of Debrecen, Egyetem tér 1, Debrecen H-4032, Hungary
First published on 22nd August 2017
Abstract
Copper(II) complexes of a new polydentate tripodal ligand trenpyz (L, tris[2-(5-pyrazolylmethyl)aminoethyl]amine) were characterized in both solution and solid states. A combined evaluation of potentiometric UV-Vis and EPR data provided both thermodynamic and structural information on the complexes formed in solution. In equimolar solution the highly stable square pyramidal CuHL and trigonal bipyramidal CuL are the dominant species at around pH 3 and 5–8, respectively. Above pH 8 further deprotonation was observed (pK = 9.56), which is related to the formation of a copper(II)-bound pyrazolate anion. This creates the possibility for the formation of oligonuclear complexes, through pyrazolate bridges, and at a 3/2 Cu(II)/L ratio three trinuclear complexes were identified, similar to the copper(II)–tachpyz (N,N′,N′′-tris(5-pyrazolylmethyl)-1,3,5-cis,cis-triamino-cyclohexane) system studied earlier. The trinuclear complexes of the two ligands have considerably different speciations, due to the different denticities of tripodal platforms. At the optimal pH the catechol oxidase activities of the triply deprotonated trinuclear complexes of trenpyz and tachpyz are similar, but the pH-rate constant profiles are significantly different, as a consequence of the deviations in their speciation. Consequently, the H2dtbc oxidation promoted by these trinuclear complexes can be easily controlled by the denticity of the tripodal ligands, since it affects the coordination environment of the central metal ion, which is proposed to be the main actor during the reaction.
Introduction
In order to develop tailor made metal ion chelators as well as efficient low molecular weight enzyme mimics, the favourable spatial distribution of donor atoms in tripodal ligands is frequently exploited.1–15 The derivatization of simple tripodal platforms, such as cis,cis-1,3,5-triaminocyclohexane (tach) and tris-(2-aminoethyl)amine (tren), provides additional donor site(s) to increase the thermodynamic stability of their metal complexes,4–8 or introduces further metal binding site(s) to create oligonuclear complexes.9–13Tachpyr (N,N′,N′′-tris(2-pyridylmethyl)-cis,cis-1,3,5-triaminocyclohexane) and trenpyr (tris[2-(2-pyridylmethyl)aminoethyl]amine) are two well-known and versatile polydentate tripodal ligands.4–8 The manganese(II) complex of trenpyr is a highly active SOD-mimicking compound.4 Tachpyr and some of its derivatives are promising chelators of 64/67Cu for radiotherapeutic uses5 and cytotoxic metal chelators with potential anti-tumor activity.6
Due to the favourable position of pyridine nitrogen atoms of tachpyr and trenpyr, these ligands embrace the metal ions by fused chelate rings. Therefore, their metal ion complexes have outstanding thermodynamic stability, although the coordination geometries are different for the two ligands.7–9 As a consequence of their encapsulating effect, these ligands rarely form oligonuclear complexes. Nevertheless, the heptadentate nature of trenpyr, and the analogous imidazole derivatives, allows the formation of tricopper(II) complexes, with rather long metal–metal separation.9,10 On the other hand, the bridging coordination of phenolate oxygens of tris(2-hydroxybenzylamino-ethyl)amine and its derivatives provide the formation of ferromagnetically coupled di-, tri- and tetranuclear cores with short metal–metal separations.11,12
In order to retain the encapsulating properties and to introduce an oligonucleating feature with short metal–metal distances, promoting in this way the cooperation of metal centres for enzyme mimicry, pyrazole-substitution seems to be well suited too.13 Pyrazolate-bridged metal complexes have received significant attention over recent decades,14,15 and such centres may efficiently mimic the function of both hydrolase16 and oxidoreductase enzymes.17,18
Recently, we prepared tachpyz (N,N′,N′′-tris(5-pyrazolylmethyl)-1,3,5-cis,cis-triamino-cyclohexane, Scheme 1), a new tripodal ligand,13 which forms a highly stable mononuclear complex. Nevertheless it readily transforms into a unique trinuclear species that features a tetra(pyrazolate)-bridged linear tricopper(II) core. According to the crystal structure determined for [Cu3H−4(tachpyz)2](ClO4)2·5H2O, the two peripheral metal ions have square pyramidal geometry, and the central copper(II) has tetrahedral geometry.13 The triply deprotonated trinuclear complex (Cu3H−3(tachpyz)2) is an efficient catechol oxidase mimic, which shows a surprisingly low pH optimum at pH = 5.6.
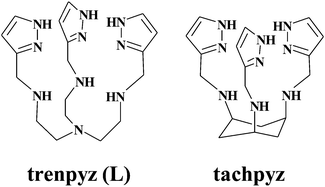 | ||
| Scheme 1 Schematic structure of the ligand trenpyz (L) studied in this work, and a related ligand studied earlier.13 | ||
In order to explore the role of tripodal platforms in the stability, structure and enzyme mimicry, we designed a new tripodal ligand (tris[2-(5-pyrazolylmethyl)aminoethyl]amine, trenpyz, Scheme 1), which is a tren-based variant of tachpyz. Here, we report the synthesis and crystal structure of trenpyz, as well as the study of its copper(II) complexes both in solution and in the solid state. To screen the enzyme mimetic properties of the copper(II)–trenpyz complexes, and to compare to those of tachpyr,13 we also investigated their catechol oxidase activity by using 3,5-di-tert-butylcatechol (H2dtbc) as the model substrate.
Experimental
Materials
A copper(II) perchlorate solution was prepared from analytically pure compounds obtained from Sigma-Aldrich and standardized complexometrically. A 0.1 M NaOH standard solution (Sigma) was used for pH titration. The compounds tris-(2-aminoethyl)amine (tren, Sigma-Aldrich) and 1H-pyrazole-5-carboxaldehyde (Novochemy Ltd), N-(2-hydroxyethyl)piperazine-N′-ethanesulfonic acid (HEPES, Sigma-Aldrich), 2-(cyclohexylamino)-ethanesulfonic acid (CHES, Sigma-Aldrich), 3,5-ditertbuthylcatechol (H2dtbc, Alfa Aesar), 4-nitrocatechol (H24nc, Sigma-Aldrich), dichloromethane (Molar Chemicals), acetonitrile (VWR) and trifluoracetic acid (TFA, Sigma-Aldrich) were analytically pure chemicals and used without further purification.Synthesis of tris[2-(5-pyrazolylmethyl)aminoethyl]amine (trenpyz, L)
0.349 g of tren (2.38 mmol) and 0.755 g of 1H-pyrazole-5-carboxaldehyde (7.85 mmol) were mixed in 50 ml of water-free methanol using 3 Å molecular sieves, and refluxed for 4 h. After cooling 1.0 g (26.6 mmol) of NaBH4 was added to the solution in small portions and stirred overnight. Then the methanol was evaporated, the crude product was dissolved in ethanol, and the pH was set to ∼2 with concentrated aqueous HCl. The precipitate formed under these conditions contained the remaining boric acid derivatives. After filtering, the filtrate was treated with dry HCl gas, which resulted in the precipitation of the crude product, as trenpyz·6HCl. In some cases further purification was performed by preparative HPLC (reverse phase column, Supelco C18, 25 cm × 10 mm geometry, 5 μm pore diameter, gradient elution mode, 3 ml min−1 flow rate, tr′ = 18 min), which, after lyophilization, yielded the TFA-salt of the ligand. The product was identified using LC-ESI-MS (Finnigan TSQ-7000) m/z calculated for [C18H31N10]+ 387.2733, found 387.2726 and 1H-NMR (H2O–D2O 90/10 solvent, Bruker Avance DRX 500): 7.68, d, 3H; 6.42, d, 3H; 4.21, s 6H; 3.06, t, 6H; 2.75 t, 6H, no other signals were detected. Elemental analysis (%): for C18H36N10Cl6·2H2O calcd: C 33.71, H 6.24, N 21.85; found: C 33.7, H 5.8, N 21.8. Melting point: 253–258 °C (decomposition). IR (KBr): ν = 3345 (m), 2950 (w), 2630 (s), 1457 (s), 1439 (s), 1400 (m), 1339 (w), 1281 (m), 1232 (m), 1215 (w), 1193 (w), 1155 (w), 1123 (w), 1105 (m), 1079 (w), 1048 (m), 1010 (w), 995 (m), 874 (m), 784 (s), 735 (w), 677 (w), 616 (m), 418 (w) cm−1. UV (in H2O): shoulders at 290 (ε = 2200 M−1 cm−1) and 230 nm (ε = 6000 M−1 cm−1).X-ray data collection, structure solution and refinement
Crystals suitable for X-ray diffraction were obtained upon slow evaporation at room temperature from an ethanolic solution (trenpyz·3HCl·2H2O) and from aqueous solution at pH = 8.2 containing Cu(ClO4)2 and trenpyz in a 1![[thin space (1/6-em)]](https://www.rsc.org/images/entities/char_2009.gif) :
:![[thin space (1/6-em)]](https://www.rsc.org/images/entities/char_2009.gif) 1 concentration ratio (compound 1). The data collection on the free ligand trenpyz·3HCl·2H2O was performed at 25 °C on a Bruker-Nonius MACH3 diffractometer using Mo Kα radiation, and semi-empirical absorption collection was performed by collecting psi-scan data. The blue single crystal of 1 was mounted on a loop and transferred to the goniometer. X-ray diffraction data were collected at −170 °C on a Rigaku RAXIS-RAPID II diffractometer using also Mo Kα radiation. A numerical absorption correction19 was carried out using the program CrystalClear.20 Sir201421 and SHELXL22 under WinGX23 software were used for solution and refinement, respectively. The model was refined by full-matrix least squares on F2. A summary of data collection parameters is given in Table 1. In the structure, hydrogen atom positions were located in difference electron density maps and placed into geometric positions. They were included in structure factor calculations but they were not refined except the water protons in the structure of trenpyz·3HCl·2H2O, where the O–H distances were restrained. These hydrogen atoms were shifting significantly between two orientations of the water molecules; however this not affected by the correctness of the structure determination significantly.
1 concentration ratio (compound 1). The data collection on the free ligand trenpyz·3HCl·2H2O was performed at 25 °C on a Bruker-Nonius MACH3 diffractometer using Mo Kα radiation, and semi-empirical absorption collection was performed by collecting psi-scan data. The blue single crystal of 1 was mounted on a loop and transferred to the goniometer. X-ray diffraction data were collected at −170 °C on a Rigaku RAXIS-RAPID II diffractometer using also Mo Kα radiation. A numerical absorption correction19 was carried out using the program CrystalClear.20 Sir201421 and SHELXL22 under WinGX23 software were used for solution and refinement, respectively. The model was refined by full-matrix least squares on F2. A summary of data collection parameters is given in Table 1. In the structure, hydrogen atom positions were located in difference electron density maps and placed into geometric positions. They were included in structure factor calculations but they were not refined except the water protons in the structure of trenpyz·3HCl·2H2O, where the O–H distances were restrained. These hydrogen atoms were shifting significantly between two orientations of the water molecules; however this not affected by the correctness of the structure determination significantly.
| trenpyz·3HCl·2H2O | 1 | |
|---|---|---|
| Empirical formula | C36H74N20Cl6O4 | C18H30N10O8Cl2Cu |
| Molecular formula | 2(C18H30N10)·6(HCl)·4(H2O) | [Cu(C18H30N10)](ClO4)2 |
| Color/shape | Colourless/block | Blue/chunk |
| Formula weight | 1063.85 | 648.96 |
| Temperature (K) | 298(1) | 103(2) |
| Radiation and wavelength (Å) | Mo-Kα, λ = 0.71073 | Mo-Kα, λ = 0.71073 |
| Crystal system | Cubic | Monoclinic |
| Space group | I23 | P21/c |
| Unit cell dimensions | ||
| a (Å) | 18.125(2) | 17.1341(13) |
| b (Å) | 18.125(2) | 9.4399(6) |
| c (Å) | 18.125(2) | 17.6883(14) |
| β (°) | 90 | 117.2190(10) |
| Volume (Å3) | 5954(2) | 2544.2(3) |
| Z/Z′ | 4/0.1666 | 4/1 |
| Density (calc.) (mg m−3) | 1.187 | 1.694 |
| Absorption coefficient, μ (mm−1) | 0.34 | 1.135 |
| F(000) | 2256 | 1340 |
| Crystal size (mm) | 0.32 × 0.30 × 0.25 | 0.30 × 0.30 × 0.10 |
| Absorption correction | psi-scan | Numerical |
| Max. and min. transmission | 0.9909, 0.5263 | 0.4286, 0.7893 |
| θ-range for data collection (°) | 3.6 ≤ θ ≤ 25.3 | 3.115 ≤ θ ≤ 25.349 |
| Index ranges | −2 ≤ h ≤ 21; −8 ≤ k ≤ 11; 0 ≤ l ≤ 21 | −20 ≤ h ≤ 20; −11 ≤ k ≤ 11; −21 ≤ l ≤ 21 |
| No. reflections collected | 3204 | 74![[thin space (1/6-em)]](https://www.rsc.org/images/entities/char_2009.gif) 390 390 |
| Completeness to 2θ | 0.963 | 0.998 |
| No. independent reflections (Rint) | 977 (0.093) | 4660 (0.0972) |
| Reflections I > 2σ(I) | 803 | 4124 |
| Refinement method | Full-matrix least squares on F2 | Full-matrix least squares on F2 |
| Data/restraints/parameters | 977/7/118 | 4660/7/365 |
| Goodness-of-fit on F2 | 1.04 | 1.045 |
| Final R indices [I > 2σ(I)], R1, wR2 | 0.0878, 0.2215 | 0.0491, 0.1205 |
| R indices (all data) R1, wR2 | 0.0984, 0.2403 | 0.0563, 0.1259 |
| Max. and mean shift/esd | 0.491, 0.034 | 0.000, 0.000 |
| Largest diff. peak and hole (e Å−3) | 0.53; −0.31 | 0.507; −0.647 |
The isotropic displacement parameters of the hydrogen atoms were approximated from the U(eq) value of the atom they were bonded to. Refinement of non-hydrogen atoms was carried out with anisotropic temperature factors except for the disordered oxygens of one of the perchlorate anions. Selected bond lengths and angles of compound 1 were calculated using PLATON software.24 The graphical representation and the editing of CIF files were done by the Mercury25 and PublCif26 software, respectively.
Potentiometric measurements
The protonation and coordination equilibria were investigated by potentiometric titrations in aqueous solution (I = 0.1 M NaCl, and T = 298.0 ± 0.1 K) under Ar using an automatic titration set including a PC controlled Dosimat 665 (Metrohm) autoburette and an Orion 710A precision digital pH-meter. The Metrohm Micro pH glass electrode (125 mm) was calibrated via the modified Nernst equation27(1): | (1) |
The complex formation is described by a general equilibrium process as follows:
 | (2) |
 | (3) |
The protonation constants were determined from four independent titrations (90 data points per titration), with a ligand concentration of ∼3 × 10⁻³ M. The complex formation constants were evaluated from 5–7 independent titrations (∼90 data points per titration). The metal-to-ligand ratios were 3![[thin space (1/6-em)]](https://www.rsc.org/images/entities/char_2009.gif) :
:![[thin space (1/6-em)]](https://www.rsc.org/images/entities/char_2009.gif) 2, 1
2, 1![[thin space (1/6-em)]](https://www.rsc.org/images/entities/char_2009.gif) :
:![[thin space (1/6-em)]](https://www.rsc.org/images/entities/char_2009.gif) 1, and 1
1, and 1![[thin space (1/6-em)]](https://www.rsc.org/images/entities/char_2009.gif) :
:![[thin space (1/6-em)]](https://www.rsc.org/images/entities/char_2009.gif) 2. The metal ion concentrations varied between 3 and 6 × 10⁻³ M, depending on the metal-to-ligand ratio.
2. The metal ion concentrations varied between 3 and 6 × 10⁻³ M, depending on the metal-to-ligand ratio.
For pH determination in a 50% (m/m) ethanol–water mixture the pH glass electrode was calibrated by standard aqueous buffer solutions (pH = 4.0, 7.0, 9.0, Sigma). The actual pH in this mixed solvent was determined by subtracting 0.21 units from the pH-reading, according to the method of Bates.30 The autoionization constant of water in this medium is pKw = 14.84.31 To determine the complex speciation in the 50% (m/m) ethanol–water mixture and at a 3/2 metal-to-ligand ratio the characteristic UV-Vis spectra obtained above pH 2.2 were used (above this pH the concentration of an uncomplexed ligand is negligible). For the evaluation of the spectra using the PSEQUAD program H+, CuL and Cu2+ were set as basic components. In this way a correct speciation of complexes was obtained by refining the log![[thin space (1/6-em)]](https://www.rsc.org/images/entities/char_2009.gif) K values for the equilibrium reactions listed in Table 2.
K values for the equilibrium reactions listed in Table 2.
| pqr | log![[thin space (1/6-em)]](https://www.rsc.org/images/entities/char_2009.gif) βpqr βpqr |
|||
|---|---|---|---|---|
| Trenpyz | trena | trenpyrb | tachpyzc | |
| a Ref. 36. b In 1 M KNO3ref. 9. c Ref. 13. d Determined in a 50% ethanol–water solvent. | ||||
| 041 | 26.67 | |||
| 031 | 24.04(1) | 27.95 | 24.17 | 21.50 |
| 021 | 17.34(1) | 19.53 | 17.26 | 16.00 |
| 011 | 9.15(1) | 10.12 | 9.12 | 8.84 |
| 111 | 23.84(1) | 27.7 | 18.80 | |
| 101 | 19.73(2) | 18.50 | 21.4 | 16.10 |
| 1−11 | 10.29(1) | 9.33 | — | — |
| 3−22 | 35.99(1) | — | — | 27.97 |
| 3−32 | 28.68(2) | — | — | 23.11 |
| 3−42 | 19.96(2) | — | — | 17.25 |
UV-Vis, CV, EPR and NMR measurements
UV-Vis spectra were measured on a Thermo Scientific Evolution 200 spectrophotometer using a cell with a 1 cm optical path length. Similar concentrations were used as described above for the potentiometric titration. The individual UV-Vis spectra of the complexes were calculated using PSEQUAD.29Cyclic voltammetric measurements were performed using a conventional three-electrode system in an Ar atmosphere and a PC-controlled Autolab-PGSTAT 204 potentiostat at 5 mV s−1 scan rate between −0.59 and −1.41 V. Platinum working, platinum auxiliary and Ag/AgCl/KCl (3 M) reference electrodes were used. Electrochemical potentials were converted into a normal hydrogen electrode scale by adding 0.21 V to the measured potential.32 The system was calibrated with aqueous solution of 5 mM K3Fe(CN)6 (0.1 M NaCl). Cyclic voltammograms of the copper(II)–trenpyz 3/2 system were measured at 298 K in a 50% (m/m) ethanol–water mixture at pH = 7.2 using 0.1 M tetrabutylammonium nitrate as a background electrolyte.
The EPR spectra were recorded at room temperature and at 77 K using a BRUKER EleXsys E500 spectrometer (microwave frequency 9.81 GHz, microwave power 13 mW, modulation amplitude 5 G, modulation frequency 100 kHz). The EPR spectra were determined in aqueous solutions, and were simulated using a spectral decomposition algorithm.33 Since a copper(II) salt used to make the stock solution was a natural mixture of isotopes, the spectrum of each species was calculated as the sum of spectra containing 63Cu and 65Cu weighted by their natural abundance. The copper and ligand coupling constants are given in units of gauss (1 G = 10−4 T).
The 1H NMR measurements were performed on a Bruker Avance DRX 500 spectrometer. The spectra were recorded at 25 °C in a 10% D2O/H2O or 100% D2O solution, at ligand concentrations of ∼3.0 × 10⁻³ M with a tube diameter of 5 mm. The chemical shifts (δ) were measured relative to SiMe4. Data were processed using the Topspin 2.0 software package (Bruker).
Catechol oxidase activity measurements
The oxidation of 3,5-ditertbuthylcatechol (H2dtbc) in the presence and absence of the copper–trenpyz system was followed spectrophotometrically on a Thermo Scientific Evolution 200 spectrophotometer at the absorption maximum of the product 3,5-di-tert-butyl-o-benzoquinone (dtbq, 400 nm, ε = 1900 M−1 cm−1). Due to the low solubility of dtbq, a 50 m/m% ethanol–water mixture was used as the solvent. The pH of the solution was set by buffers (0.02 M CHES–HEPES, I = 0.1 M, T = 298 K), and dioxygen-saturated ethanol was used to prepare the reaction mixture. To determine the dependence of the rate on the dioxygen concentration, a mixture of dioxygen- and argon saturated solutions was used. After mixing the two phases, the solution was equilibrated at 298 K for 2–3 minutes, and the reaction was initiated by adding the substrate. The auto-oxidation of 3,5-di-tert-butylcatechol was also determined for each substrate concentration and the pH value to be subtracted from the overall effect in order to obtain the pseudo-first order reaction constant kobs,corr. Kinetic studies were carried out using the method of initial rates, up to 4% conversion. The reported data are averages of three parallel experiments. The maximum deviation from the main value did not exceed 10%.The binding of 4-nitrocatechol (H24nc) to the trinuclear complexes was studied under the same conditions as used for kinetic measurements. The formation of hydrogen peroxide during the oxidation of H2dtbc was demonstrated and quantified in aqueous solution using TiOSO4via the formation of the [Ti(O2)(OH)]+ complex (ε(408 nm) = 935 M−1 cm−1). In a typical experiment 25 ml of the reaction mixture was prepared (T = 298 K, 0.02 M CHES–HEPES, I = 0.1 M, pH = 8.1, [Cu2+]/[L] = 3![[thin space (1/6-em)]](https://www.rsc.org/images/entities/char_2009.gif) :
:![[thin space (1/6-em)]](https://www.rsc.org/images/entities/char_2009.gif) 2) and the reaction was initiated by the addition of H2dtbc ([H2dtbc]0 = 0.1 mM). O2 gas was bubbled through the solution. After different time intervals (8, 16, 35, 60, 90 min) 4.5 ml of the sample was taken and treated with 0.5 ml of 20% H2SO4 to freeze the reaction. Afterwards it was extracted with 2 × 5 ml of dichloromethane to remove the remaining substrate and the quinone product. The aqueous phase was treated with excess TiOSO4, and the UV-Vis spectrum of the resulting solution was recorded. Parallel with this determination, the formation of dtbq was also quantified under the same conditions, without the extraction step. After adding 20% H2SO4 and ethanol to freeze the reaction and to obtain a 50 m/m% ethanol–water mixture, the UV-Vis spectrum of the sample was recorded.
2) and the reaction was initiated by the addition of H2dtbc ([H2dtbc]0 = 0.1 mM). O2 gas was bubbled through the solution. After different time intervals (8, 16, 35, 60, 90 min) 4.5 ml of the sample was taken and treated with 0.5 ml of 20% H2SO4 to freeze the reaction. Afterwards it was extracted with 2 × 5 ml of dichloromethane to remove the remaining substrate and the quinone product. The aqueous phase was treated with excess TiOSO4, and the UV-Vis spectrum of the resulting solution was recorded. Parallel with this determination, the formation of dtbq was also quantified under the same conditions, without the extraction step. After adding 20% H2SO4 and ethanol to freeze the reaction and to obtain a 50 m/m% ethanol–water mixture, the UV-Vis spectrum of the sample was recorded.
Results and discussion
Crystal structure of trenpyz
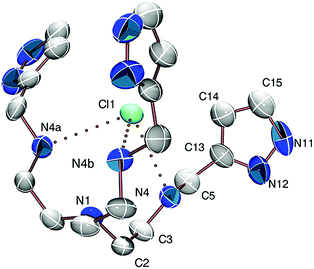
The triply protonated ligand trenpyz·3HCl·2H2O crystallized in the cubic I21 space group. Bond distances and angles (Table S1 in the ESI†) are normal and unstrained. Actually, in this cubic lattice the asymmetric unit contains one arm of the ligand and two different chloride and two water places. The N1–C2–C3–N4 torsion angle is 70.7(9)° (Fig. 1 and Table S1, ESI†), which results in the formation of a tripodal cage suitable to encapsulate a chloride ion by three H-bonds to the secondary nitrogen atoms. The (N–H)+⋯Cl1 and N–Cl1 distances are 2.337 Å and 3.216 Å, respectively, with N–H⋯Cl1 angles of 169.56°. The other two, non-encapsulated chlorides also serve as acceptors for the secondary nitrogen atoms ((N–H)+⋯Cl2 and N–Cl2 distances are 2.214 Å and 3.091 Å, respectively), and are involved in further H-bonds with pyrazol NH and water protons (Fig. S1, ESI†). The chloride ion bound to the tripodal, C3-symmetric cavity induces pre-organization of the ligand, similar to that needed for metal ion binding.Crystal structure of [Cu(trenpyz)](ClO4)2
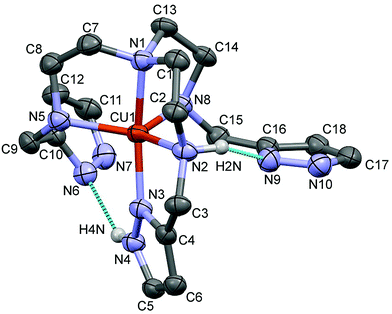
The complex crystallized in the monoclinic P21/c space group with the inclusion of two perchlorate anions (the packing arrangement is shown in Fig. S2, ESI†). The Ortep representation of the [Cu(trenpyz)]2+ cation is shown in Fig. 2. Some selected structural parameters of the metal complex cation are collected in the legend of Fig. 2. In the pentacoordinated structure four nitrogen atoms are coordinating to the copper centre in short distances (1.97–2.07 Å), while the Cu1–N8 bond is slightly longer (2.15 Å). The geometry around the metal ion is strongly distorted trigonal bipyramidal (τ = 0.56).34The two non-coordinated pyrazole rings are involved in intramolecular hydrogen bonds with N–H protons of the neighbouring side chains which stabilize their position in the crystal structure. The position of the three ‘pod’ is very different; the angles between the pyrazole ring planes are 53.5(2), 57.1(2) and 76.7(2). The N2, N5, N8 nitrogen atoms are pseudo chiral centres, and the crystal structure contains the SSS and RRR configurations in a racemic mixture.
This is the first published crystal structure for metal complexes of trenpyz; therefore it can be compared only to those of some related pyridine or imidazole substituted tren derivatives. The complex [Cu(Htrenpyr)]3+, in which one of the secondary nitrogen atoms is protonated, has square pyramidal geometry.9 The non-protonated (neutral) trenpyr, similarly to its imidazole derivative tris{2-[2-(1-methyl)imidazolyl]-methylaminoethyl}amine (trenmimi), forms a trinuclear complex with a 3/2 metal-to-ligand ratio.9,10 The central copper(II), coordinated by one arm of each ligand molecules, is octahedral; the peripheral copper(II) centres have distorted square pyramidal geometry. The Schiff-base derivative of trenmimi forms octahedral copper(II) species.35 Among the above complexes, the 4N donor set of the tren subunit is coordinated to the same metal ion only in [Cu(trenpyz)]2+, which enforces its trigonal bipyramidal geometry.
The closest structural analogue of crystal 1 is the copper(II) complex of the potentially heptadentate (N4O3) tris(2-hydroxybenzylaminoethyl)amine.12 In this structure (ref. code OREGAU), beside the amino nitrogens a side chain phenolic oxygen is also coordinated. The comparison of the two structures is shown in Fig. S3 (ESI†). The chirality of the three amino groups in OREGAU is the same as in 1, and similarly, intramolecular hydrogen bonds stabilize the positions of the two non-coordinated side chains. For OREGAU, the geometry is closer to the trigonal bipyramid (τ = 0.67), due to the six-membered chelate ring formed with the participation of phenolic oxygen (in 1 the pyrazole nitrogen is involved in a five-membered ring, Fig. 2).
The main secondary interactions in the crystal structure of 1 are hydrogen bonds between N–H or C–H hydrogens and the perchlorate oxygens. Despite that, one perchlorate anion was found to be able to rotate around the Cl–O axis resulting in a disordered structure. The hydrogen bond connections in 1 are depicted in Fig. S4 (ESI†), some selected data are collected in Table S2 (ESI†).
Solution chemical studies
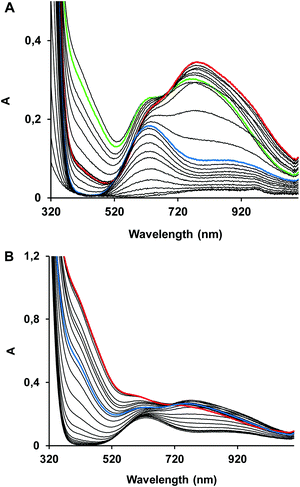
The protonation constants of trenpyz are listed in Table 2. Despite a number of protonable nitrogen atoms in trenpyz, only three (de)protonation processes were detected between pH 2 and 11, which belong to the secondary amines. Therefore, the protonation constants of trenpyz are directly comparable with those of tren and trenpyr (Table 2), indicating a notable electron-withdrawing effect of the pyrazole rings, similar to those of the pyridine rings.The complex formation in the copper(II)–trenpyz system was studied at M/L ratios of 1/2, 1/1, 3/2 and 2/1. At a twofold metal ion excess precipitate formation was detected above pH 6, but at lower M/L ratios the solution was clear within the pH-range studied. Since in equimolar Cu(II)–L solution, the concentration of uncomplexed copper(II) at the beginning of pH-metric titration (pH ∼ 1.8) was relatively low (x ∼ 0.3, Fig. 3A), pH-dependent Vis-near IR spectra were also recorded between pH 0.7 and 11.2 (Fig. 4A) in order to determine the correct formation constants. The combined evaluation of pH-potentiometric and spectrophotometric data indicated the formation of three mononuclear (CuHL, CuL, CuH−1L) and three trinuclear (Cu3H−2L2, Cu3H−3L2 and Cu3H−4L2) complexes in the copper(II)–trenpyz system. The distribution curves of these complexes are depicted in Fig. 3; their formation constants are listed in Table 2.
In equimolar solution the highly stable CuHL is the dominant species around pH 3. Its stability is considerably higher than that of the corresponding complex of tachpyz (Table 2), even considering the differences in the basicity of the ligands. This indicates the coordination of an additional donor group, i.e. the tertiary nitrogen atom in CuHL. The two absorption bands observed in the Vis-near IR spectrum of CuHL (Fig. 4A and Fig. S5, ESI†) indicate square pyramidal geometry around the metal ion with relatively strong apical coordination.8,13 This conclusion is also supported by the EPR parameters of the species CuHL (Fig. 5 and Table 3). The deprotonation of CuHL (pK = 4.13) results in the formation of CuL, a unique species between pH 6 and 8. During this deprotonation both the Vis-near IR (Fig. 4 and Fig. S5, ESI†) and the low temperature EPR spectra (Fig. 5) indicate fundamental changes in the coordination sphere of copper(II). Both the typical d–d transitions and the ‘reversed’ order of g-values (Table 3) indicate distorted trigonal bipyramidal geometry around the metal ion, similar to the crystal structure of complex 1.
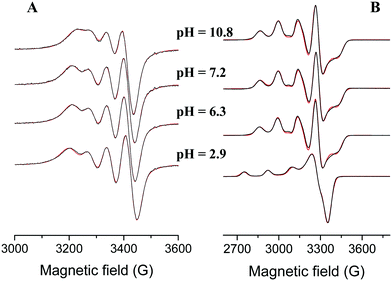 | ||
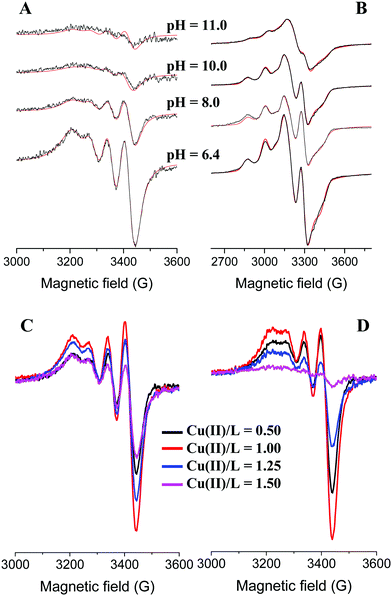
| Fig. 5 Experimental (red) and simulated (black) EPR spectra of the copper(II)–L 1/1 system at room temperature (A) and at 77 K (B). ([L] = [Cu2+] = 2.96 mM, I = 0.1 M (NaCl)). | ||
| Complex | λ d–dmax (nm) | g o | A o (G) | g x , gy, gz | A x , Ay, Az (G) |
|---|---|---|---|---|---|
| a Trinuclear complex spectra were described as the sum of mononuclear and broad singlet type spectra for which only go values could be determined. | |||||
| CuHL | 626 | 2.105(1) | 64.7(5) | 2.053(2), 2.053(2), 2.236(2) | 19(1), 19(1), 170(1) |
| 880 | |||||
| CuL | 790 | 2.114(1) | 59.4(1) | 2.195(2), 2.134(2), 2.010(1) | 134(2), 85(2), 50(1) |
| 640 | |||||
| CuH−1L | 756 | 2.111(1) | 52.8(5) | 2.194(2), 2.132(2), 2.010(1) | 134(2), 82(2), 54(1) |
| 640 | |||||
| Cu3H−2L2 | 750 | 2.114(1) | 60.8(5) | 2.196(2), 2.134(2), 2.013(2), 2.104a | 135(2), 83(2), 44(2) |
| 610 | |||||
| Cu3H−3L2 | ∼750 | 2.115(1) | 60.4(5) | 2.196(2), 2.133(2), 2.010(2), 2.097a | 134(2), 83(2), 45(2) |
| ∼620 | |||||
| Cu3H−4L2 | ∼750 (shoulder) | 2.115(1) | 56.3(5) | 2.196(2), 2.133(2), 2.010(2), 2.100a | 134(2), 83(2), 45(2) |
| ∼620 (shoulder) | |||||
Considering that trenpyz offers seven nitrogen atoms for the formation of fused chelate rings, its 5N coordination in trigonal bipyramidal geometry is surprising; especially, since this geometry has not been observed in solution for copper(II) complexes of other potentially N7 coordinating tren derivatives.9,10,35 It seems that in the present case the strong coordinating ability of the tren subunit is the governing factor, and the pyrazole rings occupy only the coordination position left free by the amino nitrogens.
In order to compare the metal ion binding abilities of tren, trenpyz and tachpyz, we calculated the conditional stability constants at pH 7.4 (Kcond(pH) = (∑[MHxL])/([M2+]free) × (∑[HxL]free)). The corresponding log![[thin space (1/6-em)]](https://www.rsc.org/images/entities/char_2009.gif) Kcond(pH = 7.4) values are 12.6,36 17.1 and 14.9,13 respectively. The more than 4 orders of magnitude higher conditional stability constant of CuL compared to Cu(tren) confirms the additional coordination of a pyrazole ring. On the other hand, tachpyz, derived from the tridentate tripodal platform tach, is a considerably weaker copper(II) binder, despite the 5/6N coordination in Cu(tachpyz).13
Kcond(pH = 7.4) values are 12.6,36 17.1 and 14.9,13 respectively. The more than 4 orders of magnitude higher conditional stability constant of CuL compared to Cu(tren) confirms the additional coordination of a pyrazole ring. On the other hand, tachpyz, derived from the tridentate tripodal platform tach, is a considerably weaker copper(II) binder, despite the 5/6N coordination in Cu(tachpyz).13
Above pH 8 the potentiometric data indicated further deprotonation and the formation of CuH−1L. Although both the Vis-near IR and EPR spectra (Fig. 4, 5 and Table 3) indicate some differences between CuL and CuH−1L, the typical features of trigonal bipyramidal geometry are retained. The pK of this deprotonation (9.56) is only slightly higher than that of Cu(tren) (pK = 9.17, Table 2), in which the proton loss of a water molecule bound in the fifth coordination position takes place.36 Considering that in CuH−1L the fifth coordination position is occupied, and that a similar process is absent for the Cu(trenpyr) complex up to pH 11,9 the observed deprotonation is most probably related to the copper-bound pyrazole ring, i.e. the formation of a pyrazolate anion. Indeed, deprotonation results in the development of a CT band around 420 nm with medium intensity (Fig. 3, 4 and Fig. S5, ESI†), which is very similar to the pyrazolate → Cu(II) transition reported earlier for some mononuclear copper(II) complex.37
The presence of a mono-coordinated pyrazolate ring creates the possibility for the formation of oligonuclear complexes, through pyrazolate bridges, which was indeed observed above pH 10 even in equimolar solutions. Obviously, at a 3/2 Cu(II)/L ratio their formation is more pronounced and three trinuclear complexes can be identified (Fig. 3B).
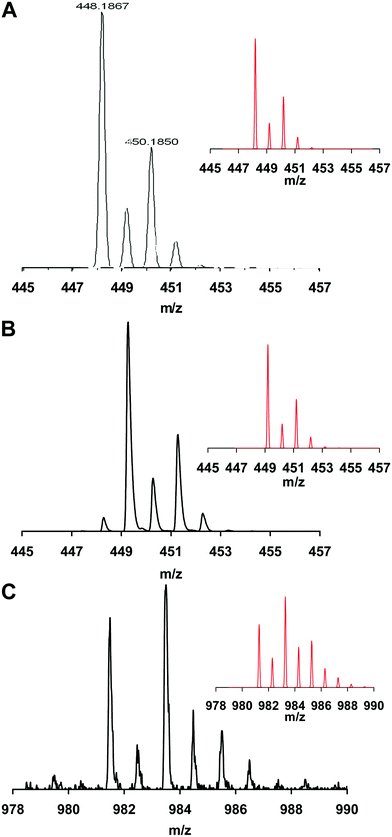
The formation of mono- and trinuclear nuclear complexes was confirmed by ESI and MALDI-TOF MS (Fig. 6). In equimolar solution the ESI MS spectrum (Fig. 6A) clearly shows the presence of [CuH−1L]+ (=[CuN10C18H29]+). Although the isotopic distribution pattern obtained for the same species by MALDI-TOF MS is very similar (Fig. 6B), the monoisotopic mass is a unit higher. This observation reflects the reduction of Cu2+ to Cu+ and the corresponding uptake of one proton during the ionization processes. Identical observations were reported in the literature related to MALDI-TOF MS studies of many copper(II) complexes, formed with cyclen/cyclam derivatives,38 some pseudo-peptides39 and peptides.40,41 Accordingly, reduced copper centers were observed for the trinuclear species too. Its MALDI-TOF MS spectrum (Fig. 6C) indicates the presence of the molecular ion {[Cu3N20C36H57]Na}+.
Around pH 6 the doubly deprotonated Cu3H−2L2 complex is dominant, and its stepwise deprotonation (pK = 7.56, 8.62) results in the formation of Cu3H−4L2, a unique species above pH 10 (Fig. 3B). Above pH 4, parallel with the formation of trinuclear complexes, the color of the solution shows gradual changes from blue to green than to brownish green, due to the development of an intense charge transfer (CT) band around 420 nm (Fig. 4B and Fig. S6, ESI†). Considering the structure of trenpyz, the formation of such intense CT bands is consistent only with the formation of pyrazolate-bridges within the trinuclear complexes Cu3H−xL2 (x = 2, 3, 4). Similar observations were made in the Cu(II)–tachpyz system too; therefore the structure of Cu3H−4L2 should be analogous to the crystallographically characterized [Cu3H−4(tachpyz)2](ClO4)2·5H2O.13
The trinuclear complexes have high thermodynamic stability, e.g. log![[thin space (1/6-em)]](https://www.rsc.org/images/entities/char_2009.gif) K (2CuH−1L + Cu2+ = Cu3H−2L2) = 15.78. Since the formation of Cu3H−2L2 is induced by the deprotonation of CuL = CuH−1L + H+, the latter equilibrium can be regarded as an allosteric process, i.e. the formation of the trinuclear complex(es) is under the allosteric control of the two copper(II) ions bound in CuL/CuH−1L.
K (2CuH−1L + Cu2+ = Cu3H−2L2) = 15.78. Since the formation of Cu3H−2L2 is induced by the deprotonation of CuL = CuH−1L + H+, the latter equilibrium can be regarded as an allosteric process, i.e. the formation of the trinuclear complex(es) is under the allosteric control of the two copper(II) ions bound in CuL/CuH−1L.
Surprisingly, the species Cu3H−2L2 formed around pH 6 has well resolved EPR spectra both at 298 K and 77 K; however the EPR signal intensity gradually decreases with increasing pH, which is more pronounced at room temperature (Fig. 7A and B). On the other hand, the EPR intensity passes through a maximum with increasing Cu(II)/L ratios (at a constant concentration of L), and the maximum is observed at a 1/1 Cu(II)/L ratio (Fig. 7C and D). At pH 6.4 the intensities observed at 0.5 and 1.5 Cu(II)/L ratios are nearly identical (Fig. 7C), i.e. at a 3/2 Cu(II)/L ratio only 1/3 of the expected intensity can be observed. The EPR spectra of trinuclear complexes at 77 K can be well described as superposition of a broad singlet and the signal of mononuclear complexes (Table 3 and Fig. 7B). At room temperature the singlet is even more broadened and only the mononuclear spectra appear.
The EPR parameters obtained from the simulation are collected in Table 3.
All these facts are in agreement with an antiferromagnetically coupled tricopper(II) core with the total spin of S = ½. Since the pyrazolato-bridged tricopper core in this case should have linear arrangement, the above facts imply that the central copper(II) is strongly coupled with one of the two peripheral copper(II) ions. The detectable EPR spectrum is not uncommon for tricopper(II) complexes,42 although the sharp and relatively well-resolved spectra are rare, and indicate that the two peripheral copper(II) ions are magnetically equivalent. At pH 10 (Fig. 7D), the increasing Cu(II)/L ratios result in considerably broadened EPR lines (loss of intensity). In principle, such broadening might be due to intramolecular exchange phenomena, which is faster in the complexes with 3/4 pyrazolato bridges between the copper(II) centres. It is worth pointing out that the low temperature EPR spectra of the trinuclear complexes (Fig. 7B) clearly indicate that the peripheral copper(II) centres of the trinuclear complexes have trigonal bipyramidal geometry.
Although in the Cu(II)–L and Cu(II)–tachpyz13 3/2 systems similar trinuclear complexes are formed, the variation of the trigonal platforms results in fundamental differences in their relative stabilities. In this respect, the equilibrium constants (log![[thin space (1/6-em)]](https://www.rsc.org/images/entities/char_2009.gif) K, see Table 2) of the reactions 2CuL + Cu2+ = Cu3H−xL2 + xH+ (x = 2, 3, 4) for trenpyz and tachpyz are worth comparing: Δlog
K, see Table 2) of the reactions 2CuL + Cu2+ = Cu3H−xL2 + xH+ (x = 2, 3, 4) for trenpyz and tachpyz are worth comparing: Δlog![[thin space (1/6-em)]](https://www.rsc.org/images/entities/char_2009.gif) K = log
K = log![[thin space (1/6-em)]](https://www.rsc.org/images/entities/char_2009.gif) Ktrenpyz − log
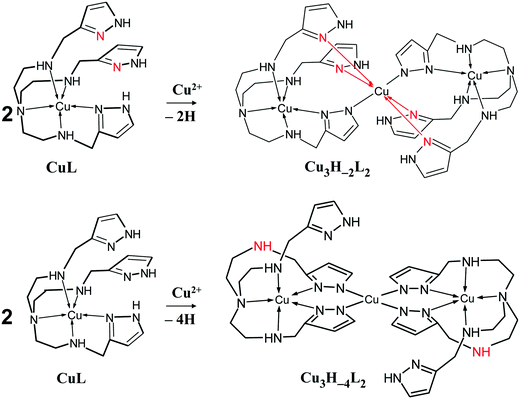
Ktrenpyz − log![[thin space (1/6-em)]](https://www.rsc.org/images/entities/char_2009.gif) Ktachpyz = +0.76 (x = 2), −1.69 (x = 3) and −4.55 (x = 4). Consequently, although the appearance of Cu3H−2L2 is more preferred for trenpyz than for tachpyz, the formation of the subsequent complexes is considerably less favoured. The reason for this deviation is the different denticities of the two ligands. Due to the higher number of available donor atoms in trenpyz four ‘free’ pyrazole rings are available in Cu3H−2L2, which in turn are able to significantly stabilize the two-fold deprotonated trinuclear complex by coordination to the central metal ion (Scheme 2), in contrast to the Cu3H−2(tachpyz)2 species. In addition, during the formation of the trenpyz complexes containing 3/4 pyrazolato bridges, one/two secondary amines should be displaced from the coordination spheres of the peripheral copper(II) centers (Scheme 2). Since similar donor atom displacement does not occur in the case of tachpyz, the formation of its trinuclear complexes is more favored. As a consequence, the speciation of trinuclear complexes is significantly different in the two systems. Cu3H−2L2 is a dominant species between pH 5 and 7, while the formation of three- and four-fold deprotonated complexes of trenpyz is shifted by more than two pH units to the higher pH, as compared to the corresponding tachpyz species (Fig. 8).
Ktachpyz = +0.76 (x = 2), −1.69 (x = 3) and −4.55 (x = 4). Consequently, although the appearance of Cu3H−2L2 is more preferred for trenpyz than for tachpyz, the formation of the subsequent complexes is considerably less favoured. The reason for this deviation is the different denticities of the two ligands. Due to the higher number of available donor atoms in trenpyz four ‘free’ pyrazole rings are available in Cu3H−2L2, which in turn are able to significantly stabilize the two-fold deprotonated trinuclear complex by coordination to the central metal ion (Scheme 2), in contrast to the Cu3H−2(tachpyz)2 species. In addition, during the formation of the trenpyz complexes containing 3/4 pyrazolato bridges, one/two secondary amines should be displaced from the coordination spheres of the peripheral copper(II) centers (Scheme 2). Since similar donor atom displacement does not occur in the case of tachpyz, the formation of its trinuclear complexes is more favored. As a consequence, the speciation of trinuclear complexes is significantly different in the two systems. Cu3H−2L2 is a dominant species between pH 5 and 7, while the formation of three- and four-fold deprotonated complexes of trenpyz is shifted by more than two pH units to the higher pH, as compared to the corresponding tachpyz species (Fig. 8).
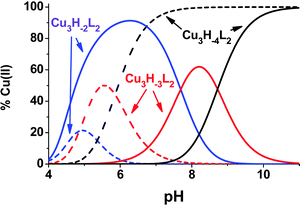 | ||
| Fig. 8 Speciation of the trinuclear complexes in the Cu(II)–tachpyz (dashed lines) and in the Cu(II)–trenpyz (solid lines) 3/2 systems (T = 298 K, I = 0.1 M NaCl, [Cu2+]tot = 2.0 mM). | ||
Kinetic studies
Our intention was to compare both the coordination chemical properties and the catechol oxidase activity of Cu(II)–tachpyz and Cu(II)–trenpyz complexes, in order to explore the role of tripodal platforms in the stability, structure and enzyme mimicry of these species. To this end we studied the ability of Cu(II)–trenpyz complexes to promote the oxidation of di-tert-butyl-catechol, a widely used substrate to study catechol oxidase activity, and compared to that we obtained earlier for the Cu(II)–tachpyz system.13In order to understand the activation of dioxygen by metalloenzymes a large number of biomimetic models of catechol oxidase have been studied.14,43 Catechol oxidases are type 3 copper enzymes;44,45 therefore mainly dinuclear complexes were used,46–51 but several mono-52,53 and trinuclear13,41,54 species were also reported to have important catechol oxidase activity.
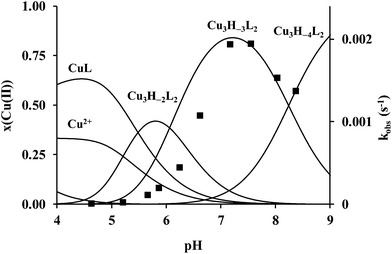
The formation of the product 3,5-di-tert-butyl-o-benzoquinone (dtbq) was followed spectrophotometrically at 400 nm in a 50% EtOH/H2O solvent, in order to enhance the solubility of dtbq. To obtain a detailed picture of the catalytic reaction, the speciation of copper(II) complexes should be known in a 50% (m/m) ethanol–water mixture. To this end, we studied the pH dependence of UV-Vis spectra of the Cu(II)/trenpyz 3/2 system (Fig. S7 and S8, ESI†), since only trinuclear complexes show measurable catechol oxidase activity. The evaluation of characteristic spectral changes, which is similar to those observed in pure water (Fig. 4), resulted in the equilibrium speciation depicted in Fig. 9 (we note, that beside the solvents, the concentrations are also very different in Fig. 3B and 9, and the latter in itself results in significantly different speciations of the trinuclear complexes). The formation of trinuclear complexes is shifted by ∼1 unit to a lower pH-range, as a consequence of the more favoured charge compensation in a 50% ethanol–water mixture.
The pH-rate constant profile of H2dtbc oxidation promoted by the trinuclear copper(II) complexes is a distorted bell-shaped curve with a pH optimum around pH 7.3 (Fig. 9). This pH-rate constant profile is not directly comparable with the speciation of the binary complexes, since the oxidation of H2dtbc promoted by the copper(II) complexes requires the formation of a complex-dtbc ternary adduct, which is a pH-dependent process. Therefore, the strong metal ion binder H2dtbc obviously alters the complex speciation obtained in the binary system. Consequently, Fig. 9 shows that the observed catalytic activity is mainly related to the triply deprotonated Cu3H−3L2, similarly to the related Cu(II)–tachpyz system.13
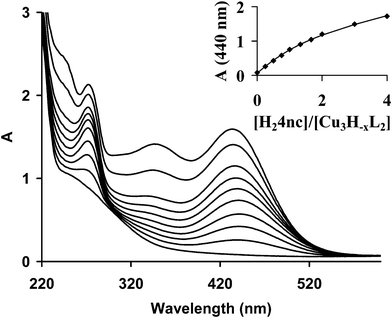
In order to obtain some additional information on the binding of the substrate H2dtbc to the trinuclear complexes, we studied their interaction with 4-nitrocatechol (H24nc), as a stable chromophoric probe for catechol derivatives.55 The increasing amount of H24nc added to the Cu(II)–trenpyz 3/2 system (Fig. 10) results in the development of an absorption peak at 440 nm. Although the pK1 of 4-nitrocatechol under these conditions is 6.8 ± 0.1,41i.e. unbound H4nc− is also present (λmax at 432 nm41), the weak breakpoint at a 1/1 [H24nc]/[Cu3H−xL2]tot ratio (inset in Fig. 10) can be clearly seen. This allowed the calculation of the apparent association constant for the [(Cu3H−xL2)(4nc)] adduct (x = 2 and 3) log![[thin space (1/6-em)]](https://www.rsc.org/images/entities/char_2009.gif) Kapp = 4.4 ± 0.1 (solid line in the inset of Fig. 10), which confirms the high coordinating ability of catechol derivatives to the tricopper(II) core.
Kapp = 4.4 ± 0.1 (solid line in the inset of Fig. 10), which confirms the high coordinating ability of catechol derivatives to the tricopper(II) core.
The interaction of trinuclear complexes with H2dtbc was studied under anaerobic conditions too. The increasing concentration of H2dtbc results in partial, but immediate formation of dtbq (the absorption band at 400 nm, Fig. S9, ESI†), which approaches the [dtbq]/[Cu3H−xL2] = 1/1 ratio above 20-fold excess of H2dtbc over the trinuclear complexes. This observation is consistent with two-electron oxidation of the catechol substrate by the trinuclear species, which is the main proposed mechanism for oligonuclear catechol oxidase mimicking copper(II) complexes.43 However, this anaerobic reaction is not stoichiometric, in accordance with many previous studies where the formation of dtbq was complete only at considerable excess of H2dtbc.56,57
The direct electron transfer from the substrate to the trinuclear complex underlines the importance of the electrochemistry of the trinuclear complexes, which was studied by cyclic voltammetry in a 50% (m/m) ethanol–water solvent mixture at pH 7.3 and at a Cu(II)–trenpyz 3/2 ratio (Fig. S10, ESI†). Only irreversible redox couples were observed. The relatively well-developed reduction peak at Epc = 0.4 V (vs. NHE) indicates notable stabilization of copper(I), and can be tentatively assigned to the CuIICuIICuII → CuIICuICuII process, which is followed by two subsequent irreversible reduction steps in the Epc = 0.0 − (−0.4) V range (Fig. S9, ESI†).
At the optimal pH, the initial rate of oxidation shows saturation kinetics above 100-fold excess of the substrate over the trinuclear complexes, according to the Michealis–Menten model. This also indicates the formation of the catalytically active Cu(II)–trenpyz–dtbc ternary complex in a fast pre-equilibrium, followed by the rate determining intramolecular redox processes. The non-linear regression of the kinetic data in Fig. 11 resulted in kcat = (0.156 ± 0.005) s−1 and KM = (0.94 ± 0.10) mM (see solid line). These values are very similar to those obtained in the Cu(II)–tachpyz system,13 although at different pH values.
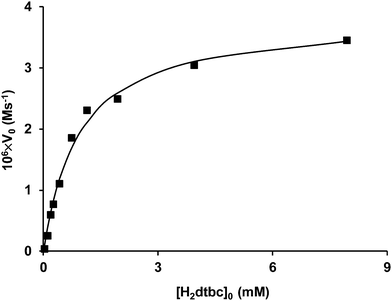 | ||
| Fig. 11 The initial rate of H2dtbc oxidation catalyzed by the Cu(II)–trenpyz 3/2 system as a function of substrate concentration (T = 298 K; pH = 7.2; [Cu2+] = 75 μM, [L] = 50 μM). | ||
The comparison with other catechol oxidase models is complicated by different conditions used (solvent, pH and temperature). Nevertheless, above data confirm the relatively strong substrate binding, as expected for oligonuclear complexes. Although the catalytic rate constant (kcat) is higher than most values reported earlier for dinuclear species,49,54,57,58 10–60-fold more active complexes are also known in the literature.46,48,51
The reaction rates were also measured as a function of the concentration of trinuclear complexes and dioxygen, under pseudo-first order conditions (Fig. S11 and S12, ESI†). In both cases first order dependence was observed. From the Michaelis–Menten model it follows that the observed pseudo-second order rate constant (k′, the slope of the straight line in Fig. S10, ESI†) is equal to kcat/(KM + [S]). The value calculated from the Michaelis–Menten parameters (kcalc′ = 53.0 M−1 s−1) is in good agreement with the measured one (k′ = 72.3 M−1 s−1, Fig. S11, ESI†), which confirms the accuracy of our kinetic data.
In the interest of having more details on the mechanism of H2dtbc oxidation, we measured the concentration of H2O2 formed during the oxidation promoted by the trinuclear complexes in parallel with that of dtbq (Fig. S13, ESI†). H2O2 was produced in nearly stoichiometric quantities compared to dtbq, implying that it does not participate in the catalytic reaction.
According to the two-electron oxidation of the substrate, suggested by our anaerobic measurements (see above), the formation of radicals (e.g. semiquinone) was not observed on the EPR spectra obtained during the catalytic process under aerobic conditions (Fig. S14, ESI†). Instead, the intensity of the EPR spectra decreased after addition of the substrate, and the low temperature spectra showed also some shifts by time (Fig. S14B, ESI†). These observations are in agreement with the partial formation of the complex-substrate adduct and/or the mixed-valence tricopper species. In this respect it is worth noting that due to the concentration of the trinuclear species required for EPR measurements, our system was far from the saturating conditions observed in Fig. 11.
The above kinetic data can be interpreted by a simplified variant of the mechanism originally proposed by Casella et al.50 (Scheme 3): the complex Cu3H−3L2 forms a stable ternary complex with H2dtbc in a fast pre-equilibrium, and an intramolecular two-electron transfer process results in the formation of dtbq and two copper(I) centres. Upon product dissociation, the copper(I) centres are re-oxidized by dioxygen producing the tricopper(II) complex and H2O2.
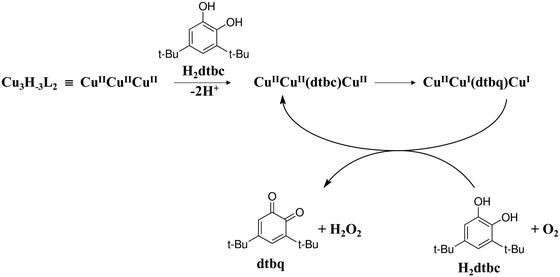 | ||
| Scheme 3 Proposed mechanism for catalytic oxidation of 3,5-di-tert-butylcatechol by the trenpyz–copper(II) 3/2 system. | ||
Since the peripheral copper(II) ions in the trinuclear complexes have a similar trigonal bipyramidal geometry to the inactive mononuclear species, the pyrazolate-bound central copper(II) ion should have the governing role in the binding and oxidation of H2dtbc.
The catalytic properties of the trinuclear Cu(II)–trenpyz and Cu(II)–tachpyz13 complexes are worth comparing. The two systems possess a number of similar properties: (i) the triply deprotonated trinuclear complexes are the active species, (ii) their catalytic efficiencies are nearly identical, and (iii) the central copper(II) ions have a major role in the oxidation of the substrate, (iv) which proceeds by intramolecular two-electron transfer. Only the pH-rate constant profiles show notable differences, the pH-optimum of the present system is shifted by ∼two units to the higher pH (Fig. 12). This is due to the different speciations of the trinuclear complexes in the two systems (Fig. 8), which in turn resultsin the different tripodal platforms used. All these facts imply that the dtbc oxidation promoted by these systems can be easily controlled by the denticity of the tripodal ligands, since it affects the coordination environment of the central metal ion, which is proposed to be the main actor during the reaction.
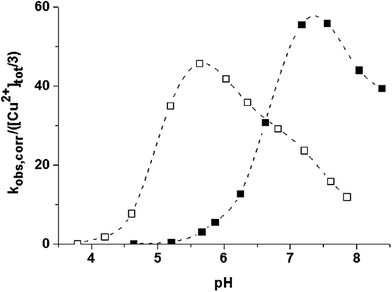 | ||
| Fig. 12 pH-pseudo-second order rate constant profile of dtbc oxidation in 50 w% ethanol–water promoted by the copper(II)–tachpyz13 (open square) and –trenpyz (filled square) 3/2 systems at T = 298 K. | ||
Conclusion
We prepared the pyrazole-containing oligonucleating tripodal ligand trenpyz (L) and studied the equilibrium, structural and chatecolase properties of its copper(II) complexes. In equimolar solution the highly stable square pyramidal CuHL and trigonal bipyramidal CuL are the dominant species around pH 3 and 5–8, respectively. Above pH 8 further deprotonation was observed (pK = 9.56), which is related to the formation of a copper(II)-bound pyrazolate anion. This creates the possibility for the formation of oligonuclear complexes, through pyrazolate bridges, and at a 3/2 Cu(II)/L ratio three trinuclear complexes were identified. The species Cu3H−2L2 is significantly stabilized, Cu3H−3L2 and Cu3H−4L2 are destabilized as compared to the analogous Cu3H−x(tachpyz)2 complexes due to the different denticities of the two ligands, which results in considerably different speciations of the trinuclear complexes. At the optimal pH the catechol oxidase activities of the triply deprotonated trinuclear complexes of trenpyz and tachpyz are similar, but their pH-rate constant profiles are significantly different, as a consequence of the above mentioned deviations in the complex speciation. Our work pointed out that by derivatization of some simple tripodal platforms (tren, tach) it is possible to fine-tune the coordination chemical properties such as structure and stability, and even some important enzyme like features, such as the pH-activity profile.Conflicts of interest
There are no conflicts to declare.Acknowledgements
The research was supported by National Research, Development and Innovation Office (NKFIH) through projects GINOP-2.3.2-15-2016-00038, OTKA 101541 and OTKA 115762. The authors warmly thank F. Lachaud for MS measurements at Université de Lorraine.References
- A. G. Blackman, Polyhedron, 2005, 24, 1 CrossRef CAS.
- G. Parkin, Chem. Rev., 2004, 104, 699–767 CrossRef CAS PubMed.
- B. Kuswandi, Nuriman, W. Verboom and D. N. Reinhoudt, Sensors, 2006, 6, 978–1017 CrossRef CAS.
- A. Deroche, I. Morgenstern-Badarau, M. Cesario, J. Guilhem, B. Keita, L. Nadjo and C. Houée-Levin, J. Am. Chem. Soc., 1996, 118, 4567–4573 CrossRef CAS.
- T. J. Wadas, E. H. Wong, G. R. Weisman and C. J. Anderson, Chem. Rev., 2010, 110, 2858–2902 CrossRef CAS PubMed.
- J. Turner, C. Koumenis, T. E. Kute, R. P. Planalp, M. W. Brechbiel, D. Beardsley, B. Cody, K. D. Brown, F. M. Torti and S. V. Torti, Blood, 2005, 106, 3191–3199 CrossRef CAS PubMed.
- A. Mohamadou and C. Gérard, J. Chem. Soc., Dalton Trans., 2001, 3320–3328 RSC.
- G. Park, E. Dadachova, A. Przyborowska, S.-J. Lai, D. Ma, G. Broker, R. Rogers, R. Planalp and M. Brechbiel, Polyhedron, 2001, 20, 3155–3163 CrossRef CAS.
- C. Gérard, A. Mohamadou, J. Marrot, S. Brandes and A. Tabard, Helv. Chim. Acta, 2005, 88, 2397–2412 CrossRef.
- S.-F. Tong, H. Yang, Y.-N. Lao, G.-H. Liu, H.-X. Wu, S.-P. Yang, J. Yu, H. Tan and W. Li, Z. Anorg. Allg. Chem., 2009, 635, 2340–2346 CrossRef CAS.
- S. R. Bayly, Z. Xu, B. O. Patrick, S. J. Rettig, M. Pink, R. C. Thompson and C. Orvig, Inorg. Chem., 2003, 42, 1576–1583 CrossRef CAS PubMed.
- A. Mustapha, C. Busche, J. Reglinski and A. R. Kennedy, Polyhedron, 2011, 30, 1530–1537 CrossRef CAS.
- A. Szorcsik, F. Matyuska, A. Bényei, N. V. Nagy, R. K. Szilágyi and T. Gajda, Dalton Trans., 2016, 45, 14998–15012 RSC.
- J. Klingele, S. Dechert and F. Meyer, Coord. Chem. Rev., 2009, 253, 2698 CrossRef CAS.
- K. E. Dalle and F. Meyer, Eur. J. Inorg. Chem., 2015, 3391 CrossRef CAS.
- A. Prokofieva, A. I. Prikhod’ko, E. A. Enyedy, E. Farkas, W. Maringgele, S. Demeshko, S. Dechert and F. Meyer, Inorg. Chem., 2007, 46, 4298 CrossRef CAS PubMed.
- J. Ackermann, F. Meyer, E. Kaifer and H. Pritzkow, Chem. – Eur. J., 2002, 8, 247 CrossRef CAS.
- J. Ackermann, S. Buchler and F. Meyer, C. R. Chim., 2007, 10, 421 CrossRef CAS.
- T. Higashi, NUMABS, Rigaku/MSC Inc., 1998, rev. 2002 Search PubMed.
- CrystalClear SM 1.4.0, Rigaku/MSC Inc., 2008.
- M. C. Burla, R. Caliandro, B. Carrozzini, G. L. Cascarano, C. Cuocci, C. Giacovazzo, M. Mallamo, A. Mazzone and G. Polidori, J. Appl. Crystallogr., 2015, 48, 306–309 CrossRef CAS.
- SHELXL-2013 Program for Crystal Structure Solution, University of Göttingen, Germany, 2013 Search PubMed.
- L. J. Farrugia, J. Appl. Crystallogr., 2012, 45, 849–854 CrossRef CAS.
- A. L. Spek, J. Appl. Crystallogr., 2003, 36, 7–13 CrossRef CAS.
- C. F. Macrae, P. R. Edgington, P. McCabe, E. Pidcock, G. P. Shields, R. Taylor, M. Towler and J. van De Streek, J. Appl. Crystallogr., 2006, 39, 453–457 CrossRef CAS.
- S. P. Westrip, J. Appl. Crystallogr., 2010, 43, 920–925 CrossRef CAS.
- F. J. C. Rosotti and H. Rosotti, The determination of stability constants, McGraw-Hill Book Co., New York, 1962, p. 149 Search PubMed.
- E. Högfeldt, Stability Constants of Metal-Ion Complexes, Part A. Inorganic Ligands, Pergamon, New York, 1982, p. 32 Search PubMed.
- L. Z. I. N. G. Peintler, Technical Software Distributors, Baltimore, MD, 1991 Search PubMed.
- R. G. Bates, M. Paabo and R. A. Robinson, J. Phys. Chem., 1963, 67, 1833–1838 CrossRef CAS.
- L. G. Hepler, E. M. Woolley and D. G. Hurkot, J. Phys. Chem., 1970, 74, 3908–3913 CrossRef CAS.
- A. J. Bard and L. R. Faulkner, Electrochemical Methods–Fundamentals and Applications, John Wiley & Sons, New York, 2000 Search PubMed.
- A. Rockenbauer and L. Korecz, Appl. Magn. Reson., 1996, 10, 29–43 CrossRef CAS.
- A. W. Addison, T. Nageswara Rao, J. Reedijk, J. van Rijn and G. C. Verschoor, J. Chem. Soc., Dalton Trans., 1984, 1349–1356 RSC.
- G. Brewer, C. T. Brewer, R. J. Butcher and E. E. Carpenter, Inorg. Chim. Acta, 2006, 359, 1263 CrossRef CAS.
- R. J. Motekaitis, A. E. Martell, J. M. Lehn and E. I. Watanabe, Inorg. Chem., 1982, 21, 4253–4257 CrossRef CAS.
- L. Chruscinski, P. Mlynarz, K. Malinowska, J. Ochocki, B. Boduszek and H. Kozlowski, Inorg. Chim. Acta, 2000, 303, 47–53 CrossRef CAS.
- P. Lubal, M. Kývala, P. Hermann, J. Holubová, J. Rohovec, J. Havel and I. Lukes, Polyhedron, 2001, 20, 47–55 CrossRef CAS.
- G. Greiner, L. Seyfarth, W. Poppitz, R. Witter, U. Sternberg and S. Reissmann, Lett. Pept. Sci., 2000, 7, 133–141 CAS.
- K. Ősz, K. Várnagy, H. Süli-Vargha, D. Sanna, G. Micera and I. Sóvágó, J. Chem. Soc., Dalton Trans., 2003, 2009–2016 RSC.
- A. Dancs, N. V. May, K. Selmeczi, Z. Darula, A. Szorcsik, F. Matyuska, T. Páli and T. Gajda, New J. Chem., 2017, 41, 808–823 RSC.
- J. Sanmartín, M. R. Bermejo, A. M. García-Deibe, O. R. Nascimento, L. Lezama and T. Rojo, J. Chem. Soc., Dalton Trans., 2002, 1030–1035 RSC; I. P.-C. Liu, P. P.-Y. Chen and S. I. Chan, C. R. Chim., 2012, 15, 214–224 CrossRef CAS.
- I. A. Koval, P. Gamez, C. Belle, K. Selmeczi and J. Reedijk, Chem. Soc. Rev., 2006, 35, 814 RSC.
- T. Klabunde, C. Eicken, J. C. Sachettini and B. Krebs, Nat. Struct. Biol., 1998, 5, 1084–1090 CrossRef CAS PubMed.
- N. Hakulinen, C. Gasparetti, H. Kaljunen, K. Kruus and J. Rouvinen, JBIC, J. Biol. Inorg. Chem., 2013, 18, 917 CrossRef CAS PubMed.
- K. S. Banu, T. Chattopadhyay, A. Banerjee, S. Bhattacharya, E. Suresh, M. Nethaji, E. Zangrando and D. Das, Inorg. Chem., 2008, 47, 7083–7093 CrossRef CAS PubMed.
- I. A. Koval, K. Selmeczi, C. Belle, C. Philouze, E. Saint-Aman, I. Gautier-Luneau, A. M. Schuitema, M. van Vliet, P. Gamez, O. Roubeau, M. Lueken, B. Krebs, M. Lutz, A. L. Spek, J.-L. Pierre and J. Reedijk, Chem. – Eur. J., 2006, 12, 6138–6150 CrossRef CAS PubMed.
- J. Ackermann, S. Buchler and F. Meyer, C. R. Chim., 2007, 10, 421–432 CrossRef CAS.
- A. Neves, L. M. Rossi, A. J. Bortoluzzi, B. Szpoganicz, C. Wiezbicki, E. Schwingel, W. Haase and S. Ostrovsky, Inorg. Chem., 2002, 41, 1788–1794 CrossRef CAS PubMed.
- E. Monzani, L. Quinti, A. Perotti, L. Casella, M. Gullotti, L. Randaccio, S. Geremia, G. Nardin, P. Faleschini and G. Tabbi, Inorg. Chem., 1998, 37, 553–562 CrossRef CAS PubMed.
- E. C. M. Ording-Wenker, M. A. Siegler, M. Lutz and E. Bouwman, Dalton Trans., 2015, 44, 12196–12209 RSC.
- A. Jancsó, Z. Paksi, N. Jakab, B. Gyurcsik, A. Rockenbauer and T. Gajda, Dalton Trans., 2005, 3187–3194 RSC.
- J. Kaizer, T. Csay, G. Speier and M. Giorgi, J. Mol. Catal. A: Chem., 2010, 329, 71–76 CrossRef CAS.
- L. K. Das, A. Biswas, J. S. Kinyon, N. S. Dalal, H. Zhou and A. Ghosh, Inorg. Chem., 2013, 52, 11744 CrossRef CAS PubMed.
- C. A. Tyson, J. Biol. Chem., 1975, 250, 1765 CAS.
- A. Granata, E. Monzani and L. Casella, JBIC, J. Biol. Inorg. Chem., 2004, 9, 903–913 CrossRef CAS PubMed.
- E. Monzani, L. Casella, G. Zoppellaro, M. Gullotti, R. Pagliarin, R. P. Bonomo, G. Tabbi, G. Nardin and L. Randaccio, Inorg. Chim. Acta, 1998, 282, 180–192 CrossRef CAS.
- S. J. Smith, C. J. Noble, R. C. Palmer, G. R. Hanson, G. Schenk, L. R. Gahan and M. J. Riley, J. Biol. Inorg. Chem., 2008, 13, 499–510 CrossRef CAS PubMed.
Footnote |
| † Electronic supplementary information (ESI) available. CCDC 1553801 and 1553857. For ESI and crystallographic data in CIF or other electronic format see DOI: 10.1039/c7nj02013a |
| This journal is © The Royal Society of Chemistry and the Centre National de la Recherche Scientifique 2017 |

