 Open Access Article
Water-soluble lanthanide complexes with a helical ligand modified for strong luminescence in a wide pH region†
Shuhei
Ogata
a,
Tomohito
Shimizu
a,
Takashi
Ishibashi
a,
Yushi
Ishiyone
a,
Mitsuhiro
Hanami
a,
Minami
Ito
a,
Ayumi
Ishii
a,
Shogo
Kawaguchi
b,
Kunihisa
Sugimoto
b and
Miki
Hasegawa
 *a
*a
aCollege of Science and Engineering, Aoyama Gakuin University, 5-10-1 Fuchinobe, Chuo-ku, Sagamihara, Kanagawa 252-5258, Japan. E-mail: hasemiki@chem.aoyama.ac.jp; Fax: +81-42-759-6221
bResearch & Utilization Division, Japan Synchrotron Radiation Research Institute (JASRI/SPring-8), 1-1-1 Kouto, Sayo, Hyogo 679-5198, Japan
First published on 2nd June 2017
Abstract
The luminescence and structure of a water-soluble helicate Eu complex with LCOOH, which is a hexadentate ligand with COOH groups, were examined in solutions of various pH. The Eu complex EuLCOOH is more than eight-coordinated around Eu, and one of the two carboxylate groups is not bound, even in the powdered state, based on the FT-IR measurement. The synchrotron X-ray powder diffraction peaks of EuLCOOH broadened because of amorphous-like aggregation. EuLCOOH retains the ff emission of Eu in a wide pH range of 2.6–9.7 and shows spectral reversibility at pH = 1.9–11.9. From Horrocks' equation, the number of coordinated water molecules to Eu of EuLCOOH in the initial condition (3.0 × 10⁻⁵ mol cm−3; pH 2.6–9.7) was estimated to be 1, but it increased in both strongly alkaline and acidic solutions. Molecular structural changes in these solutions were assumed from the quantum yields and electrospray ionization-mass spectrometry measurements. For instance, one carboxyl group of EuLCOOH could provide hydrophilicity in the initial condition, and the other would be released from Eu at pH 2.1–2.6. Furthermore, EuLCOOH decomposes below pH 1.9, but recovers with adjustments toward the initial pH. The ff emission of TbLCOOH with a coordinated water molecule also appears in the green wavelength region in the initial condition. The luminescence ability of TbLCOOH in water is higher than that in its powder. The luminescence processes of these complexes are discussed as an energy relaxation through the excited triplet state of LCOOH assigned from the phosphorescence band of GdLCOOH.
1. Introduction
Water-soluble lanthanide complexes with strong luminescence are fascinating and can be applied to biological responses,1–13 such as bio-probing, bio-imaging,14–34 and in situ sensing of chemical species for pH, p1O2,35–42 and metal ions.43–45 The electronic absorption coefficient is quite low because the ff transitions of the lanthanide ion are Laporte forbidden, and it is difficult to obtain a strong ff emission by direct excitation. Thus, aromatic ligand moieties act to sensitize lanthanide luminescence as an antenna effect.46–48 Luminescence of lanthanide complexes takes advantage of the narrow emission band width (<10 nm full width at half maximum), long excited state lifetimes, and large Stokes shifts (>150 nm), which easily distinguish these complexes from excitation light and the shorter-lived background in biological systems.1,5 Developing sufficiently bright and stable lanthanide complexes in aqueous solutions is a challenging research topic.49–61The first visualization of living cells by lanthanide complexes was reported by Scaff et al. in 1969.14 They used a luminescent Eu complex with 4,4,4,-trifluoro-1-(2-thienyl)-1,3-butanedione to lyse a microorganism (Bacillus megaterium) and successfully observed luminescence of the whole cell using luminescence microscopy. Soini et al. developed an Eu luminescence label with the ligand of an ethylenediaminetetraacetic acid (EDTA) derivative localized on rabbit immunoglobulin G for time-resolved fluorescence microscopic observations.15 There are many recent papers related to luminescent lanthanide complexes for the microscopic observation of biological science. Water-soluble Eu and Tb complexes with triethylenetetramine hexaacetic acid, a derivative of EDTA, migrated into the cytoplasm of adherent HeLa cells for imaging using a time-gated methodology.29 These complexes, which are bridged by cyclohexyldiamine, show intracellular stability, diffuse freely throughout the cytoplasm and nucleus, and do not partition to particular organelles.
1,4,7,10,-Tetraazacyclododecane, a so-called cyclen, is known as one of the most stable ligand coordinating lanthanide ions, and there are hundreds of reports related to their luminescence properties, even in aqueous solutions.13,40 Parker et al. reported various kinds of cyclen derivatives with lanthanide ions for bio-molecular sensing.11,30,34 A cationic cyclen-based Eu complex exhibiting two-photon absorption (2PA) was recently reported for bio-imaging of living cells using near-infrared excitation.26 Based on spectral analysis and the optimized molecular structure, the complex likely provides hydrophilicity in a cell; this was revealed by the observation of 2PA microscopy imaging on living T24 human cancer cells.
The proton concentration also becomes a key to determining the atmosphere in and around the bio-molecules.4 Eu complexes with carboxyl-functionalized 1,5-naphthylyridine derivatives demonstrate a pH-sensitive luminescence intensity from the isomerization of the ligand between keto–amine and enol–imine.37 The Eu complex with the enol–imine ligand in a high pH solution luminesces stronger than that at a lower pH. The isomerization effect causes absorption band shifts of the ligand and suppresses the deactivation process from the solvent interaction.
2,2′,6′2′′-Terpyridine (terpyridine) is one of the most promising alternatives for absorbing and transferring the excitation energy to the lanthanide ion.61–65 The derivatives of lanthanide complexes with a terpyridine skeleton have also been examined from the view point of analytical chemistry.66–71 Eu and Tb complexes with terpyridine polyacidic derivatives were reported as luminescence sensors for time-resolved luminescence detection of the pH value in HeLa cells.67 The luminescence of this Eu complex depends on the pH values, and the mixing solution of Eu and Tb complexes detects the pH based on the intensity ratio of the Eu and Tb emissions.
Various self-assembled lanthanide helicates were summarized by Piguet and Bünzli for their fundamental applications, such as syntheses, crystallography, luminescence properties with circularly polarized phenomena, and biological probes.72 Recently, we reported mono-nuclear helicate complexes with a series of lanthanide ions, LnL (Ln = Nd, Eu, Gd, Tb, Dy, and Ho).73,74 The hexadentate ligand, L, consisted of two bipyridine moieties and ethylenediamine. From the single crystal X-ray structural analyses, all LnL molecules were isostructural. The strong luminescence of EuL appeared at 580, 595, 615, 650, and 685 nm by ultraviolet (UV) excitation in the solid state. The luminescence and structural behaviour of EuL were maintained, even in acetonitrile, because of the high solubility and chelating effect. The aim of the present investigation was the development of a water-soluble Eu complex for molecular/ion sensing using the advantage of luminescent EuL.
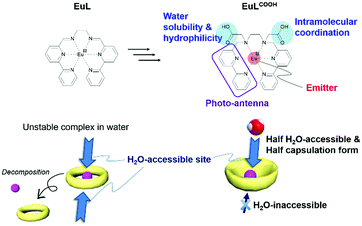
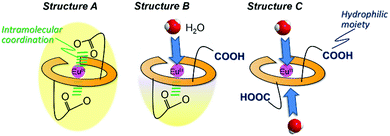
Our molecular design strategy is shown in Fig. 1. EuL decomposes in aqueous solutions but can be used to derive substitution on nitrogen atoms of the reduced azomethine moieties.75 Here, two carboxyl groups were selected as hydrophilic skeletons and introduced into EuL, and the derivative is abbreviated as EuLCOOH. Simultaneously, one of the carboxyl groups provides intramolecular coordination to Eu and the other provides solubility in water. The ligand forms a bowl shape, and the accessible area on Eu is an acting site for intermolecular interactions. Here, the luminescence properties of EuLCOOH and TbLCOOH are examined from the measurements of electronic absorption, luminescence, quantum yields, and lifetimes in the solid state and in water. GdLCOOH was also prepared to determine the single and triplet states of the ligand. Electrospray ionization-mass spectrometry (ESI-MS) in various aqueous solutions, and attenuated total reflection Fourier transform infrared spectroscopy (ATR FT-IR), X-ray photoelectron spectroscopy (XPS), and synchrotron X-ray diffraction (XRD) in the solid state were performed to evaluate the structure. The dependence of the pH on the luminescence of EuLCOOH is also discussed.
2. Results and discussion
2.1 Structure and luminescence of LnLCOOH in the solid state
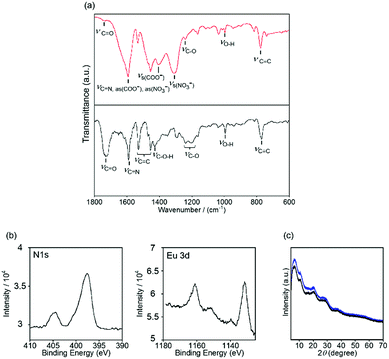
The LCOOH ligand was newly synthesized through the reaction in Scheme S1 (ESI†) based on a literature procedure.76 Reactions between LCOOH and nitrates of EuIII, GdIII, and TbIII in ethanol formed the LnLCOOH complexes. The detailed characterization is described in the experimental section.An ATR FT-IR measurement was performed to assign the role of the two carboxylic acid groups in EuLCOOH, and it was not necessary to consider counter anion exchange (Fig. 2). The O–H bending mode of the carboxyl group appears at 995 cm−1 in LCOOH. The 1730 and 1240–1203 cm−1 bands in LCOOH are assigned to the C![[double bond, length as m-dash]](https://www.rsc.org/images/entities/char_e001.gif) O and C–O stretching vibrations, respectively. After complexation with Eu, the corresponding O–H bending mode in the ligand remains at 946 cm−1. Similarly, the C
O and C–O stretching vibrations, respectively. After complexation with Eu, the corresponding O–H bending mode in the ligand remains at 946 cm−1. Similarly, the C![[double bond, length as m-dash]](https://www.rsc.org/images/entities/char_e001.gif) O stretching vibration mode in EuLCOOH shifts to a lower energy (∼1600 cm−1) than that for LCOOH, and is superimposed with the C
O stretching vibration mode in EuLCOOH shifts to a lower energy (∼1600 cm−1) than that for LCOOH, and is superimposed with the C![[double bond, length as m-dash]](https://www.rsc.org/images/entities/char_e001.gif) N vibration of the pyridine moiety (Fig. 2). Thus, the role of each carboxyl group differs based on the expected molecular design of EuLCOOH; i.e. one group is free and the other coordinates to the Eu ion. The broad band at 3300–2000 cm−1 in LCOOH indicates intermolecular hydrogen bonds because the band is not present for EuLCOOH (Fig. S1, ESI†). The ATR FT-IR bands of TbLCOOH and GdLCOOH are similar to those of EuLCOOH, which indicates that the LnLCOOH series has a similar molecular structure (Fig. S1, ESI†).
N vibration of the pyridine moiety (Fig. 2). Thus, the role of each carboxyl group differs based on the expected molecular design of EuLCOOH; i.e. one group is free and the other coordinates to the Eu ion. The broad band at 3300–2000 cm−1 in LCOOH indicates intermolecular hydrogen bonds because the band is not present for EuLCOOH (Fig. S1, ESI†). The ATR FT-IR bands of TbLCOOH and GdLCOOH are similar to those of EuLCOOH, which indicates that the LnLCOOH series has a similar molecular structure (Fig. S1, ESI†).
Two nitrate anions exist as counter anions to neutralize the valence of EuLCOOH; EuLCOOH is estimated as a cationic component in the valence of 2+ from the FT-IR results. The N 1s XPS bands of EuLCOOH appear at 404.5 and 397.6 eV and are assigned to the nitrate anions and six nitrogen atoms of LCOOH (Fig. 2(b)). From the ratios of their band areas, the existence ratios for the nitrate anions and six nitrogen atoms of LCOOH are 1![[thin space (1/6-em)]](https://www.rsc.org/images/entities/char_2009.gif) :
:![[thin space (1/6-em)]](https://www.rsc.org/images/entities/char_2009.gif) 3. Thus, the two nitrate ions exist as counter anions and EuLCOOH is the divalent cation in the solid state.
3. Thus, the two nitrate ions exist as counter anions and EuLCOOH is the divalent cation in the solid state.
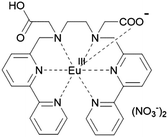
From these results, a molecular structure can be suggested (Fig. 3). Six nitrogen atoms and one carboxyl group of a LCOOH ligand coordinate to an Eu ion; the other carboxyl group will not coordinate. Synchrotron X-ray powder diffraction (XRPD) patterns of EuLCOOH at room temperature and 77 K were obtained (Fig. 2(c)). The broadening is insufficient to assign the structure; however, the shape is reproducible at room temperature and 77 K. Thus, the crystalline phase of EuLCOOH is quite low.
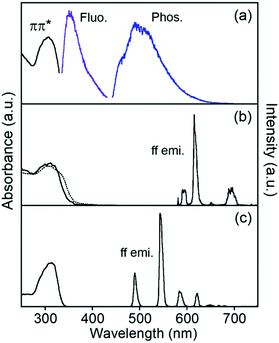
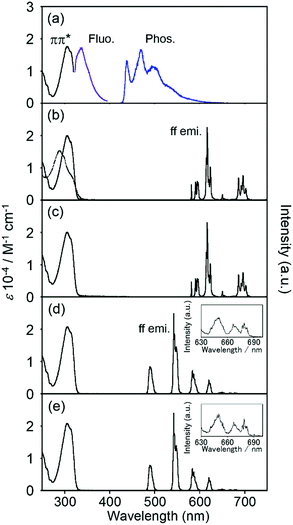
Electronic absorption spectra localized on the ligand of EuLCOOH in the solid state are broadly observed at 300–350 nm as the ππ* transition (Fig. 4). These bands of TbLCOOH and GdLCOOH appear at corresponding positions. GdIII complexes are convenient probes for assessing the organic electronic structure of LCOOH.77–79 They indicate the energy of the triplet states localized on the constituting ligand because GdIII possesses an accepting electronic level (32![[thin space (1/6-em)]](https://www.rsc.org/images/entities/char_2009.gif) 000 cm−1). It is located at a sufficiently high energy to prevent any population component present on the phosphorescence spectrum. From the observation of luminescence at room temperature and 77 K in the solid state, the 350 and 455 (sh) nm bands of GdLCOOH support the excited singlet and lowest triplet energy states at approximately 28
000 cm−1). It is located at a sufficiently high energy to prevent any population component present on the phosphorescence spectrum. From the observation of luminescence at room temperature and 77 K in the solid state, the 350 and 455 (sh) nm bands of GdLCOOH support the excited singlet and lowest triplet energy states at approximately 28![[thin space (1/6-em)]](https://www.rsc.org/images/entities/char_2009.gif) 600 and 22
600 and 22![[thin space (1/6-em)]](https://www.rsc.org/images/entities/char_2009.gif) 000 cm−1, respectively (Fig. 4). The latter band appears as the shoulder of a broad phosphorescence around 490 nm.
000 cm−1, respectively (Fig. 4). The latter band appears as the shoulder of a broad phosphorescence around 490 nm.
EuLCOOH in the solid state at room temperature shows the ff luminescence bands of EuIII at 580.3, 590 (sh), 614.4, and 650.8 nm assigned to the 5D0 → 7F0, 5D0 → 7F1, 5D0 → 7F2, and 5D0 → 7F3 transitions, respectively (λex = 315 nm). The broad band around 680–720 nm is assigned to the 5D0 → 7F4 transition. The excitation spectrum of EuLCOOH corresponds to its absorption spectrum in the solid state (Fig. S2, ESI†). This means that the π-electronic systems of the ligand act as photo-antennae and provide excitation energy transfer to the metal ion. The luminescence quantum yields (ϕL–Ln), lifetimes (τ), and photophysical data of EuLCOOH are summarized in Table 1 and Fig. S3, ESI.†
| τ obs (ms, amp.) | ϕ L–Ln | k R (s−1) | k NR (s−1) | ϕ Ln–Ln (%) | η EnT (%) | ||
|---|---|---|---|---|---|---|---|
| a The values for Ln emission are based on the ligand excitation. | |||||||
| EuLCOOH | rt | 0.80 (0.86) | 9.1 | 500 | 800 | 39 | 24 |
| 0.40 (0.14) | |||||||
| 77 K | 1.08 (0.57) | 18.6 | 440 | 640 | 41 | 46 | |
| 0.43 (0.43) | |||||||
| TbLCOOH | rt | 0.96 (0.61) | 10.9 | — | — | — | — |
| 0.40 (0.39) | |||||||
| 77 K | 1.22 (0.56) | 27.7 | — | — | — | — | |
| 0.50 (0.44) | |||||||
The values of ϕL–Ln at room temperature and 77 K are 9.1 and 18.6%, respectively. Each luminescence decay curve of EuLCOOH at room temperature and 77 K can be divided into two luminescence components. This indicates that EuLCOOH has at least two packing structures in the solid state.80 From the equations in the ESI,† the efficiency of the energy transfer (ηEnT) at room temperature increases and the non-radiative rate constant (kNR) decreases with decreasing temperature, increasing the ϕL–Ln value at 77 K. TbLCOOH also shows luminescence in the green wavelength region. The luminescence bands of TbLCOOH in the solid state appeared at 490.0, 542.4, 584.4, 622.1, 649.2, 667.9, and 680.9 nm, and are assigned to the 5D4 → 7F6, 5D4 → 7F5, 5D4 → 7F4, 5D4 → 7F3, 5D4 → 7F2, 5D4 → 7F1, and 5D4 → 7F0 transitions, respectively. The excitation spectrum of TbLCOOH in the solid state also corresponds to its absorption spectrum (Fig. S2, ESI†). The values of ϕL–Ln at room temperature and 77 K are 10.9 and 27.7%, respectively. There are two luminescence components at room temperature and 77 K, which is the same as that observed for EuLCOOH (Table 1).
The assumed energy diagram is shown in Fig. 5. The singlet and triplet levels localized on LCOOH are estimated from the results for GdLCOOH, as described above. EuLCOOH shows ff luminescence via the intramolecular energy transfer from the triplet state after the intersystem crossing of the excited singlet in LCOOH. The ff emissions of TbIII often show thermal sensitivity because of the thermal equilibrium between the energy donor and acceptor level.81,82 In our previous report, the parent TbL molecule showed negligibly weak ff emissions (1%) at room temperature, but efficient emissions (>90%) at 77 K because of the thermal equilibrium between the triplet state of L (21![[thin space (1/6-em)]](https://www.rsc.org/images/entities/char_2009.gif) 700 cm−1) and an acceptor level (5D4; 20
700 cm−1) and an acceptor level (5D4; 20![[thin space (1/6-em)]](https://www.rsc.org/images/entities/char_2009.gif) 500 cm−1) of Tb.83 Thus, LCOOH acts as a more efficient energy donor to Tb than L. Furthermore, the luminescence intensity of TbLCOOH increases at 77 K because the energy transfer accelerates toward the central metal. The value of TbLCOOH is lower than that of TbL at 77 K, indicating that it is enhanced by the different intermolecular interactions. The complexes with LCOOH also show amorphous-like XRPD patterns (Fig. 2(c)).
500 cm−1) of Tb.83 Thus, LCOOH acts as a more efficient energy donor to Tb than L. Furthermore, the luminescence intensity of TbLCOOH increases at 77 K because the energy transfer accelerates toward the central metal. The value of TbLCOOH is lower than that of TbL at 77 K, indicating that it is enhanced by the different intermolecular interactions. The complexes with LCOOH also show amorphous-like XRPD patterns (Fig. 2(c)).
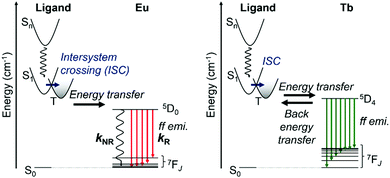 | ||
| Fig. 5 Schematic representation of energy diagram of EuLCOOH (left) and TbLCOOH (right) in the solid state. | ||
2.2 Structure and luminescence of LnLCOOH in an aqueous solution
![[thin space (1/6-em)]](https://www.rsc.org/images/entities/char_2009.gif) 800 cm−1 from the phosphorescence band (438 nm) of GdLCOOH in ethanol at 77 K, which is the same as that in the solid state (Fig. 6(a)). The band position in the solid state shifted toward the blue in the protic solvent. The band shape in solution became sharper than that in the solid state. The different energy donor levels for the solid state in solution particularly affect the luminescence properties of TbLCOOH (vide infra). The fluorescence band of GdLCOOH in aqueous solution appears at 336 nm.
800 cm−1 from the phosphorescence band (438 nm) of GdLCOOH in ethanol at 77 K, which is the same as that in the solid state (Fig. 6(a)). The band position in the solid state shifted toward the blue in the protic solvent. The band shape in solution became sharper than that in the solid state. The different energy donor levels for the solid state in solution particularly affect the luminescence properties of TbLCOOH (vide infra). The fluorescence band of GdLCOOH in aqueous solution appears at 336 nm.
The luminescence spectra and photophysical data of EuLCOOH in H2O and D2O are shown in Fig. 6 and Table 2. The luminescence bands of EuLCOOH in H2O/D2O sharply appear at 580.5, 594.2, 615.9, 649.7, and 680–720 nm, and are assigned to the ff transitions. The Stark splitting of EuLCOOH in H2O and D2O differs from that in the solid state because of the differences of ligand fields. The excitation spectrum of EuLCOOH corresponds to its absorption spectrum (Fig. S4, ESI†).
| τ obs (ms, amp.) | ϕ L–Ln | k R (s−1) | k NR (s−1) | ϕ Ln–Ln (%) | η EnT (%) | ||
|---|---|---|---|---|---|---|---|
| a The values of Ln emission are based on the ligand excitation. | |||||||
| EuLCOOH | H2O | 0.57 (1.00) | 11.5 | 250 | 1500 | 14 | 76 |
| D2O | 1.94 (1.00) | 35.4 | 250 | 270 | 49 | 74 | |
| TbLCOOH | H2O | 1.50 (1.00) | 51.6 | — | — | — | — |
| D2O | 2.41 (1.00) | 81.6 | — | — | — | — | |
From the luminescence decay profile measurement, EuLCOOH in H2O and D2O has a single luminescence component with lifetimes of 0.57 and 1.94 ms, respectively (Table 2 and Fig. S5, ESI†). The value of ϕL–Ln in H2O is 11.5%, which is relatively higher than that in the solid state (Table 1). The quantum yield of EuL in acetonitrile is lower than that in the solid state.73 The value of ϕL–Ln in D2O is 35.4%. It is caused by the deuterium effect because the five-fold vibrational mode in D2O affects the excited state of EuIII less than the three-fold vibrational mode in H2O.84–92 The value of ϕL–Ln and the lifetime of the Eu complex in D2O seem larger than those in H2O. The radiation and non-radiation rate constants are 250 and 270 s−1 in D2O, respectively, while those in H2O are 250 and 1500 s−1, respectively. Application of Horrocks' equation to the observed luminescence lifetimes in water is a useful method for understanding the molecular structure of Eu complexes because of the estimation method that is used for the number of coordinating water molecules.93–95 The q value represents the number of water molecules and is calculated by the following equation:
| q = 1.11[τH2O−1 − τD2O−1 − 0.31] | (1) |
The luminescence band shapes of TbLCOOH in H2O and D2O are sharper than that in the solid state, which is the same as that observed for EuLCOOH (Fig. 6). The luminescence bands of TbLCOOH in H2O/D2O are observed at 490.1, 541.6, 584.0, 621.4, 650.4, 668.7, and 679.8 nm, and are assigned to the 5D4 → 7F6, 5D4 → 7F5, 5D4 → 7F4, 5D4 → 7F3, 5D4 → 7F2, 5D4 → 7F1, and 5D4 → 7F0 transitions, respectively. The excitation spectrum of TbLCOOH also corresponds to its absorption spectrum (Fig. S4, ESI†). The ϕL–Ln values of TbLCOOH in H2O and D2O are 51.6% and 81.6%, respectively. Interestingly, these values are much higher than the values in the solid state. As discussed above, the phosphorescence band has a vibrational structure, and the level of the lowest triplet state in solution is higher than that in the solid state. Thus, the energy transfer in TbLCOOH occurs more efficiently in H2O or D2O. The luminescence decay profile of TbLCOOH shows a single component in both H2O and D2O. The number of coordinating water molecules of TbLCOOH in water are also estimated by Horrocks' equation:93,94
| q = 4.2 [τH2O−1 − τD2O−1] | (2) |
Generally, the molecular shape, including the coordination sphere of metal complexes in water, should be considered for the molecular design along with several methods under presumable structural viewpoints. From the ESI-MS measurement, EuLCOOH, GdLCOOH, and TbLCOOH in aqueous solution are detected at their expected mass number (Fig. S6, ESI†). The assumed structure of EuLCOOH in aqueous solution is shown in Fig. 7. There are three possibilities to form a complex: structure A has two carboxylate groups that are bound to the Eu ion with the six nitrogen atoms of the ligand, structure C has both carboxylic groups released from the Eu ion, and structure B has one carboxylate coordinated to the metal ion and the other is released. It is impossible to combine more water molecules for structure A, while structure C is able to take on more than two water molecules. However, structure B has an open site to coordinate one water molecule. Eu/Tb has a suitable q value from the viewpoint of steric hindrance for the Eu/TbLCOOH complex, which is eight-coordinated by LCOOH and H2O based on the molecular structure assumed from the FT-IR spectra of structure B. That is, it strongly suggests that one carboxyl group of Eu/TbLCOOH will be released for water solubility, opening the water coordination to Eu.
The electronic absorption and luminescence spectra in aqueous solutions at various pH values are shown in Fig. 8. The absorption and luminescence band shapes of EuLCOOH do not change at pH 9.7. The value of ϕL–Ln and the luminescence lifetime of EuLCOOH at pH 9.7 are 10.6% and 0.57 ms, respectively. Thus, the molecular structure and coordination environment surrounding Eu are extremely stable at pH = 4.0–9.7.
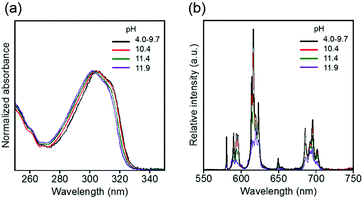 | ||
| Fig. 8 pH dependence of electronic absorption (a) and luminescence (b) spectra of EuLCOOH in the pH region of 4.0–11.9. λex = 315 nm. | ||
As the pH increases above 10.4, the major electronic absorption band at 305 nm (observed at pH 9.7) gradually shifts to a higher energy, and appears at 302 nm at pH 11.9. In contrast, the band positions and shapes of the ff emissions drastically change when the pH changes from 9.7 to 11.9 (Fig. 8). Two luminescence components are observed in the luminescence decay profile at pH 10.4, indicating that the molecular structure of EuLCOOH at pH 10.4 differs from that in the initial state (Fig. S7, ESI†). The luminescence lifetimes of EuLCOOH in H2O under basic conditions are estimated to be 0.36 ms (amplitude 0.92) and 0.83 ms (0.08), and that in D2O is estimated to be 1.75 ms (Fig. S8, ESI†). Based on these major values, EuLCOOH will change its molecular structure under basic conditions while maintaining the coordination between Eu and LCOOH (Fig. S9(a), ESI†); the carboxylate group or a part of the pyridine moiety will be released from the Eu ion because of the increasing q value compared to that for the initial condition (ESI†). This also shows the reversibility of the electronic absorption and luminescence spectra at pH 3.5 using hydrochloric acid, indicating that EuLCOOH demonstrates a stable and flexible molecular change at alkaline pH (Fig. S10, ESI†).
The electronic absorption and luminescence spectra in an acidic aqueous solution are shown in Fig. 9. The absorption spectra of EuLCOOH shift to slightly shorter wavelengths by 2 nm after adjustment with hydrochloric acid compared to the initial solution. The luminescence bands of EuLCOOH correspond in the pH region of 4.0–2.6, but the intensities become weaker and are finally quenched below pH 1.9 (Fig. S11, ESI†). The absorption spectra of EuLCOOH under acidic conditions correspond to that of LCOOH under the same pH conditions (Fig. S12, ESI†), meaning that EuLCOOH will be decomposed by the strong acidic condition. These results are well supported by the ESI-MS data shown in Fig. 8(b)–(d); in particular, the m/z values of 257.2 and 513.3 observed at pH 1.9 can be assigned to the diprotonated and monoprotonated species of LCOOH. Adjusting the pH toward the initial value causes the absorption and luminescence bands to reproduce their positions and intensities, indicating that EuLCOOH has a surprising ability to recoordinate (Fig. S13, ESI†).
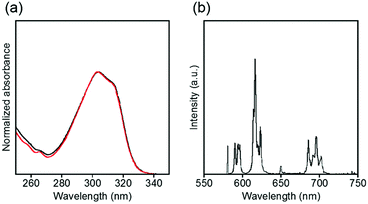 | ||
| Fig. 9 Electronic absorption (a) and luminescence (b) spectra of EuLCOOH in acidic aqueous solutions. The black and red lines show a pH of 2.6 and 1.9–2.1, respectively. λex = 315 nm. | ||
Luminescence lifetimes in H2O and D2O were observed in an acidic solution to examine the process of luminescence quenching of EuLCOOH (Fig. S14, ESI†). The luminescence lifetimes of the luminescent component for EuLCOOH in H2O and D2O under acidic conditions are 0.42 and 2.22 ms, respectively. The q value in the acidic solution is estimated as 1.7 for EuLCOOH. This value is higher than that under initial conditions. Additionally, each solution shows a second luminescence component with a relatively short lifetime (<0.01 ms), which is assigned to the dissociation of EuLCOOH. This suggests that two water molecules will coordinate to Eu around pH 2, and the dissociated complex partly exists in this equilibrium. The absolute luminescence quantum yield is 0.2% at pH 2.1.
From the above results, the assumed dissociation process of EuLCOOH in aqueous solutions is shown in Scheme 1. One carboxylate coordinates to the Eu ion and the other exists as carboxylic acid; a water molecule binds to the central metal at pH = 2.6–9.7. With decreasing pH values, two water molecules bind to the Eu ion, the carboxylate releases from the Eu ion, and EuLCOOH dissociates at pH 1.9 with protonation of the LCOOH ligand. These molecular structural changes are readily reversible.
3. Conclusions
The photophysical behaviour and structure of a water-soluble Eu complex with LCOOH, based on the helicate structure and functional carboxylate, were examined in aqueous solution at various pH values. The coordination number of the Eu complex EuLCOOH was assumed to be greater than 8. One of the two carboxylate groups is released from the Eu ion, even in the powdered state, while the other carboxylate acts to provide hydrophilicity in water. EuLCOOH shows ff luminescence in the solid state. This molecule keeps the ff emission of Eu in the wide pH range of 2.6–9.7, and shows spectral reversibility at pH = 1.9–11.9. The luminescence lifetimes of EuLCOOH in H2O and D2O make it possible to estimate the number of coordinated water molecules to Eu as 1 at the initial condition (pH = 2.6–9.7). In both strongly basic and strongly acidic conditions, this value increases with molecular structural changes. For instance, one carboxyl group binding to Eu will release from Eu at approximately pH = 2.1–2.6. Furthermore, EuLCOOH completely decomposes below pH 1.9 and recovers as a complex with adjustments toward the initial pH. TbLCOOH also shows luminescence in the green wavelength region for ff emission, and a water molecule is combined with the Tb ion in the initial condition. The luminescence quantum yield of TbLCOOH in H2O is higher than that in the solid state. The luminescence mechanisms of EuLCOOH and TbLCOOH are discussed based on the energy relaxation process of the triplet sate of the LCOOH ligand of GdLCOOH.4. Experimental
4.1 Regents and materials
Commercially available regents and spectral-grade solvents (Wako Pure Chemical Industries Ltd, Tokyo Chemical Industry Ltd, and Kanto Chemical Co. Inc.) were generally used without further purification. Water was purified using a Direct-Q3 UV-Remote Water Purification System (Merck Millipore). Preparative layer chromatography was performed using silica (Merck silica gel 60, 2 mm). The concentration of the measured sample was 3.0 × 10⁻⁵ M. The pH values were adjusted by the addition of sodium hydroxide or hydrochloric acid.4.2 Syntheses
![[thin space (1/6-em)]](https://www.rsc.org/images/entities/char_2009.gif) :
:![[thin space (1/6-em)]](https://www.rsc.org/images/entities/char_2009.gif) 1). Yield: 33.8 mg (62%). 1H-NMR (500.00 MHz, CDCl3, Fig. S16, ESI†) δ 8.65 (d, 2H), 8.38 (d, 2H), 8.23 (d, 2H), 7.75 (m, 4H), 7.49 (d, 2H), 7.28 (m, 4H), 4.04 (s, 4H), 3.52 (s, 4H), 3.20 (m, 6H), 2.96 (s, 4H) MS (FAB+); m/z, 569 [M + H]+ (calcd 569.68).
1). Yield: 33.8 mg (62%). 1H-NMR (500.00 MHz, CDCl3, Fig. S16, ESI†) δ 8.65 (d, 2H), 8.38 (d, 2H), 8.23 (d, 2H), 7.75 (m, 4H), 7.49 (d, 2H), 7.28 (m, 4H), 4.04 (s, 4H), 3.52 (s, 4H), 3.20 (m, 6H), 2.96 (s, 4H) MS (FAB+); m/z, 569 [M + H]+ (calcd 569.68).
4.3 Instrumentation
1H-NMR spectra were recorded on a JEOL JMN-500II spectrometer in CDCl3 with tetramethylsilane and in methanol-d4. ATR FT-IR spectra were measured using a Nicolet iS5 spectrometer (Thermo Scientific). XPS measurements were performed on a KRATOS AXIS ULTRA DLD (Shimadzu) equipped with a monochromatic Al-Kα X-ray source (1253.6 eV); the binding energies were calibrated at the Au 4f level (84.0 eV). Synchrotron XRPD patterns were recorded on a large Debye–Scherrer camera installed at SPring-8 BL02B2 (JASRI/SPring-8) using an imaging plate as a detector.96 Fast atom bombardment mass spectrometry (FAB-MS) was performed using the MStation JMS-700A (JEOL). ESI-MS spectra were recorded using liquid chromatography-mass spectrometry (LC-MS 2020, Shimadzu). Electronic absorption spectra in the solid state and in solution were obtained using the diffused reflection method with conversion of the y-axis by UV-3100 and UV-3600S (Shimadzu), respectively. Luminescence and excitation spectra were recorded on a Fluorolog 3-22 (Horiba Jobin Yvon). Absolute luminescence quantum yields and luminescence lifetimes were determined using an absolute luminescence quantum yield C9920-02 spectrometer (Hamamatsu Photonics K. K.) and a Quantaurus-Tau C11367-12 spectrometer (Hamamatsu Photonics K. K.), respectively, with pulsed excitation light sources. The pH values were measured using a pH meter with a freshly calibrated 3.3 M KCl electrode from DKK-TOA Corporation.Acknowledgements
The synchrotron radiation experiments were performed at the BL02B2 of SPring-8 with the approval of the Japan Synchrotron Radiation Research Institute (Proposal No. 2017A1648, 2016B1342, 2016B1706, 2016A1336, 2016A1333, 2014B1316, 2013B1776, 2013B1679, and 2013A1020). The ESI-MS measurements were supported by Mr Takahiro Goda at Shimadzu Corporation. This work was partly supported by the Grants-in-Aid for Scientific Research on Innovative Areas of “Element-Block Polymers (Area Number: 2401)” (No. 25107730; MH), Challenging Exploratory Research Center Project for Private University, a matching fund subsidy from MEXT (2013–2017; MH), and a SOKEN Project provided by the Aoyama Gakuin University Research Institute (2016–2017; MH). MH also acknowledges the Izumi Science and Technology Foundation for their financial support.References
- S. V. Eliseeva and J.-C. G. Bünzli, Chem. Soc. Rev., 2010, 39, 189 RSC.
- S. J. Butler and D. Paker, Chem. Soc. Rev., 2013, 42, 1652 RSC.
- I. Hemmilä and V.-M. Mukkala, Crit. Rev. Clin. Lab. Sci., 2001, 38, 441 CrossRef.
- D. Parker, Coord. Chem. Rev., 2000, 205, 109 CrossRef CAS.
- J.-C. G. Bünzli, Chem. Lett., 2009, 38, 104 CrossRef.
- J.-C. G. Bünzli, J. Lumin., 2016, 170, 866 CrossRef.
- J.-C. G. Bünzli and S. V. Eliseeva, Chem. Sci., 2013, 4, 1939 RSC.
- S. V. Eliseeva and J.-C. G. Bünzli, New J. Chem., 2011, 35, 1165 RSC.
- M. Sy, A. Nonat, N. Hildebrandtb and L. J. Charbonnière, Chem. Commun., 2016, 52, 5080 RSC.
- M. V. Butovski and R. Kempe, New J. Chem., 2015, 39, 7544 RSC.
- S. J. Butler and D. Parker, Chem. Soc. Rev., 2013, 42, 1652 RSC.
- S. Shinoda and H. Tsukube, Analyst, 2011, 136, 431 RSC.
- T. Gunnlaugsson and J. P. Leonard, Chem. Commun., 2005, 3114 RSC.
- W. L. Scaff, Jr., D. L. Dyer and K. Mori, J. Bacteriol., 1969, 98, 246 Search PubMed.
- E. J. Soini, L. J. Pelliniemi, I. A. Hemmilä, V.-M. Mukkala, J. J. Kankare and K. Fröjdman, J. Histochem. Cytochem., 1988, 36, 1449 CrossRef CAS PubMed.
- S. Quici, A. Casoni, F. Foschi, L. Armelao, G. Bottaro, R. Seraglia, C. Bolzati, N. Salvarese, D. Carpanese and A. Rosato, J. Med. Chem., 2015, 58, 2003 CrossRef CAS PubMed.
- E. M. Rodríguez, N. Bogdan, J. A. Capobianco, S. Orlandi, M. Cavazzini, C. Scalera and S. Quici, Dalton Trans., 2013, 42, 9453 RSC.
- F. Secundo, M. A. Bacigalupo, C. Scalera and S. Quici, J. Food Compos. Anal., 2012, 25, 221 CrossRef CAS.
- D. Kovacs, X. Li, L. S. Mészáros, M. Ott, J. Andres and K. E. Borbas, J. Am. Chem. Soc., 2017, 139, 5756 CrossRef CAS PubMed.
- M. Halim, M. S. Tremblay, S. Jockusch, N. J. Turro and D. Sames, J. Am. Chem. Soc., 2007, 129, 7704 CrossRef CAS PubMed.
- E. Pershagen, J. Nordholm and K. E. Borbas, J. Am. Chem. Soc., 2012, 134, 9832 CrossRef CAS PubMed.
- K. E. Borbas and J. I. Bruce, Org. Biomol. Chem., 2007, 5, 2274 CAS.
- E. Pershagen and K. E. Borbas, Angew. Chem., Int. Ed., 2015, 54, 1787 CrossRef CAS PubMed.
- T. Terai, K. Kikuchi, Y. Urano, H. Kojima and T. Nagano, Chem. Commun., 2012, 48, 2234 RSC.
- T. Terai, H. Ito, K. Kikuchi and T. Nagano, Chem. – Eur. J., 2012, 18, 7377 CrossRef CAS PubMed.
- S. Mizukami, T. Yamanoto, A. Yoshimura, S. Watanabe and K. Kikuchi, Angew. Chem., Int. Ed., 2011, 50, 8750 CrossRef CAS PubMed.
- A. T. Bui, M. Beyler, Y.-Y. Liao, A. Grichine, A. Duperray, J.-C. Mulatier, B. L. Guennic, C. Andraud, O. Maury and R. Tripier, Inorg. Chem., 2016, 55, 7020 CrossRef CAS PubMed.
- S. Nadella, P. M. Selvakumar, E. Suresh, P. S. Subramanian, M. Albrecht, M. Giese and R. Fröhlich, Chem. – Eur. J., 2012, 18, 16784 CrossRef CAS PubMed.
- A. Mohamadi and L. W. Miller, Bioconjugate Chem., 2016, 27, 2540 CrossRef CAS PubMed.
- G. L. Law, R. Pal, L. O. Palsson, D. Parker and K.-L. Wong, Chem. Commun., 2009, 7321 RSC.
- J. R. Diniz, J. R. Correa, D. de A. Moreira, R. S. Fontenele, A. L. de Oliveira, P. V. Abdelnur, J. D. L. Dutra, R. O. Freire, M. O. Rodorigues and B. A. D. Neto, Inorg. Chem., 2013, 52, 10199 CrossRef CAS PubMed.
- B. T. Nguyen, A. J. Ingram and G. Muller, Chemistry, 2016, 28, 325 CAS.
- T. Uchida, K. Nozaki and M. Iwamura, Chem. – Asian J., 2016, 11, 2415 CrossRef CAS PubMed.
- R. A. Poole, G. Bobba, M. J. Cann, J.-C. Frias, D. Parker and R. D. Peacock, Org. Biomol. Chem., 2005, 3, 1013 CAS.
- D. Parker, P. K. Senanayake and J. A. G. Williams, J. Chem. Soc., Perkin Trans. 2, 1998, 2129 RSC.
- C. S. Bonnet and T. Gunnlaugsson, New J. Chem., 2009, 33, 1025 RSC.
- C. Wei, H. Wei, W. Yan, Z. Zhao, Z. Cai, B. Sun, Z. Meng, Z. Liu, Z. Bian and C. Huang, Inorg. Chem., 2016, 55, 10645 CrossRef CAS PubMed.
- A. P. de Silva, H. Q. N. Gunaratne and T. E. Rice, Angew. Chem., Int. Ed., 1996, 35, 2116 CrossRef CAS.
- B. Song, G. Wang, M. Tan and J. Yuan, J. Am. Chem. Soc., 2006, 128, 13442 CrossRef CAS PubMed.
- M. Chen, Y. Zheng, J. Gao and Q. Wang, Opt. Mater., 2016, 60, 1 CrossRef CAS.
- M. P. Lowe, D. Parker, O. Reany, S. Aime, M. Botta, G. Castellano, E. Gianolio and R. Pagliarin, J. Am. Chem. Soc., 2001, 123, 7601 CrossRef CAS PubMed.
- R. S. Dickins, S. Aime, A. S. Batsanov, A. Beeby, M. Botta, J. I. Bruce, J. A. K. Howard, C. S. Love, D. Parker, R. D. Peacock and H. Puschmann, J. Am. Chem. Soc., 2002, 124, 12697 CrossRef CAS PubMed.
- K. Hanaoka, K. Kikuchi, H. Kojima, Y. Urano and T. Nagano, J. Am. Chem. Soc., 2004, 126, 12470 CrossRef CAS PubMed.
- O. Kotova, S. Comgy and T. Gunnlaugsson, Chem. Commun., 2011, 47, 6810 RSC.
- A. M. Nonat, A. J. Harte, K. Sénéchal-David, J. P. Leonard and T. Gunnlaugsson, Dalton Trans., 2009, 4703 RSC.
- G. A. Crosby, R. E. Whan and R. M. Alire, J. Chem. Phys., 1961, 34, 743 CrossRef CAS.
- S. Tobita, M. Arakawa and I. Tnaka, J. Phys. Chem., 1984, 88, 2697 CrossRef CAS.
- S. Tobiata, J. Phys. Chem., 1985, 89, 5649 CrossRef.
- F. Mian, G. Bottaro, R. Seraglia, M. Cavazzini, S. Quici and L. Armelao, ChemPhysChem, 2016, 17, 3229 CrossRef CAS PubMed.
- G. Bottaro, F. Rizzo, M. Cavazzini, L. Armelao and S. Quici, Chem. – Eur. J., 2014, 20, 4598 CrossRef CAS PubMed.
- S. Quici, G. Marzanni, A. Forni, G. Accrosi and F. Barigelletti, Inorg. Chem., 2004, 43, 1294 CrossRef CAS PubMed.
- S. Quici, G. Marzanni, M. Cavazzini, P. L. Anelli, M. Botta, E. Gianolio, G. Accorsi, N. Armaroli and F. Barigelletti, Inorg. Chem., 2002, 41, 2777 CrossRef CAS PubMed.
- S. Quici, M. Cavazzini, M. C. Raffo, M. Botta, G. B. Giovenzana, B. Ventura, G. Accorsi and F. Barigelletti, Inorg. Chim. Acta, 2007, 360, 2549 CrossRef CAS.
- S. Quici, M. Cavazzini, G. Marzanni, G. Accorsi, N. Armaroli, B. Ventura and F. Barigelletti, Inorg. Chem., 2005, 44, 529 CrossRef CAS PubMed.
- L. J. Daumann, D. S. Tatum, C. M. Andolina, J. I. Pacold, A. D'Aléo, G.-L. Law, J. Xu and K. N. Raymond, Inorg. Chem., 2016, 55, 114 CrossRef CAS PubMed.
- A. de Bettencourt-Dias, P. S. Barber and S. Bauer, J. Am. Chem. Soc., 2012, 134, 6987 CrossRef CAS PubMed.
- S. Petoud, S. M. Cohen, J.-C. G. Bünzli and K. N. Raymond, J. Am. Chem. Soc., 2003, 125, 13324 CrossRef CAS PubMed.
- B.-L. An, X.-D. Huang, J.-M. Zhang, X.-Y. Zhu and J.-Q. Xu, J. Lumin., 2017, 187, 340 CrossRef CAS.
- M. Xiao and P. R. Selvin, J. Am. Chem. Soc., 2001, 123, 7067 CrossRef CAS PubMed.
- M. Sy, D. Esteban-Gómez, C. Platas-Iglesias, A. Rodríguez-Rodríguez, R. Tripier and L. J. Charbonnière, Chem. – Eur. J., 2017, 14, 2122 Search PubMed.
- A. Beeby, L. M. Bushby, D. Maffeo and J. A. G. Williams, J. Chem. Soc., Dalton Trans., 2002, 48 RSC.
- L. R. Melby, N. J. Rose, E. Abramson and J. C. Caris, J. Am. Chem. Soc., 1964, 86, 5117 CrossRef CAS.
- V.-M. Mukkala, H. Takalo, P. Liitti and I. Hemmilä, J. Alloys Compd., 1995, 225, 507 CrossRef CAS.
- V.-M. Mukkala, C. Sund, M. Kwiatkowski, P. Pasanen, M. Högberg, J. Kankare and H. Takalo, Helv. Chim. Acta, 1992, 75, 1621 CrossRef CAS.
- V.-M. Mukkala, H. Helenius, I. Hemmilä, J. Kankare and H. Tkalo, Helv. Chim. Acta, 1993, 76, 1361 CrossRef CAS.
- X. Liu, Z. Tang, B. Song, H. Ma and J. Yuan, J. Mater. Chem. B, 2017, 5, 2849 RSC.
- Z. Dai, L. Tian, B. Song, Z. Ye, X. Liu and J. Yuan, Anal. Chem., 2014, 86, 11883 CrossRef CAS PubMed.
- M. Liu, Z. Ye, C. Xin and J. Yuan, Anal. Chim. Acta, 2013, 761, 149 CrossRef CAS PubMed.
- Z. Dai, L. Tian, Z. Ye, B. Song, R. Zhang and J. Yuan, Anal. Chem., 2013, 85, 11658 CrossRef CAS PubMed.
- Y. Xiao, R. Zhang, Z. Ye, Z. Dai, H. An and J. Yuan, Anal. Chem., 2012, 84, 10785 CrossRef CAS PubMed.
- Y. Xiao, Z. Ye, G. Wang and J. Yuan, Inorg. Chem., 2012, 51, 2940 CrossRef CAS PubMed.
- C. Piguet and J.-C. G. Bünzli, Handbook on The Physics and Chemistry of Rare Earths, Elsevier, 2010, pp. 301–553 Search PubMed.
- M. Hasegawa, H. Ohtsu, D. Kodama, T. Kasai, S. Sakurai, A. Ishii and K. Suzuki, New J. Chem., 2014, 38, 1225 RSC.
- H. Wada, S. Ooka, D. Iwasawa, M. Hasegawa and T. Kajiwara, Magnetochemistry, 2016, 2, 43 CrossRef.
- N. Goto, A. Ishii, S. Ogata, K. Kondo, K. Yoshihara, J. Tsuchiyagaito, S. Kawaguchi, K. Sugimoto and M. Hasegawa, in preparation to submit to RSC soon.
- K. E. Andersen, J. L. Sørensen, P. O. Huusfeldt, L. J. S. Knutsen, J. Lau, B. F. Lundt, H. Petersen, P. D. Suzdak and M. D. B. Swedberg, J. Med. Chem., 1999, 42, 4281 CrossRef CAS PubMed.
- G. H. Dieke and H. M. Crosswhite, Appl. Opt., 1963, 2, 675 CrossRef CAS.
- S. Comby, D. Imbert, A.-S. Chauvin and J.-C. G. Bünzli, Inorg. Chem., 2006, 45, 732 CrossRef CAS PubMed.
- C. Y. Chow, S. V. Eliseeva, E. R. Trivedi, T. N. Nguyen, J. W. Kampf, S. Petoud and V. L. Pecorato, J. Am. Chem. Soc., 2016, 138, 5100 CrossRef CAS PubMed.
- S. Ogata, A. Ishii, C. L. Lu, T. Kondo, N. Yajima and M. Hasegawa, J. Photochem. Photobiol., A, 2017, 334, 55 CrossRef CAS.
- M. Latva, H. Takalo, V.-M. Mukkala, C. Matachescu, J. C. Rodríguez-Ubis and J. Kankare, J. Lumin., 1997, 75, 149 CrossRef CAS.
- S. Katagiri, Y. Hasegawa, Y. Wada and S. Yanagida, Chem. Lett., 2004, 33, 1438 CrossRef CAS.
- W. T. Carnall, P. R. Fields and K. Rajnak, J. Chem. Phys., 1968, 49, 4447 CrossRef CAS.
- J. L. Kropp and M. W. Windsor, J. Chem. Phys., 1963, 39, 2769 CrossRef CAS.
- J. L. Kropp and M. W. Windsor, J. Chem. Phys., 1965, 42, 1599 CrossRef CAS.
- J. L. Kropp and M. W. Windsor, J. Chem. Phys., 1966, 45, 761 CrossRef CAS.
- A. Heller, J. Am. Chem. Soc., 1966, 88, 2058 CrossRef CAS.
- J. L. Kropp and M. W. Windsor, J. Phys. Chem., 1967, 71, 477 CrossRef CAS.
- Y. Hass and G. Stein, J. Phys. Chem., 1972, 76, 1093 CrossRef.
- G. Stein and E. Wurzberg, J. Chem. Phys., 1975, 62, 208 CrossRef CAS.
- Y. Hass and G. Stein, J. Phys. Chem., 1971, 75, 3668 CrossRef.
- Y. Hass and G. Stein, J. Phys. Chem., 1971, 75, 3677 CrossRef.
- W. D. Horrocks, Jr. and D. R. Sudnick, J. Am. Chem. Soc., 1979, 101, 334 CrossRef.
- W. D. Horrocks, Jr. and D. R. Sudnick, Acc. Chem. Res., 1981, 14, 384 CrossRef.
- R. M. Supkowski and W. D. Horrocks, Jr., Inorg. Chim. Acta, 2002, 340, 44 CrossRef CAS.
- H. Ohashi, K. Tanigaki, R. Kumashiro, S. Sugihara, S. Hiroshiba, S. Kimura, K. Kato and M. Takata, Appl. Phys. Lett., 2004, 84, 520 CrossRef CAS.
Footnote |
| † Electronic supplementary information (ESI) available: Attenuated total reflection FT-IR, electronic absorption, excitation and luminescence spectra with their decay profiles. For the syntheses, reaction scheme, ESI-MS and 1H-NMR spectra, see DOI: 10.1039/c7nj01444a |
| This journal is © The Royal Society of Chemistry and the Centre National de la Recherche Scientifique 2017 |

