Catalytic assembly of DNA nanostructures on a nanoporous gold array as 3D architectures for label-free telomerase activity sensing†
Suyan
Qiu
 ab,
Fusheng
Zhao
a,
Oussama
Zenasni
ac,
Jingting
Li
a and
Wei-Chuan
Shih
 *acde
*acde
aDepartment of Electrical and Computer Engineering, University of Houston, 4800 Calhoun Road, Houston, TX 77204, USA. E-mail: wshih@uh.edu
bInstitute for Quality & Safety and Standards of Agricultural Products Research, Jiangxi Academy of Agricultural Sciences, Nanchang, Jiangxi 330200, P. R. China
cDepartment of Chemistry, University of Houston, 4800 Calhoun Road, Houston, TX 77204, USA
dDepartment of Biomedical Engineering, University of Houston, 4800 Calhoun Road, Houston, TX 77204, USA
eProgram of Materials Science and Engineering, University of Houston, 4800 Calhoun Road, Houston, TX 77204, USA
First published on 11th May 2017
Abstract
Telomerase, an enzyme known to catalyze telomere elongation by adding TTAGGG [thymine (T), adenine (A), and guanine (G)] repeats to the end of telomeres, is vital for cell proliferation. Overexpression of telomerase has been found in most tumor cells, resulting in telomere dysfunction and uncontrolled cellular proliferation. Thus, telomerase has been considered as a potential cancer biomarker, as well as a potential target in cancer therapy. In this study, telomerase-catalyzed growth of tandem G-quadruplex (G4) assembled on a nanoporous gold array (NPGA) resulted in the formation of three-dimensional hybrid nanoarchitectures. The generated nanostructure then captured malachite green (MG) (reporter molecule) without the need of a complicated labeling process. Upon laser irradiation, the captured MG molecules produced a surface-enhanced Raman scattering (SERS) signal that was generated by an abundant amount of plasmonic hot spots in the NPGA substrates. A limit of detection (LOD) of 10−10 IU along with a linear range, which was 3 orders of magnitude, was achieved, which was equivalent to the telomerase amount extracted from 20 HeLa cells. The LOD is 2 orders of magnitude better than that of the commercial enzyme-linked immunosorbent assay (ELISA), and it approaches that of the most sensitive technique, telomeric repeat amplification protocols (TRAP), which require a laborious and equipment-intensive polymerase chain reaction (PCR). In addition, X-ray photoelectron spectroscopy (XPS) was used to chemically identify and quantify the telomerase activity on the sensitized NPGA surface. Furthermore, the sensor was applied to screen the effectiveness of anti-telomerase drugs such as zidovudine, thus demonstrating the potential use of the sensor in telomerase-based diagnosis and drug development. Moreover, the framework represents a novel paradigm of collaborative plasmonic intensification and catalytic multiplication (c-PI/CM) for label-free biosensing.
Conceptual insights3D hybrid nanoarchitectures, formed by telomerase-catalyzed growth of tandem G-quadruplexes (G4), was explored on a nanoporous gold array (NPGA), followed by a simple staining step using malachite green (MG) without any complicated labeling processes. Upon laser irradiation, the captured MG molecules produced a surface-enhanced Raman scattering (SERS) signal that was generated by an abundant amount of plasmonic hot spots in the NPGA substrates. In particular, the highly active surface and good biocompatibility of NPGA further enhanced the catalytic performance of telomerase, greatly shortening the assembly time of the telomeric repeats. The limit of detection is equivalent to the telomerase amount extracted from 20 HeLa cells, which is 2 orders of magnitude better than that of the commercial ELISA and approaches that of the most sensitive PCR-based TRAP technique. A potential application is demonstrated using the proposed sensor to screen anti-telomerase drugs such as zidovudine. Therefore, this study establishes a novel paradigm of collaborative plasmonic intensification and catalytic multiplication. |
1. Introduction
Telomeres consisting of tandem (TTAGGG)n repeats (thymine (T), adenine (A), and guanine (G)) are present at the ends of eukaryotic chromosomes with binding proteins. Proper telomere maintenance is a vital prerequisite for continual cellular proliferation. On the other hand, shortened telomeres increase the probability of chromosome end damage, which subsequently induces cellular senescence or apoptosis depending on the cell type.1,2 Thus, a variety of pathological processes are linked with the changes in the length of the telomere.3 Telomerase is an enzyme that catalyzes telomere elongation by adding G-rich TTAGGG repeats to the end of a telomere. Telomerase is well known as a ribonucleoprotein with three main parts: a reverse transcriptase unit (TERT) that is the enzyme center,4 a structural component containing RNA that is used as a replica for coding G-rich telomeric repeats, and the dyskerin protein complex.5 Several recent reports have argued that the overexpression of telomerase might prolong the cellular lifespan due to its anti-aging effect.6–9 However, in cancer biology, overexpression of telomerase has been found in most tumor cells, leading to telomere dysfunction and uncontrolled proliferation. This has led scientists to consider telomerase as a potential cancer biomarker10–13 and a target in cancer therapy.14 For example, Xu et al. reported that the combination of TERT and cyclooxygenase 2 can synergistically kill gastric cancer cells both in vitro and in vivo.15 Thus, precise monitoring of the telomerase activity is key to advancing science and technology in anti-aging and cancer diagnostics and therapeutics.16–19To date, several commercial telomerase sensing technologies have been developed based on the polymerase chain reaction telomeric repeat amplification protocol (PCR-TRAP)20 and enzyme-linked immunosorbent assay (ELISA). PCR-TRAP is the most widely used technique with high sensitivity;21 however, it suffers from interferences from other species such as biomolecules used in PCR inhibition, which leads to false-negative results.22 In addition, PCR requires sophisticated sample preparation, long waiting time, and has high cost. ELISA, on the other hand, is relatively easier to implement. However, it suffers from poor sensitivity compared to PCR-TRAP. In addition, ELISA cannot be employed to monitor telomerase activity since it lacks the specificity to distinguish between active and non-active forms of telomerase. Furthermore, the need for highly specific antibodies renders ELISA costly. To address these issues, alternative methods have been developed based on the detection of telomeric repeats via different reporting mechanisms such as fluorescence,23–26 electrochemistry,27–30 electrochemiluminescence,31,32 and surface plasmon resonance.33,34 Although these approaches have shown various levels of success, having a detection sensitivity that is competitive to that of the PCR-TRAP is still elusive. Most of the existing techniques rely on the hybridization of telometric repeats with additional complementary DNA sequences, which makes them complicated and prone to false-positive results.
To overcome these limitations, we developed a rapid, low-cost sensing platform based on telomerase-catalyzed assembly of tandem G4 on nanoporous gold array (NPGA) substrates, an attractive plasmonic platform due to its large specific surface area, high-density hot spots, and tunable plasmonic properties.35,36 Since NPGA are directly fabricated on a substrate using advanced micro and nanofabrication technologies, the nanostructures are extremely robust, a key factor for high-performance molecular sensing. In our previous studies, NPGA chips have been employed for label-free monitoring of individual DNA hybridization via SERS37 and surface-enhanced fluorescence (SEF).38 Recently, chemical and refractive index sensing have been simultaneously achieved via surface-enhanced near-infrared absorption (SENIRA).39 In the existing demonstrations, NPGA was explored for its plasmonic light concentrating property. In this study, however, NPGA was demonstrated to enhance the local electric field as well as facilitate the catalytic reactions. While extreme light concentration enables ultrasensitive detection, catalytic reactions effectively reduce the assay time. Therefore, this study represents a novel paradigm of collaborative plasmonic intensification and catalytic multiplication (c-PI/CM).
Herein, tandem G4 topological structures, formed by telomerase-catalyzed telomeric repeats in situ, were used as scaffolds to capture malachite green (MG), a reporter molecule, onto the NPGA surface; moreover, molecular-specific detection and quantification were carried out using surface-enhanced Raman spectroscopy (SERS). The high capturing efficiency of tandem G4 towards MG improved the sensitivity of the assay without the use of complicated labeling processes. This newly developed sensor demonstrates a limit of detection approaching that of the PCR-TRAP with a linear range across 3 orders of magnitude. We also confirmed the telomerase activity on the NPGA surface using X-ray photoelectron spectroscopy (XPS) and estimated the number of the telomeric repeats. For the real applicability of the sensor, we successfully showed the screening of an anti-telomerase drug, zidovudine, which is employed in treating AIDS patients. The present sensor has several distinct advantages such as low-cost, fast response, high sensitivity and dynamic range, and is easy-to-use, making it a promising candidate for monitoring the telomerase activity.
2. Results and discussion
2.1. Catalytic assembly of the DNA topological nanostructures on NPGA for the capture of malachite green
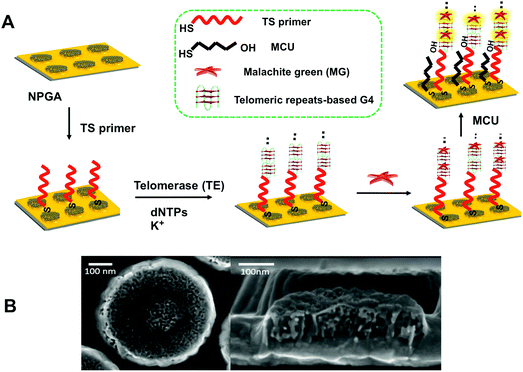
Thiolated sequence (TS) primer was first immobilized on NPGA, followed by incubation in deoxynucleotide triphosphates (dNTPs) and potassium ion (K+). With the addition of telomerase, a number of elongated telomeric repeats (TTAGGG) were assembled at the end of the TS primer via telomerase catalysis. The highly active surface and good biocompatibility of NPGA may further enhance the catalytic performance of telomerase,40 greatly shortening the assembly time of the telomeric repeats. Owing to the telomeric repeats, there is a G-rich sequence that can fold into a series of G4 structures through cyclic arrays of Hoogsteen hydrogen bonds in the presence of K+ and form tandem G4 moieties.41 Subsequently, exposure to MG molecules causes the formation of G4-MG conjugations through π–π stacking and electrostatic interactions (Fig. 1A),42,43 which makes the MG molecules to couple onto the NPGA surface as a signal reporter without the need of a sophisticated labeling process.44 Mercapto-1-undecanol (MCU) was applied to block the non-specific binding of the MG molecules, which could greatly reduce a false positive result. As previously reported, the high-density NPGA features a unique 3D internal porous network and ligament structure, offers a large surface area and abundant plasmonic hot-spots, which greatly enhances the electromagnetic fields of the localized surface plasmon resonance (LSPR), and further contributes to the high SERS enhancement and sensitivity. The remaining space of the flat Au film is low, indicating that a restricted SERS response is caused by the surface of the flat Au film. Moreover, the SERS response on the flat Au film is weak because of the poor enhancement factor of the flat Au film.45 Therefore, the SERS response from the flat Au film surface is negligible as compared to that from NPGA in our system. In addition, the MG molecules captured near the surface of NPGA contribute to a higher SERS signal, whereas other MG molecules that are far from the NPGA surface contribute to a relatively weaker SERS signal. A typical NPGA (diameter: 500 nm; thickness: 90 nm; and pore size: ∼15 nm) and its bicontinuous three-dimensional inner structure are shown in Fig. 1B.2.2. Surface modification-induced LSPR shifts
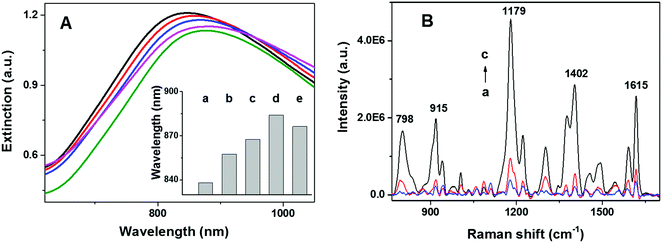
The spectral position of the LSPR of gold nanoparticles can be tuned by modifying the size, shape, and composition of the nanostructure. In addition, LSPR of gold nanoparticles is highly sensitive to changes in the local refractive index of the nanoparticles. This sensitivity can be employed to monitor the assembly and structural evolution of the nanoarchitectures. As shown in Fig. 2A, extinction spectra (Cary 5000, Agilent) of NPGA with and without telomerase were employed to assess different surface modification steps. A significant red shift of 15 nm was observed after incubating naked NPGA in a TS primer (Fig. 2Ab and Bb), indicating the successful binding of the TS primer on the gold surface. A further red shift of 10 nm was observed after the addition of telomerase (Fig. 2Ac), which was attributed to the catalytic elongation of the telomeric repeats and the formation of tandem G4 in situ. After exposing the assembled tandem G4-NPGA nanoarchitecture to MG solutions, an additional red shift of 16 nm was observed (Fig. 2Ad), and the binding of the MG molecules onto tandem G4 caused this shift. Lastly, a slight blue shift of 7 nm was observed after incubating the sensor in MCU solutions, a blocking agent (Fig. 2Ae), suggesting that non-specifically bound MG molecules and TS primer were removed and replaced by MCU molecules.SERS spectra of the NPGA substrates were acquired under different treatment conditions, without telomerase, with heat-inactivated telomerase, and with low-concentration active telomerase, using a home-built line-scan Raman microscope (LSRM).46 LSRM simultaneously enables the acquisition of high-quality SERS spectra from ∼120 diffraction-limited spots along a 120 μm line and facilitates the assessment of sample uniformity via statistical analysis. Spectral preprocessing, such as curvature correction and background removal, was performed using a home-built software.47 As shown in Fig. 2B, in the absence of telomerase, very weak SERS peaks were detected, which were attributed to the residual non-specifically bound MG molecules (Fig. 2Ba). In the presence of active telomerase, tandem G4 formed and assembled on the surface of NPGA, which allowed the capturing of the MG molecules. As a result, a strong SERS signal from the MG molecules was detected (Fig. 2Bc). Among these, the strong peaks at 1179 cm−1, 1402 cm−1, and 1615 cm−1 were assigned to the in-plane C–H bending, N-phenyl stretching, and ring C–C stretching of the MG molecules, respectively. The peaks at 798 cm−1 and 915 cm−1 were assigned to the out-of-plane C–H bending of the ring.48 Note that only a weak SERS signal was detected while using heat-inactivated telomerase (pre-heated at 90 °C for 15 min), suggesting that the proposed approach could differentiate between inactivated and activated telomerase, Fig. 2Bb vs. Bc, respectively.
2.3. XPS measurements for telometric elongation on NPGA
To verify the telometric elongation on the surface of NPGA, X-ray photoelectron spectroscopy (XPS) was performed, and the results are shown in Fig. S1 (ESI†). The signals of S 2p appeared roughly centered at 161.8 eV (S 2p3/2) and 163.1 eV (S 2p1/2) and clearly confirmed the existence of the TS primer modification layer (see curve a, b, and c in Fig. S1D, ESI†). No significant changes for the peak position and corresponding intensity of C 1s and N 1s were found when the TS primer-modified NPGA was incubated in the dNTPs solution (see curve a and b in Fig. S1B and C (ESI†), respectively), indicating that dNTPs alone had no effect on the TS primer. However, the intensities of C 1s and N 1s increased with the addition of telomerase (see curve c in Fig. S1B and C (ESI†), respectively), suggesting that the telomeric repeats were successfully added to the end of the TS primer. These variations were further verified by the ratios of C 1s and N 1s to Au 4f, and the data is summarized in Table 1. The ratios of C 1s/Au 4f, N 1s/Au 4f, and S 2p/Au 4f show no significant changes before and after the immersion of the TS primer-modified NPGA in the dNTPs solution (see a and b in Table 1). However, significant increases of C 1s/Au 4f and N 1s/Au 4f ratios were achieved following incubation with telomerase (see c in Table 1). Furthermore, according to the increase factor of the N 1s/Au 4f ratio of the TS primer-modified NPGA before and after incubation with telomerase, the number of telomeric repeats was estimated to be 15.5. Detailed calculation can be found in the ESI.† These results also suggested that telomerase remained highly active on the NPGA, which was essential for our approach.| Sample name | Au 4f | C 1s | N 1s | S 2p | C 1s/Au 4f | N 1s/Au 4f | S 2p/Au 4f |
|---|---|---|---|---|---|---|---|
| a Peak areas were used to calculate the ratio between C 1s, N 1s, S 2p, and Au 4f. | |||||||
| NPGA + TS (a) | 72671.35 | 4291.08 | 647.96 | 315.21 | 0.059 | 0.018 | 0.004 |
| NPGA + TS + dNTPs (b) | 64794.54 | 3707.07 | 700.45 | 259.41 | 0.057 | 0.011 | 0.004 |
| NPGA + TS + dNTPs + telomerase (c) | 41819.12 | 6510.79 | 2553.37 | 122.40 | 0.156 | 0.061 | 0.003 |
2.4. Sensor optimization
A series of control experiments were conducted to identify the optimal conditions for monitoring the telomerase activity. As can be seen from Fig. 3A, the SERS intensity rapidly increased with an increase in the TS primer concentration in the range from 6.0 nM to 0.2 μM and then gradually decreased at over 0.2 μM. A plausible explanation is that at the TS primer concentration higher than 0.2 μM, the assembled tandem G4 layer is too compact and spatially hindered to allow the MG molecules to bind. Fig. 3B shows the effect of the dNTP concentrations on the SERS signal. It was found that the SERS intensity gradually increased and reached a plateau near 0.03 mM. Thus, the optimal concentrations of the TS primer and dNTPs were selected at 0.2 μM and 0.03 mM, respectively.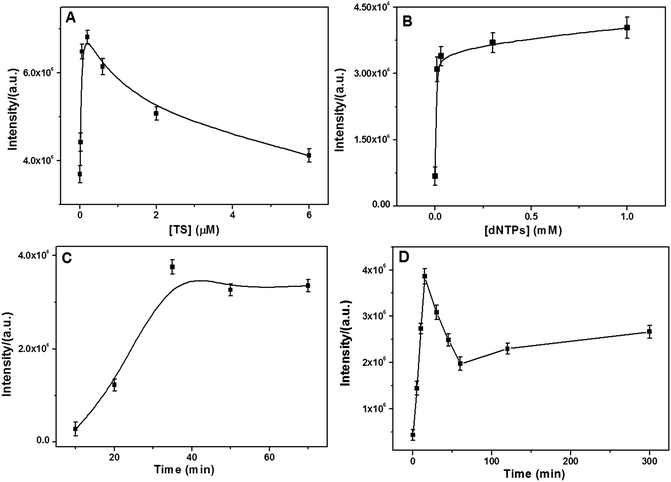 | ||
| Fig. 3 Dependence of the SERS intensity on the (A) TS primer concentration, (B) dNTPs concentration, (C) incubation time with MG molecules, and (D) incubation time with telomerase (6.45 × 10⁻⁹ IU). | ||
Moreover, the incubation time of the TS-immobilized NPGA with telomerase and MG molecules was examined. For the effect of the incubation time in the presence of the MG molecules, the SERS intensity dramatically increased and plateaued near 35 min (Fig. 3C); therefore, 35 min of MG incubation was selected for later experiments. For the performance of incubation time with telomerase (Fig. 3D), it was found that the SERS intensity first increased and then quickly decreased after 15 min. Therefore, unlimited telomeric elongation with longer incubation time would result in a more compact tandem G4 layer that would spatially hinder MG from binding G4 closer to the NPGA surface, leading to weaker SERS signal. Thus, to achieve the best SERS signal, the incubation time of 15 min was selected, which was much shorter than that reported in previous studies (at least 1 hour).33,49 On the other hand, the result suggests that the telomerase activity may be catalyzed by the highly active surface of the NPGA.
2.5. Monitoring the telomerase activity
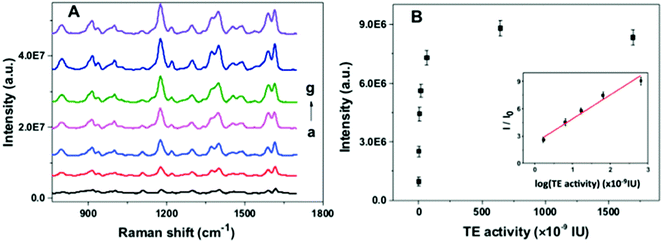
To investigate the feasibility of the proposed nanoarchitecture to quantify the telomerase activity, a series of TS primer-immobilized NPGA were immersed in different amounts of telomerase solutions. The SERS spectra and calibration curve for the quantitation of the telomerase activity are shown in Fig. 4. It was observed that the SERS intensity gradually increased with the increase in the telomerase activity in the range from 0.01 to 6.45 × 10⁻⁷ IU, reached a maximum at 6.45 × 10⁻⁷ IU, and a decreasing trend originated at over 6.45 × 10⁻⁷ IU (Fig. 4B). The results indicated that more telomeric repeats and G4 were formed and assembled with the increasing telomerase activity, which subsequently captured more MG molecules. However, spatial hindrance caused by the compact G4 layer prevents MG from binding G4 closer to the NPGA surface, resulting in a decrease in the SERS signal intensity at over 6.45 × 10⁻⁷ IU. In addition, the plot of I/I0 value vs. the logarithm of the telomerase activity exhibits good linearity in the range from 1.695 × 10⁻⁹ IU to 6.45 × 10⁻⁷ IU (inset in Fig. 4B). The correlation coefficient R2 of the linear standard curve is 0.9869. The lowest detection limit was calculated to be 6.44 × 10⁻¹⁰ IU at 3 times of signal-to-noise ratio, which was equivalent to the amounts extracted from 20 HeLa cells.252.6. ELISA-based colorimetric assay
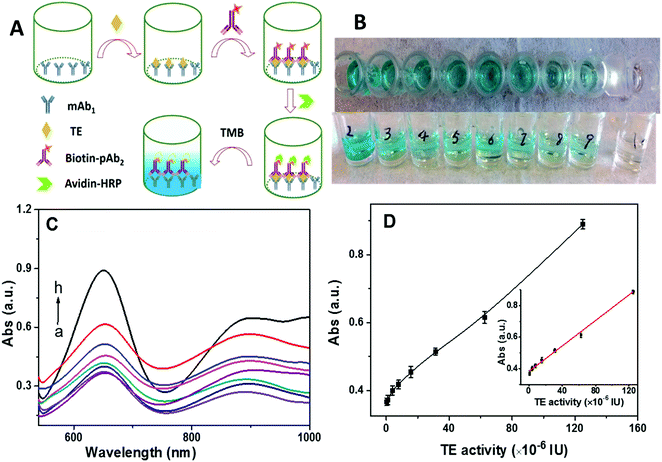
ELISA-based colorimetric assay has drawn significant attention due to its simplicity and rapid readout.50 However, its limit of detection is in the nanomolar range. For comparison with our approach, we tested a commercial ELISA kit (Fig. 5A) with telomerase monoclonal antibody (mAb1) immobilized at the bottom of a sampling well. Once telomerase was captured by the mAb1, the addition of biotin-labeled polyclonal telomerase antibody (pAb2) could form sandwiched immuno-conjugates. Then, avidin-labeled horseradish peroxidase (HRP) was linked to the sandwiched immuno-conjugates via specific biotin-avidin conjugation. Tetramethylbenzidine (TMB) was employed as the catalytic substrate for HRP. As summarized in Fig. 5B–D, the color of the solution gradually changed from colorless to dark blue with the increase in the telomerase activity (Fig. 5B), correlating to the absorbance measurements (Fig. 5C). A good linear relationship between the absorption intensity at 650 nm and telomerase activity over the range from 9.7 × 10⁻⁷ IU to 1.25 × 10⁻⁴ IU was identified with a detection limit of 2.43 × 10⁻⁷ IU, which was 2 orders of magnitude worse than that of our SERS technique. Moreover, the ELISA method was further used to detect heat-inactivated telomerase (pre-heated at 90 °C for 15 min). As shown in Fig. S2 (ESI†), results similar to those obtained from the active telomerase were obtained, suggesting that the ELISA-based colorimetric assay lacked the specificity to distinguish whether telomerase was active or not.2.7. Screening for anti-telomerase drug
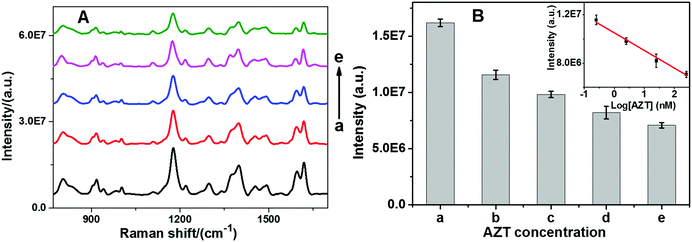
Since telomerase has been found to be up-regulated in 80–90% of cancers and is directly linked to uncontrolled cell proliferation, it has become a potential target in several anticancer agent studies.51 One of the general strategies of telomerase targeting directly depends on inhibiting its activity.52 Zidovudine (3′-azido-3′-deoxythymidine, AZT) is a drug that is currently used to treat acquired immunodeficiency syndrome (AIDS).53 However, now several research groups have validated that AZT has multiple other pharmacological functions such as inhibition of integrase, human telomerase, and thymidine kinase.54,55 Therefore, AZT is selected as a model to demonstrate the potential application of our sensor for anti-telomerase drug development. In a series of experiments, telomerase activity was assessed by mixing various amounts of AZT with telomerase before measurement using the proposed sensor. As shown in Fig. 6, SERS intensity decreased with respect to AZT concentration at as low as 0.25 nM, indicating that AZT can effectively block telomerase function. Moreover, a good linear relationship between the SERS intensity and the logarithm of the AZT concentration over the range from 0.25 nM to 250 nM can be observed. The correlation coefficient R2 was calculated to be 0.9912. It is suggested that the inhibitory interaction between AZT and telomerase may be assigned to the first-order reaction kinetic mode, which causes a nonlinear curve between the SERS intensity and the AZT concentration.3. Conclusion
In summary, we demonstrated novel three-dimensional hybrid nanoarchitectures of catalytically assembled tandem G4 topological nanostructures on NPGA for monitoring the telomerase activity. The assembled tandem G4 effectively captures MG reporter molecules onto the NPGA surface for SERS detection. This protocol is simple and avoids complicated labeling processes and harsh conditions. XPS was utilized to confirm the telomerase activity on the NPGA surface and calculate the number of telomeric repeats. The total telomerase elongation time was 15 min, much shorter than that reported in previous studies. Compared to the commercial ELISA colorimetric assay, our SERS sensor is 2 orders of magnitude more sensitive and specific to differentiate active telomerase from inactive telomerase. The sensor also has a linear range across 3 orders of magnitude. In addition, the SERS sensor was demonstrated to have a potential application in the quantification of the efficacy of an anti-telomerase drug. The unique catalytic assembly of the DNA topological nanostructures on the plasmonic nanostructures to form hybrid nanoarchitectures represents a novel label-free enzyme activity SERS sensor. Overall, this study establishes a novel paradigm of collaborative plasmonic intensification and catalytic multiplication (c-PI/CM).Acknowledgements
W. C. S. acknowledges the National Science Foundation (NSF) CAREER Award CBET-1151154 and NSF CBET-1605683. S. Q. acknowledges the National Natural Science Foundation of China (NSFC-21605063).References
- L. Hou, B. T. Joyce, T. Gao, L. Liu, Y. Zheng, F. J. Penedo, S. Liu, W. Zhang, R. Bergan, Q. Dai, P. Vokonas, M. Hoxha, J. Schwartz and A. Baccarelli, EBioMedicine, 2015, 2, 591–596 CrossRef PubMed.
- L. Y. Chen, S. Redon and J. Lingner, Nature, 2012, 488, 540–544 CrossRef CAS PubMed.
- E. Lazzerini-Denchi and A. Sfeir, Nat. Rev. Mol. Cell Biol., 2016, 17, 364–378 CrossRef CAS PubMed.
- S. Borah, L. Xi, A. J. Zaug, N. M. Powell, G. M. Dancik, S. B. Cohen, J. C. Costello, D. Theodorescu and T. R. Cech, Science, 2015, 347, 1006–1010 CrossRef CAS PubMed.
- D. Hockemeyer and K. Collins, Nat. Struct. Mol. Biol., 2015, 22, 848–852 CAS.
- E. Sahin and R. A. DePinho, Nat. Rev. Mol. Cell Biol., 2012, 13, 397–404 CrossRef CAS PubMed.
- A. G. Bodnar, M. Ouellette, M. Frolkis, S. E. Holt, C. P. Chiu, G. B. Morin, C. B. Harley, J. W. Shay, S. Lichtsteiner and W. E. Wright, Science, 1998, 279, 349–352 CrossRef CAS PubMed.
- Z. Xie, K. A. Jay, D. L. Smith, Y. Zhang, Z. Liu, J. Zheng, R. Tian, H. Li and E. H. Blackburn, Cell, 2015, 160, 928–939 CrossRef CAS PubMed.
- O. M. Wolkowitz, S. H. Mellon, D. Lindqvist, E. S. Epel, E. H. Blackburn, J. Lin, V. I. Reus, H. Burke, R. Rosser, L. Mahan, S. Mackin, T. Yang, M. Weiner and S. Mueller, Psychiatry Res., 2015, 232, 58–64 CrossRef PubMed.
- T. Fernandez-Marcelo, A. Gomez, I. Pascua, C. de Juan, J. Head, F. Hernando, J. R. Jarabo, J. Calatayud, A. J. Torres-Garcia and P. Iniesta, J. Exp. Clin. Cancer Res., 2015, 34, 78 CrossRef PubMed.
- E. H. Blackburn, Mol. Cancer Res., 2005, 3, 477–482 CrossRef CAS PubMed.
- J. Jiang, E. J. Miracco, K. Hong, B. Eckert, H. Chan, D. D. Cash, B. Min, Z. H. Zhou, K. Collins and J. Feigon, Nature, 2013, 496, 187–192 CrossRef CAS PubMed.
- A. N. Bhatt, R. Mathur, A. Farooque, A. Verma and B. S. Dwarakanath, Indian J. Med. Res., 2010, 132, 129–149 CAS.
- V. Sekaran, J. Soares and M. B. Jarstfer, J. Med. Chem., 2014, 57, 521–538 CrossRef CAS PubMed.
- T. Liu, X. Liang, B. Li, M. Bjorkholm, J. Jia and D. Xu, Br. J. Cancer, 2013, 108, 2272–2280 CrossRef CAS PubMed.
- S. B. Cohen and R. R. Reddel, Nat. Methods, 2008, 5, 355–360 CrossRef CAS PubMed.
- A. T. Ludlow, J. D. Robin, M. Sayed, C. M. Litterst, D. N. Shelton, J. W. Shay and W. E. Wright, Nucleic Acids Res., 2014, 42, e104 CrossRef CAS PubMed.
- W. Wang, S. Huang, J. Li, K. Rui, J. R. Zhang and J. J. Zhu, Sci. Rep., 2016, 6, 23504 CrossRef CAS PubMed.
- H. Wang, H. Wang, C. Liu, X. Duan and Z. Li, Chem. Sci., 2016, 7, 4945–4950 RSC.
- W. N. Keith and A. J. Monaghan, Methods Mol. Med., 2004, 97, 311–322 CAS.
- N. Zendehrokh and A. Dejmek, Mod. Pathol., 2005, 18, 189–196 CrossRef CAS PubMed.
- H. Wang, M. J. Donovan, L. Meng, Z. Zhao, Y. Kim, M. Ye and W. Tan, Chemistry, 2013, 19, 4633–4639 CrossRef CAS PubMed.
- X. Lou, Y. Zhuang, X. Zuo, Y. Jia, Y. Hong, X. Min, Z. Zhang, X. Xu, N. Liu, F. Xia and B. Z. Tang, Anal. Chem., 2015, 87, 6822–6827 CrossRef CAS PubMed.
- R. Qian, L. Ding, L. Yan, M. Lin and H. Ju, J. Am. Chem. Soc., 2014, 136, 8205–8208 CrossRef CAS PubMed.
- R. Qian, L. Ding and H. Ju, J. Am. Chem. Soc., 2013, 135, 13282–13285 CrossRef CAS PubMed.
- R. Qian, L. Ding, L. Yan, M. Lin and H. Ju, Anal. Chem., 2014, 86, 8642–8648 CrossRef CAS PubMed.
- W. J. Wang, J. J. Li, K. Rui, P. P. Gai, J. R. Zhang and J. J. Zhu, Anal. Chem., 2015, 87, 3019–3026 CrossRef CAS PubMed.
- X. Zhu, H. Xu, R. Lin, G. Yang, Z. Lin and G. Chen, Chem. Commun., 2014, 50, 7897–7899 RSC.
- L. Cunci, M. M. Vargas, R. Cunci, R. Gomez-Moreno, I. Perez, A. Baerga-Ortiz, C. I. Gonzalez and C. R. Cabrera, RSC Adv., 2014, 4, 52357–52365 RSC.
- Z. Yi, H. B. Wang, K. Chen, Q. Gao, H. Tang, R. Q. Yu and X. Chu, Biosens. Bioelectron., 2014, 53, 310–315 CrossRef CAS PubMed.
- L. Wu, J. Wang, L. Feng, J. Ren, W. Wei and X. Qu, Adv. Mater., 2012, 24, 2447–2452 CrossRef CAS PubMed.
- H. R. Zhang, Y. Z. Wang, M. S. Wu, Q. M. Feng, H. W. Shi, H. Y. Chen and J. J. Xu, Chem. Commun., 2014, 50, 12575–12577 RSC.
- S. Zong, Z. Wang, H. Chen and Y. Cui, Small, 2013, 9, 4215–4220 CrossRef CAS PubMed.
- C. Maesawa, T. Inaba, H. Sato, S. Iijima, K. Ishida, M. Terashima, R. Sato, M. Suzuki, A. Yashima, S. Ogasawara, H. Oikawa, N. Sato, K. Saito and T. Masuda, Nucleic Acids Res., 2003, 31, E4 CrossRef PubMed.
- X. Lang, L. Qian, P. Guan, J. Zi and M. Chen, Appl. Phys. Lett., 2011, 98, 093701 CrossRef.
- E. Seker, M. L. Reed and M. R. Begley, Materials, 2009, 2, 2188–2215 CrossRef CAS.
- J. Qi, J. Zeng, F. Zhao, S. H. Lin, B. Raja, U. Strych, R. C. Willson and W. C. Shih, Nanoscale, 2014, 6, 8521–8526 RSC.
- G. M. Santos, F. Zhao, J. Zeng, M. Li and W. C. Shih, J. Biophotonics, 2015, 8, 855–863 CrossRef CAS PubMed.
- W. C. Shih, G. M. Santos, F. Zhao, O. Zenasni and M. M. Arnob, Nano Lett., 2016, 16, 4641–4647 CrossRef CAS PubMed.
- X. Wang, X. Liu, X. Yan, P. Zhao, Y. Ding and P. Xu, PLoS One, 2011, 6, e24207 CAS.
- A. L. Moye, K. C. Porter, S. B. Cohen, T. Phan, K. G. Zyner, N. Sasaki, G. O. Lovrecz, J. L. Beck and T. M. Bryan, Nat. Commun., 2015, 6, 7643 CrossRef PubMed.
- S. Qiu, F. Zhao, O. Zenasni, J. Li and W. C. Shih, ACS Appl. Mater. Interfaces, 2016, 8, 29968–29976 CAS.
- A. C. Bhasikuttan, J. Mohanty and H. Pal, Angew. Chem., Int. Ed., 2007, 46, 9305–9307 CrossRef CAS PubMed.
- G. Ghale, V. Ramalingam, A. R. Urbach and W. M. Nau, J. Am. Chem. Soc., 2011, 133, 7528–7535 CrossRef CAS PubMed.
- F. Zhao, J. Zeng, M. M. Parvez Arnob, P. Sun, J. Qi, P. Motwani, M. Gheewala, C. H. Li, A. Paterson, U. Strych, B. Raja, R. C. Willson, J. C. Wolfe, T. R. Lee and W. C. Shih, Nanoscale, 2014, 6, 8199–8207 RSC.
- S. Narendran, Q. Ji, D. Y. Eric, J. L. Alexander, C. L. Dina, E. P. Raphael, V. L. Kirill and S. Wei-Chuan, Laser Phys. Lett., 2014, 11, 105602 CrossRef.
- J. Qi, K. L. Bechtel and W.-C. Shih, Biomed. Spectrosc. Imaging, 2014, 3, 359–368 CAS.
- Y. Zhang, W. Yu, L. Pei, K. Lai, B. A. Rasco and Y. Huang, Food Chem., 2015, 169, 80–84 CrossRef CAS PubMed.
- S. Zong, Z. Wang, H. Chen, G. Hu, M. Liu, P. Chen and Y. Cui, Nanoscale, 2014, 6, 1808–1816 RSC.
- W. Lai, D. Tang, J. Zhuang, G. Chen and H. Yang, Anal. Chem., 2014, 86, 5061–5068 CrossRef CAS PubMed.
- Y. Maida and K. Masutomi, Cancer Sci., 2015, 106, 1486–1492 CrossRef CAS PubMed.
- M. Cully, Nat. Rev. Drug Discovery, 2015, 14, 741 CrossRef CAS PubMed.
- J. L. Fang and F. A. Beland, Toxicol. Sci., 2009, 111, 120–130 CrossRef CAS PubMed.
- Y. Mo, Y. Gan, S. Song, J. Johnston, X. Xiao, M. G. Wientjes and J. L. Au, Cancer Res., 2003, 63, 579–585 CAS.
- A. Falchetti, A. Franchi, C. Bordi, C. Mavilia, L. Masi, F. Cioppi, R. Recenti, L. Picariello, F. Marini, F. Del Monte, V. Ghinoi, V. Martineti, A. Tanini and M. L. Brandi, J. Bone Miner. Res., 2005, 20, 410–418 CrossRef CAS PubMed.
Footnote |
| † Electronic supplementary information (ESI) available: Experimental section and several supporting figures. See DOI: 10.1039/c7nh00042a |
| This journal is © The Royal Society of Chemistry 2017 |

