Engineering dendrimers to produce dendrimer dipole excitation based terahertz radiation sources suitable for spectrometry, molecular and biomedical imaging
Anis
Rahman
*a,
A. K.
Rahman
a and
Donald A.
Tomalia
 *b
*b
aApplied Research and Photonics, Harrisburg, PA 17111, USA
bNanoSynthons LLC, National Dendrimer & Nanotechnology Center, Mt. Pleasant, MI 48858, USA. E-mail: donald.tomalia@gmail.com
First published on 20th March 2017
Abstract
Two critical nanoscale design parameters (CNDPs); namely, surface chemistry and interior compositions of poly(amidoamine) (PAMAM) dendrimers were systematically engineered to produce unique hyperpolarizable, electro-optical substrates. These electro-optically active dendritic films were demonstrated to produce high quality, continuous wave terahertz radiation when exposed to a suitable pump laser that could be used for spectrometry and molecular imaging. These dendrimer based dipole excitation (DDE) terahertz sources were used to construct a working spectrometer suitable for many practical applications including THz imaging and analysis of encapsulated hydrogen species in fullerenes.
Introduction
This article reviews the systematic engineering of critical nanoscale design parameters (CNDPs) manifested by certain nanoscale, quantized building blocks (QBBs) (i.e., G = 5; amine terminated PAMAM dendrimers) which served as a strategy for synthesizing new dendrimer based, high electro-optic coefficient films. These hyperpolarizable substrates produced high quality continuous wave (CW) terahertz radiation upon exposure to a suitable pump laser. At least two dendrimer CNDPs, namely, surface chemistry and interior compositions were modified to produce these dendritic, electro-optical substrates. More specifically, PAMAM dendrimer surface chemistry was first modified by using an organo-silicone reagent (i.e., 3-acryloxypropyl trimethylsilane) to yield required film forming features for these dendritic substrates. Secondly, the interior compositions of these dendrimer based films were then engineered by doping with 1,2-dihydroxyanthraquinone (i.e., an alizarin dye exhibiting nonlinear, infrared absorbing chromophores) to produce critical hyperpolarizable substrates possessing unique high dipole populations. These alizarin doped films were poled to align dipoles and break centro-symmetry; thus, producing high electro-optic coefficient substrates. These dendritic films were then exposed to an appropriate pump laser to generate continuous wave (CW) terahertz (THz) radiation (i.e., 0.1 THz to ∼30 THz) via a dendrimer dipole excitation (DDE) mechanism.1 This THz radiation was of suitable quality for constructing THz time domain spectrometers2,3 which have been used successfully for molecular characterization,4 early skin cancer 3-D imaging/detection,5 as well as sub-nanoscale 2-D imaging1 and 3-D nanoscale imaging of TiO2 films.6Quantized building blocks (i.e., hard/soft superatoms) and their critical hierarchical design parameters (CHDPs)
Over the past decade there has emerged a mutual consensus, shared by both physicists and chemists,7–11 that certain ordered complexity occurring between sub-atomic and macroscale dimensions may be defined by a systematic, stair-step hierarchy of quantized building blocks (QBBs) as illustrated in Fig. 1.11 These dimensionally defined QBBs exist at each hierarchical level and exhibit discrete periodic behaviour either independently or when connected by chemical or supramolecular binding. Often this QBB combinatorial behaviour is observed as a function of unique “stoichiometries” and may be manifested as periodic patterns or “magic numbers”. These specific QBB relationships appear to be determined by certain spatial, physico-chemical and thermodynamic relationships driven by six critical hierarchical design parameters (CHDPs), namely: (1) size, (2) shape, (3) surface chemistry, (4) flexibility/rigidity, (5) architecture and (6) elemental composition.Specific examples of these QBBs may be recognized at the atomic, molecular and nanoscale levels and are distinguished by their respective six-critical hierarchical design parameters (CHDPs) (Fig. 1). These QBBs may be observed as entities occupying 0-D, 1-D, 2-D or 3-D space at their respective dimensional levels and usually manifest discrete stoichiometric chemical or supramolecular bonding properties determined by these CHDPs.
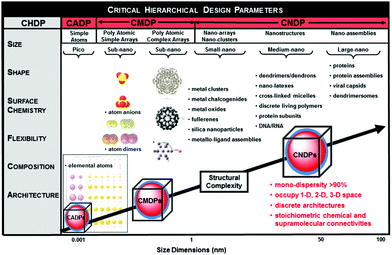 | ||
| Fig. 1 Dimensional sequence of quantized hierarchical building blocks (QHBBs) as a function of structural complexity (i.e., dimensions, nm). These QHBBs are structure controlled at each level of complexity (i.e., atomic, CADP; molecular, CMDP or nanoscale, CNDP), respectively, as a function of size, shape, surface chemistry, rigidity/flexibility, architecture and elemental composition. (Reprinted with permission from ref. 12 Copyright 2014 John Wiley & Sons.) | ||
The fundamental importance of these CHDPs at the atomic level may be recognized by the systematic ordering of the elements into vertical and horizontal patterns in the Mendeleev Periodic Table according to six critical atomic design parameters (CADPs) as shown in Fig. 2.9 As such, CADPs determine many familiar intrinsic periodic property patterns exhibited by all atomic elements. Intrinsic soft and hard elemental features exhibited by specific elemental compositions (i.e., carbon, nitrogen, etc. versus metals) have led to the widely recognized classifications within traditional chemistry; namely, the organic (i.e., soft) and inorganic (i.e., hard) sub-disciplines.
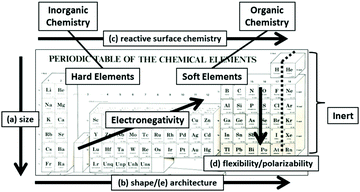 | ||
| Fig. 2 Mendeleev periodic table illustrating systematic vertical and horizontal correlations of critical atomic design parameters (CADPs) which include controlled atomic (a) sizes, (b) shapes, (c) surface chemistry, (d) flexibility/polarizability, (e) architecture, and (f) elemental composition. (Reprinted with permission from ref. 13 Copyright 2012 The Royal Society of Chemistry.) | ||
Beginning with J. Dalton's early atomic/molecular perspectives in 1808, traditional chemistry has emerged and grown around a scientifically robust central paradigm to its current state over a period of nearly 210 years.14–16 That withstanding, it is now recognized that discrete, well-defined collections of traditional atoms (i.e., QBBs > 103 larger than atoms) exist at the nanoscale level. In some instances, these QBBs have been referred to as artificial atoms. Quite remarkably, these nanoscale atom assemblies are observed to manifest many atom-like features (i.e., dendrimers) (Fig. 3), as well as predictable nanoperiodic property patterns reminiscent of traditional picoscale elemental atoms. More recently, these atom-like features have been widely recognized within parallel nanoscale “atom mimicry” perspectives reported independently by both physicists17 and chemists.8 Just as traditional atomic level elements exhibit predictable periodic property patterns directed by their six-CADPs, it appears this discrete atomic level CADP information is conserved, transferred and manifested at the next hierarchical level by analogous, 103 larger discrete nanoscale objects. These 103 larger discrete nanoscale objects are referred to as Hard and Soft (H/S) superatoms.11,18
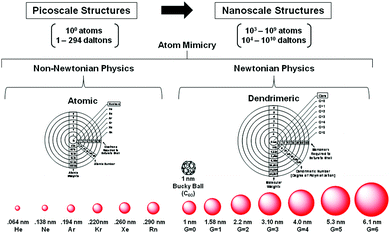 | ||
| Fig. 3 Comparison of dimensions and physics principles required to define picoscale atom versus nanoscale dendrimer structures. Heuristic atom mimicry similarities noted for atom electron aufbau and dendrimer monomer aufbau stages, respectively. A systematic and periodic continuum of saturated spheroidal shell dimensions representing rare gas configurations associated with quantized picoscale and nanoscale structures, respectively. (Reprinted with permission of ref. 9 Copyright 2010 The Royal Society of Chemistry.) | ||
Like traditional elemental atoms, these H/S superatoms exhibit discrete stoichiometric chemical and supramolecular relationships. These relationships depend largely upon their well-defined sizes, shapes, flexibility/rigidity and surface chemistries. Experimental examples of these unique nanoscale, heuristic atom-like relationships are pervasive in the literature. They are routinely documented as well-defined stoichiometric, superatom based nano-compounds, supramolecular nano-assemblies or superatom lattices.11
A critical difference between traditional picoscale atoms and nanoscale H/S superatoms is that elemental CADPs consist of robustly fixed parameters defined by the electrostatic relationships between various atomic nuclei and their respective orbital electrons. As such, optimization of traditional atom/molecular compound properties for a targeted application has routinely involved the systematic combination/permutation of various intrinsically fixed atomic level CADPs (i.e., linear combination of atomic orbitals (LCAO)). This has provided a systematic strategy for creating extensive CMDP engineered libraries of molecular structure. As described by P. W. Anderson,19 simply combining elemental QBBs produces new emerging molecular properties which are “not only more than the sum of the QBB combination, but different than” as a consequence of symmetry breaking.
Unlike CADPs associated with traditional atoms, analogous CNDPs associated with nanoscale, H/S superatoms may be systematically engineered to produce many new emerging properties for specifically modified nanoscale QBBs. These modifications in turn may be used to influence the stoichiometric nanocompounds and assemblies resulting from these QBB combinations. As such, the CNDPs of H/S superatoms have been routinely engineered to yield a wide variety of new emerging superatom properties.11–13,18 In many cases, these CNDP modifications have not only produced unique new superatom properties, but also interesting nanoperiodic property patterns. For example, simply increasing the CNDP (i.e., dendrimer size) as a function of generation has been shown to systematically alter intrinsic dendrimer properties such as density, intrinsic viscosity and refractive indices to produce unique nanoperiodic property patterns as illustrated in Fig. 4.20,21 This provides an important strategy for obtaining new emerging properties for specific dendrimers, as well as creating predictable nanoperiodic property patterns referred to as dendritic effects. This topic is reviewed extensively elsewhere.13
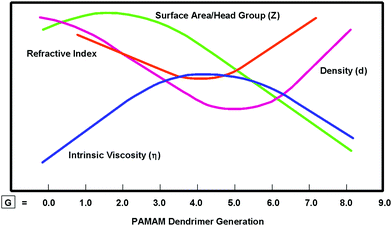 | ||
| Fig. 4 Comparison of intrinsic dendrimer properties such as viscosity (η), density (d), refractive index and surface area/head group (Z) and as a function of generations: G = 1–9.20 (Reprinted with permission from ref. 21 Copyright 2001 Wiley VCH Verlag GmbH & Co. KGaA.) | ||
Engineering a specific dendrimer CNDP such as surface chemistry may dramatically alter solubility, thermal stability, reactivity or film forming properties. On the other hand, compositional modification of dendrimer interiors by doping with certain “site isolated” chromophores has been shown to endow these soft superatoms with dramatic new non-linear, optical electronic properties.22 These new emerging opto-electronic properties, obtained by engineering certain dendrimer CNDPs will be described later as soft superatomic dendrimers are shown to be useful for generating important high quality THz radiation.
In summary, these hierarchical, QBB and CHDP principles appear to be applicable to all discrete, well-defined matter from the sub-atomic to the micron level and perhaps beyond as described in Fig. 5 and reviewed extensively elsewhere.11,18
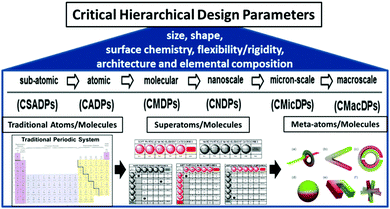 | ||
| Fig. 5 Critical hierarchical design parameters (CHDPs) for quantized building blocks (QBBs) as a function of dimensions: sub-atomic (CSAPD) → atomic (CADP) → molecular (CMDP) → nanoscale (CNDP) → micron-scale (CMicDP) → macroscale (CMacDP). (Reprinted with permission from ref. 11 Copyright 2016 American Chemical Society.) | ||
Terahertz radiation – one of the last electromagnetic radiation frontiers
Recognized electromagnetic radiation (EMR) categories range from very high energy, short wavelength forms (i.e., gamma, X-ray) to low energy, long wave length forms (i.e., micro-, radio wave) as described in Fig. 6. Each EMR category exhibits unique interactions with hierarchical matter as a function of their wavelength, as well as the specific building block dimensions.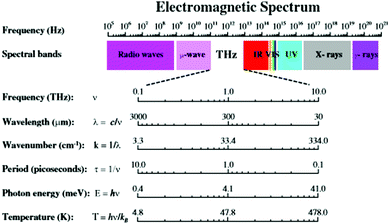 | ||
| Fig. 6 Terahertz radiation band of the electromagnetic spectrum. (Reprinted with permission from ref. 23 Copyright 2011 Springer.) | ||
High energy, short wave length radiation (i.e., gamma/X-ray; ∼0.0001 nm) exhibits deep penetration, high energy interactions with all matter and may lead to extensive ionization, chemical bond cleavage and structural damage at the molecular level. This ionizing-radiation is considered both damaging and dangerous to biomolecules/biological systems. It is inextricably associated with genetic mutations and cancer in living organisms. At the opposite end of the EMR spectrum, low energy/large wavelength radiation (i.e., radio/microwave radiation; ∼1 × 10⁷–1011 nm) interacts with matter largely as a bulk collection of charges spread over a large number of atoms (i.e., micron/macroscale dimensions). Induced movement of these charges may result in either absorption or reflection of this radiation. Recognized examples include absorption or emission of radio waves by macroscale antennas or absorption of microwaves by molecular structures with defined electric dipole moments (i.e., water). These EMR interactions produce electric currents, heat or both.
In the EMR spectrum, widely recognized infrared radiation (i.e., 1 × 10³–105 nm) resides just below lower energy, higher wave length radio and microwave radiation. Infrared radiation commonly interacts with dipoles present in functional groups and individual molecular structures. These interactions arise as a function of specific atomic vibrations occurring within individual chemical bonds. This radiation is consequently absorbed by a wide range of molecular structures, leading to temperature enhancements; wherein, these vibrations are dissipated as heat.
Between the infrared and microwave EMR regions (i.e., 10 μm–1 mm) there resides a lesser known EMR category referred to as terahertz radiation (i.e., T-rays) (Fig. 6). As such, THz radiation shares some properties with each neighbour. Like infrared and microwave, THz radiation is low enough energy to be non-ionizing. Much as microwave radiation, THz radiation can penetrate a wide variety of non-metallic materials such as clothing, paper, wood, masonry, plastics, semiconductors, ceramics and body tissue. The use of THz for biological applications has been extensively reviewed elsewhere.23 For many years, THz technology was hampered by the lack of suitable radiation sources, as well as the complexity of associated imaging/detection protocols.24
This article now focuses on recent efforts to successfully engineer CNDPs of PAMAM dendrimers (i.e., soft superatoms) as a simple strategy for producing critical hyper polarizable, dendrimer film/substrates suitable for generating high quality THz radiation.
Applying CNDP engineering principles to dendrimer-based non-linear optical substrates for generating terahertz radiation
Pioneering work by Rahman,4 Dalton et al.,22 and others13,25 has shown that modification of functionality and architecture of certain dendritic, soft superatoms (i.e., dendrimers) has produced a wide range of unprecedented and enhanced non-linear optical (NLO) properties. These new emerging NLO properties directed by CNDP engineering have been reviewed extensively elsewhere.22,25–30 This earlier dendritic NLO effort provided the groundwork and basis for more recent work by Rahman, Tomalia, et al.2–4 whom have applied these principles to traditional dendritic architectures such as PAMAM dendrimers. It was found that merely engineering three of the six CNDPs described in Fig. 7, provided new emerging hyper-polarizable dendrimer properties. It was demonstrated, that doping ordinary PAMAM dendrimers with certain NLO dyes created “site isolated interior chromophores” within the dendrimer interiors. Subsequent dielectric poling of these modified dendrimers produced hyperpolarizable substrates exhibiting, high electro-optical (EO) coefficients ranging from ∼130 pm V−1 at 633 nm to ∼90 pm V−1 at 1533 nm.4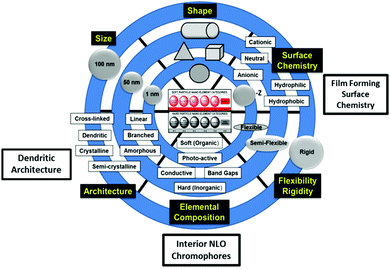 | ||
| Fig. 7 Six-critical nanoscale design parameters (CNDPs) that may be systematically engineered to produce new emerging properties and predictable nanoperiodic property patterns.12 | ||
More specifically, engineering three CNDPs (i.e., size, surface chemistry and interior composition) of ordinary G = 5; amine terminated PAMAM dendrimers has produced critical “site-isolated” interior chromophore doped, surface modified (i.e., 3-acryloxypropyl trimethoxysilane) PAMAM dendrimers suitable for the generation of high power CW THz radiation (i.e., 10 μm–1 mm).
Although a reliable source of sub-picosecond THz pulses or T-rays was demonstrated as early as the 1980s, it was not until 1995 that THz was shown to be useful for imaging. Currently, a wide range of medical, military and security applications are under development.23 A complete THz apparatus required for spectroscopy, tomography and imaging applications generally consists of at least three operational parts; namely: (1) a THz radiation source, (2) optical components to manipulate the radiation and (3) a THz detector to sense the radiation.
Presently, at least four general categories of THz sources are recognized. They include: (1) thermal, (2) vacuum electronic, (3) solid-state electronic, (4) laser induced type sources and are extensively reviewed elsewhere.31 The final focus of this article will describe the development of a dendrimer-based, laser induced THz source which produces high power CW THz radiation by an unprecedented dendrimer dipole excitation (DDE) mechanism.3
Design and implementation of a dendrimer dipole excitation based terahertz spectrometer with a practical application example
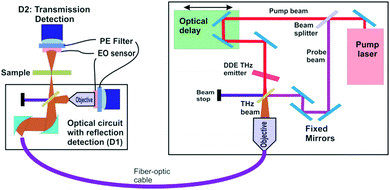
As described elsewhere, the present DDE3 based THz sources offer unique and unprecedented advantages over most THz sources. It is significant that this new THz source is suitable for a wide range of practical applications due to its simplicity, higher power radiation output as well as its CW and pulsed mode capabilities. In the following section, we describe the use of these sources in the construction of a THz “time domain spectrometer” and include a specific application examples. The basic operational parameters of a THz time-domain spectrometer are outlined in Fig. 8. This figure illustrates a functional diagram for an integrated THz time-domain spectrometer, nanoscanner and 3D imager (ITDSI) (all instruments are available from Applied Research & Photonics (ARP), Harrisburg, PA, USA); wherein, a DDE based THz source is used for THz generation. From the pump–probe measurements,4 it was found that the spectrometer built around the DDE source in the CW mode exhibits a frequency range from 0.1 THz to ∼30 THz. A compact layout is achieved by arranging the components in the manner shown in Fig. 8. An interferogram is generated when the stationary beam (pump beam) is scanned by the THz beam (probe beam) whose intensity distribution is captured by the detector pair for both the reflected and the transmitted intensities.When the THz field interacts with molecules of a sample, it may stimulate many resonance modes such as molecular vibrations, rotation, translation, torsion, and/or other resonances in the system (i.e., “molecular events”). These THz-molecular interactions can lead to THz-photon perturbations by producing characteristic absorptions determined by a specific interaction or event. The change in energy and/or frequency yields important information about the molecular nature of the interaction. Classical Infrared and Raman spectroscopy yields similar information, however, these spectroscopy modes are unable to detect many subtle, low energy resonances that are only sensitive to a THz field. This occurs because THz photons are very sensitive to specific motions of the entire molecule as opposed to just a bond or charge state. Molecular simulation reveals that many resonance states exist when a molecule faces ambient perturbation. Since most materials remain at their lowest energy state under normal/steady state conditions, THz spectroscopy is able to probe and sample corresponding states via their absorbance spectrum.
Results and discussion: encaged hydrogen species in fullerene
Herein, we now describe the use of terahertz spectroscopy to detect and characterize certain hydrogen species encaged in a fullerene, C60; the so called rotor in a cage or endohedral molecules. Two cases are compared with respect to pure C60; namely, hydrogen encaged in C60 (H2@C60) and deuterium encaged in C60 (D2@C60). Historically, it was predicted by Turro et al.,32 that it should be possible with fullerene models to control the spin selectivity of the catalyzed conversion of the para species, p-H2@C60, into the ortho species, o-H2@C60, so that a strong nuclear spin polarization may be produced. However, if such a spin selective H2@C60 phenomena is produced, it would be difficult if not impossible for standard IR spectroscopy to distinguish/identify either the ortho or para states. Quite remarkably, the presence of distinguishable absorbance peaks were indeed identified by THz spectroscopy; thus, suggesting that this methodology could have the required sensitivity for detecting the spin isomers of H2 inside C60. The same is true for D2@C60; however, a shift in peak position is expected compared with the H2@C60 case. Furthermore, the presence of additional peaks, if any, would indicate that the THz methodology could detect subtle molecular dynamic modes not visible with standard IR, thus yielding unique insights into unprecedented guest/host interactions.Time domain temporal signals (i.e., interferogram) for each of the three fullerene samples are shown in Fig. 9. The H2@C60 signal shows a slightly lower peak height as well as a shifted peak position compared to pure C60. Similarly, D2@C60 shows a somewhat lower peak height and a shifted peak position compared to both C60 and H2@C60. The Fourier transform absorbance spectra of the three fullerene models (i.e., Fig. 10), obtained from their respective temporal signals, show distinctively different peaks compared to one another. Tables 1 and 2 summarize the absorbance peaks for both C60 and H2@C60 extracted from their spectra and also those obtained from IR spectra.33,34 As seen from Table 1, there are several absorbance peaks present in the THz spectra that were not detected by the IR spectra. This is indicative of the sensitivity that is probed by THz interaction with the entire molecule. Therefore, the molecular conformation change as a function of time-dependent stimulus (i.e., femto- to pico-second) as determined by the absorbance, is directly probed and recorded by the THz detection system. While some far lying states (e.g., 4250 cm−1) were observed by low-temperature (6 K) IR spectroscopy and explained by translational and rotational motions of H2 inside C60 cage,35 those studies were also limited to the detection of only a low number of states. The observation of multiple states in the low frequency region indicates that the vibrational and rotational states of these molecules can be effectively probed by THz. Similarly, the spectra of D2@C60 show systematic shifts in the absorbance peaks compared to both C60 alone and H2@C60. So an obvious question is, “are the additional states observed Fig. 10 (or, Table 1) real?” Menendez and Page37 have illustrated various vibrational state assignment of C60 from theoretical calculations. The authors have pointed out a number of vibrational states present in C60 along with their multiplicities.36Table 2 summarizes the predicted states of C60 (col. 2) and also the measured states of the present study (col. 1).
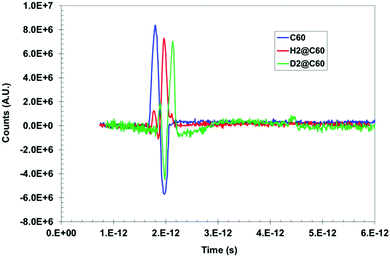 | ||
| Fig. 9 Time domain signal of C60 and H2@C60 and D2@C60 exhibit clear difference between the three species. | ||
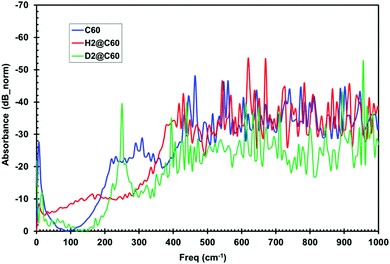 | ||
| Fig. 10 Fourier transform absorbance spectra of C60, H2@C60 and D2@C60 show distinct absorbance characteristics. | ||
| C60: THz: ref. 4 | C60: ref. 36 | H2@C60: THz: ref. 4 | H2@C60: ref. 36 |
|---|---|---|---|
| 6.44, 219, 232, 258, 271, 290 | — | 6.32, 164, 183 | — |
| 309, 328, 341, 361, 393 | — | 335, 379 | — |
| 406, 432, 444, 464, 490 | — | 404, 417, 430, 449, 468 | — |
| 515, 535, 543, 560, 593 | 526.6, 576.7 | 506, 543, 569, 581, 594 | 526.5, 576.7 |
| 605, 618, 644, 670 | — | 619, 638, 651, 670 | — |
| 740, 772 | — | 708, 727, 746, 784 | — |
| 857, 889 | — | 809, 834, 853, 866, 878 | — |
| 902, 947, 992 | — | 916, 935, 973, 986, 998 | — |
| 1024, 1037, 1088 | — | 1036, 1068, 1087 | — |
| 1127, 1159, 1172 | 1182.3, 1429.2 | 1131, 1144, 1169, 1182, 1194 | 1182.3, 1429.2 |
| Total: 38 | 4 | 41 | 4 |
| C60: THz: ref. 4 | C60: ref. 37 |
|---|---|
| 6.44, 219, 232, 258, 271, 290 | 272 |
| 309, 328, 341, 361, 393 | 343, 353 |
| 406, 432, 444, 464, 490 | 403, 433, 485, 496 |
| 515, 535, 543, 560, 593 | 526, 534, 553, 567, 568, 575 |
| 605, 618, 644, 670 | 668 |
| 740, 772 | 709, 736, 743, 753, 756, 764, 772, 776, 796 |
| 857, 889 | 831 |
| 902, 947, 992 | 961, 973, 984 |
| 1024, 1037, 1088 | 1079, 1099 |
| 1127, 1159, 1172 | 1182 |
| Total: 38 | 30 |
Modes whose frequencies appear in bold type (Table 2, col. 2) have been unequivocally identified from Raman, IR, neutron or fluorescence experiments.37 Moreover, each of the states enumerated in col. 2 have associated degeneracies; e.g., the state at 272 cm−1 has a degeneracy of 5, etc.36 So some of the observed states of the present work potentially could be due to the degeneracy of the states as indicated by ref. 33. Unarguably, further investigations may be warranted to establish whether the respective spectra of C60, H2@C60 and D2@C60 are indeed due to the presence of H2 and D2 in C60 or if some other artifact is responsible. That withstanding, the D2@C60 spectrum clearly demonstrates that a rational pattern for these three models exists as indicated by the observed shifts in the absorbance peaks. In summary, the main inference of this investigation is that THz spectroscopy clearly demonstrates significant and measurable differences between the three fullerene models (i.e., C60, H2@C60, and D2@C60).
Bioimaging with terahertz spectroscopy: multispectral reconstructive imaging of biological specimen and comparison of human skin in healthy versus diseased state
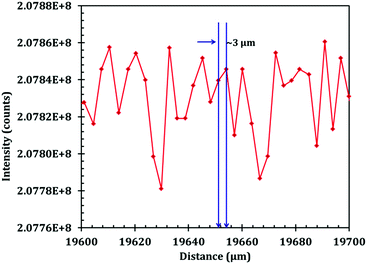
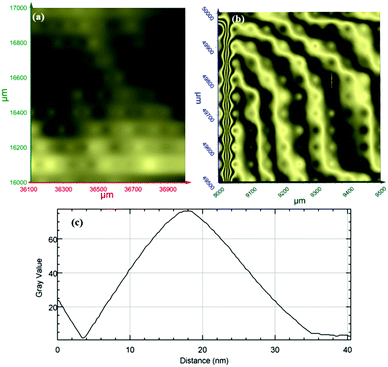
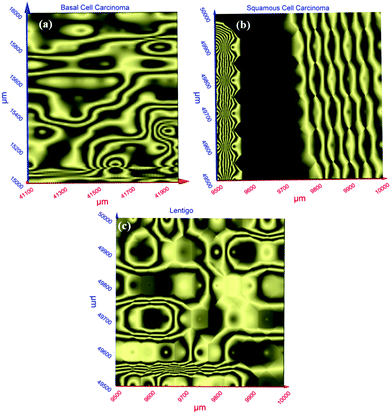
Terahertz multispectral reconstructive imaging has been described in detail elsewhere.1,3 An example of biological tissue imaging is used to further elucidate this protocol. Reconstructive imaging utilizes the technique of rasterizing a specimen over a given area. Since the T-ray beam may be focused on a given layer under the surface, ARP's THz spectrometer allows rasterizing a 3D volume on a layer by layer basis. The intensity of the reflected and/or transmitted T-ray beam is recorded, thus preserving the exact coordinates over which measurements are obtained. The intensity is then converted to an image via inverse gridding algorithm.38,39Fig. 11 shows the scanning resolution for the current was ∼3 μm. The algorithm allows accurate representation of the measured object similar to a charged couple device as has been explained previously.1,3In this case, we compare images of human skin under different diseased conditions compared to healthy skin samples. Fig. 12(a) and (b) exhibit THz reconstructive images of healthy skin samples from two different patients. In each case, regular cellular patterns are visible as expected from the healthy skin tissue.5Fig. 12(c) exhibits a graphical analysis of a single skin cell from Fig. 12(b). The estimated size of this cell is ∼30 μm, which is comparable to a normal skin cell. Fig. 13 shows images of diseased skin samples diagnosed for basal cell carcinoma, squamous cell carcinoma and lentigo maligna melanoma, respectively. As evident from Fig. 13, all diseased skin samples have lost their regular cellular patterns which are present for the healthy skin samples. This lack of systematic cellular structure may serve as a visual artifact indicating that there is something wrong with these samples. As outlined in ref. 5, either the presence or absence of regular cellular structure as observed in the THz spectral comparison, as well as characteristic layering information is expected to serve as a reliable diagnostic tool for assessing various skin cancers.
Conclusions
In summary, we have overviewed a versatile strategy for creating new emerging nanoscale properties for a soft superatom category (i.e., dendrimers) based on the engineering of certain critical nanoscale design parameters (CNDPs). Manipulation of only three dendrimer CNDPs, namely: (1) size, (2) surface chemistry and (3) interior composition led to the discovery of a new phenomenon and mechanism for generating THz radiation (i.e., dendrimer dipole excitation (DDE)). These hyperpolarizable dendritic substrates have served as DDE based laser induced sources for the generation of high power CW THz radiation. As early as 2008, these DDE based broadband THz sources were used to produce the first commercial time-domain spectrometer prototypes.A brief example describing DDE based THz spectral interrogation of two supramolecular endohedral fullerene guest–host models is presented. Probing the resonance states of these fullerene models produced rationally differentiated THz spectra that clearly demonstrate the sensitivity and uniqueness of this new emerging THz spectroscopic methodology.
The ability to interrogate and compare measurable cellular pattern differences in healthy versus diseased human skin samples, as described above, portends the important role that THz spectroscopy may be expected to play in the medical sciences.
Acknowledgements
We gratefully acknowledge Ms Linda S. Nixon for the preparation of important graphics and assembly of this manuscript.References
- A. Rahman, A. K. Rahman, T. Yamamoto and H. Kitagawa, J. Biosens. Bioelectron., 2016, 7, 1–8 Search PubMed.
- A. Rahman and A. K. Rahman, US Pat., 8050531B2, 2011 Search PubMed.
- A. Rahman, A. K. Rahman and D. A. Tomalia, J. Biosens. Bioelectron., 2016, 7, 1–6 Search PubMed.
- A. Rahman, J. Mol. Struct., 2011, 1006, 59–65 CrossRef CAS.
- A. Rahman, A. K. Rahman and B. Rao, Biosens. Bioelectron., 2016, 82, 64–70 CrossRef CAS PubMed.
- W. Ghann, A. Rahman, A. Rahman and J. Uddin, Sci. Rep., 2016, 6, 30140 CrossRef PubMed.
- J. Kemsley, Chem. Eng. News, 2013, 91, 24–25 Search PubMed.
- D. A. Tomalia, J. Nanopart. Res., 2009, 11, 1251–1310 CrossRef CAS PubMed.
- D. A. Tomalia, Soft Matter, 2010, 6, 456–474 RSC.
- D. A. Tomalia, J. B. Christensen and U. Boas, Dendrimers, Dendrons, and Dendritic Polymers: Discovery, Applications and the Future, Cambridge University Press, New York, NY, 2012 Search PubMed.
- D. A. Tomalia and S. N. Khanna, Chem. Rev., 2016, 116, 2705–2774 CrossRef CAS PubMed.
- R. M. Kannan, E. Nance, S. Kannan and D. A. Tomalia, J. Intern. Med., 2014, 276, 579–617 CrossRef CAS PubMed.
- D. A. Tomalia, New J. Chem., 2012, 36, 264–281 RSC.
- B. Pullman, The Atom in the History of Human Thought, Oxford University Press, New York, 1998 Search PubMed.
- E. R. Scerri, The Periodic Table, Oxford University Press, New York, 2007 Search PubMed.
- J. Mannart, H. Boschker, T. Kopp and R. Valenti, Rep. Prog. Phys., 2016, 79, 084508 CrossRef PubMed.
- A. W. Castleman Jr. and S. N. Khanna, J. Phys. Chem. C, 2009, 113, 2664–2675 Search PubMed.
- D. A. Tomalia and S. N. Khanna, Mod. Phys. Lett. B, 2014, 28(3), 1–48 CrossRef.
- P. W. Anderson, Science, 1972, 177, 393–396 CAS.
- D. A. Tomalia, A. M. Naylor and W. A. Goddard III, Angew. Chem., Int. Ed. Engl., 1990, 29, 138–175 CrossRef.
- J. M. J. Fréchet and D. A. Tomalia, Dendrimers and Other Dendritic Polymers, Wiley, Chichester, 2001 Search PubMed.
- L. R. Dalton, P. A. Sullivan and D. H. Bale, Chem. Rev., 2010, 110, 25–55 CrossRef CAS PubMed.
- G. J. Wilmink and J. E. Grundt, J. Infrared, Millimeter, Terahertz Waves, 2011, 32, 1074–1122 CrossRef.
- M. F. Kimmitt, J. Biol. Phys., 2003, 29, 77–85 CrossRef CAS PubMed.
- Z. Li, Q. Wu, G. Li, L. Yu, Y. Xiao, C. Li, J. Ye and Z. Li, Angew. Chem., Int. Ed., 2010, 49, 2763–2767 CrossRef CAS PubMed.
- M. J. Cho, D. H. Choi, P. A. Sullivan, A. J. P. Akelaitis and L. R. Dalton, Prog. Polym. Sci., 2008, 33, 1010–1058 CrossRef.
- L. R. Dalton, A. W. Harper, R. Ghosn, W. H. Steier, M. Ziarj, H. Fetterman, Y. Shi, R. V. Mustacich, A. K. Y. Jen and K. J. Shea, Chem. Mater., 1995, 7, 1060–1081 CrossRef CAS.
- T.-D. Kim, J. Luo, Y.-J. Cheng, Z. Shi, S. Hau, S.-H. Jang, X.-H. Zhou, Y. Tian, B. Polishak, S. Huang, H. Ma, L. R. Dalton and A. K.-Y. Jen, J. Phys. Chem. C, 2008, 112, 8091–8098 CAS.
- Z. Li, W. Wu, Y. Liu, C. Ye, J. Qin and Z. Li, Macromolecules, 2009, 42, 3864–3868 CrossRef CAS.
- Y. V. Pereverzev, O. V. Prezhdo and L. R. Dalton, Chem. Phys. Lett., 2003, 37, 207–212 CrossRef.
- R. A. Lewis, J. Phys. D: Appl. Phys., 2014, 47, 374001 CrossRef.
- N. J. Turro, J. Y.-C. Chen, E. Sartori, M. Ruzzi, A. Marti, R. Lawler, S. Jockusch, J. Lopez-Gejo, K. Komatsu and Y. Murata, Acc. Chem. Res., 2010, 43, 335–345 CrossRef CAS PubMed.
- K. Komatsu, M. Murata and Y. Murata, http://www.sciencemag.org/cgi/data/307/5707/238/DC1/1.
- S. Mamone, M. Ge, D. Huvonen, U. Nagel, A. Danquigny, F. Cuda, M. C. Grossel, Y. Murata, K. Komatsu, M. H. Levitt, T. Room and M. Carravetta, J. Chem. Phys., 2009, 130, 081103 CrossRef CAS PubMed.
- H. Hoshina, Y. Sasaki, A. Hayashi, C. Otani and K. Kawase, Appl. Spectrosc., 2009, 63, 81 CrossRef CAS PubMed.
- The vibrational modes of buckminsterfullerene C60, (http://www.public.asu.edu/~cosmen/C60_vibrations/mode_assignments.htm).
- J. Menendez and J. B. Page, in Light Scattering in Solids VIII, ed. M. Cardona and G. Guntherodt, Springer, Heidelberg, 2000, pp. 27–95 Search PubMed.
- J. C. Davis, Statistics and data analysis in geology, John Wiley and Sons, New York, NY, 1986 Search PubMed.
- R. Franke, Mathematics of Computations, 1982, 33, 181–200 Search PubMed.
| This journal is © The Royal Society of Chemistry 2017 |

