
 Open Access Article
 This Open Access Article is licensed under a Creative Commons Attribution-Non Commercial 3.0 Unported Licence
Zinc and the iron donor frataxin regulate oligomerization of the scaffold protein to form new Fe–S cluster assembly centers†
B. K.
Galeano‡
 abc,
W.
Ranatunga‡
ad,
O.
Gakh‡
*ad,
D. Y.
Smith
IV
ad,
J. R.
Thompson
b and
G.
Isaya
*abd
abc,
W.
Ranatunga‡
ad,
O.
Gakh‡
*ad,
D. Y.
Smith
IV
ad,
J. R.
Thompson
b and
G.
Isaya
*abd
aDepartment of Pediatric & Adolescent Medicine, Mayo Clinic, Rochester, Minnesota, USA. E-mail: gakh.oleksandr@mayo.edu; isaya@mayo.edu
bDepartment of Biochemistry & Molecular Biology, Mayo Clinic, Rochester, Minnesota, USA
cMayo Clinic Graduate School of Biomedical Sciences, Rochester, Minnesota, USA
dMayo Clinic Children's Research Center, Rochester, Minnesota, USA
First published on 26th May 2017
Abstract
Early studies of the bacterial Fe–S cluster assembly system provided structural details for how the scaffold protein and the cysteine desulfurase interact. This work and additional work on the yeast and human systems elucidated a conserved mechanism for sulfur donation but did not provide any conclusive insights into the mechanism for iron delivery from the iron donor, frataxin, to the scaffold. We previously showed that oligomerization is a mechanism by which yeast frataxin (Yfh1) can promote assembly of the core machinery for Fe–S cluster synthesis both in vitro and in cells, in such a manner that the scaffold protein, Isu1, can bind to Yfh1 independent of the presence of the cysteine desulfurase, Nfs1. Here, in the absence of Yfh1, Isu1 was found to exist in two forms, one mostly monomeric with limited tendency to dimerize, and one with a strong propensity to oligomerize. Whereas the monomeric form is stabilized by zinc, the loss of zinc promotes formation of dimer and higher order oligomers. However, upon binding to oligomeric Yfh1, both forms take on a similar symmetrical trimeric configuration that places the Fe–S cluster coordinating residues of Isu1 in close proximity of iron-binding residues of Yfh1. This configuration is suitable for docking of Nfs1 in a manner that provides a structural context for coordinate iron and sulfur donation to the scaffold. Moreover, distinct structural features suggest that in physiological conditions the zinc-regulated abundance of monomeric vs. oligomeric Isu1 yields [Yfh1]·[Isu1] complexes with different Isu1 configurations that afford unique functional properties for Fe–S cluster assembly and delivery.
Significance to metallomicsDefects in mitochondrial iron–sulfur cluster synthesis lead to mitochondrial dysfunction, abnormal intracellular iron distribution and oxidative damage. These defects are increasingly implicated in the pathophysiology of degenerative disorders, as well as the aging process. Detailed mechanistic understanding of Fe–S cluster synthesis is required to elucidate how defects in this process contribute to human disease and how they can be prevented or treated. |
Introduction
Iron sulfur clusters are essential co-factors for a large number of cellular processes.1 Highly conserved protein systems within prokaryotes and eukaryotes catalyze the assembly of [2Fe–2S] and [4Fe–4S] clusters on scaffold proteins and their subsequent delivery to specific apo-proteins.2–4 Scaffold proteins of the IscU-family are able to coordinate both the [2Fe–2S] and [4Fe–4S] clusters and can sequentially interact with different proteins such as iron-, sulfur- and electron-donors during cluster assembly and molecular chaperones during cluster transfer.1,5,6 This structural plasticity may result from the ability of IscU proteins to exist in different molecular states, including partially disordered monomers that can be stabilized by iron–sulfur cluster6 or zinc7,8 binding, as well as homo-oligomers that can also bind iron–sulfur clusters9–12 or zinc (PDB: 2QQ4).IscU protein monomers use four coordinating residues to bind to one [2Fe–2S] cluster.7,11 For example, the human IscU homologue can coordinate one [2Fe–2S] cluster by utilizing three cysteines with either histidine or aspartate acting as a fourth ligand.13 Additional evidence suggests that dimerization of IscU proteins may be used for the reductive coupling of two adjacent [2Fe–2S] clusters to yield a [4Fe–4S] cluster:14 a time course of cluster assembly on the A. vinelandii IscU homodimer revealed the sequential formation of one [2Fe–2S] cluster per dimer, followed by 2 [2Fe–2S] clusters per dimer and ultimately one [4Fe–4S] cluster per dimer.14 A similar sequence of events may occur on the S. pombe IscU homodimer, which was also found to bind to two [2Fe–2S] clusters, one per subunit.11 Moreover, the structure of the A. aeolicus IscU trimer with one bound [2Fe–2S] cluster shows that the cluster is on the surface of one subunit, but buried inside the interface formed by all three subunits, which suggests that IscU oligomerization may help to protect newly assembled clusters from oxidative degradation.12 Finally, there is evidence suggesting that oligomerization may be required by IscU proteins to interact stoichiometrically with their oligomeric protein partners.15–17
Although IscU protein oligomers appear to play a variety of roles in iron–sulfur cluster assembly and delivery, the relationship between monomeric and oligomeric forms of IscU proteins remains undefined. Importantly, there is no consensus on the number of protomers needed for IscU function.7,11,12,18,19 In prokaryotes, IscU was reported as monomeric for E. coli20 and monomeric and dimeric for T. maritima.21A. aeolicus IscU was observed in monomeric, dimeric and trimeric states,12,18 while H. influenzae IscU was observed in monomeric, dimeric, trimeric and tetrameric states,7 and a pentameric structure has been resolved for T. thermophilus IscU (PDB: 2QQ4). This heterogeneity is not limited to bacterial orthologues; in eukaryotes, IscU proteins have been observed as dimers in S. pombe and as monomers, dimers and larger oligomers in S. cerevisiae11,22,23 and human systems.17,24
Available structures of monomeric IscU proteins contain a globular core of four α-helices packed against three antiparallel β-strands forming an ellipsoidal shape.6,7,12,25 The N-terminal segments vary in the degree of disorder and position along the globular core.7,12,20,26 At one end of the protein near three dynamic loops is a solvent accessible region that hosts the Fe–S cluster binding site.12,27–30 Interestingly, in some IscU protein structures, one atom of zinc is bound to this site.7,8 Zinc interacts with high affinity with IscU proteins and plays a role in their structural stability.6–8,25,26
The S. cerevisiae IscU orthologue, Isu1, shares 73% and 71% protein sequence homology with the H. influenzae and the human orthologue, respectively, and therefore represents a relevant model to study the mechanism of the oligomerization of IscU proteins. Similar to the human orthologue, Isu1 assembles new Fe–S clusters via direct interactions with a pyridoxal phosphate-dependent cysteine desulfurase, Nfs1, and its stabilizing partner, Isd11, as well as direct interactions with the yeast frataxin homologue, Yfh1, that serves as the iron donor24,31,32 and as a regulator of Nfs1 activity.33,34 Early studies focused on the iron-dependence of the interactions between Isu1 and Yfh1 and led to the view that iron delivery for cluster assembly involved direct contacts between the Isu1 monomer and the iron-bound Yfh1 monomer.23,35,36 Subsequently, the structures of bacterial Fe–S cluster assembly complexes19,37–39 suggested similar models for the yeast and human Fe–S cluster assembly machinery.32,40–42 The proposed yeast model is a [Nfs1]2·[Isd11]2·[Isu1]2·[Yfh1]2 complex consisting of two anti-parallel [Nfs1]·[Isd11]2 sub-complexes, each binding to one Isu1 subunit and one Yfh1 subunit.32 This architecture would result in the presence of one Fe–S cluster assembly site at each end of the complex and would be compatible with a conserved mechanism for sulfur donation from the cysteine desulfurase to the scaffold.39,41 However, this complex and similar bacterial and human complexes19,40,42 have not provided any conclusive clues about the mechanism for the delivery of elemental iron from the iron donor to the scaffold. Consequently, an integrated mechanism for a concerted delivery of sulfur and iron for cluster assembly has been lacking. Meanwhile, a large body of studies since the year 2000 has shown that Yfh1 and its bacterial and human orthologues have a strong propensity to oligomerize in vitro24,43–45 and in vivo.24,46–48 In the case of Yfh1, at an Fe2+ to protein molar ratio of 2, the Yfh1 monomer forms a trimer;43,45 and at higher Fe2+ to protein ratios, the trimer forms larger oligomers.45,49 Yfh1 oligomerization is normally coupled with the Yfh1-catalyzed oxidation of Fe2+ that yields a stable ferric mineral within Yfh1 oligomers.50–52 These properties are displayed in yeast, where Yfh1 oligomerizes in response to rapid increases in mitochondrial iron uptake.46,47 Nevertheless, the biological significance of frataxin oligomerization has been a matter of debate (for an overview of this subject see ref. 53).53 An early study reported that oligomerization-deficient Yfh1 could interact with native Isu1 and sustain normal Fe–S cluster biogenesis in yeast.54 However, subsequent studies showed that oligomerization-deficient Yfh1 proteins formed weak contacts with Isu131,35 that correlated with slower kinetics of Fe–S cluster biosynthesis35 and increased the susceptibility of yeast cells to excess iron and oxidative stress.35,55 Furthermore, we showed that a point mutation (Y73A) that enhanced the oligomerization propensity of Yfh1 in vivo correlated with higher levels of activity of the [4Fe–4S] enzyme aconitase, reduced oxidative damage and overall increased yeast survival, as compared to wild type Yfh1.46 Based on these in vivo results, we proposed that Yfh1 oligomerization responds to dynamic changes in mitochondrial iron uptake and enables Yfh1 to simultaneously promote Fe–S cluster biosynthesis and stress tolerance.46
Subsequently, Cook et al. showed that monomeric Yfh1 could bind both to Fe2+ and to Isu1 and could stimulate Fe–S cluster assembly in vitro.32,56,57 These studies, as well as a study on the role of monomeric E. coli frataxin (CyaY) in cluster assembly,58 were done under strict anaerobic conditions, which were required to inhibit the oxidation of Fe2+ to Fe3+ and thereby stabilize the Fe2+-loaded Yfh1 or CyaY monomer.56,58 On the other hand, we have shown that when Fe2+ is allowed to bind to the Yfh1 monomer physiologically in aerobic conditions,59 the protein uses its ferroxidase activity to catalyze iron oxidation and forms oligomers that are stabilized by the accumulated ferric mineral.43,45,50–52 The resulting Fe3+-loaded Yfh1 oligomer promotes robust Fe–S cluster assembly on Isu1,31 and the same has been shown by another group for CyaY.60 In comparison to Fe3+-loaded Yfh1 or CyaY oligomer, Fe–S cluster assembly was inhibited under anaerobic conditions in which Yfh1 or CyaY was stabilized as a Fe2+-loaded monomer.31,58
Unlike CyaY and Yfh1, human frataxin (FXN) achieves oligomeric or monomeric configurations in an iron oxidation independent manner, simply via the retention or removal of 39 N-terminal amino acids, which possibly reflects an evolutionary adaptation to the fact that in mammalian tissues not directly exposed to atmospheric oxygen, the intra mitochondrial oxygen concentration is generally low and variable.59 The presence (or absence) of only 39 extra amino terminal residues has profound effects on the physical properties of the two resulting FXN isoforms, namely, the ability of FXN42–210 to oligomerize in a metal-independent manner and the inability of FXN81–210 to do so.24,61 Interestingly, both Yfh1 and FXN42–210 use trimers as the building block for larger oligomers,17,49 which ultimately enables both proteins to form stable contacts with components of the Fe–S cluster assembly machinery.17,24,31 We identified a point mutation in the Yfh1 N-terminal region (Y73A) that enables Yfh1 to oligomerize in an iron-independent manner in yeast46 as well as E. coli,49 similar to FXN42–210.24 The availability of the iron-free and functional Yfh1Y73A and FXN42–210 oligomers has recently enabled structural studies to characterize iron-independent protein–protein interactions involved in the yeast and human Fe–S cluster assembly machineries.16,17 These macromolecular complexes share architectures suitable to ensure the concerted and protected transfer of potentially toxic iron and sulfur atoms to the scaffold during Fe–S cluster assembly.16,17
To further our mechanistic understanding of Fe–S cluster synthesis, in the present study we have analyzed the structure of Isu1 in the absence or in the presence of the Yfh1Y73A 24-mer. The data support a zinc-regulated equilibrium between monomeric and oligomeric Isu1 that influences how Isu1 interacts with Yfh1 and Nfs1 to create new Fe–S cluster assembly centers.
Experimental methods
Protein expression and purification
Expression of the recombinant predicted mature form of Isu1 (residues 28–166)62 with a six-histidine N-terminal tag, and purification of Isu1 after removal of the tag, were described previously.31 Briefly, bacterial cells were grown in 2 L of Luria broth, and then ZnSO4 and isopropyl β-D-thiogalactopyranoside were added to a final concentration of 83 μM and 500 μM, respectively. Unless otherwise stated, all subsequent purification steps were performed in the presence of β-mercaptoethanol (5 mM final concentration), which was always freshly added to the appropriate buffer from a 14.3 M stock solution. Histidine tagged Isu1 was purified by Ni-affinity chromatography, cleaved with thrombin to remove the histidine tag, and fractionated once again through the Ni-affinity chromatography column to remove any remaining histidine-tagged molecules. Isu1 was then isolated by size exclusion chromatography using a Superdex 75 column in 10 mM HEPES–KOH, pH = 7.8, 100 mM NaCl and 5 mM β-mercaptoethanol. Fractions freshly eluted from the column, corresponding to low molecular weight (LMW) or high molecular weight (HMW) Isu1, were kept at 4 °C and used for all subsequent analyses within one week. Expression in E. coli and purification of recombinant Yfh1Y73A 24-mer and recombinant [Nfs1]·[Isd11] complex were carried out as previously reported.31,49 Yfh1Y73A comprises residues 52–174, corresponding to the mature form of the protein detected in vivo at steady state.63,64Zinc and –SH content measurements and amino acid analysis
Zinc was measured at the Metals Laboratory, Mayo Clinic, using an inductively coupled plasma mass spectrometer in dynamic reaction cell mode. Aqueous acidic calibration standards were diluted with aqueous acidic diluent containing 0.5% tertiary butyl alcohol for signal enhancement and internal standards. Quality control, blank and samples were diluted in an identical manner. The samples were aspirated into a pneumatic nebulizer and the resulting aerosol was directed into the plasma by a flow of argon where it was vaporized, atomized, and ionized. Ammonia gas was used to remove polyatomic interferences and the quadrupole mass spectrometer was used to detect the analyte ion count per internal standard ion count.We used the standard Ellman's test65 to measure –SH group content in purified LMW and HMW Isu1. Protein was anaerobically desalted in 100 mM phosphate buffer, pH 7.5, to remove β-mercaptoethanol, and immediately incubated in the presence of 20 mM 5,5′-dithio-bis-(2-nitrobenzoic acid) for 15 min at room temperature, after which the absorbance at A412 was measured in a Beckman DU 640B spectrophotometer. The concentration of –SH groups was determined using an extinction coefficient of 14![[thin space (1/6-em)]](https://www.rsc.org/images/entities/char_2009.gif) 150 M−1 cm−1.66
150 M−1 cm−1.66
Amino acid analysis was performed at the AAA Service Laboratory Inc., Damascus, OR, as described previously.17
Dynamic light scattering
Measurements were performed using a DynaPro Molecular Sizing Instrument with Dynamics V6 software (Protein Solutions, Inc. NJ). The system was equipped with an 824.7 nm laser diode and coherent detector of scatted light at an angle of 90° to the incident beam. Protein samples were centrifuged at 20000 × g for 10 min at 4 °C, after which the supernatant was transferred to a cuvette. After approximately 50 counts of 5 s each per measurement, the averaged autocorrelation function was generated and the particle translational diffusion coefficient was extracted. The hydrodynamic radius (Rh) was calculated using the diffusion coefficient and Stokes–Einstein equation. The Rh values were calculated from the averages of at least 5 measurements for each protein sample. In some experiments, protein samples were analyzed before and after the addition of ZnCl2, or EDTA to chelate the protein-bound zinc as previously described.25
SAXS data collection and analysis
SAXS data were collected at the Advanced Light Source SIBYLS 12.3.1 beamline (Berkeley, CA) using standard procedures.67 Purified protein was diluted to the desired protein concentration in 10 mM HEPES, pH 7.8, 100 mM NaCl, 5 mM β-mercaptoethanol, 1 mM phenylmethylsulfonyl fluoride. Aliquots of each sample (30 μL) were dispensed in triplicate in 96-well full skirt PCR microplates (Axygen Scientific, CA), along with buffer in separate wells. Microplates were shipped and stored at 4 °C and briefly centrifuged at 20000 × g prior to data collection, which occurred no later than 48 h after sample preparation. The plate deck was cooled and maintained at 10 °C for the duration of the data collection. Samples were exposed to a 1011 photon, 12 keV monochromatic X-ray beam with a sample-to-detector distance of 1.48 meters, corresponding to a momentum transfer, q (where q = 4πsinθ/λ), in the range of 0.01 to 0.032 Å−1. Data sets were collected at exposure times of 0.5, 1.0, 2.0 and 4.0 s for each protein sample. Averaged buffer recordings taken before and after each sample data collection were subtracted from the raw sample data. Data analysis was carried out using the ATSAS software package.68 PRIMUS69 was used to interactively determine the radius of gyration (Rg) and forward scattered intensity at zero angle I(0) by the Guinier approximation within the restricted low-q range of q × Rg < 1.3, followed by automated analysis using AUTORG.70 The pairwise distance distribution function P(r) and radius of gyration (RGNOMg) were calculated using AUTOGNOM.70 PRIMUS was used to approximate the excluded volume of the hydrated molecule (Porod volume, Vp) and to indirectly estimate the molecular mass, where molecular mass = Vp/1.6 kDa.71 An output file of the final parameters was generated using AUTOGNOM and included a quality rating of ‘suspicious’, ‘reasonable’, ‘good’ or ‘excellent’. Files with a minimum quality rating of ‘reasonable’ were selected for ab initio shape modeling using the simulated annealing program GASBOR.72 The model simulations were aligned, averaged and each assigned a normalized spatial discrepancy (NSD) value using the DAMAVER program suite.73 NSD scores > mean NSD + 2Δ × (NSD) were excluded as outliers. Analysis of the SAXS data was also carried out using the Ensemble Optimization Method within the program suite EOM.74 For these analyses, RANCH (RANdom CHain)74 was used to produce pools of random conformers modeled from the 138 amino acid sequence of Isu1,62 followed by the establishment of a theoretical form-factor for each model using CRYSOL.75 Ensembles of the models were produced and a genetic algorithm was applied using GAJOE (Genetic Algorithm Judging Optimization of Ensembles)74 to select optimal ensembles with averaged theoretical scattering profiles with the lowest discrepancy to the experimental SAXS data, expressed as a χ2 value.76 In each case, the algorithm underwent 100 cycles using default parameters to obtain a best fit ensemble of Isu1 conformers. For a χ-free analysis, the fit files obtained from the EOM analysis described above were compared to the experimental SAXS scattering data using ScAtter.77
Preparations of [Yfh1]·[Isu1] complexes
Complexes were produced using HMW or LMW Isu1 incubated with purified Yfh1Y73A 24-mer at a Yfh1 to Isu1 molar ratio of 1:1.5 at 30 °C for 30 minutes in buffer containing 10 mM HEPES–KOH, pH 7.3, 100 mM NaCl and 5 mM β-mercaptoethanol. The reactions containing 4.5 mg of total protein were centrifuged at 20000 × g for 10 min, and then loaded onto a Sephacryl S300 column equilibrated with 10 mM HEPES–KOH, pH 7.3, 100 mM NaCl. Fractions were collected and analyzed by SDS-PAGE and Sypro Orange (Life Technologies, USA) staining.
Iron–sulfur cluster assembly assay
Iron–sulfur cluster assembly assays were performed as described previously.31 All buffers and solutions were purged with argon gas (<0.2 ppm O2) in vials tightly sealed with rubber septa. Each complex (25 μM total protein concentration) was aerobically loaded with 50 μM ferrous ammonium sulfate for 1 h in 20 mM HEPES–KOH, pH 7.3, 150 mM NaCl. [2Fe–2S] synthesis was started with the addition of 50 μM iron, provided as a holo-complex or directly, to anaerobic reactions containing 5 mM dithiothreitol, and 2 mM L-cysteine in 20 mM HEPES–KOH, pH 7.3, 150 mM NaCl. The source of sulfur for the reaction was either 2.5 mM Na2S or 2 mM L-cysteine in the presence of 5 μM [Nfs1]·[Isd11].78 [2Fe–2S] cluster formation was subsequently measured anaerobically in a Beckmann Du 640B spectrophotometer at A426 using tightly sealed, argon-purged quartz cuvettes. Absorbance spectra from 300–600 nm were recorded at the end of each reaction.Negative staining transmission electron microscopy (EM)
For the complex preparations described above, fraction 53, freshly eluted from a Sephacryl S300 gel filtration column, was diluted to 0.11 mg mL−1 in HN100 buffer and applied to carbon-coated glow-discharged (DV-502A instrument, Denton Vacuum Inc.) copper grids (400 mesh, EMS). A protein concentration of 0.11 mg mL−1 was found to give the best distribution of particles on the grids. Grids were stained with 1% (w/v) uranyl acetate as described previously.16 Electron micrographs were collected at a magnification of 115000-fold (1.034 Å per pixel) at the University of Minnesota Characterization Facility using a FEI Technai G2 F30 field emission gun cryo transmission electron microscope with acceleration voltage at 300 kV, equipped with an Electron Energy-Loss Gatan imaging filter with 4k × 4k ultra scan CCD camera (4096 × 4096 pixels). We used the EMAN2 software package79 to perform contrast transfer function correction and to process the images to create initial and refined 3D models of the complex. We used POLARRFN of the CCP4 package80 to calculate structure factors from the EM density maps of initial 3D models and obtain their self-rotation functions. We used the PDBe server to calculate the Fourier shell correlation plot for the refined 3D model,79 and obtained the resolution of the 3D model measured where the plot crosses the correlation value of 0.143, and the resolution based on the 3-sigma criterion and the 1/2 bit criterion.81
Docking of Yfh1Y73A trimer and Isu1 monomer structures in the EM density map
We used the program Chimera82 to visualize and dock structures into the EM density map of the refined 3D model using the X-ray crystal structure of the Yfh1Y73A trimer with the entire N-terminal region (residues 52–174) resolved (PDB: 3OEQ),83 and an homology model of the Isu1 monomer generated by the I-TASSER web resource.84Molecular dynamics flexible fitting for docked structures
The N-terminal regions of Isu1 (residues 28–61) and Yfh1 (residues 52–74) were modelled into the EM map manually based on cross-linking data. The EM map was then converted to Situs format (http://situs.biomachina.org/) to allow rigid-body docking of the entire complex structure, followed by molecular dynamics simulations and energy minimizations using NAnoscale Molecular Dynamics, NAMD 2.10,85 as described previously.16 Model improvement iterations were done with the program Coot,86 followed by molecular dynamics simulations and energy minimizations using NAMD 2.10. The final model had a Ramachandran plot with 95.1% of the residues in the favorable region, and a MolProbity score of 2.30 (58%) with only 2.21% β-carbon deviations >0.25 Å, indicating that the model had reasonable geometry.87Chemical cross-linking, limited proteolysis and tandem mass spectrometry
These studies were carried out using procedures described previously.16,17 Briefly, [Yfh1]24·[Isu1LMW]24 complex (1 mL containing 4 mg total protein) was incubated with the cross-linker bis[sulfosuccinimidyl] suberate (BS3) (Thermo Scientific),88,89 at a protein/BS3 molar ratio of 1:100, and cross-linked protein was re-isolated via Sephacryl S300 size-exclusion chromatography and analyzed by SDS-PAGE. One preparation of cross-linked complex was incubated with endoproteinase GluC (New England BioLabs), and a second preparation was digested with both GluC and endoproteinase AspN (Roche/Sigma-Aldrich) and further treated with the reducing agent, tris-carboxyethyl phosphine (50 mM final concentration) (Hampton Research). Cross-linked peptides in each sample were identified at the Mayo Clinic Proteomics Core by nano-flow liquid chromatography electrospray tandem mass spectrometry (MS/MS) using an Orbitrap Elite mass spectrometer (Thermo Fisher Scientific) coupled to a Thermo Ultimate 3000 RSLCnano HPLC system as described previously.16
Analysis of cross-linked peptides
The program StavroX 3.5.1 (http://www.stavrox.com/help.php) calculated all theoretical combinations of cross-linked peptides between Yfh1 and Isu1 and within Yfh1 or Isu1 and compared them to each of the two MS/MS datasets described above.90 In the Mass comparison tab of the program, we selected (i) a precursor precision of 3.0 ppm, which defined the deviation that precursor ions could have to the calculated mass of crosslinked peptides in order to be recognized as cross-linked candidates; (ii) a fragment ion precision of 0.8 Da, which defined the deviation that fragment ions could have to the calculated fragment ion masses, to still be identified; (iii) a signal/noise ratio of 2; and (iv) a pre-score of >10% intensity. The correctness of the program identification was verified by visual inspection of the theoretical and experimental parent ion and fragmentation, and by comparing the peptide's predicted and calculated sequence. The program assigned a score to each identified cross-linked peptide based on a comparison between the theoretical fragmentation and the actual MS/MS spectrum of the peptide.90 Lastly, the program calculated the false discovery rate (FDR) by comparing the cross-linked candidates in each experimental dataset to the false-positives in a decoy dataset generated from the inverted amino acid sequences of Yfh1 and Isu1. For each experimental dataset, the software plotted the number of cross-linked candidates and false positives versus the score range, and calculated the FDR corresponding to any given score. Therefore, using the FDR rather than the score allowed us to merge the results of the two different datasets, as shown in Table S1 (ESI†). Protein–protein distances were measured in the entire simulated structure of the complex between each possible pair of cross-linked residues within each of the identified cross-linked peptides using a script (distance :resi#1.subunit#1@CA :resi#2.subunit#2@CA) in the command line of Chimera, and the mean distance ± standard deviation was calculated for each possible pair of cross-linked residues (Table S1, ESI†) as reported previously.16 We defined the distance constraints between the backbone α-carbons of two cross-linked residues as being equal to the length of the BS3 spacer arm (11.4 Å) plus the lengths of the side chains of the two cross-linked residues. Distances measured in the structure, which were equal or lower than the distance constraints, are highlighted in light gray in Table S1 (ESI†). We defined the maximum allowable distance constraints between the backbone α-carbons of two cross-linked residues as being equal to the distance constraints plus the estimated resolution-dependent errors (RDE)91 in the positions of Yfh1 and Isu1 protein atoms. The RDE for Yfh1–Isu1 (7.8 Å), Yfh1–Yfh1 (10.2 Å) and Isu1–Isu1 (5.4 Å) were calculated from the resolution of the Yfh1Y73A crystal structure used for docking (PDB: 3OEQ; RDE = 5.1 Å) and the resolution of the crystal structure of A. aeolicus IscU (PDB: 2Z7E; RDE = 2.7 Å) as reported previously.16 Distances measured in the structure that are equal to or lower than the maximum allowable distance constraints are highlighted in dark gray in Table S1 (ESI†). All greater distances are highlighted in yellow. The distance constraints and the maximum allowable distance constraints for all of the possible pairs of residues that can be cross-linked by BS3 are shown in the legend of Table S1 (ESI†).Results
Two Isu1 species with different levels of bound zinc are isolated from E. coli
We expressed the predicted mature form of Isu1 (i.e. lacking the predicted N-terminal mitochondrial targeting signal comprising residues 1–27)62 in E. coli in the presence of zinc to enhance protein stability.7,31 As analyzed by size exclusion chromatography, the crude bacterial cell extract contained a distribution of Isu1 eluting with apparent molecular mass between ∼44 to ∼17 kDa, which was consistent with a monomer–dimer equilibrium (data not shown). Subsequent protein purification involving two sequential Ni-affinity chromatographic steps led to progressive broadening of the distribution and ultimately the formation of two separate peaks (Fig. 1A and B). The two peaks, designated LMW and HMW Isu1, reproducibly eluted from a final Superdex 75 size-exclusion chromatography column with molecular masses of 19.1 ± 1.5 and 61.1 ± 1.0 kDa (n = 3), measured at the center of each peak using a standard Kavvs. log(MW) curve.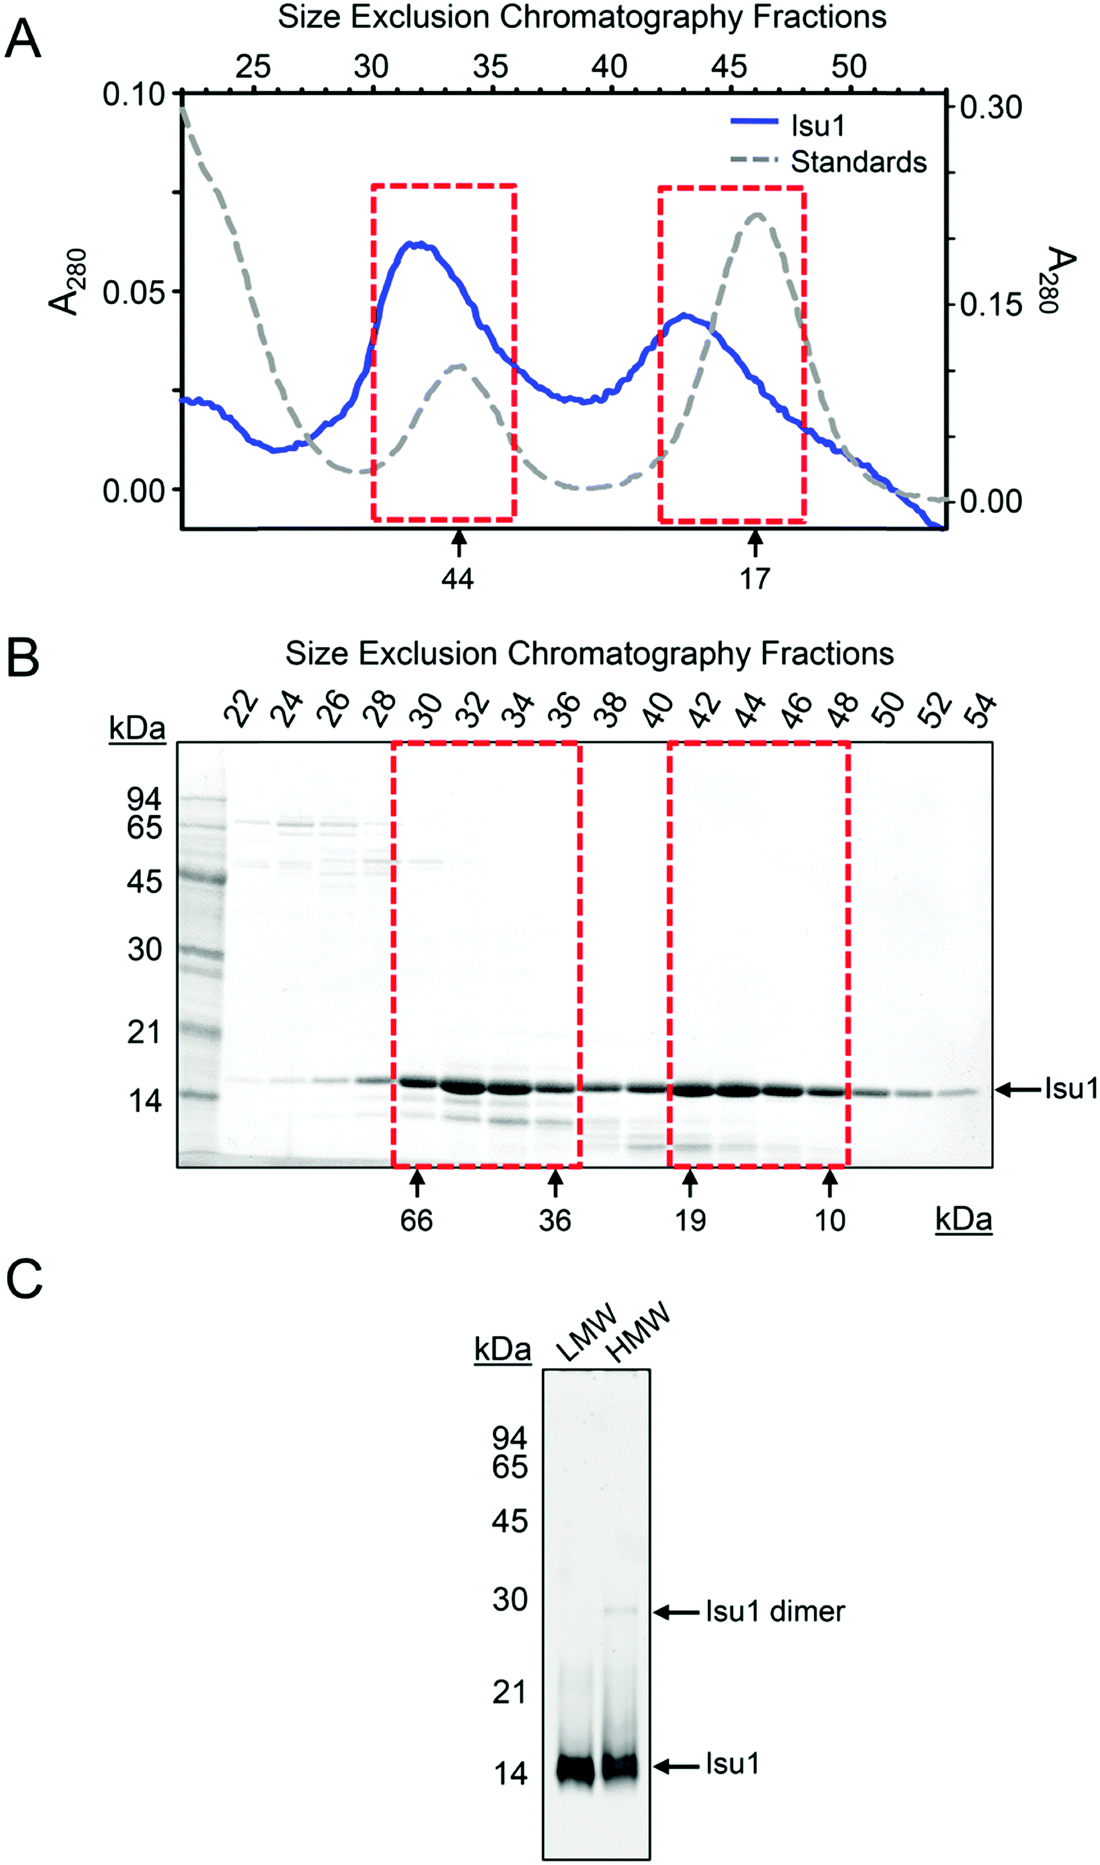 | ||
| Fig. 1 Two Isu1 species with different molecular masses are purified from E. coli. (A) Last step of purification of the mature form of Isu1 (residues 28–166) by Superdex 75 size exclusion chromatography. Different absorbance (A280) scales are shown for Isu1 and the molecular weight standards, ovalbumin and myoglobin. (B) Fractions corresponding to the entire size-fractionation range of the Superdex 75 column were analyzed by SDS-PAGE, and proteins were detected by staining with SYPRO Orange and imaging with a Gel Doc XR+ system (Bio-Rad). We collected 1 mL fractions and analyzed an equal volume from each fraction on SDS-PAGE. Fractions corresponding to the LMW and HMW pools of Isu1 are highlighted by red boxes. The bands underneath the Isu1 band are degradation products of Isu1 that form during the thrombin digestion step, and do not interact with Yfh1.31 (C) LMW and HMW Isu1 fractions eluted from the size exclusion chromatography column were pooled, as shown in (B), and analyzed by SDS-PAGE in the presence of 0.1% SDS in the gel running buffer and in the absence of both SDS and the reducing agent β-mercaptoethanol in the sample buffer. | ||
We hypothesized that changes in bound zinc during Ni-affinity chromatography might have been responsible for the formation of these two peaks, and measured zinc concentrations in pooled fractions comprising each peak (Fig. 1B, fractions 30–36 and 42–48). Two independently purified batches of protein at a concentration of 1 mg mL−1 were analyzed in duplicate as described in Experimental methods. Zinc was present at a molar ratio of 0.677 ± 0.003 atoms per protomer in LMW Isu1 and 0.025 ± 0.000 atoms per protomer in HMW Isu1 (Table S2, ESI†), suggesting that the formation of HMW Isu1 was associated with the loss of constitutively bound zinc.
Zinc chelation promotes conversion of LMW to HMW Isu1
Dynamic light scattering of fraction 32 and 42 eluted from the Superdex 75 size-exclusion chromatography column (1 mg mL−1 protein concentration) revealed hydrodynamic radii (Rh) of ∼3 nm for LMW Isu1 and ∼5 nm for HMW Isu1 (Table 1 and Fig. S1, ESI†). Treatment of each fraction with 500 molar equivalents of EDTA almost doubled the Rh of LMW Isu1, while the Rh of HMW Isu1 did not change significantly (Table 1 and Fig. S1, ESI†). These data suggested that zinc binding stabilized LMW Isu1 as reported for the monomeric forms of other IscU-family members.7,8 The data further suggested that zinc chelation triggered oligomerization of LMW Isu1. We assessed the effects of zinc addition using dynamic light scattering. Addition of 1 or 10 molar equivalent of zinc to LMW Isu1 did not have significant effects on the Rh of the protein, over 99% of which maintained the Rh exhibited in the absence of added zinc (Fig. S2, ESI†). Similarly, the addition of 1 molar equivalent of zinc to HMW Isu1 led to an Rh that was not significantly different, as compared to the Rh of HMW Isu1 in the absence of added zinc (Fig. S2, ESI†). Thus, it was possible to convert LMW to HMW Isu1 by the removal of constitutively bound zinc; conversely, it was not possible to convert HMW Isu1 back to the LMW form by the addition of stoichiometric concentrations of zinc. Addition of 10 molar equivalents of zinc to LMW Isu1 led to the formation of species with Rh > 200 nm, which however represented <1% of the species in the sample (Fig. S2, ESI†). Similar large species were formed upon addition of 10 molar equivalents of zinc to HMW Isu1, but in this case they represented >99% of the species in the sample (Fig. S2, ESI†). The large species could be almost completely resolved by the addition of 500 molar equivalents of EDTA, both in the case of LMW Isu1 as well as HMW Isu1 (Fig. S2, ESI†). In both cases, >99% of the species resulting from EDTA treatment exhibited an Rh close to the starting Rh of HMW Isu1. These results were consistent with excess zinc causing aggregation of HMW Isu1, but not LMW Isu1, which was stabilized by endogenously bound zinc. Similarly, others showed that the presence of constitutively bound zinc stabilized the fold of prokaryotic IscU, whereas the subsequent addition of zinc resulted in aggregation.8| Protein | R h (nm) | R h (nm) + EDTA |
|---|---|---|
| Size exclusion chromatography fractions 42 and 32 for LMW and HMW Isu1, respectively (see Fig. 1B), at a protein concentration of 1 mg mL−1, were analyzed by dynamic light scattering in the presence or absence of 500 molar equivalents of EDTA as described in Experimental Methods. Shown are the mean ± standard deviation obtained from three independently prepared sets of protein samples, each of which underwent at least 3 measurements. | ||
| LMW Isu1 | 3.1 ± 0.2 | 5.2 ± 0.2 |
| HMW Isu1 | 4.5 ± 0.5 | 5.0 ± 0.4 |
One possible interpretation of the results reported above was that zinc binding to the Isu1 monomer could stabilize the reduced form of its three cysteine residues,7 whereas Isu1 without bound zinc could form inter-molecular disulfide bonds leading to the formation of the HMW form of the protein. To test this possibility, we analyzed freshly purified LMW and HMW Isu1 (1 mg mL−1 protein concentration) for their free –SH group content. Two completely independent measurements revealed 3.25 ± 0.18 and 2.05 ± 0.01 –SH groups per subunit of Isu1 in the LMW and HMW pool, respectively. The presence of stoichiometric amounts of –SH groups in LMW Isu1 indicated that S–S bonds were not present in LMW Isu1. On the other end, there was a ∼30% loss in –SH groups in HMW Isu1 that could be attributed to S–S bond formation. Next, we compared SDS-PAGE of LMW and HMW Isu1 in reducing versus non-reducing conditions in the presence of different concentrations of SDS in the sample and gel running buffers. In reducing conditions in the presence of 1% SDS in both buffers, LMW and HMW Isu1 migrated with the expected molecular mass of ∼15 kDa and there were no obvious species in the region of the gel ≥30 kDa, where dimer and larger oligomers would be expected to migrate (Fig. 1B). Only after we excluded SDS from the sample buffer and lowered the SDS concentration in the gel running buffer from 1% to 0.1% did a faint species appear in non-reducing conditions with an apparent molecular mass of ∼30 kDa in the HMW, but not LMW Isu1 sample (Fig. 1C). Upon further inspection of the SDS-PAGE analysis in reducing conditions, we noted that a very faint 30 kDa band was present in fraction 34 of HMW Isu1 (Fig. 1B). This suggested that low levels of Isu1 dimer formed via inter-molecular disulfide bonds in the HMW pool; however, these dimeric species represented a negligible fraction of the HMW Isu1, regardless of the conditions used. The data together indicated that inter-molecular disulfide bonds did not play a significant role in LMW or HMW Isu1, and that the ∼30% loss in –SH groups experienced by HMW Isu1 most likely reflected intra-molecular S–S bonds.
LMW Isu1 is mostly monomeric with limited tendency to form dimers
We characterized LMW Isu1 utilizing SAXS. Scattering data were collected from samples of increasing protein concentration with different exposure times (Table 2 and Fig. S3A–F, ESI†). The data demonstrated subtle protein-concentration-dependent changes in LMW Isu1. Increasing protein concentrations from 1 to 6 mg mL−1 corresponded to an increase in RGNOMg, from 20.5 to 24.9 Å (similar to the Rg determined by Guinier analysis), and an increase in Dmax from 66.6 Å to 85.8 Å (Table 2). In addition, the Vp increased from 26800 Å3 at 1 mg mL−1 to 32200 Å3 at 6 mg mL−1, with associated molecular masses of 16.7 kDa and 20.1 kDa (Table 2). The I(0) also increased with the protein concentration (Table 2). The simultaneous increases in Rg and I(0) from Guinier analysis at increasing protein concentrations indicated that the scattering from each sample was not influenced by interparticle interference, which is characterized by decreasing Rg and I(0) as the protein concentration increases.92 Rather, large deviations from linearity were not present on the Guinier plots within the low q region, and the P(r) functions remained positive and slightly extended within the high r region (Fig. S3D and E, ESI†), suggesting subtle concentration-dependent oligomerization. Kratky plots were similar among the different protein concentrations, but not completely superimposable (Fig. S3F, ESI†), also consistent with small protein concentration-dependent conformational changes. These data together suggested that LMW Isu1 had a limited tendency to oligomerize at increasing protein concentrations. This was confirmed by plotting biophysical features of LMW Isu1 as a function of protein concentration, as determined by SAXS data obtained from three independently prepared and analyzed preparations of LMW Isu1 (Fig. S4, ESI†). These SAXS data were consistent with little or no protein concentration-dependent variability in Rh when LMW Isu1 was analyzed by dynamic light scattering at concentrations ranging from 2 to 12 mg mL−1 (Fig. S5, ESI†).
| Sample | Exposure time (s) | Conc. (mg mL−1) | I 0 |
|
R GNOMg (Å) | D max (Å) | V p (Å3) | MMSAXS (kDa) |
|---|---|---|---|---|---|---|---|---|
| Single SAXS scattering curves were created from each individual set of data without merging data from different protein concentrations (Fig. S1 and S3, ESI). Guinier plots showed linear behavior at small q values (q × Rg < 1.3) from which the zero angle scattering intensity, I0, and the mean particle size (radius of gyration, Rg), were extracted using PRIMUS. The Rg and maximum dimension (Dmax) were extracted from the normalized pairwise distribution functions, P(r), for the same sets of data using AUTOGNOM. PRIMUS was used to approximate the excluded volume of the hydrated molecule (Porod volume, Vp), which was used to estimate the molecular mass, MMSAXS.111 These parameters are plotted vs. protein concentration in Fig. S4 (ESI). | ||||||||
| LMW Isu1 | 0.5 | 1 | 26.9 ± 0.4 | 19.9 ± 3.9 | 20.3 | 65.3 | 24300 |
15.2 |
| 1.0 | 1 | 29.1 ± 0.2 | 22.2 ± 3.3 | 22.4 | 72.8 | 24800 |
15.5 | |
| 2.0 | 1 | 30.6 ± 0.2 | 24.3 ± 2.7 | 22.8 | 72.3 | 26800 |
16.7 | |
| 0.5 | 2 | 66.7 ± 0.5 | 22.0 ± 2.6 | 22.6 | 77.0 | 25400 |
15.9 | |
| 1.0 | 2 | 69.6 ± 0.4 | 23.1 ± 1.7 | 23.7 | 80.9 | 28700 |
17.9 | |
| 0.5 | 3 | 105.0 ± 0.5 | 22.1 ± 1.9 | 22.8 | 77.4 | 28400 |
17.7 | |
| 1.0 | 3 | 111.7 ± 0.4 | 24.3 ± 1.5 | 24.1 | 83.0 | 29900 |
18.7 | |
| 0.5 | 4 | 137.6 ± 0.9 | 22.6 ± 1.8 | 22.9 | 79.2 | 29300 |
18.4 | |
| 0.5 | 5 | 183.7 ± 0.9 | 22.6 ± 2.1 | 23.3 | 79.1 | 29900 |
18.7 | |
| 0.5 | 6 | 257.5 ± 0.5 | 24.5 ± 0.7 | 24.9 | 85.8 | 32200 |
20.1 | |
| HMW Isu1 | 4.0 | 1 | 30.8 ± 0.2 | 27.9 ± 2.1 | 28.0 | 89.3 | 40000 |
25.0 |
| 4.0 | 1 | 29.8 ± 0.2 | 27.8 ± 2.9 | 28.8 | 97.3 | 40400 |
25.3 | |
| 1.0 | 2 | 74.7 ± 0.4 | 29.5 ± 1.7 | 30.5 | 103.4 | 46800 |
29.3 | |
| 2.0 | 2 | 73.7 ± 0.4 | 29.3 ± 2.2 | 28.9 | 93.7 | 47900 |
29.9 | |
| 4.0 | 2 | 78.2 ± 0.3 | 31.2 ± 1.4 | 32.1 | 109.3 | 51500 |
27.3 | |
| 1.0 | 3 | 60.9 ± 0.4 | 28.0 ± 1.8 | 29.5 | 97.8 | 43600 |
30.7 | |
| 2.0 | 3 | 66.8 ± 0.4 | 31.4 ± 2.1 | 31.5 | 109.8 | 49200 |
30.0 | |
| 4.0 | 3 | 65.8 ± 0.4 | 29.7 ± 2.7 | 30.7 | 103.9 | 48000 |
29.3 | |
| 0.5 | 4 | 181.6 ± 1.1 | 32.7 ± 2.8 | 32.8 | 109.4 | 63900 |
39.9 | |
| 2.0 | 4 | 188.7 ± 0.9 | 32.8 ± 4.5 | 33.9 | 114.8 | 65800 |
41.1 | |
| 0.5 | 5 | 248.5 ± 1.2 | 34.8 ± 1.9 | 34.2 | 114.1 | 70200 |
43.8 | |
| 1.0 | 5 | 243.7 ± 0.9 | 33.3 ± 2.0 | 34.1 | 114.0 | 69800 |
43.6 | |
| 0.5 | 6 | 357.9 ± 1.6 | 36.6 ± 1.2 | 34.4 | 108.8 | 76100 |
47.6 | |
| 1.0 | 6 | 363.4 ± 0.8 | 36.5 ± 0.9 | 37.2 | 127.9 | 82300 |
51.6 | |
| 2.0 | 6 | 373.0 ± 0.9 | 37.4 ± 1.0 | 37.7 | 130.9 | 83800 |
52.4 | |

The N-terminal region of the Isu1 monomer is flexible
At 1 mg mL−1, the estimated molecular mass of LMW Isu1 was 15.2, 15.5 and 16.7 kDa at exposure times of 0.5, 1.0 and 2.0 s, respectively (Table 2), values similar to the molecular mass of Isu1 calculated from its 138 amino acid sequence (15.4 kDa). This suggested that at 1 mg mL−1, LMW Isu1 was mostly monomeric. The SAXS scattering profile of the Isu1 monomer at 2.0 s exposure was smooth and featureless (Fig. 2A). A linear Guinier region was identified with an estimated Rg of 24.3 ± 2.7 Å (Fig. 2B). The P(r) function demonstrated a skewed distribution with a maximum at approximately 1/3Dmax, with a calculated Rg of 22.8 Å and Dmax of 72.3 Å (Fig. 2C). A Kratky plot of the data produced a parabolic shape (Fig. 2D), indicating that the Isu1 monomer was either partially unfolded or flexible.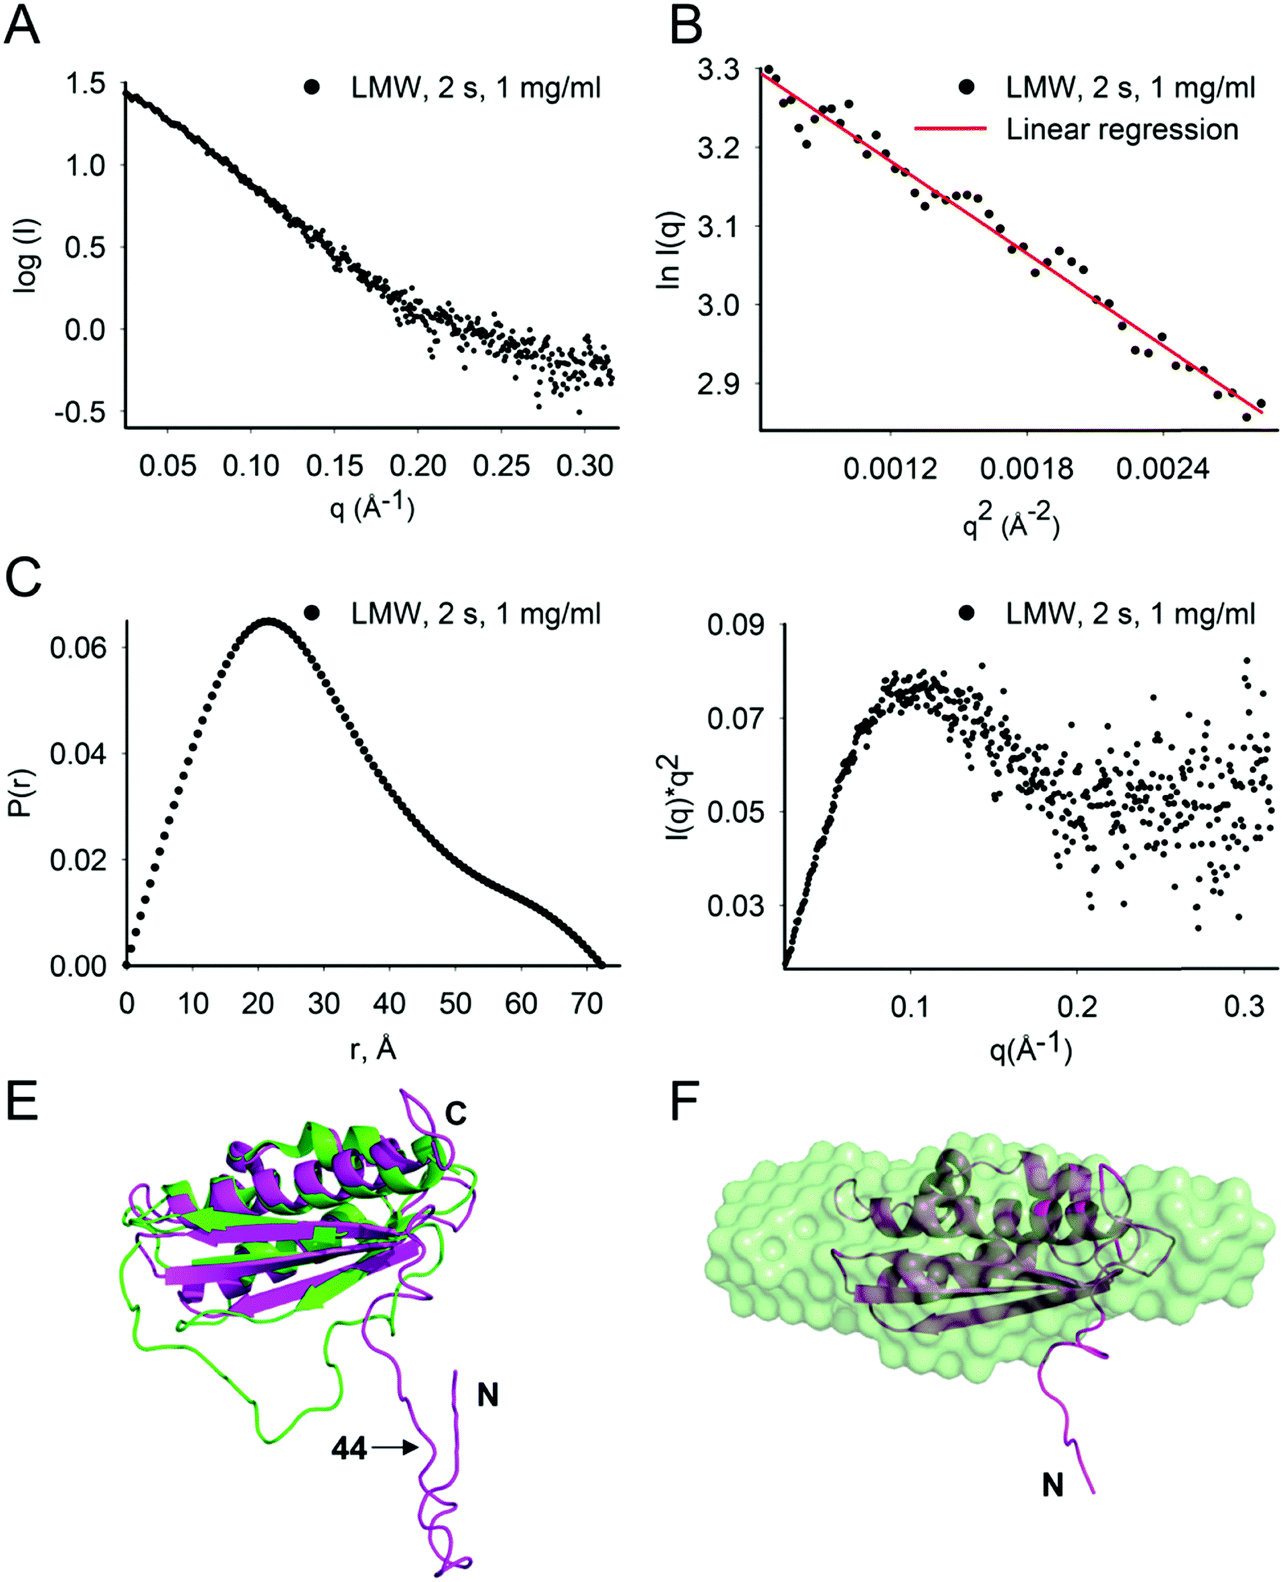 | ||
| Fig. 2 LMW Isu1 has a flexible N-terminal region. (A) SAXS scattering intensity profile of LMW Isu1 at 1 mg mL−1 with 2 s exposure. (B) Linear region of the Guinier plot used to determine the scattering intensity at infinite dilution, I(0), and to extrapolate the Rg using the programs PRIMUS. (C) Pairwise distribution function, P(r), and (D) standard Kratky plot extracted from the data in (A). (E) Alignment of H. influenzae IscU (PDB: 1R9P) (green) with an Isu1 model created by Phyre2 (magenta). (F) DAMAVER average of 24 ab initio bead models generated using GASBOR. Twenty-four low-resolution ab initio bead models consisting of 138 dummy residues with an imposed P1 symmetry were generated from SAXS scattering data collected for LMW Isu1 at 1 mg mL−1 with 3 s exposure. The Phyre2 model of Isu1 (with residues 28–43 removed) is fitted into the averaged ab initio model. | ||
We carried out flexibility analysis using EOM.74 We used RANCH74 to generate a pool of 10000 random monomeric conformers for the 138 amino acid sequence of Isu1 without imposing any structural restraints.31 We used CRYSOL75 for the computation of theoretical solution scattering from the predicted models in the RANCH pool, and GAJOE74 to compare the averaged theoretical scattering intensity from different ensembles of models to the experimental SAXS scattering data from LMW Isu1 (1 mg mL−1 at 2 s exposure), and selected the best fit ensemble from the RANCH pool. The individual and averaged dimensions of the models in the best-fit ensemble suggested an elongated particle shape (Fig. S6A–F, ESI†). Phyre2 (ref. 93) predicted a 3D model from the 138 amino acid sequence of Isu1 that was most similar to a structure of H. influenzae IscU with zinc bound at the active site (PDB: 1R9P) (Fig. 2E). We used the globular core of this model (residues 44–166) as a structural constraint, and produced a new RANCH pool of monomeric conformers for the 138 amino acid sequence of Isu1. EOM analysis of this pool suggested that the N-terminal region of the Isu1 monomer contained no structure (data not shown). To obtain a sequence-independent model of LMW Isu1, we used GASBOR to generate 24 SAXS data-derived ab initio bead models, and averaged them using DAMAVER. The dimensions of the averaged bead model were 20.8 and 71. 9 Å for Rg and Dmax, respectively, close to the averaged dimensions of the Isu1 models in the best-fit ensemble described above (25.8 and 80.6 Å for Rg and Dmax, respectively; Fig. S6D, ESI†). The Phyre2 predicted model of Isu1 with residues 28–43 removed aligned with the bead model (Fig. 2F). Together the data suggested that the Isu1 monomer had an elongated shape that reflected the presence of an unstructured N-terminal region, as reported for other IscU-type proteins.7,12,20,26
HMW Isu1 has a strong propensity to oligomerize in a protein concentration-dependent manner
Next, we characterized HMW Isu1 utilizing SAXS (Table 2 and Fig. S7A–F, ESI†). The data demonstrated much greater protein concentration-dependent changes for HMW as compared to LMW Isu1. Increasing protein concentration from 1 to 6 mg mL−1 corresponded to an increase in RGNOMg, from 28.0 to 37.7 Å (similar to the Rg determined by Guinier analysis), and an increase in Dmax from 89.3 Å to 130.9 Å (Table 2). In addition, the Vp increased from 40000 Å3 at 1 mg mL−1 to 83800 Å3 at 6 mg mL−1, with associated molecular masses of 25 kDa and 52 kDa (Table 2). The Rg values calculated by Guinier analysis for each protein concentration were consistent with the values of Rg derived from the distance distribution function (Table 2), suggesting minimal interparticle interference as discussed for LMW Isu1. Kratky plots of the SAXS data were not superimposable (Fig. S8F, ESI†), and both the Rg and Dmax derived from the distance distribution functions increased smoothly as the protein concentration increased (Table 2). Together, these findings suggested that HMW Isu1 underwent step-wise higher order oligomerization in a protein concentration dependent manner. This could be appreciated by plotting biophysical features of HMW Isu1 as a function of protein concentration (Fig. S4, ESI†). These SAXS data were consistent with concentration-dependent increases in Rh, from 3.8 ± 0.3 nm to 8.3 ± 3.4 nm, when HMW Isu1 was analyzed by dynamic light scattering at increasing protein concentrations ranging from 2 to 10 mg mL−1 (Fig. S5, ESI†). The effect of protein concentration on Isu1 oligomerization, as analyzed by SAXS and dynamic light scattering, were different from the effects of zinc addition, as analyzed by dynamic light scattering. In particular, the large species observed after the addition of excess zinc to samples containing 1 mg protein per mL were much larger than the largest oligomers observed by dynamic light scattering or SAXS at increasing protein concentrations (Fig. S2 vs. S5 and S8–S11, ESI†). The former species most likely represented aggregates,8 while the latter species represented Isu1 oligomers, mainly dimer and trimer.
EOM analysis of LMW and HMW Isu1
We used RANCH74 to produce pools of 25000 monomeric or oligomeric (dimer, trimer or tetramer) conformers modeled from the 138 amino acid sequence of Isu1 with C1, C2, C3 or D4 point group symmetries. Applied structural constraints consisted of the Phyre2-derived model of Isu1 with residues 28–43 removed. From these pools, we created three additional pools consisting of 50000, 75000 or 100000 models with stoichiometric monomer/dimer, monomer/dimer/trimer or monomer/dimer/trimer/tetramer ratios, and then used CRYSOL75 and GAJOE74 to compare the averaged theoretical scattering intensity from each pool to the experimental SAXS scattering data. A monomer/dimer pool showed a good fit to the SAXS data collected for LMW Isu1 at protein concentrations ranging from 1 to 6 mg mL−1, with χ2 values of 1.61 and 1.64 at the initial and final concentration tested, respectively (Fig. S8, S9 and S12A, ESI†), which did not change significantly following the addition of trimers or tetramers to the pool (Fig. S12B and C, ESI†). Similarly, a χ-free analysis using ScAtter77 yielded acceptable values, with the exception of the highest concentration tested following the addition of tetramers to the pool (Fig. S12A–C, ESI†). Together, the data indicated that LMW Isu1 had a small propensity to oligomerize beyond dimer.
A monomer/dimer pool showed a good fit to the SAXS data collected for HMW Isu1 at a protein concentration of 1 mg mL−1, with a χ2 value of 1.59 that did not change significantly following the addition of trimers or tetramers to the pool (Fig. S10, S11 and S12A–C, ESI†). However, a monomer/dimer/trimer/tetramer pool showed the best fit to the SAXS data collected for HMW Isu1 at higher protein concentrations (Fig. S11 and S12B and C, ESI†). In particular, at 6 mg protein per mL, the χ2 value was 10.73 with the monomer/dimer pool, and improved greatly to 2.32 with the monomer/dimer/trimer pool, and to 1.68 with the monomer/dimer/trimer/tetramer pool (Fig. S12A–C, ESI†). As observed with the EOM analysis, a χ-free analysis emphasized the poor fit of the SAXS data to the monomer/dimer pool as the protein concentration increased (Fig. S12A, ESI†), while the fit improved significantly after the addition of trimers and tetramers to the pool (Fig. S12A–C, ESI†). Together, the data indicated that HMW Isu1 had a strong propensity to form dimers and could also undergo higher order oligomerization, at least up to tetramer.
Both LMW and HMW Isu1 form stoichiometric and catalytically active complexes with Yfh1
As determined by the EOM analysis, at 1 mg protein per mL, HMW Isu1 was ∼30% monomeric, ∼50% dimeric and ∼20% trimeric (Fig. S12C, ESI†). We reported previously that incubation of this dyshomogeneous distribution of Isu1 species with the apo-Yfh1Y73A 24-mer resulted in a stable and active macromolecular complex consisting of eight symmetric Isu1 trimers bound on top of eight symmetric Yfh1 trimers, designated [Yfh1]24·[Isu1HMW]24.16 This indicated that HMW Isu1 could adopt a uniform oligomeric configuration upon binding to Yfh1Y73A 24-mer. On the other hand, based on the EOM analysis, LMW Isu1 was ∼60% monomeric and ∼40% dimeric at a protein concentration of 1 mg protein per mL, and exhibited very small propensity to oligomerize beyond dimers, even at a protein concentration as high as 6 mg mL−1 (Fig. S4 and S12A, ESI†), raising the question of whether and how this form would interact with Yfh1. Interestingly, incubation of the apo form of Yfh1Y73A 24-mer with LMW Isu1 resulted in the formation of a complex similar to [Yfh1]24·[Isu1HMW]24 (henceforth designated [Yfh1]n·[Isu1LMW]n).[Yfh1]n·[Isu1LMW]n and [Yfh1]24·[Isu1HMW]24 had very similar elution volumes as analyzed by Sephacryl S300 size exclusion chromatography (Fig. 3A, C and D). The elution volumes of the two complexes were essentially the same as the elution volume of the Yfh1Y73A 24-mer alone (Fig. 3A–D). Accordingly, dynamic light scattering of fraction 53 (which is at the center of each of the three peaks shown in Fig. 3A) revealed an Rh of 7.3 ± 0.2 nm for the [Yfh1]n·[Isu1LMW]n complex, very close to the Rh of 7.2 ± 0.2 nm measured for [Yfh1]24·[Isu1HMW]24 and 7.6 ± 0.5 nm measured for the Yfh1Y73A 24-mer under similar experimental conditions.16 These results indicated that [Yfh1]n·[Isu1LMW]n and [Yfh1]24·[Isu1HMW]24 were tightly packed globular complexes that eluted according to their similar dimensions94 and independent of their greater molecular masses, compared to Yfh1Y73A 24-mer.
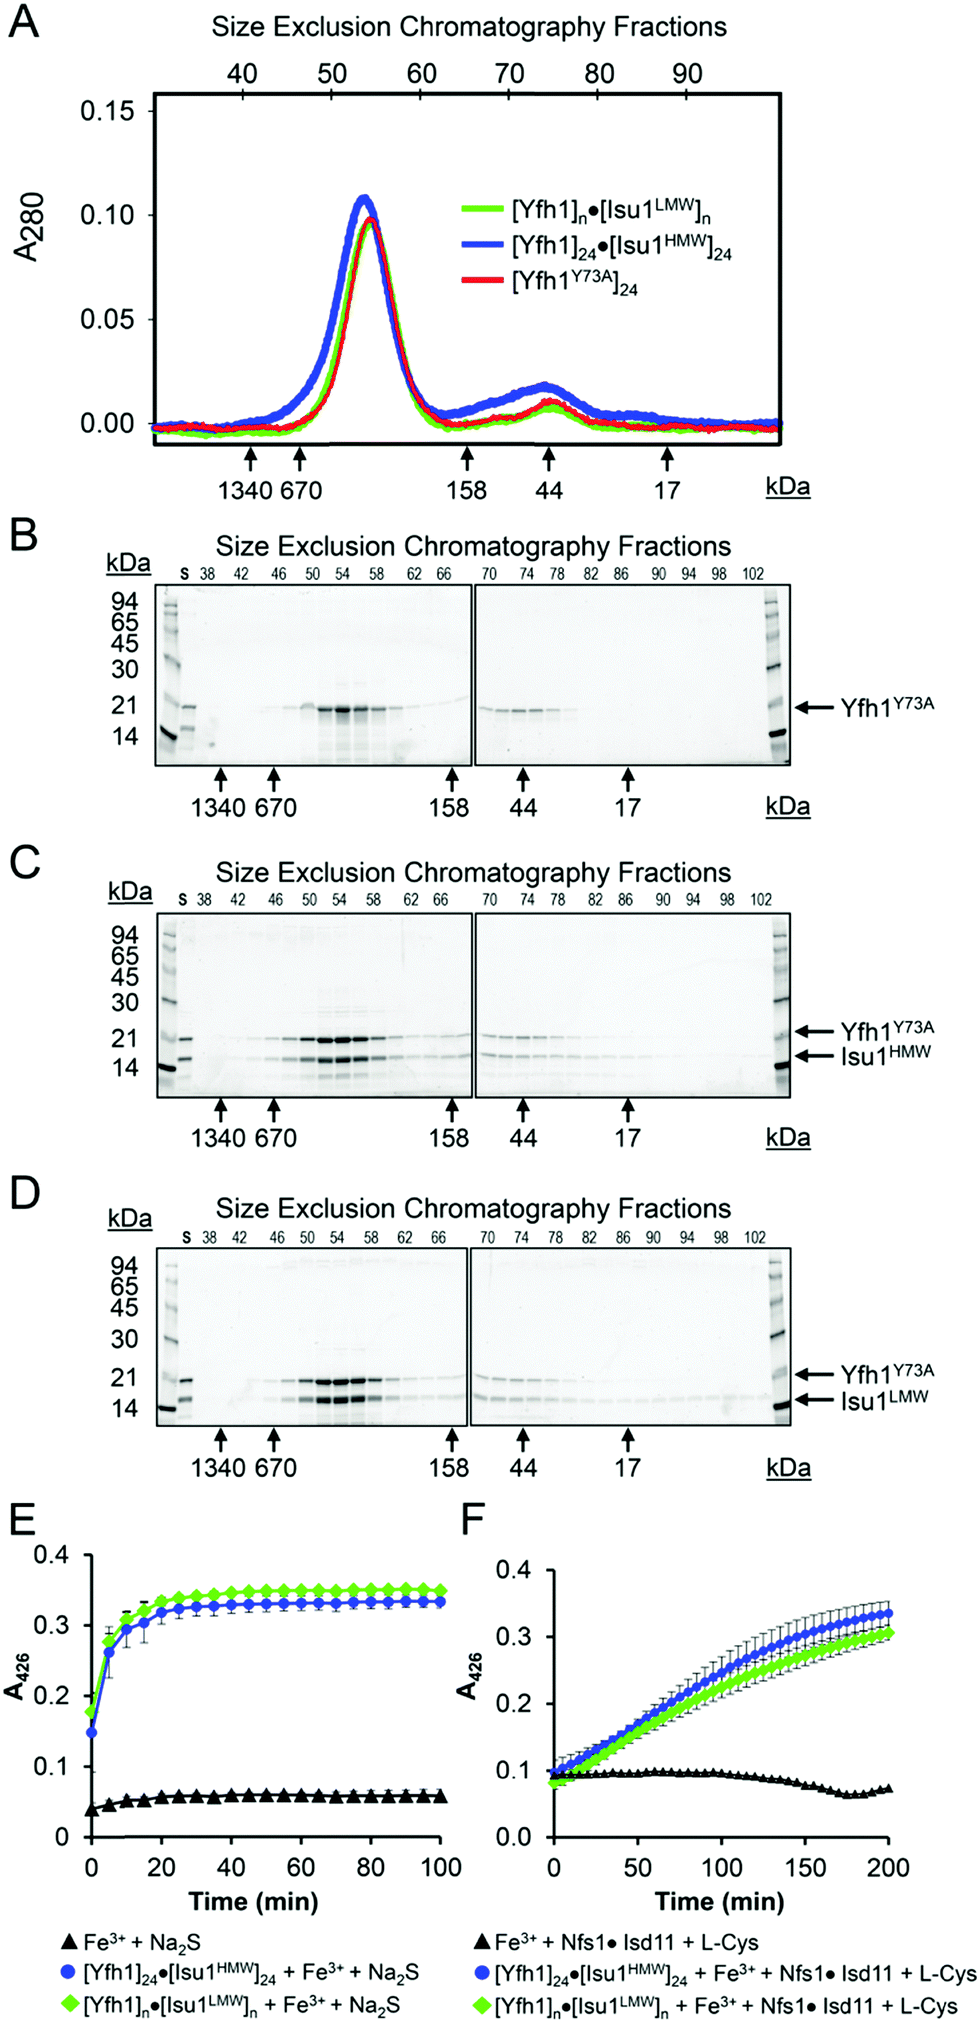 | ||
| Fig. 3 LMW and HMW Isu1 form similar functional complexes with Yfh1Y73A 24-mer. (A) Sephacryl S300 size exclusion chromatography of the Yfh1Y73A oligomer, [Yfh1]24·[Isu1LMW]24 complex, and [Yfh1]24·[Isu1HMW]24 complex. (B–D) An equal volume from each 1 mL fraction eluted from the column was analyzed by SDS-PAGE. (E) The complexes shown in (C and D) were aerobically loaded with 50 μM Fe2+, under conditions known to yield Fe3+-loaded Yfh1. Synthesis of [2Fe–2S] cluster was subsequently measured anaerobically as described in Experimental Methods with Fe3+ provided directly, or as the Fe3+-loaded complex, and with 2.5 mM Na2S as the source of elemental sulfur. Plots show the mean ± S.D. of two independent assays. (F) As in (E), except that 2 mM L-cysteine in the presence of 5 μM [Nfs1]·[Isd11] were used as the source of elemental sulfur. Plots show the mean ± S.D. of three independent assays. Absorbance spectra from 300–600 nm recorded at the end of the reactions in (E and F) and are shown in Fig. S13A and B (ESI†). | ||
SDS-PAGE of the two complexes further suggested that Yfh1 and Isu1 were present in each complex with 1:1 stoichiometry (Fig. 3C and D). To more precisely determine the stoichiometry of the two proteins in each complex, we utilized amino acid analysis. Independent analyses of fraction 53, 54 and 55 yielded almost identical amino acid compositions, the average of which was used in the calculations shown in Table 3. For each complex, we compared the amino acid composition predicted for an Yfh1:Isu1 stoichiometry of 1:1 to the experimentally measured composition, and calculated the variation for each amino acid and the total % variation. The total % variation was <1% for both complexes (Table 3), and increased significantly with other theoretical stoichiometries (not shown). These data were consistent with our previous characterization of the [Yfh1]24·[Isu1HMW]24 complex16 and supported a [Yfh1]n·[Isu1LMW]n complex containing stoichiometric amounts of its two protein components with a 1:1 molar ratio. Based on experimental conditions adapted from earlier studies,57,60 we previously developed an assay to measure the [2Fe–2S] assembly using Fe3+-loaded oligomeric Yfh1, Yfh1Y73A or FXN42–210 as the source of iron, and L-cysteine as a physiological source of reducing equivalents for reduction of Fe3+.24,31,60,95 In these assays, elemental sulfur was provided either directly, as 2.5 mM Na2S, or viaL-cysteine desulfuration catalyzed by [Nfs1]·[Isd11]. After Sephacryl S300 chromatography, the two complexes were aerobically loaded with Fe2+, using well established conditions that promote the conversion of Fe2+ to Fe3+ inside Yfh1 oligomers,43,50–52 and were then tested in Fe–S cluster assembly assays as described above. The two Fe3+-loaded complexes had very similar ability to catalyze the iron–sulfur cluster assembly both in the absence and presence of the sulfur donor (Fig. 3E and F). The UV-visible absorption spectra recorded at the end of each reaction (Fig. S13C and D, ESI†) had features similar to those recently shown for the holo forms of yeast Isu1 and fly IscU, with absorbance inflections between 420 and 450 nm,96 which is characteristic of [2Fe–2S]-bound IscU-type proteins.60,97 The [2Fe–2S] yield estimated at A = 426 nm with an extinction coefficient ε = 8–11 mM−1 cm−1 (ref. 98) indicated ∼70–80% utilization of the initial 50 μM Fe3+ bound to Yfh1 in the [Yfh1]24·[Isu1LMW]24 and [Yfh1]24·[Isu1HMW]24 complexes. We concluded that after L-cysteine mediated reduction of the Yfh1-bound Fe3+, most of the resulting Fe2+ was efficiently transferred from Yfh1 to Isu1, which was consistent with the proximity of iron binding residues of Yfh1 to cluster coordinating residues of Isu1, as shown below. For each complex, the final [2Fe–2S] yield was similar between reactions in which excess sulfur was provided directly as 2.5 mM Na2S, and reactions in which sulfur was provided through the cysteine desulfurase reaction catalyzed by 5.0 μM [NFS1]·[ISD11]. However, the reaction time courses were quite different (Fig. 3E vs. F). These data indicated that the ability to store ferric iron enabled the [Yfh1]24·[Isu1LMW]24 and [Yfh1]24·[Isu1HMW]24 complexes to adjust the rate of iron delivery to the availability of sulfur.
| Amino acid | [Yfh1]24·[Isu1LMW]24 | Yfh1:Isu1 = 1:1 |
[Yfh1]24·[Isu1HMW]24 | Yfh1:Isu1 = 1:1 |
||
|---|---|---|---|---|---|---|
| Experimental composition (number of residues) | Expected composition (number of residues) | Variation | Experimental composition (number of residues) | Expected composition (number of residues) | Variation | |
| The experimental amino acid composition of purified complexes, as determined via amino acid analysis, is compared to the expected compositions assuming a Yfh1:Isu1 molar ratio of 1:1. For each complex, the variation between the experimental and expected number of each amino acid and the total % variation are shown. Sixteen amino acids were quantified; tryptophan and cysteine were degraded by the hydrolysis process, and asparagine and glutamine were detected as aspartic and glutamic acid, respectively.112 |
||||||
| ALA (A) | 17.1 | 17 | −0.1 | 17.2 | 17 | −0.2 |
| ARG (R) | 7.1 | 6 | −1.1 | 7.1 | 6 | −1.1 |
| ASP (D) | 28.8 | 28 | −0.8 | 28.7 | 28 | −0.7 |
| GLU (E) | 29.4 | 27 | −2.4 | 29.7 | 27 | −2.7 |
| GLY (G) | 16.4 | 16 | −0.4 | 16.2 | 16 | −0.2 |
| HIS (H) | 8.8 | 9 | 0.2 | 8.7 | 9 | 0.3 |
| ILE (I) | 12.8 | 15 | 2.2 | 12.8 | 15 | 2.2 |
| LEU (L) | 30.2 | 29 | −1.2 | 30.1 | 29 | −1.1 |
| LYS (K) | 19.6 | 21 | 1.4 | 19.7 | 21 | 1.3 |
| MET (M) | 5.6 | 8 | 2.4 | 5.3 | 8 | 2.7 |
| PHE (F) | 4.6 | 4 | −0.6 | 4.6 | 4 | −0.6 |
| PRO (P) | 16.0 | 16 | 0.0 | 15.9 | 16 | 0.1 |
| SER (S) | 22.8 | 23 | 0.2 | 23.0 | 23 | 0.0 |
| THR (T) | 15.9 | 16 | 0.1 | 16.0 | 16 | 0.0 |
| TYR (Y) | 5.6 | 6 | 0.4 | 5.7 | 6 | 0.3 |
| VAL (V) | 16.5 | 18 | 1.5 | 16.5 | 18 | 1.5 |
| Total amino acids | 257.3 | 259 | 1.7 | 257.1 | 259 | 1.9 |
| Total percent variation | — | — | 0.64 | — | — | 0.74 |
The [Yfh1]24·[Isu1LMW]24 and the [Yfh1]24·[Isu1HMW]24 complexes were consistently eluted from the gel filtration column with a zinc content that was ∼30% and ∼75% higher, respectively, than the initial total zinc content of the two individual components of each complex (Table S2, ESI†). Thus, the two complexes were able to bind low levels of adventitious zinc present in the gel filtration buffer (24 ng mL−1) and were eluted with similar Zn2+/[Yfh1]·[Isu1] heterodimer molar ratios of ∼1.5 and ∼1.6, respectively (Table S2, ESI†). Existing evidence for a common binding site on IscU proteins for both zinc and iron–sulfur clusters7,8 suggested that the increased affinity for zinc reflected at least in part a stabilization of Isu1 and its cluster binding site upon binding to oligomeric Yfh1. The presence of zinc in the two complexes was not of concern, since we had shown that Yfh1–Isu1 interactions are metal-independent,31 and since others had shown that the presence of Zn2+ on IscU does not appreciably influence IscS binding and actually stimulates Fe–S cluster formation on IscU.8
EM single-particle reconstruction of the [Yfh1]n·[Isu1LMW]n complex
Next, we asked if the biochemical and functional similarities between [Yfh1]n·[Isu1LMW]n and [Yfh1]24·[Isu1HMW]24 were correlated with a similar three dimensional architecture. We used negative staining transmission EM and single particle analysis, as described for the [Yfh1]24·[Isu1HMW]24 complex.16 In uranyl acetate-stained preparations of fraction 53, an un-cross-linked [Yfh1]n·[Isu1LMW]n complex was visible as roughly globular shapes of ∼14 nm in length, as well as slightly more elongated shapes of ∼15 nm in length, (Fig. 4A); these dimensions were consistent with the Rh of ∼7 nm measured by dynamic light scattering analysis of fraction 53. We selected ∼4200 particles from 475 images, and used a set of ∼650 best particles to generate reference free class averages with the EMAN2 software package79 (Fig. 4A). In the class averages, there were different recurring shapes (Fig. 4A) suggesting that [Yfh1]n·[Isu1LMW]n adsorbed to the carbon film of the EM grids with different orientations.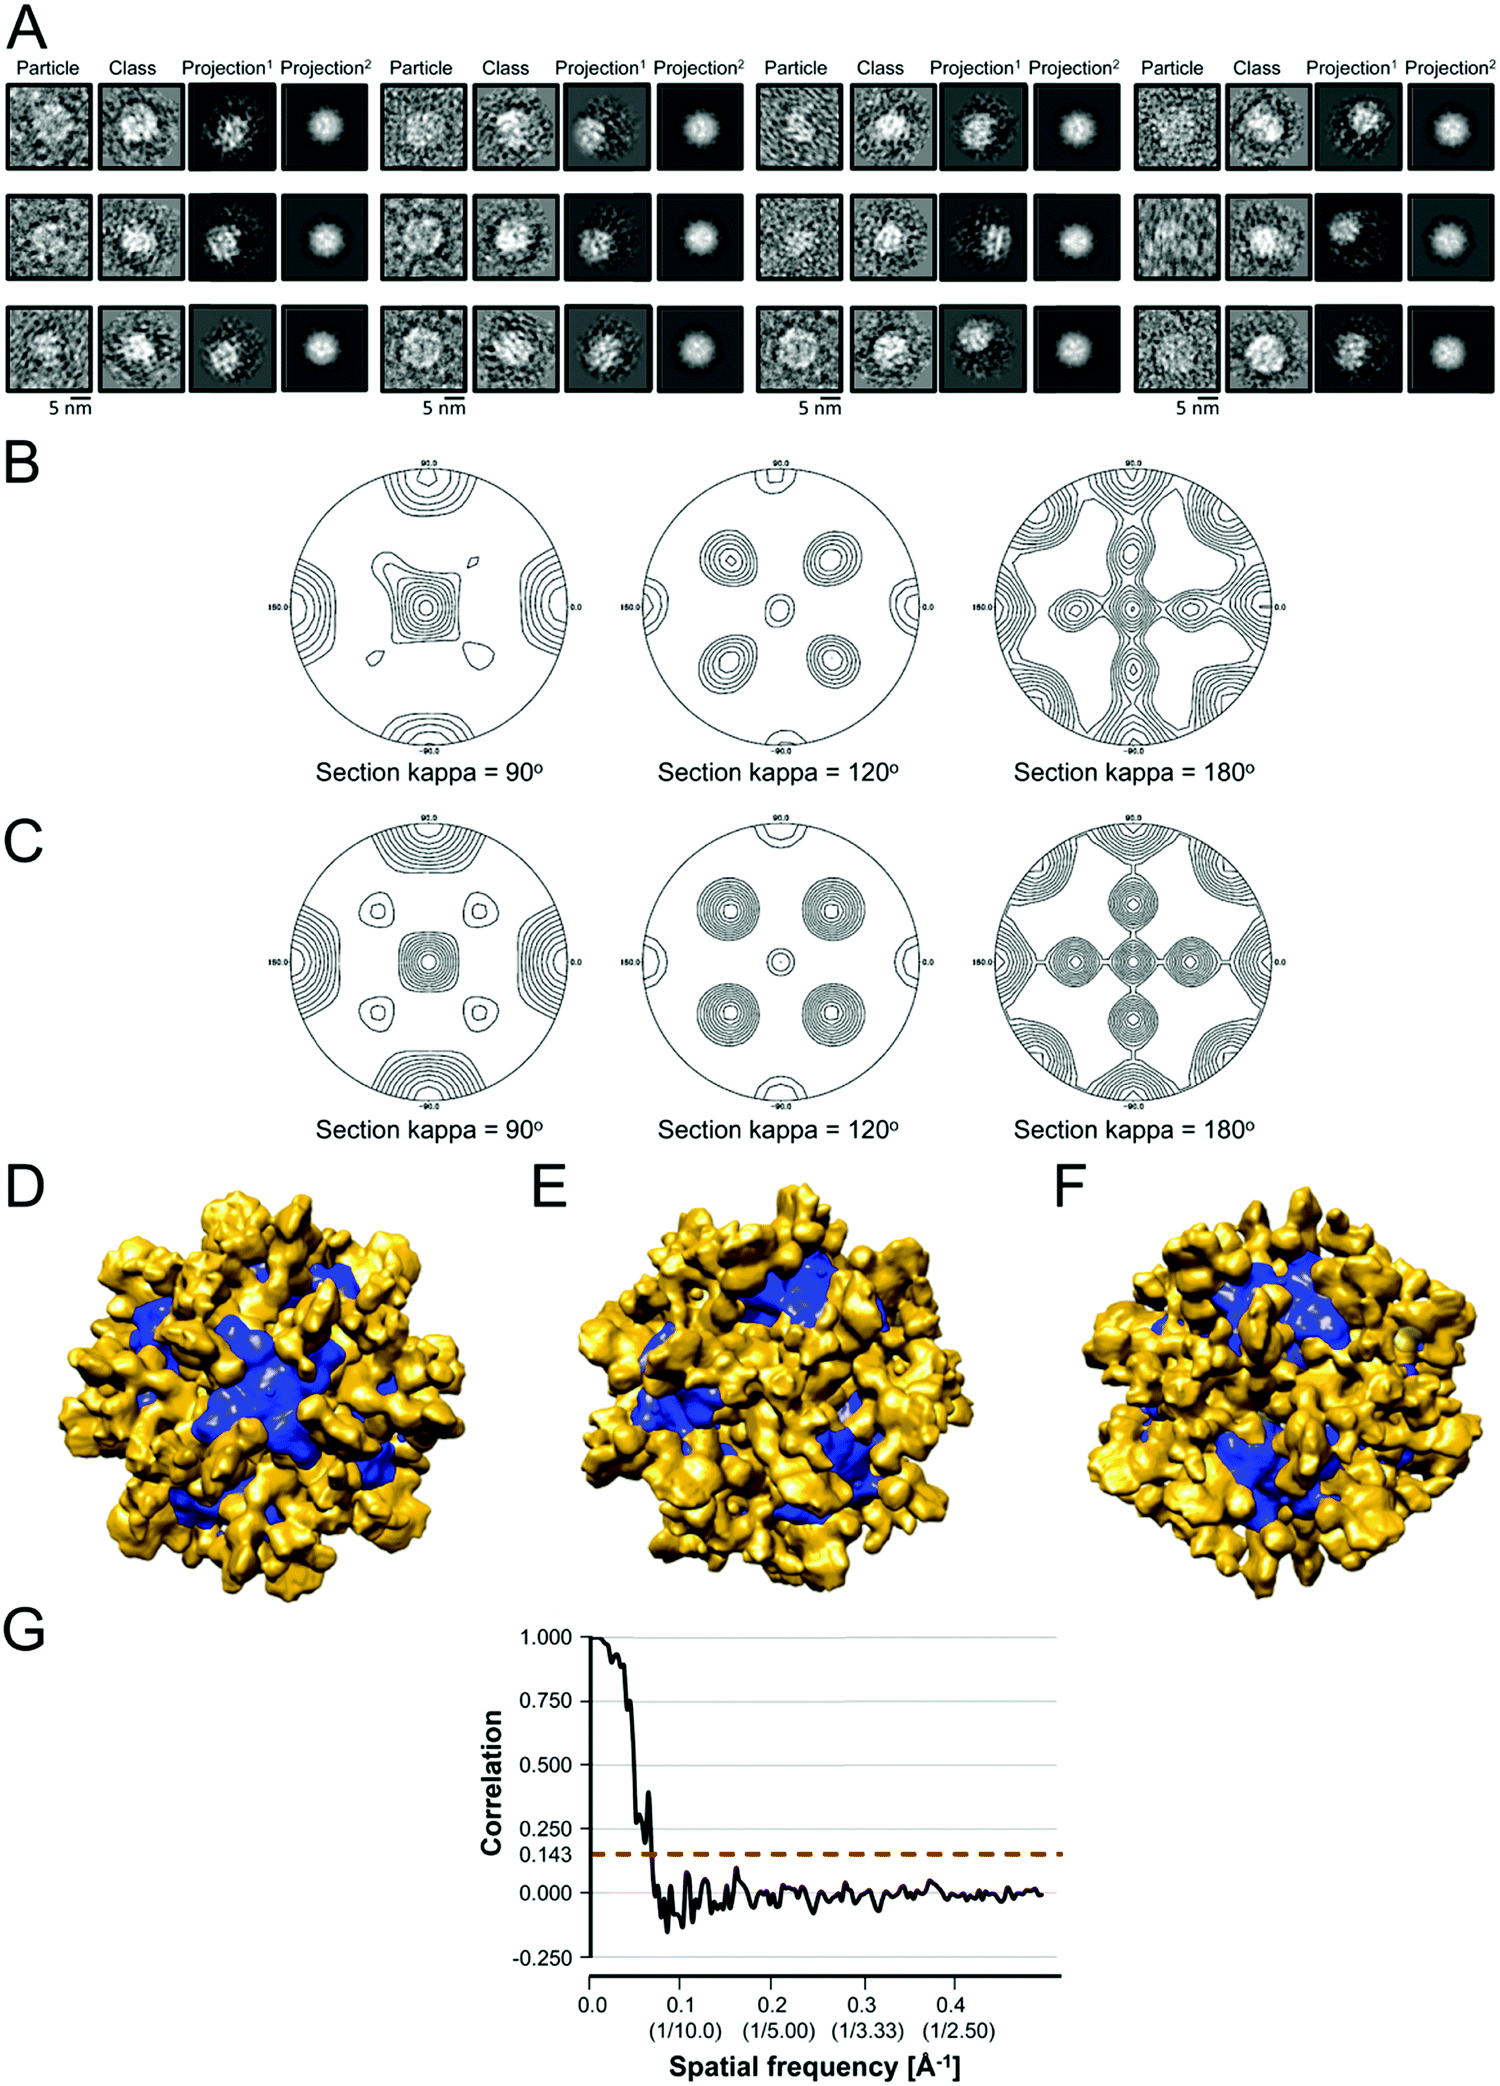 | ||
| Fig. 4 Transmission EM and single particle analysis of the [Yfh1]24·[Isu1LMW]24 complex. (A) Electron micrographs of purified, uranyl acetate-stained complex particles were obtained, and images processed with the EMAN2 software package. Shown is a gallery of class averages, with one representative particle from each class and the corresponding projection of the initial 3D reconstructions without symmetry applied (Projection1 columns) and with 432 symmetry applied (Projection2 columns). Particles, class averages and projections representing the 2-, 3-, and 4-fold axis of the complex and intermediate orientations are shown sequentially from left to right, starting with the top row. The particle diameter was 15.0 ± 0.5 nm (average of 46 particles with 2-fold orientations), 14.8 ± 0.6 nm (average of 40 particles with 3-fold orientations), and 14.7 ± 0.4 nm (average of 39 particles with 4-fold orientations). (B and C) Initial 3D models were generated without imposed symmetry (B) or with 432 symmetry applied (C). Shown are the stereographic projection plots of the Kappa = 90° (4-fold), Kappa = 120° (3-fold), and Kappa = 180° (2-fold) sections of the self-rotation function of the EM density map of the models obtained using POLARRFN. (D–F) Refinement of an initial 3D model with 432 symmetry applied using a set of ∼4124 particles yielded the model shown. The refined model was segmented using Chimera, and the 4-fold (D), 3-fold (E), and 2-fold (F) axes were identified. Volumes around 4-fold and 3-fold axes are colored in blue and gold, respectively. (G) The PDBe server was used to calculate and plot the Fourier shell correlation curve for the refined 3D model shown in (D–F). The dotted red line shows where the curve crosses the correlation value of 0.143. | ||
Since previous three-dimensional reconstructions of the apo-Yfh1Y73A 24-mer49 and the [Yfh1]24·[Isu1HMW]24 complex16 had yielded models with 432 symmetry and roughly cubic shapes, we generated initial 3D models both without symmetry imposed and with 432 symmetry applied. These models had similar globular shapes (not shown). Then, we calculated structure factors from the EM density map of several models and obtained their self-rotation function.80 The data revealed the presence of 432 symmetry in models that had been generated both without and with 432 symmetry applied (Fig. 4B and C). Subsequently, we refined the initial 3D model obtained with 432 symmetry applied using the larger set of ∼4200 particles. Segmentation of the EM density map of the refined model using Chimera82 revealed unique structural features at the 4-, 3-, and 2-fold symmetry axes (Fig. 4D–F). Using the 0.143 cutoff,99 the Fourier shell correlation plot indicated a resolution of 15.6 Å (Fig. 4G). The resolutions obtained with the 3-sigma criterion and the 1/2 bit criterion were 29.4 Å and 28.6 Å, representing the resolutions at which the collected information was significantly above the noise level and sufficient for interpretation.81
The segmented map of the refined 3D model contained eight volumes with similar shape to the Yfh1Y73A trimer (PDB: 3OEQ)83 around the 3-fold symmetry axes (Fig. 4E). After docking eight Yfh1Y73A trimers into the segmented map, we noted nearby unoccupied volumes with similar shape to the Isu1 monomer. Therefore, the homology model of the Isu1 monomer after removal of the flexible N-terminal region (residues 28–61 of Isu1) was used for docking. We docked the Yfh1Y73A trimer and Isu1 monomer sequentially with cross correlation functions of 0.58 and 0.38, respectively. We also docked them assembled in a [Yfh1]3·[Isu1LMW]3 sub-complex, with a cross correlation function of 0.54. Using the latter mode of docking, we were able to fit eight [Yfh1]3·[Isu1LMW]3 sub-complexes into the EM map of the refined 3D model (Fig. 5A and B). Next, guided by cross-linking distances (described in detail later), the N-terminal region of Yfh1 (residues 52–74) was re-positioned. In addition, helix α3, loop L8, and helix α4 of Isu1 were re-positioned, and the Isu1 N-terminal region was modelled on top of the Isu1 monomer. At least four alternative positions of the Isu1 N-terminal region could be modelled inside the EM density map (Fig. 5A and B), each of which was supported by cross-linking data (Fig. 5C–F). We ultimately selected the position that best satisfied the cross-linking distances (denoted by the yellow ribbon in Fig. 5 and subsequent figures). Next we subjected the entire docked structure of the complex (hereinafter designated [Yfh1]24·[Isu1LMW]24) to mild simulation using Molecular Dynamics Flexible Fitting.100,101 The cross-correlation coefficient improved from 0.50 to 0.61, indicating a slightly improved fitting of the simulated [Yfh1]24·[Isu1LMW]24 structure into the EM density map. The relatively low cross correlation reflected the fact that the simulation of the entire complex structure was performed with one of the four possible configurations of the highly flexible N-terminal region of Isu1, such that after the simulation there were still unoccupied volumes in the EM density map (i.e. the volumes occupied by the alternative configurations, as shown in Fig. 5A and B).
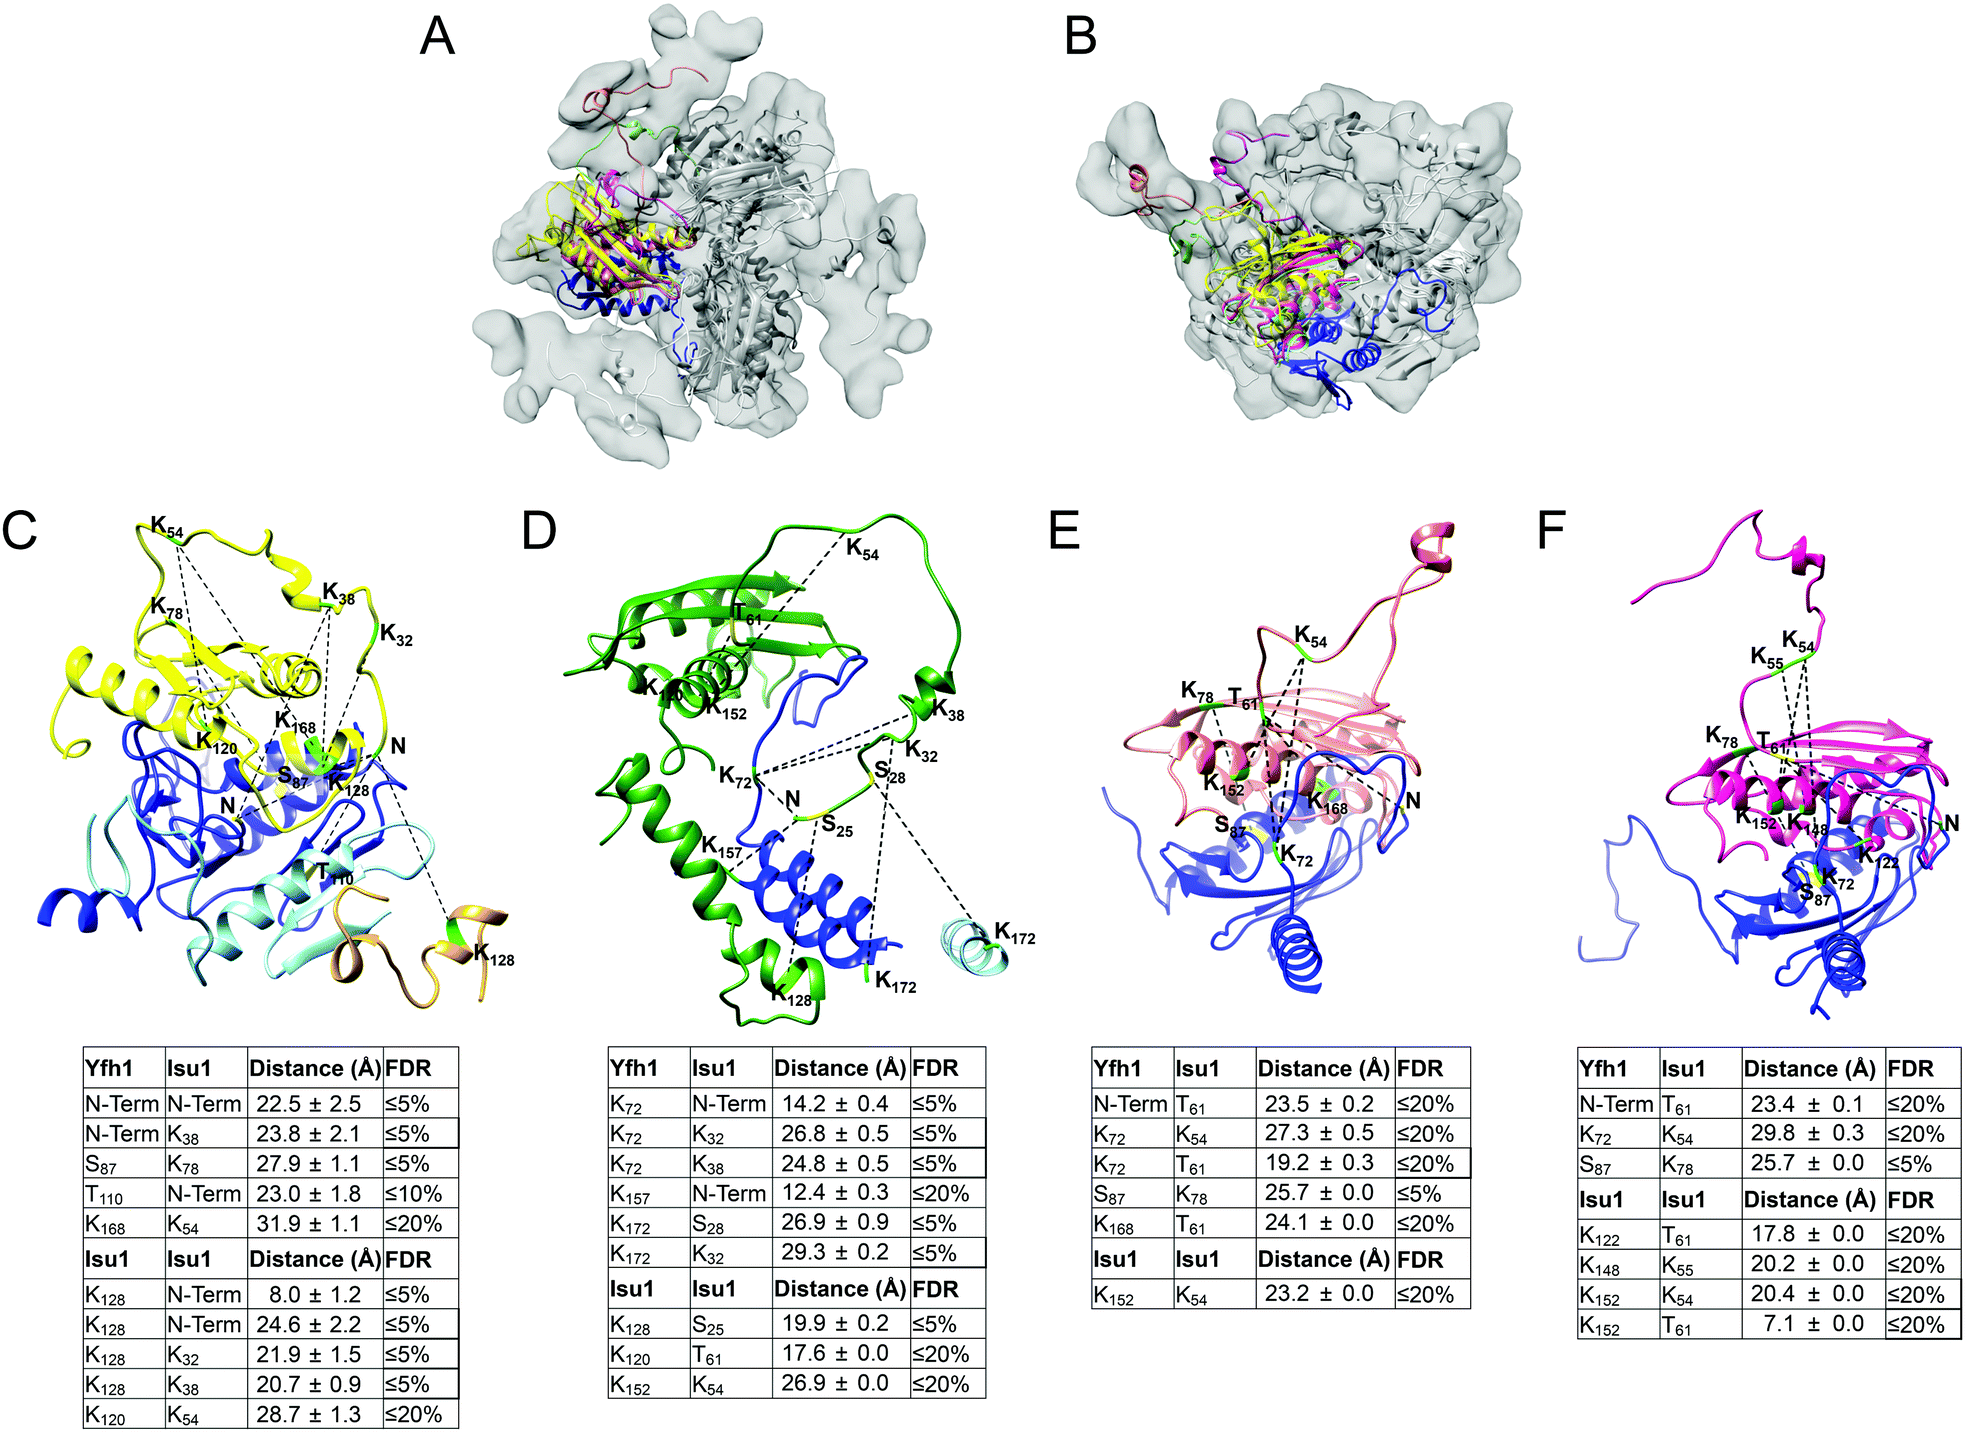 | ||
| Fig. 5 The N-terminal region of LMW Isu1 can adopt different configurations in the EM map of the [Yfh1]24·[Isu1LMW]24 complex. (A and B) The EM map of the refined 3D model of the [Yfh1]24·[Isu1LMW]24 complex was segmented using Chimera. The crystal structure of the Yfh1Y73A trimer (PDB 3OEQ) and a homology model of Isu1 with the N-terminal region removed were docked into their respective volumes. Then, the N-terminal region of Isu1 was modelled back into four different unoccupied volumes guided by cross-linking data. One [Yfh1]3·[Isu1LMW]3 sub-complex is viewed from the top (A) or the side (B). Four Isu1 subunits, each with a different N-terminal configuration, are aligned with each other and are shown as a yellow, green, salmon or magenta ribbon, respectively, with the Yfh1 subunit immediately underneath, shown as a blue ribbon. (C–F) Cross-links that support each of the alternative configurations of the N-terminal region of Isu1 are shown as dotted lines, with cross-linked amino acids highlighted in green (K residues) and yellow (non-K residues). The cross-links are mapped in the structure of two adjacent [Yfh1]3·[Isu1LMW]3 sub-complexes. Yfh1 subunits from the two sub-complexes are shown as blue and light blue ribbons, respectively. Isu1 subunits are shown as a yellow (C), green (D), salmon (E) or magenta (F) ribbon in one sub-complex and as a golden (C) ribbon in the adjacent sub-complex. Only the relevant portions of the structure are shown in each panel. (C–F) The N-terminal configurations denoted by the (C) yellow, (D) green, (E) salmon, and (F) magenta ribbons fulfill the distance constraints or maximum allowable distance constraints set by the Yfh1–Isu1 and Isu1–Isu1 cross-links shown. The table underneath each structure provides the distances between each pair of cross-linked residues shown in the structure, and the False Discovery Rate (FDR) of the corresponding cross-linked peptides. See Table S1 (ESI†) for additional details. | ||
Chemical cross-linking and protein interface analyses of the [Yfh1]24·[Isu1LMW]24 complex
We used cross-linking as an independent means to identify protein–protein interfaces in the [Yfh1]24·[Isu1LMW]24 complex.102 We identified 47 Yfh1–Isu1, 29 Yfh1–Yfh1, and 19 Isu1–Isu1 cross-linked peptides with FDR ≤20% (Table 4 and Table S1, ESI†). An overall FDR ≤20% (corresponding to ≥80% confidence) was reasonable because we were dealing with an in vitro reconstituted complex consisting of stoichiometric amounts of two known and relatively small proteins (123 and 138 amino acids in Yfh1 and Isu1) that generated a limited number of cross-linked peptides by single and double digestion (29 and 71 peptides, respectively), with 66% overlap of identified cross-linked sequences between the two analyses. We determined the agreement of the cross-linked peptides with the distance constraints and maximum allowable distance constraints as a means to probe the three-dimensional structure of the complex (see Experimental methods and the legend of Table S1, ESI† for a description of how these constraints were calculated). When using the distance constraints, 68/100 or 68% of the cross-linked peptides identified were in agreement with the complex structure (Table 4). When using the maximum allowable distance constraints, the agreement increased to 95% (Table 4). To establish these degrees of agreement, we first measured, in the entire [Yfh1]24·[Isu1LMW]24 complex structure, the distances between all possible pairs of cross-linked residues within any given cross-linked peptide (Table S1, ESI†). Then, we identified mean distances equal to, or lower than, the distance constraints; equal to, or lower than, the maximum allowable distance constraints; greater than the maximum allowable distance constraints (highlighted in light gray, dark gray and yellow, respectively, in Table S1, ESI†). Finally, we established that there was agreement between the complex structure and any given cross-linked peptide if at least one of the mean distances measured in the complex structure was within the distance constraints or the maximum allowable distance constraints (Table 4 and Table S1, ESI†). All cross-linked peptides that did not initially support the model structure (5/100) were found to be in agreement once the three alternative configurations of the N-terminal region of Isu1 were considered (Fig. 5D–F). The identified cross-links involved all six K residues of Yfh1 and all 15 K residues of Isu1, as well as the N-terminal amino groups and several S, T and Y residues of both Yfh1 and Isu1 (Table S1, ESI†).| Cross-linked partners | Total unique cross-linked peptides | FDR ≤5% | FDR ≤10% | FDR ≤20% | FDR ≤25% | FDR ≤28% | Cross-linked peptides that support the 3D model based on distance constraints | Cross-linked peptides that support the 3D model based on maximum allowable distance constraints | Cross-linked peptides in disagreement with complex structurea |
|---|---|---|---|---|---|---|---|---|---|
| Cross-linked peptides with false discovery rate (FDR) ≤28% were identified, and the distance constraints and maximum allowable distance constraints between different pairs of cross-linked residues were calculated as described in Experimental Methods. Agreement between the complex structure and any given cross-linked peptide was established as described in Results.a These peptides are in agreement with at least one of the three alternative configurations of the N-terminal region of Isu1 (see Fig. 5D–F). The data summarized in this table are shown in detail in Table S1 (ESI). | |||||||||
| Yfh1–Isu1 | 48 | 22 | 5 | 20 | 1 | 0 | 29 (60%) | 15 (31%) | 4 (8%) |
| Yfh1–Yfh1 | 29 | 24 | 0 | 5 | 0 | 0 | 19 (66%) | 9 (31%) | 1 (3%) |
| Isu1–Isu1 | 23 | 5 | 2 | 12 | 3 | 1 | 20 (87%) | 3 (13%) | NA |
| Total | 100 | 51 | 7 | 37 | 4 | 1 | 68 | 27 | 5 |
| % | 100% | 51% | 7% | 37% | 4% | 1% | 68% | 27% | 5% |
Mapping of the cross-links in the [Yfh1]24·[Isu1LMW]24 complex structure revealed protein–protein interfaces similar to those identified previously by cross-linking analysis of the [Yfh1]24·[Isu1HMW]24 complex.16 To assess this further, coordinate files of the putative active centers,16i.e. formed by two adjacent [Yfh1]3·[Isu1LMW]3 or [Yfh1]3·[Isu1HMW]3 sub-complexes, were extracted from the simulated structures of the two complexes, and were uploaded into the PISA program.103 The PISA Interfaces algorithm was used to identify Yfh1–Isu1, Isu1–Isu1, and Yfh1–Yfh1 interfaces and to obtain their buried surface areas (BSA). A comparison of the PISA identified interfaces between the two active centers is presented in Table 5. The program identified six common interfaces, plus one unique to the [Yfh1]24·[Isu1LMW]24 complex and two unique to the [Yfh1]24·[Isu1HMW]24 complex.16
| Interface | [Yfh1]24·[Isu1LMW]24 | [Yfh1]24·[Isu1HMW]24 | |||||||
|---|---|---|---|---|---|---|---|---|---|
| Buried surface area (Å2) | Residues involved in hydrogen bonding | Residues involved in salt bridges | Residues involved in hydrophobic interactions | Buried surface area (Å2) | Residues involved in hydrogen bonding | Residues involved in salt bridges | Residues involved in hydrophobic interactions | ||
| The coordinate files of the putative active centers (formed by two adjacent [Yfh1]3·[Isu1LMW]3 or [Yfh1]3·[Isu1HMW]3 sub-complexes) were extracted from the structures of the two complexes and uploaded into the PISA program (http://www.ebi.ac.uk/msd-srv/prot_int/cgi-bin/piserver). The PISA Interfaces algorithm was used to identify protein–protein interfaces, their buried surface areas (BSA), and amino acid residues involved in hydrogen bonds, salt bridges or hydrophobic interactions between the two contact surfaces. Residues denoted by an asterisk are not conserved, those in bold are invariant in eukaryotes, and all others are conserved in mammals. | |||||||||
| Yfh1–Isu1 interfaces | |||||||||
| 1 | 1020 ± 73.1 | 1637 ± 82.4 | |||||||
| [Yfh1]·[Isu1] heterodimer (Fig. 9A and D, and ref. 16) | Yfh1: Y119, S134, P135, S137, E165, K168, F116, N140, D160; Isu1: S102, K122, N123, T124, K128, E129, D116, E125 | Yfh1–Isu1: D160–K120, E164*–K120, E165–K128, K168–E125, K172–E129 | Yfh1: G117, T118, Y119, L132, S134, P135, S137, V150, G155 A169, I113, F116, F142, I161, T163, I170; Isu1: A101, S102, V110, T114, A118, I121, T124, I126, A127, L130, L132, P133, P134, V135, I151 | Yfh1: Y119, S134, G155, E165, K168, D86, E90, E93, F116, D160, T163, I170; Isu1: S29, S98, S102, K122, T124, I126, K128, E129, K148, R33, L34, H36, D116 | Yfh1–Isu1: D86–G24*, D86–H26*, E90–H26*, E90–R33, D97*–R33, E148–K120, K157–D116, K157–D117, D160–G24*, D160–K120, E164*–K120, E165–K128, E167*–K32*, E167*–H36, K168–E129 | Yfh1: L91, P96, G117, T118, Y119, L132, S134, P135, S137, V150, G155, L158, L162, A169, H95, I99, L111, I113, F116, I161, T163, I170; Isu1: S29, S98, A101, S102, G108, T114, A118, I121, T124, I126, A127, I130, L132, P133, P134, V135, L137, L34, H36, L115, G125, M141, I151 | |||
| 2 | 717.9 ± 44.9 | 794.5 ± 67.8 | |||||||
| Yfh1–Isu1 interface within the same [Yfh1]3·[Isu1]3 sub-complex (Fig. 9D and ref. 16) | Yfh1: V52, V60; Isu1: C69, K122, N123, V135, K136, L137, H138, C139, K148 | Yfh1–Isu1: E53*–K136, D57*–K122, D57*–K136, E71*–K148 | Yfh1: P62, L68, A73, V150, G155, V52, V60; Isu1: L63, V64, G65, A66, P67, A68, C69, P134, V135, L137, H138, C139, S140, A149 | Yfh1: E53*, S54*, T56*, E64*, E71*, K72*, N146, K157*; Isu1: G65, A66, P67, N123, T124, K136, L137, H138, K148, E144, K155 | Yfh1–Isu1: E53*–K122, E53*–K148, E71*–K152*, E71*–K155 | Yfh1: G58, P62, L68, A73, V52, V60; Isu1: T61, G62, L63, V64, G65, A66, P67, A68, V72, I121, T124, V135, L137, H138, C139, A149, I151 | |||
| 3 | 208.1 ± 7.8 | 206.3 ± 64.2 | |||||||
| Interface between the PVK motif of Isu1 and Yfh1 subunits from two adjacent [Yfh1]3·[Isu1]3 sub-complexes (Fig. 9D and ref. 16) | Yfh1: E93; Isu1: G24*, S131* | Yfh1–Isu1: E93–G24* | Yfh1: L85*, S92*, H95; Isu1: A68, L130, L132, P133, P134, V135, L137, H138 | Yfh1: D57*; Isu1: V135, K136, L137 | NA | Yfh1: G58, V60; Isu1: P67, A68, L132, P133, P134, V135, L137, H138, C139 | |||
| 4 | Not present | 121.1 ± 12.4 | |||||||
| Interface between the Isu1 N-terminal region and one Yfh1 subunit from the adjacent [Yfh1]3·[Isu1]3 sub-complex (not shown) | NA | NA | Yfh1: P96, I99, P100*, P114*, A115*, A169; Isu1: H26*, M27*, S28*, I30*, R33 | ||||||
| Isu1–Isu1 interfaces | |||||||||
| 1 | 348.2 ± 15.2 | 486.9 ± 19.2 | |||||||
| Interface formed by Isu1 subunits at the 3-fold axis of the Isu1 trimer (Fig. 7E and F, and ref. 16) | Isu1a: N159; Isu1b: D116 | NA | Isu1a: S156*, T160*, P161*, T162*, M163*, L164*, S165; Isu1b: S82*, T83*, T114, L115, Y154*, T160*, T162*, M163* | Isu1a: N159; Isu1b: D81, D116 | NA | Isu1a: L56*, P57*, S156*, T160*, P161*, T162*, L164*, S165*; Isu1b: L56*, P57*, S82*, G84, T114, L115, Y154*, T160*, T162*, M163* | |||
| 2 | Not Present | 130.0 ± 0.0 | |||||||
| Interface between the PVK loops of two Isu1 subunits from neighboring [Yfh1]3·[Isu1]3 sub-complexes (Fig. 7C and D, and ref. 16) | NA | Isu1a: P67, A68, V135; Isu1b: P67, A68, V135, L137 | |||||||
| Yfh1–Yfh1 interfaces | |||||||||
| 1 | 566.0 ± 58.4 | 671.8 ± 27.7 | |||||||
| Interface between two Yfh1 subunits of the same Yfh1 trimer (not shown and ref. 16) | Yfh1a: N127, K128, Q129, D143; Yfh1b: N127, K128, R141, R153, N154 | Yfh1a–Yfh1b: E76*–K128, E76*–R141, K128–D143, R153–E76* | Yfh1a: L70*, A73, A77, Y80*, P126, L144*, L145*, W149; Yfh1b: P125, P126*, W131, P135, L136*, S137, G138, P139, L144*, L145*, S151*, L152*, G155 | Yfh1a: V52, D78, K123, Q124, N127, Q129, D143; Yfh1b: Q124, P126, N127, N140, R141, R153, N154, G155 | Yfh1a–Yfh1b: E75*–R153, E76*–R141, E76*–R153, K128–D143, R153–E76*, D78–R141 | Yfh1a: V52, S54*, S55*, A73*, H74*, A77, P126, I130, L144*, L145*, W149; Yfh1b: Y119, P126, S137, G138, P139, V150, G155, F142, L144*, L145*, S151*, L152* | |||
| 2 | 583.8 ± 11.4 | 735.4 ± 58.5 | |||||||
| Interface between two Yfh1 subunits of two neighboring Yfh1 trimers (not shown and ref. 16) | Yfh1a: A115*, T118; Yfh1b: E89, D101, V102, I99, P100* | NA | Yfh1a: C98*, P100*, V108, T110, L111, E112, I113, P114*, A115*, F116, G117, T118, Y119, V120, W131, P135, P139, A133, L136*; Yfh1b: L85, S92, A94*, H95, P96, C98*, I99, P100*, V102, L104, S105*, H106*, E112 | Yfh1a: E89, S92, E93, E103*, L104, S105*; Yfh1b: D101, Y119, E103*, S105*, E112, I113 | Yfh1a–Yfh1b: H106*–E112 | Yfh1a: L81, L85*, S92, A94*, H95, P96, V102, G107, L104 S105*, H106*; Yfh1b: P96, V102, G107, V108, T110, G117, T118, Y119, V120, S134, P135, S92, H95, I99, L104, M109, L111, I113, A133, A94*, C98*, P100*, P114*, A115* | |||
| 3 | 491.7 ± 0.0 | Not present | |||||||
| Interface between the N-terminal regions of two Yfh1 subunits from two neighboring Yfh1 trimers (Fig. 8C and D) | Yfh1a: Q59*, V61*, Q63*; Yfh1b: P62, D57*, V61*, Q63* | NA | Yfh1a: V52, S54*, S55*, G58, V61*, P62, V65*, L66*; Yfh1b: V52, S54*, S55*, T56*, V60, V61*, L66*, H83 | ||||||
Overall architecture of the S. cerevisiae [Yfh1]24·[Isu1LMW]24 complex
The simulated structure of the [Yfh1]24·[Isu1LMW]24 complex comprises 24 subunits of Yfh1 organized into eight symmetric trimers, similar to the previously reported structure of the apo- and holo-Yfh1Y73A 24-mers.49,104 In addition, 24 Isu1 subunits form eight symmetrical trimers bound on top of the eight Yfh1 trimers, and thus the complex consists of eight [Yfh1]3·[Isu1LMW]3 sub-complexes, one at each of the eight vertices of the [Yfh1]24·[Isu1LMW]24 complex (Fig. 6A–D), very similar to the architecture of the [Yfh1]24·[Isu1HMW]24 complex.16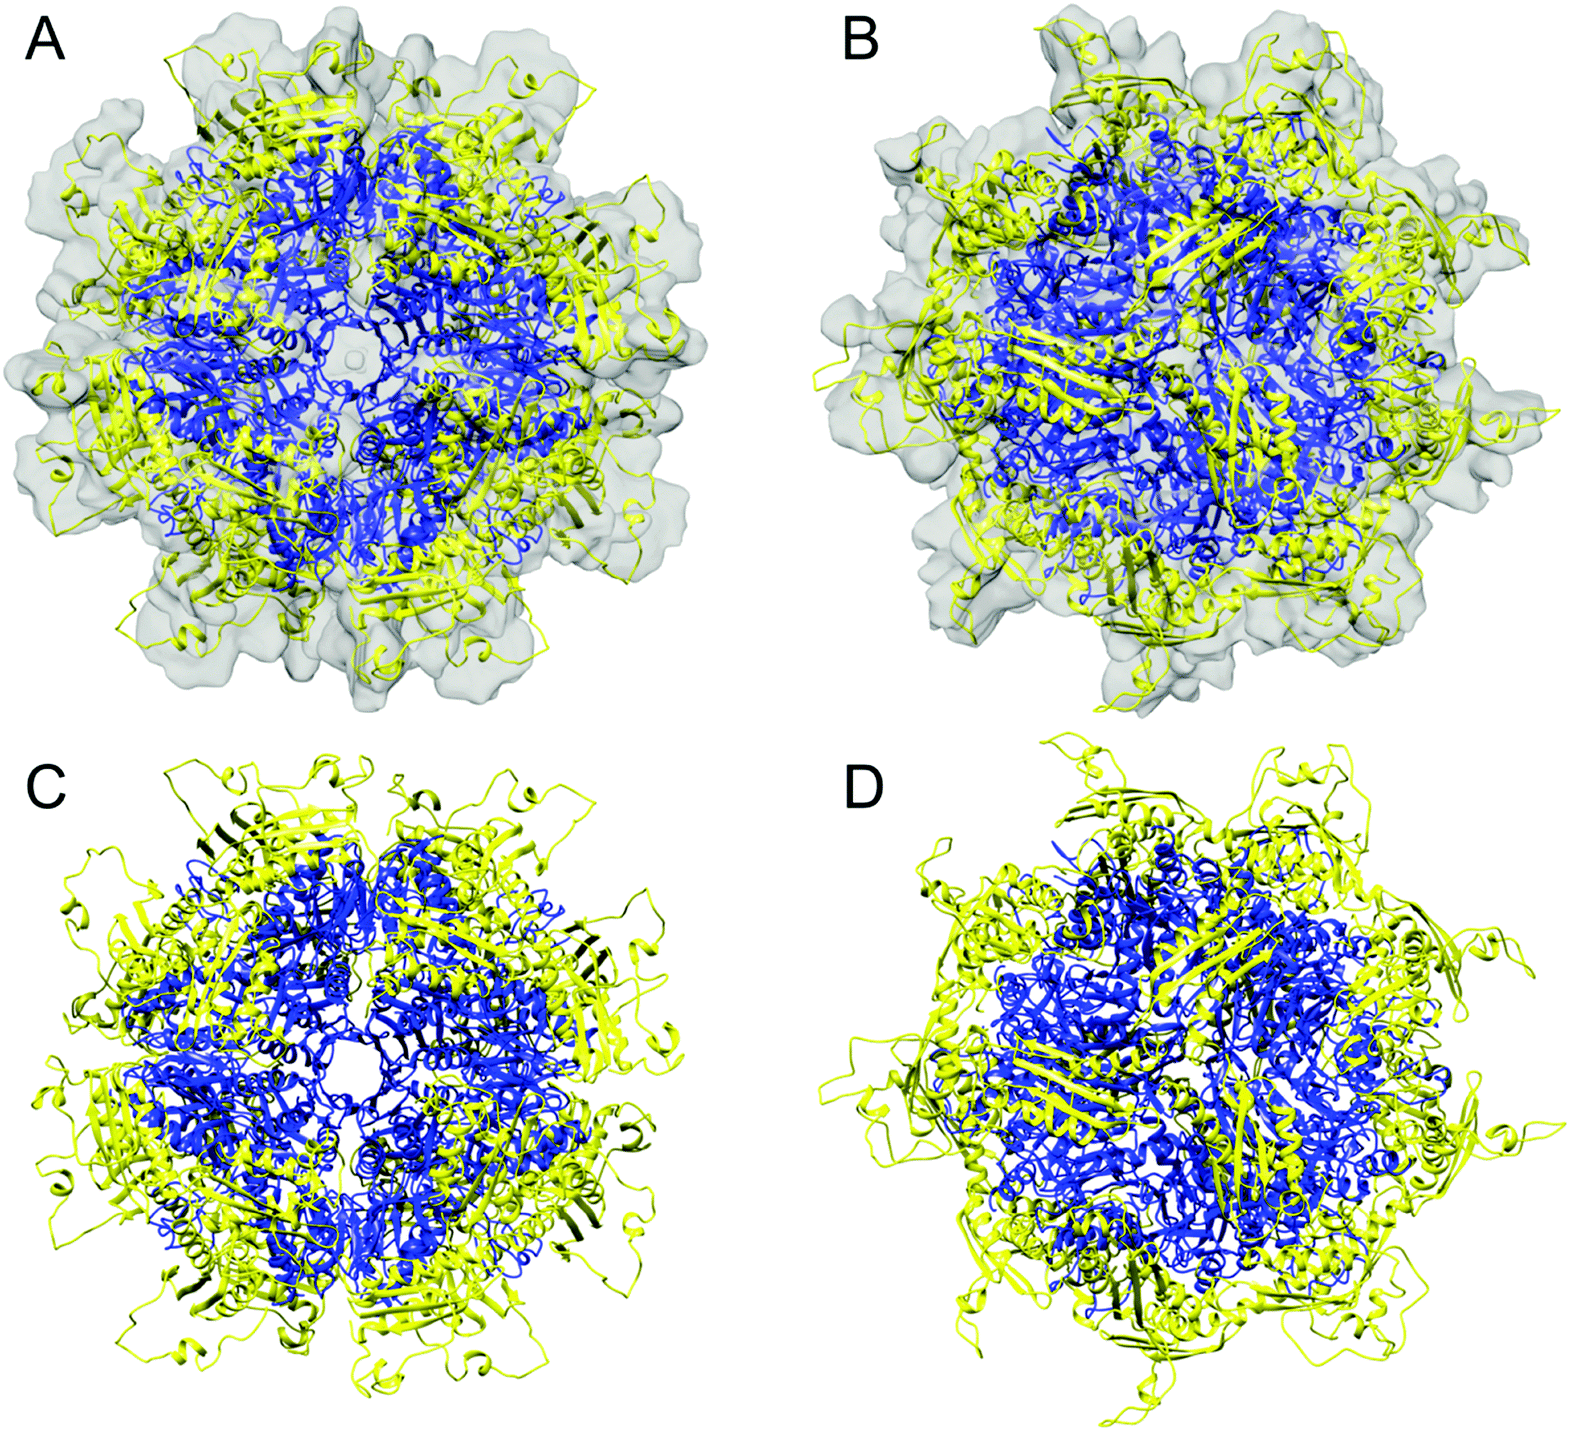 | ||
| Fig. 6 Overall architecture of the [Yfh1]24·[Isu1LMW]24 complex. (A and B) EM map of the refined 3D model of the complex with the simulated and energy minimized structures of 24 Isu1 (yellow ribbon) and 24 Yfh1 (blue ribbon) subunits assembled within eight [Yfh1]3·[Isu1]3 sub-complexes. Shown are the 4-fold (A) and 3-fold (B) axes of the complex. (C and D) as (A and B) with EM map removed. In (A–D) only one Isu1 N-terminal configuration is shown; in (A and B) the volumes occupied by the three alternative configurations of the Isu1 N-terminal regions were removed from the EM map. | ||
A comparison between the two complexes revealed that [Yfh1]24·[Isu1LMW]24 has a rather relaxed structure relative to [Yfh1]24·[Isu1HMW]24 (Fig. 7A vs. B). This can be appreciated in particular at the 2-fold axis formed by two adjacent [Yfh1]3·[Isu1LMW]3 sub-complexes, which we proposed to represent the structural and functional building block of the [Yfh1]24·[Isu1HMW]24 complex16 (Fig. 7A vs. B). The flexible nature of the Isu1 N-terminal region likely contributes to the relaxed structure at the surface of the [Yfh1]24·[Isu1LMW]24 complex. In addition, the two Isu1LMW trimers are rotated ∼5 degrees away from each other such that the two Fe–S cluster assembly centers at the 2-fold axis are separated from each other, different from the tighter configuration of the [Yfh1]24·[Isu1HMW]24 2-fold axis (Fig. 7A vs. B). Here, an interface is formed between residues K136–V135 and L137–K136 between the two Isu1 subunits from the two adjacent Isu1 trimers with BSA of ∼127 Å2 (Fig. 7D). This interface involves the highly conserved PVK motif of Isu1.105 The lack of this interface in [Yfh1]24·[Isu1LMW]24 is supported by PISA interface analysis (Fig. 7C and Table 5), as well as by cross-linking data (Fig. 7G). Moreover, different interfaces are involved in the interactions between the two adjacent Yfh1 trimers at the 2-fold axes of the two complexes (Fig. 8A vs. B, and Table 5), which is also supported by PISA interface analysis (Fig. 8C vs. D) and cross-linking data (Fig. 8E). These interfacial differences result in small differences in the compactness of the putative iron mineralization site of Yfh1 (Fig. 8F vs. G) and in the proposed iron path from Yfh1 to Isu116 (Fig. 8H vs. I).
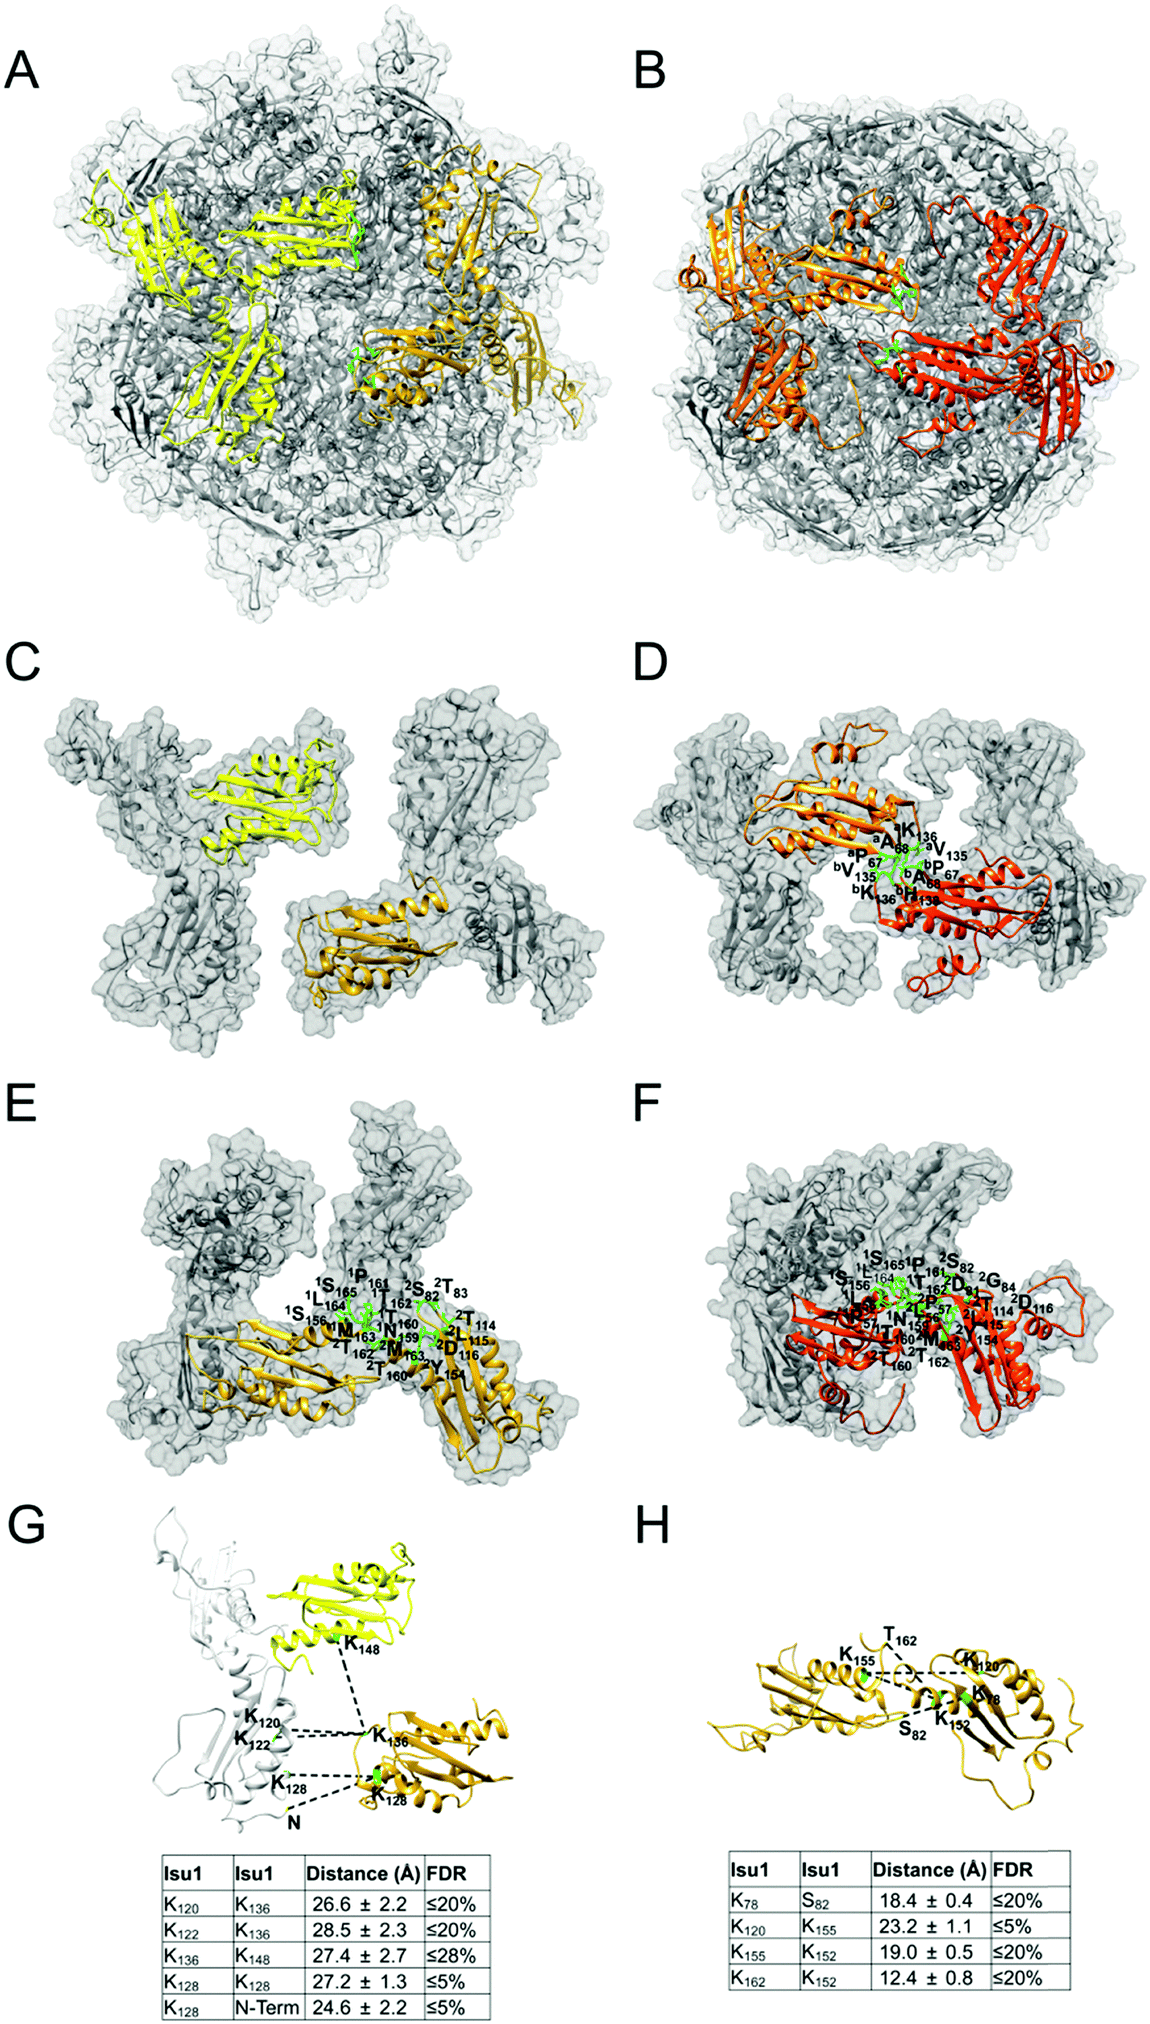 | ||
| Fig. 7 Proposed [2Fe–2S] cluster assembly site of the [Yfh1]24·[Isu1LMW]24 complex. (A) Top view of two Fe–S cluster assembly sites formed by two adjacent [Yfh1]3·[Isu1LMW]3 sub-complexes at the 2-fold axis of the [Yfh1]24·[Isu1LMW]24 complex. Isu1 trimers are shown as yellow and gold ribbons with Fe–S cluster coordinating residues shown as green sticks. (B) The 2-fold axis of the [Yfh1]24·[Isu1HMW]24 complex, with Isu1 trimers shown as light orange and orange ribbons, is shown for a comparison.16 (C) In the [Yfh1]24·[Isu1LMW]24 complex, the PISA program did not identify any interfaces between the two adjacent Isu1 trimers at the 2-fold axis; (D) PISA otherwise identified one interface between the two adjacent Isu1 trimers in the [Yfh1]24·[Isu1HMW]24 complex.16 Conserved residues within this interface, predicted to form hydrophobic interactions, are shown as green sticks (see also Table 5 for additional details). The letters a and b denote the two adjacent Isu1 trimers. (E) In the [Yfh1]24·[Isu1LMW]24 complex, the PISA program identified an interface between two subunits of the same Isu1 trimer around the 3-fold axis. Residues within this interface, predicted to form hydrogen bonds and salt bridges between the two proteins, are shown as green sticks. The numbers 1 and 2 denote different subunits of the same Isu1 trimer. (F) As in (E) for the [Yfh1]24·[Isu1HMW]24 complex16 (see also Table 5 for additional details). (G) The interface shown in (C) fulfills the distance constraints or maximum allowable distance constraints set by the Isu1–Isu1 cross-links shown. (H) The interface shown in (E) fulfills the distance constraints set by the Isu1–Isu1 cross-links shown. The table underneath each structure provides the distances between each pair of cross-linked residues shown in the structure, and the False Discovery Rate (FDR) of the corresponding cross-linked peptides. See Table S1 (ESI†) for additional details. | ||
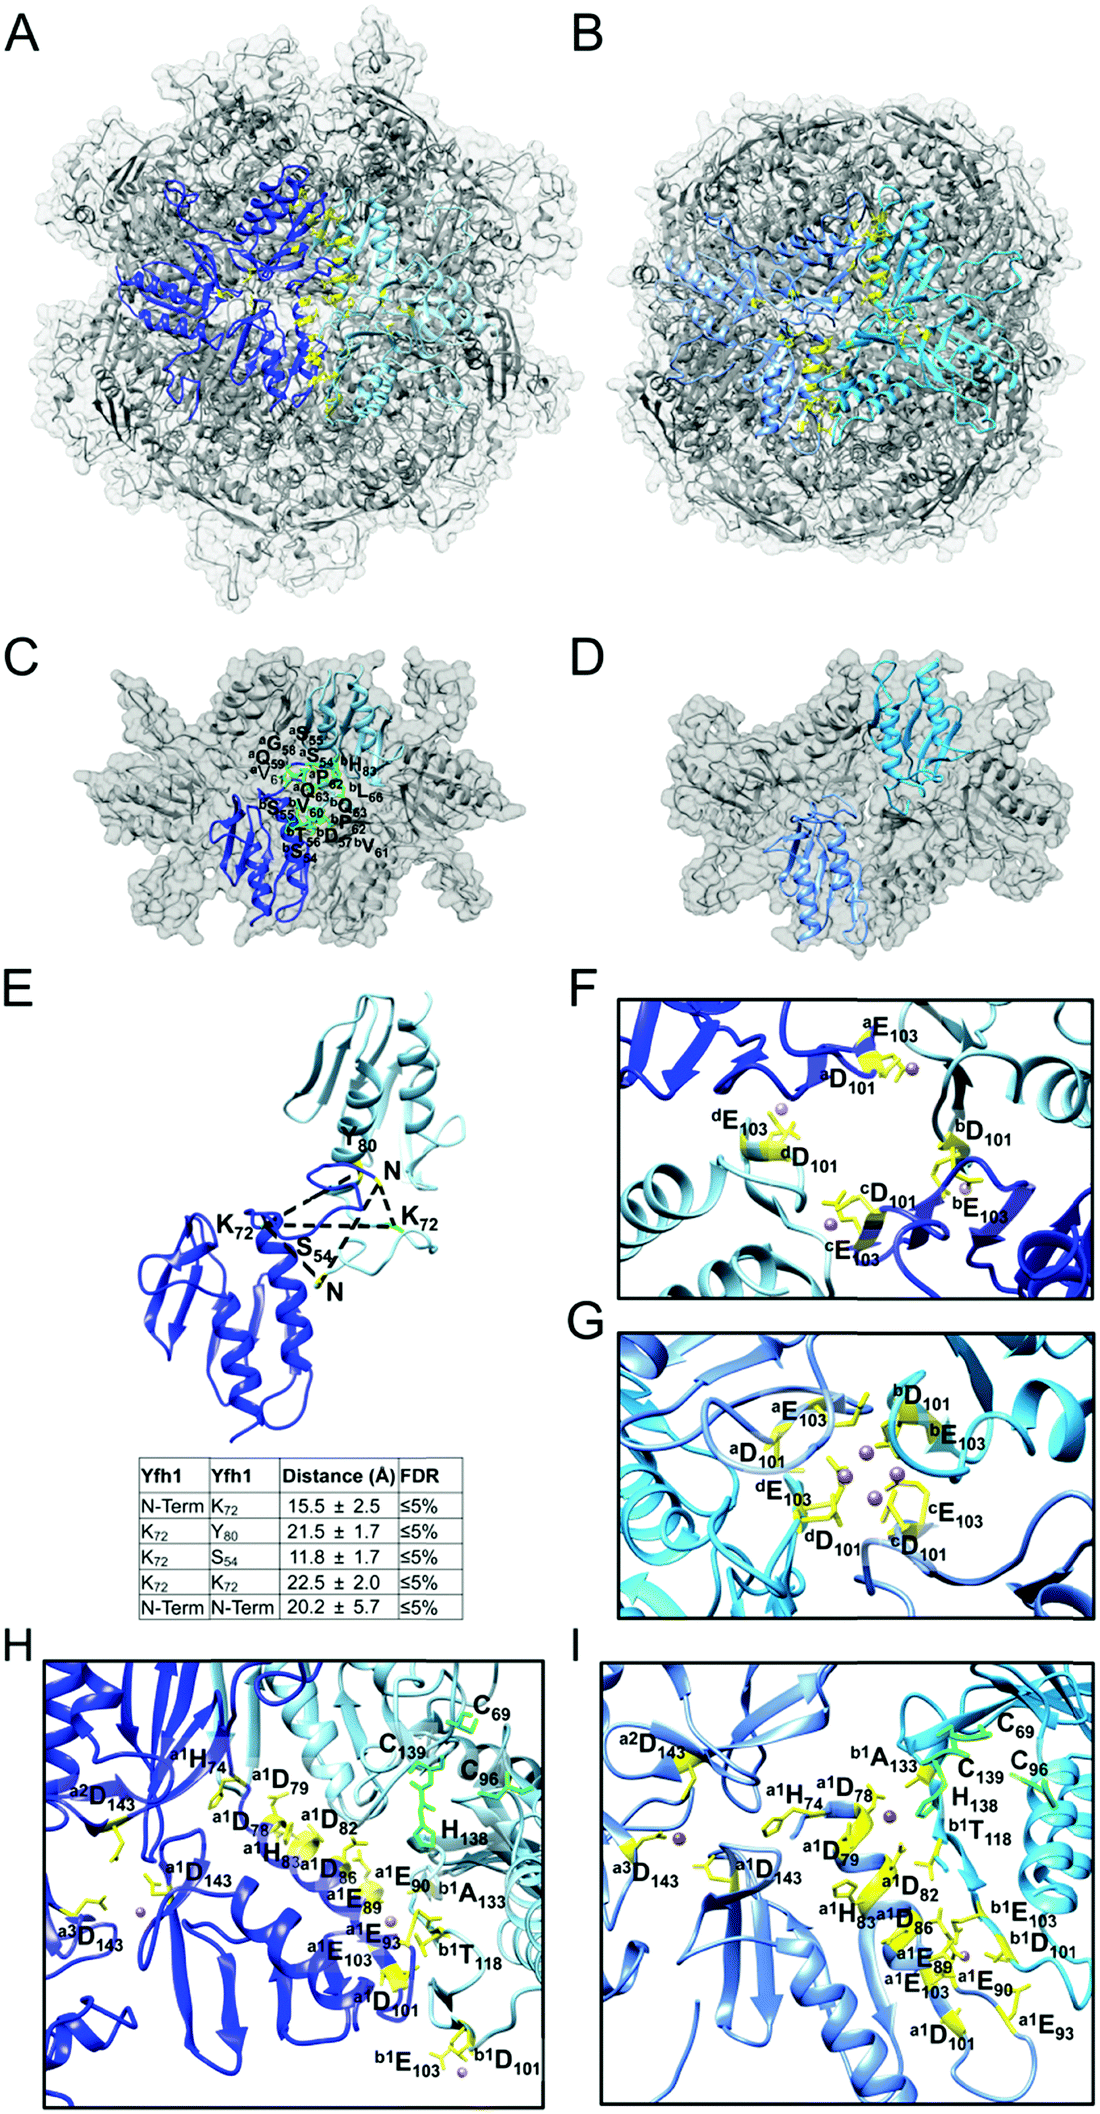 | ||
| Fig. 8 Proposed iron binding sites in the [Yfh1]24·[Isu1LMW]24 complex. (A) Top view of two adjacent Yfh1 trimers at the 2-fold axis of the [Yfh1]24·[Isu1LMW]24 complex. Yfh1 trimers are shown as blue and light blue ribbons with proposed iron coordinating residues shown as yellow sticks. (B) Same as in (A) for the [Yfh1]24·[Isu1HMW]24 complex16 with Yfh1 trimers shown as cornflower blue and deep sky blue ribbons. (C) PISA-identified interface between the two adjacent Yfh1 trimers at the 2-fold axis of the [Yfh1]24·[Isu1LMW]24 complex. Conserved residues within this interface predicted to form hydrogen bonds and hydrophobic interactions are shown as green sticks (see also Table 5 for additional details). The letters a and b denote the two adjacent Yfh1 trimers. (D) The interface shown in (C) is not present in the [Yfh1]24·[Isu1HMW]24 complex. (E) The interface shown in (C) fulfills the distance constraints set by the Yfh1–Yfh1 cross-links shown. The table underneath the structure provides the distances between each pair of cross-linked residues shown in the structure, and the False Discovery Rate (FDR) of the corresponding cross-linked peptides. See Table S1 (ESI†) for additional details. (F) Putative mineralization site at the 4-fold axis of the [Yfh1]24·[Isu1LMW]24 complex formed by four Yfh1 monomers that belong to four different Yfh1 trimers denoted by the letters a, b, c, and d. Iron atoms shown as pink spheres were modelled through alignment of the complex structure with the structure of cobalt-bound CyaY monomer (PDB: 2EFF). (G) As in (F) for the [Yfh1]24·[Isu1HMW]24 complex.16 (H) Top view of the proposed path for iron delivery from Yfh1 to Isu1 in the [Yfh1]24·[Isu1LMW]24 complex. The path is formed by two adjacent Yfh1 trimers at the 2-fold axis as in (A). Three potential iron-binding sites were identified through alignment of the complex structure with the structures of iron-bound Yfh1Y73A trimer (PDB: 2FQL, 4EC2) and cobalt-bound CyaY monomer (PDB: 2EFF). The letters a and b denote two adjacent Yfh1 trimers; the numbers 1, 2, and 3 denote different subunits of trimer a or trimer b. For Isu1, only the Fe–S cluster coordinating residues are shown as green sticks. (I) As in (H) for the [Yfh1]24·[Isu1HMW]24 complex.16 | ||
As determined by PISA analysis of the two complexes (Table 5), the largest Yfh1–Isu1 interface is formed by the [Yfh1]·[Isu1] hetero-dimer, with BSA of ∼1000 and ∼1600 Å2 for the [Yfh1]·[Isu1LMW] and the [Yfh1]·[Isu1HMW] hetero-dimer, respectively. Several conserved residues of Isu1 and Yfh1 in this interface are predicted to form hydrogen bonds, salt bridges and hydrophobic interactions between the two proteins (Table 5 and Fig. 9A vs. B). As shown for the [Yfh1]·[Isu1HMW] hetero-dimer,16 the data suggest that electrostatic interactions play an important role also in the stabilization of the [Yfh1]·[Isu1LMW] hetero-dimer. Here, however, the N-terminal region of Isu1 is only minimally involved in interactions with the acidic patch located on the first α helix of Yfh1 (Fig. 9A), which makes the Yfh1–Isu1 interface significantly smaller as compared to the [Yfh1]·[Isu1HMW] hetero-dimer (Fig. 9B). The Isu1 N-terminal region is also not involved in stabilizing Isu1–Isu1 interactions at the 3-fold axis of each Isu1LMW trimer, which are otherwise observed in the Isu1HMW trimer (Fig. 7E vs. F). These different interfacial locations of the Isu1 N-terminal region are supported by PISA interface analysis and are consistent with cross-linking data (Fig. 7H and 9C).
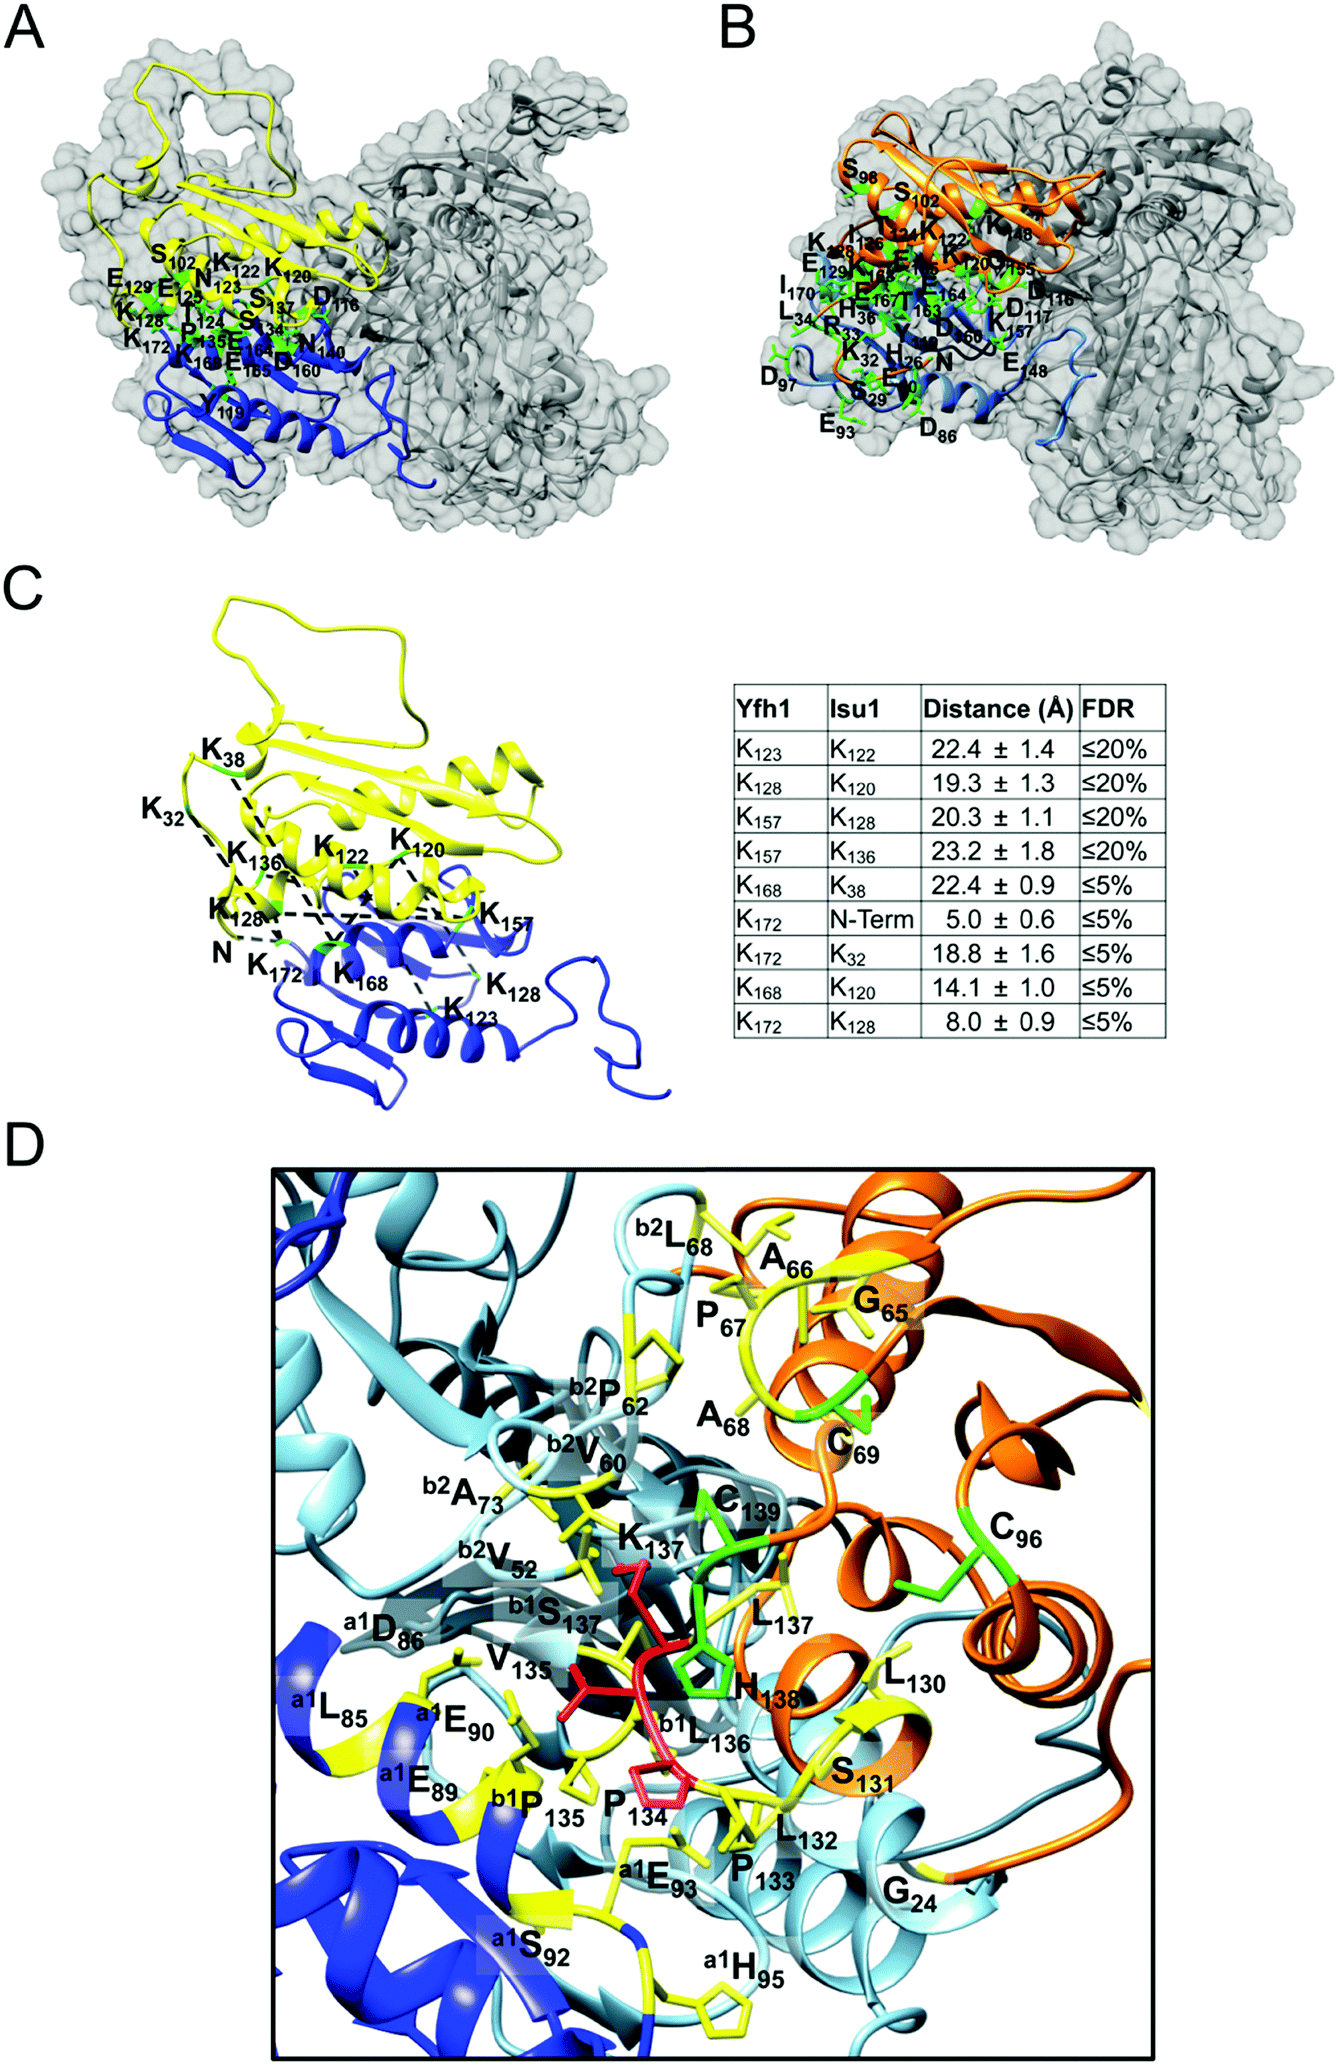 | ||
| Fig. 9 Interface of the [Yfh1]·[Isu1LMW] heterodimer. (A) PISA-identified [Yfh1]·[Isu1] heterodimer interface. Conserved residues within this interface predicted to form hydrogen bonds and salt bridges between the two proteins are shown as green sticks. (B) As in (A) for the [Yfh1]24·[Isu1HMW]24 complex.16 (C) The interface shown in (A) fulfills the distance constraints set by the Yfh1–Isu1 cross-links shown. The table provides the distances between each pair of cross-linked residues shown in the structure, and the False Discovery Rate (FDR) of the corresponding cross-linked peptides. See Table S1 (ESI†) for additional details. (D) The Isu1 flexible loop that contains the highly conserved PVK motif (P134, V135, and K136) is colored in red, and nearby Fe–S cluster coordinating residues are shown as green sticks. The residues, involved in potential hydrophobic and electrostatic interactions between Isu1 and Yfh1 near by the PVK motif, are shown as yellow sticks (see Table 5, interface 1, 2 and 3). The letters a and b denote two adjacent Yfh1 trimers; the numbers 1 and 2 denote two different subunits of trimer a or trimer b. | ||
The PVK motif (P134, V135, and K136) of Isu1 has been shown to be important for Isu1 binding to Yfh1 in yeast.105 This motif resides within a loop close to the Fe–S cluster assembly site of Isu1 (Fig. 9D). Similar to the [Yfh1]24·[Isu1HMW]24 complex,16 in the [Yfh1]24·[Isu1LMW]24 complex, each PVK motif interacts with two Yfh1 subunits within the same [Yfh1]3·[Isu1LMW]3 sub-complex, and with an adjacent Yfh1 subunit from the opposite [Yfh1]3·[Isu1LMW]3 sub-complex (Fig. 9D). However, in the [Yfh1]24·[Isu1LMW]24 complex, the PVK motifs from two adjacent Isu1 subunits are too far to interact with each other (Fig. 7C vs. D).
Discussion
Several studies have reported that iron–sulfur cluster scaffold proteins of the IscU family may exist in monomeric as well as oligomeric states in vitro and in vivo,7,11,12,18,20–24 and a variety of functions have been proposed for known IscU oligomers.9,10,12,14,29,106 However, the structural characterization of these species has been limited and there is currently no consensus on the numbers of protomers present in IscU oligomers, whose size have been reported to vary among organisms from dimer to pentamer to large insoluble species.7,11,12,18,19 The apparent discrepancies among known IscU oligomers are in striking contrast to the high degree of amino acid sequence homology and structural similarity shared by IscU monomers.6,7,12 The findings reported here may help reconcile this apparent dichotomy. We have shown that the S. cerevisiae IscU homologue, Isu1, can exist in two structured states in solution that have markedly different biophysical properties, but together encompass the range of oligomeric forms that have been reported in the literature for IscU proteins from different species. The first state, LMW Isu1, is a monomer–dimer equilibrium with a limited propensity to form higher order oligomers, even at a protein concentration as high as 6 mg mL−1. In contrast, the second state, HMW Isu1, is primarily dimeric at a protein concentration of 1 mg mL−1 and undergoes stepwise oligomerization in a protein concentration-dependent manner, with the majority of the protein existing as trimers and tetramers at the highest concentration tested (6 mg mL−1).We have found that zinc was present at molar ratios of ∼0.07 and ∼0.3 atoms per protomer in HMW and LMW Isu1 respectively. Since others have shown that the binding of zinc at the active site stabilizes IscU monomers,7,8 it is reasonable to assume that zinc is mostly or exclusively bound to the monomeric form of Isu1 in both LMW and HMW Isu1. Thus, based on the EOM analysis of SAXS data showing that HMW and LMW Isu1 contained 25% and 60% monomer, respectively, it is possible to recalculate the molar ratio of zinc per Isu1 monomer. This corresponds to ∼0.1 and ∼1 for HMW and LMW Isu1, respectively. Together with the observation that treatment of LMW Isu1 with EDTA promotes oligomerization, these data suggest that the Isu1 monomer is stabilized by zinc during protein expression in E. coli and that it is the progressive loss of endogenously bound zinc during protein purification that results in the separation between HMW and LMW Isu1. In physiological conditions, zinc is normally present in the mitochondrial matrix107 and may be available for binding during the folding of newly imported and processed Isu1 protein. In living cells, however, free zinc is only available in picomolar concentrations.108 Therefore, sub-stoichiometric concentrations of zinc relative to physiological Isu1 concentrations may exist in vivo, which may lead to an Isu1 monomer–oligomer equilibrium. Oligomeric species of Isu1 have been observed in yeast cells.22 In addition, by fractionation of human cell extracts or yeast mitochondrial extracts we have consistently observed broad distributions of Isu1 or ISCU that did not parallel the distribution of Nfs1 or NFS1.24,48 Therefore, we conclude that Isu1 oligomerization may occur in vivo and that it may be regulated by the availability of zinc.
We have shown that incubation of Yfh1Y73A 24-mer with either LMW or HMW Isu1 results in the formation of [Yfh1]·[Isu1LMW] and [Yfh1]·[Isu1HMW] complexes that are indistinguishable as analyzed by size exclusion chromatography and SDS/PAGE and also exhibit similar ability to catalyze [2Fe–2S] cluster formation and similar affinity for zinc. These functional similarities are consistent with the single particle reconstructions of the complexes. Upon binding to Yfh1, both LMW and HMW Isu1 take on a uniform symmetrical trimeric configuration on top of each of the eight symmetrical trimers that form the Yfh1Y73A 24-mer, which is driven by extensive electrostatic interactions between Isu1 and Yfh1 subunits. Binding of LMW Isu1 to oligomeric Yfh1Y73A places the Fe–S cluster coordinating residues of Isu1 in close proximity to a known iron-binding site of Yfh1 (Fig. 10A and B).45 Moreover, this configuration is suitable for docking of Nfs1 on the [Yfh1]24·[Isu1LMW]24 sub-complex, in a manner that places the sulfur-donor C421 of Nfs1 in close proximity to the sulfur-acceptor C96 of Isu1. Thus, as reported for the human [FXN42–210]24·[ISCU]24·[NFS1]24·[ISD11]24 complex,17 the yeast complex recapitulates the mechanism for sulfur donation from IscS to IscU16 that was initially revealed by the crystallographic structures of bacterial IscS–IscU complexes.37–39 There is, however, an important difference. When a [Nfs1]·[Isd11] or [NFS1]·[ISD11] sub-complex from our structures is aligned with the A. fulgidus [IscS]2·[IscU]2 or E. coli [IscS]·[IscU] complex, Nfs1/NFS1 and IscS overlap each other, whereas Isu1/ISCU is rotated ∼90° relative to IscU on the same plane (Fig. S14, ESI†).16,17 This is a functionally important configuration induced by the binding of the scaffold to oligomeric frataxin, which reduces the distance that must be covered by catalytic C421 on the flexible loop of Nfs1 to reach the acceptor C96 of Isu1 (Fig. 10A and B; Fig. S14A, ESI†).41,42,109 An inability of IscU subunits to oligomerize is otherwise apparent in the context of the A. fulgidus [IscS]2·[IscU]2 or E. coli [IscS]·[IscU] complexes. An inability to oligomerize is also apparent for monomeric frataxin, Cya/Yfh1/FXN81–210, which is thought to bind to a pre-assembled [IscS/Nfs1/NFS1]·[IscU/Isu1/ISCU] sub-complex (which also includes Isd11/ISD11 in the yeast and human systems) in a pocket between the cysteine desulfurase and the scaffold.19,32,40 In contrast, our group has clearly shown here and in previous studies that Isu1/ISCU can bind to oligomeric Yfh1/Yfh1Y73A/FXN42–210, independent of the presence of [Nfs1]·[Isd11] or [NFS1]·[ISD11].16,24,31 Moreover, we have shown here and previously that upon binding to oligomeric frataxin, Isu1/ISCU takes on a uniform symmetrical trimeric configuration on top of each of the eight symmetrical trimers that form the frataxin oligomer.16,17 Finally, it is clear that in the context of our complexes, Isu1/ISCU is able to form trimers when bound to both oligomeric frataxin and Nfs1/NFS1 (Fig. S14, ESI†).16,17 Therefore, we conclude that oligomeric frataxin serves as a platform to reconstitute active cluster assembly sites through recruitment of Isu1/ISCU and pre-assembled [Nfs1]·[Isd11] or [NFS1]·[ISD11] sub-complexes.
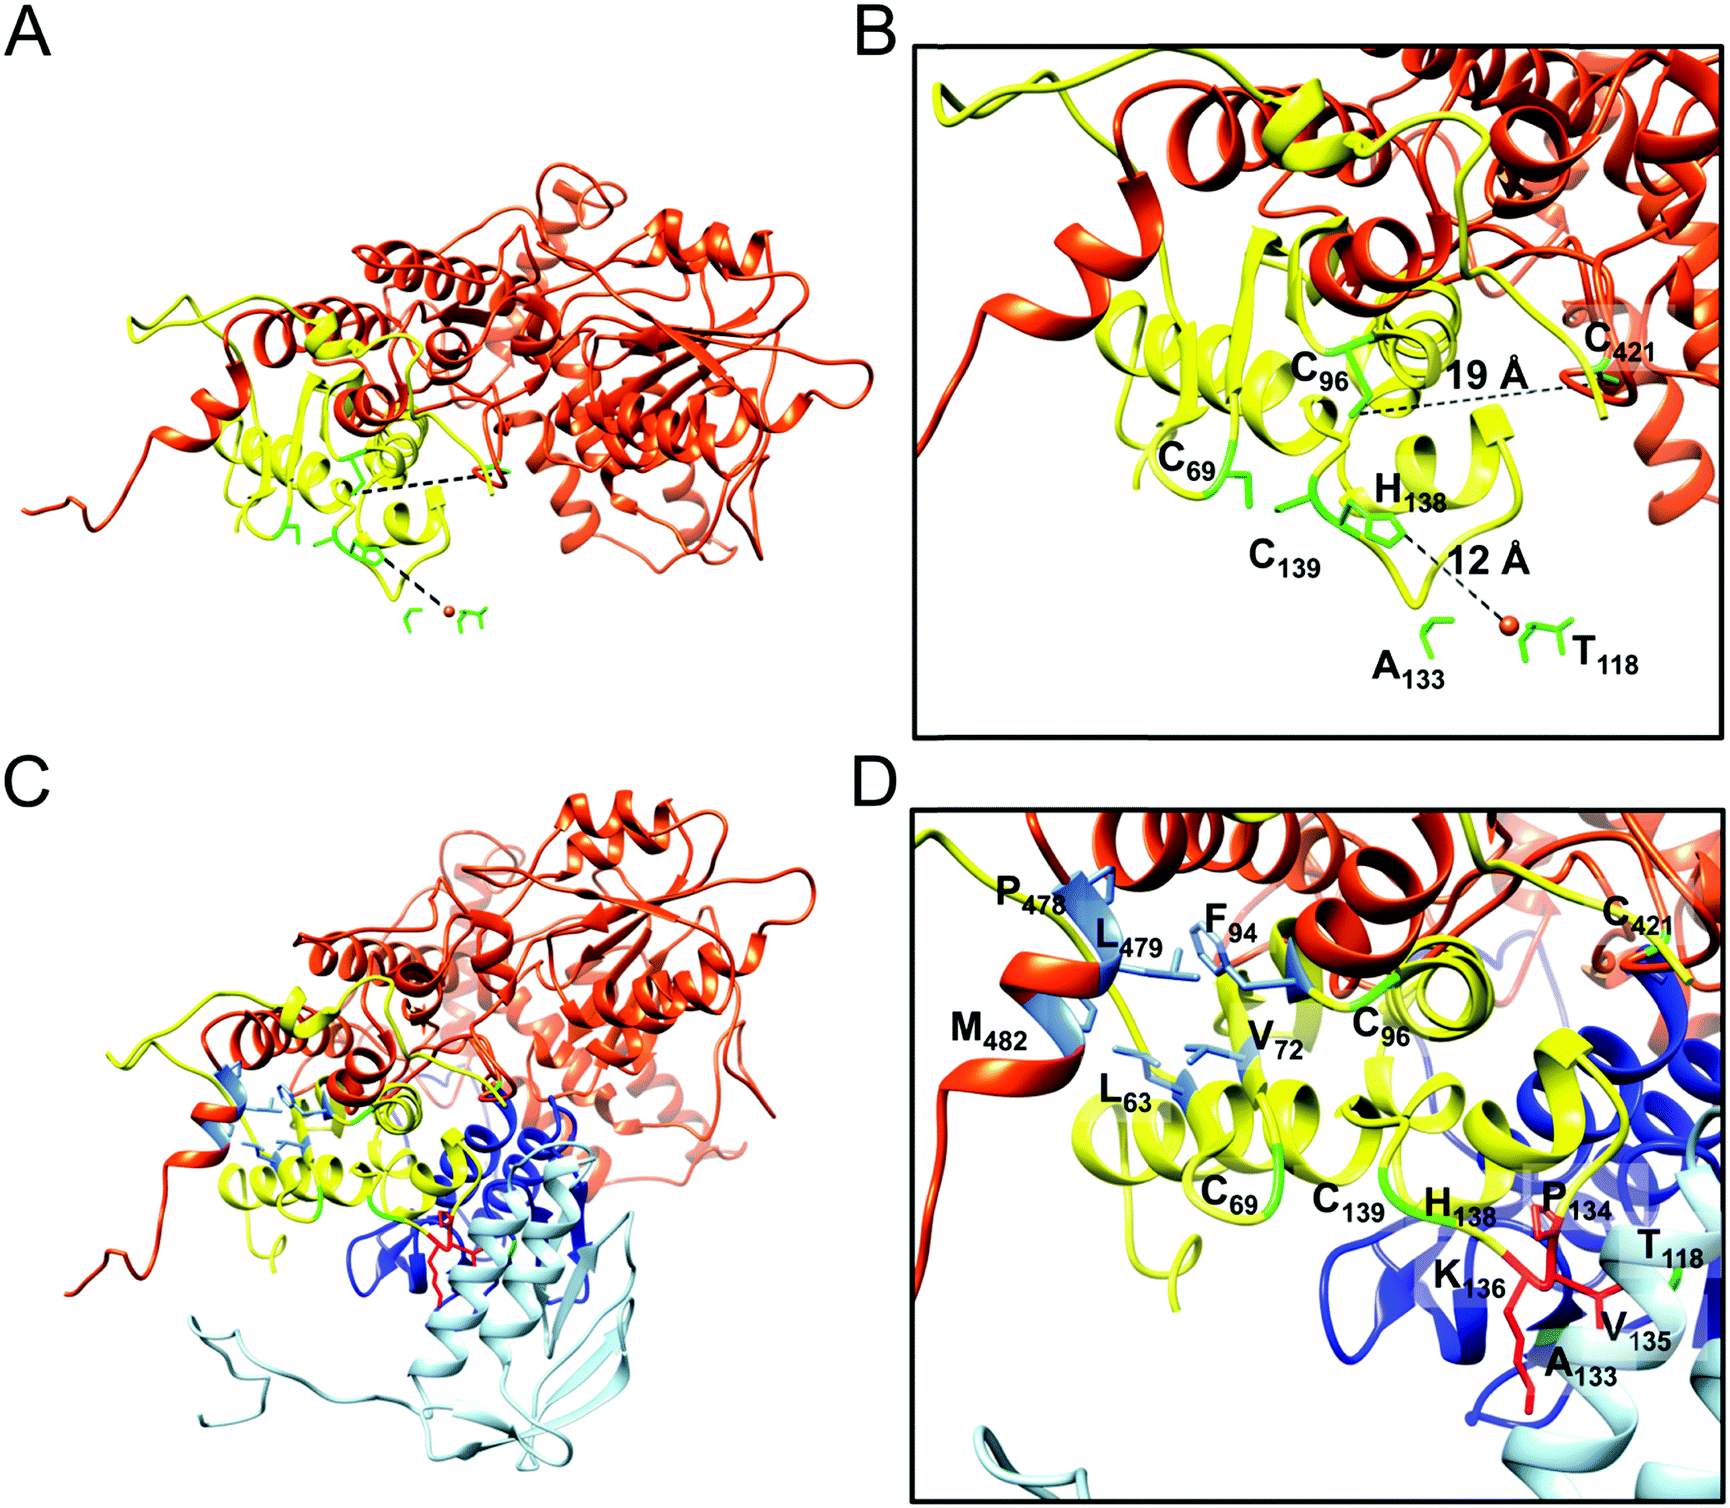 | ||
| Fig. 10 Proposed model of Nfs1 binding to the [Yfh1]24·[Isu1LMW]24 complex and paths for sulfur and iron delivery to Isu1. (A) The [Yfh1]3·[Isu1LMW]3 sub-complex and a homology model of Nfs1 monomer were aligned against the human [FXN42–210]24·[ISCU]24·[NFS1]24 complex (PDB: 5KZ5).17 The previously identified Yfh1 iron-binding site formed by A133 and T11845 was modeled as described in the legend of Fig. 8. (B) Close-up view of (A). Cluster coordinating residues of Isu1 (C69, C96, H138 and C139), catalytic cysteine residue of Nfs1 (C421), and iron binding residues of Yfh1 (A133 and T118)45,49 are shown as a green sticks. Isu1 and Nfs1 are shown as a yellow and an orange ribbon, respectively. (C) Same as (A) with Yfh1 subunits from two adjacent trimers shown as a blue and a light blue ribbon. (D) Close view of (C). The PVK (P134, V135 and K136) motif of Isu1 is colored in red. Hydrophobic residues involved in Isu1–Nfs1 interactions are shown as sky blue sticks. | ||
Some structural differences were observed between [Yfh1]24·[Isu1]24 complexes reconstituted with LMW or HMW Isu1. This suggests that in physiological conditions the zinc-regulated abundance of monomeric vs. oligomeric Isu1 may yield [Yfh1]·[Isu1] complexes with different Isu1 configurations. While our biochemical data suggest that these different Isu1 configurations should not influence the ability to form [2Fe–2S] clusters, our structural data hint that the different Isu1 configurations might afford particular properties. For example, the close proximity of the two [2Fe–2S] cluster binding sites at the 2-fold axis of the [Yfh1]24·[Isu1HMW]24 complex could provide a structural context for the formation of [4Fe–4S] clusters via reductive coupling of two adjacent [2Fe–2S] clusters.14 Another possibility is that the flexible configuration of the Isu1 N-terminal region in the [Yfh1]24·[Isu1LMW]24 complex could be involved in interactions with additional protein partners. Indeed, molecular chaperones Jac1 and Ssq1 are required for Fe–S cluster transfer from Isu1 to apo-proteins. Common Isu1 residues are required for (i) Isu1 binding to Yfh1 or Ssq1 (PVK motif) and (ii) Isu1 binding to Nfs1 or Jac1 (L63, V72 and F94). In the context of monomeric Yfh1, binding of Nfs1 and Jac1 to Isu1 is mutually exclusive and likewise, binding of monomeric Yfh1 and Ssq1 to Isu1 is also mutually exclusive.105,110 In the [Yfh1]24·[Isu1LMW]24 complex, the PVK motif, which resides within a loop close to the Fe–S cluster assembly site of Isu1, interacts with adjacent Yfh1 subunits (Fig. 9D). However, the Isu1–Yfh1 interactions mediated by the PVK motif are clearly not critical for complex stability as the largest Isu1–Yfh1 interface is formed by the [Yfh1]·[Isu1] hetero-dimer (Table 5 and Fig. 9A and D). This interface and the location of the PVK loop at the surface of the complex (Fig. 10D) together suggest that dissociation of Yfh1 from the PVK loop of Isu1 to allow binding of Ssq1 may not necessarily involve the complete dissociation of Isu1 from Yfh1. Moreover, in the structure of the human Fe–S cluster assembly complex reconstituted in bacterial cells from co-expressed FXN42–210, ISCU, NFS1 and ISD11,17 residues L63, V72 and F93 of ISCU (corresponding to L63, V72 and F94 of Isu1) are close to hydrophobic residues of NFS1, including M436, P438, and L439 (corresponding to M482, P478 and L479 of Nfs1), which were shown to be critical for Isu1–Nfs1 interactions.110 In the context of our complex, dissociation of Nfs1 from Isu1 to allow binding of Jac1 may not necessarily involve dissociation of Nfs1 from Yfh1 because Nfs1 can bind to oligomeric Yfh1 or Yfh1Y73A in the absence of Isu1,31 and because this interaction involves an extended interface between each Nfs1 subunit and one Yfh1 subunit immediately underneath (Fig. 10C).16,17 The model shown in Fig. 10B suggests that displacement of the Nfs1 C terminus from the hydrophobic patch on Isu1 may be sufficient to enable Jac1 interaction with Isu1. Our system provides a means to test these interesting hypotheses in future studies to further advance our mechanistic understanding of Fe–S cluster assembly and delivery.
Conclusions
Studies of the bacterial Fe–S cluster assembly system provided structural details for how IscU and IscS interact,37,38 which helped with elucidating a conserved mechanism for sulfur donation from the cysteine desulfurase to the scaffold.41,42,109 Furthermore, a study of the interaction of CyaY with the [IscS]·[IscU] complex led to the current paradigm that monomeric Cya/Yfh1/FXN81–210 binds to a pre-assembled [IscS/Nfs1/NFS1]·[IscU/Isu1/ISCU] sub-complex (which also includes Isd11/ISD11 in the yeast and human systems) in a pocket between the cysteine desulfurase and the scaffold.19,32,40 All of these studies, however, provided no conclusive clues about the mechanism for the delivery of elemental iron to the scaffold. There is currently no consensus as to if and how monomeric CyaY might regulate iron entry to IscU,39 and it is unclear how monomeric FXN81–210 might control iron entry into ISCU, since it is unable to bind iron when bound to the [NFS1]2·[ISD11]4·[ISCU]2 complex.40 In the case of the yeast system, one monomer of Yfh1 was proposed to bind in a pocket between Nfs1 and Isu1 through its iron-binding surface.32,105 However, beyond molecular details of the Yfh1–Isu1 interaction and modeling,32,41 the putative [Nfs1–Isd11–Isu1–Yfh1]2 complex has remained largely uncharacterized structurally and as it pertains in particular to the path for iron delivery to Isu1.96 Consequently, an integrated mechanism for a concerted delivery of sulfur and iron for cluster assembly is lacking.Work from our laboratory has shown that oligomerization is a mechanism by which yeast and human frataxin can promote assembly of the core machinery for Fe–S cluster synthesis both in vitro and in cells, in such a manner that the scaffold protein and the cysteine desulfurase can independently or simultaneously bind to frataxin, the iron donor, with high affinity.24,31 Additional recent studies16,17 and the present work demonstrate that oligomeric frataxin can provide a stable platform to enable coordination and protected delivery of sulfur and iron needed for Fe–S cluster assembly. Moreover, in the present work, oligomerization emerges as a conserved property that enables not only the iron donor, but also the scaffold to establish stable contacts between themselves, and with the cysteine desulfurase to form new Fe–S cluster assembly sites with features that may facilitate cluster delivery to downstream protein partners.
Acknowledgements
We acknowledge Kevin Dyer, Greg Hura and SIBYLS beamline (BL12.3.1) staff at the Advanced Light Source, Lawrence Berkeley National Laboratory, for assisting with collection of the SAXS data. The Mail-in SAXS program is supported in part by the U.S. Department of Energy Office of Biological and Environmental Research and the National Institutes of Health project MINOS (R01GM105404). We thank Drs S. Al-Karadaghi and C. Soderberg (Lund University, Lund, Sweden) for helpful discussions, and Dr M. Ramirez-Alvarado (Mayo Clinic, Rochester, MN, USA) for critical reading of the manuscript. We thank Drs R. Hafner (Characterization Facility, College of Science and Engineering, University of Minnesota) and W. Zang (Department of Diagnostic and Biological Sciences, School of Dentistry, University of Minnesota) for training and assisting in performing transmission EM; B. Madden (Proteomics Core, Mayo Clinic, Rochester, MN) for MS/MS data collection; and Dr S. Ludtke (Baylor College of Medicine) and the EMAN2 Discussion List for helpful suggestions. The EM map of the 3D reconstruction was deposited in the EMDB under the ID EMD-8458; and the atomic model of the simulated structure of the complex fitted to the EM map was deposited in the PDB under the ID 5TRE. This work was supported by a grant from the National Institutes of Health/National Institute on Aging, AG15709.References
- R. Lill and U. Muhlenhoff, Maturation of iron-sulfur proteins in eukaryotes: mechanisms, connected processes, and diseases, Annu. Rev. Biochem., 2008, 77, 669–700 CrossRef CAS PubMed.
- M. Fontecave and S. Ollagnier-de-Choudens, Iron-sulfur cluster biosynthesis in bacteria: Mechanisms of cluster assembly and transfer, Arch. Biochem. Biophys., 2008, 474, 226–237 CrossRef CAS PubMed.
- B. Roche, L. Aussel, B. Ezraty, P. Mandin, B. Py and F. Barras, Reprint of: Iron/sulfur proteins biogenesis in prokaryotes: formation, regulation and diversity, Biochim. Biophys. Acta, 2013, 1827, 923–937 CrossRef CAS PubMed.
- N. Maio and T. A. Rouault, Iron–sulfur cluster biogenesis in mammalian cells: New insights into the molecular mechanisms of cluster delivery, Biochim. Biophys. Acta, 2015, 1853, 1493–1512 CrossRef CAS PubMed.
- U. Muhlenhoff, J. Gerber, N. Richhardt and R. Lill, Components involved in assembly and dislocation of iron–sulfur clusters on the scaffold protein Isu1p, EMBO J., 2003, 22, 4815–4825 CrossRef PubMed.
- J. L. Markley, J. H. Kim, Z. Dai, J. R. Bothe, K. Cai, R. O. Frederick and M. Tonelli, Metamorphic protein IscU alternates conformations in the course of its role as the scaffold protein for iron–sulfur cluster biosynthesis and delivery, FEBS Lett., 2013, 587, 1172–1179 CrossRef CAS PubMed.
- T. A. Ramelot, J. R. Cort, S. Goldsmith-Fischman, G. J. Kornhaber, R. Xiao, R. Shastry, T. B. Acton, B. Honig, G. T. Montelione and M. A. Kennedy, Solution NMR structure of the iron–sulfur cluster assembly protein U (IscU) with zinc bound at the active site, J. Mol. Biol., 2004, 344, 567–583 CrossRef CAS PubMed.
- C. Iannuzzi, M. Adrover, R. Puglisi, R. Yan, P. A. Temussi and A. Pastore, The role of zinc in the stability of the marginally stable IscU scaffold protein, Protein Sci., 2014, 23, 1208–1219 CrossRef CAS PubMed.
- J. N. Agar, L. M. Zheng, V. L. Cash, D. R. Dean and M. K. Johnson, Role of the IscU protein in iron–sulfur cluster biosynthesis: IscS-mediated assembly of a [Fe2S2] cluster in IscU, J. Am. Chem. Soc., 2000, 122, 2136–2137 CrossRef CAS.
- S. Kato, H. Mihara, T. Kurihara, Y. Takahashi, U. Tokumoto, T. Yoshimura and N. Esaki, Cys-328 of IscS and Cys-63 of IscU are the sites of disulfide bridge formation in a covalently bound IscS/IscU complex: implications for the mechanism of iron–sulfur cluster assembly, Proc. Natl. Acad. Sci. U. S. A., 2002, 99, 5948–5952 CrossRef CAS PubMed.
- G. Wu, S. S. Mansy, S. P. Wu, K. K. Surerus, M. W. Foster and J. A. Cowan, Characterization of an iron–sulfur cluster assembly protein (ISU1) from Schizosaccharomyces pombe, Biochemistry, 2002, 41, 5024–5032 CrossRef CAS PubMed.
- Y. Shimomura, K. Wada, K. Fukuyama and Y. Takahashi, The asymmetric trimeric architecture of [2Fe–2S] IscU: implications for its scaffolding during iron–sulfur cluster biosynthesis, J. Mol. Biol., 2008, 383, 133–143 CrossRef CAS PubMed.
- M. W. Foster, S. S. Mansy, J. Hwang, J. E. Penner-Hahn, K. K. Surerus and J. A. Cowan, A mutant human IscU protein contains a stable [2Fe–2S](2+) center of possible functional significance, J. Am. Chem. Soc., 2000, 122, 6805–6806 CrossRef CAS.
- K. Chandramouli, M. C. Unciuleac, S. Naik, D. R. Dean, B. H. Huynh and M. K. Johnson, Formation and properties of [4Fe–4S] clusters on the IscU scaffold protein, Biochemistry, 2007, 46, 6804–6811 CrossRef CAS PubMed.
- C. J. Schwartz, O. Djaman, J. A. Imlay and P. J. Kiley, The cysteine desulfurase, IscS, has a major role in in vivo Fe–S cluster formation in Escherichia coli, Proc. Natl. Acad. Sci. U. S. A., 2000, 97, 9009–9014 CrossRef CAS PubMed.
- W. Ranatunga, O. Gakh, B. K. Galeano, D. Y. Smith IV, C. A. Soderberg, S. Al-Karadaghi, J. R. Thompson and G. Isaya, Architecture of the yeast mitochondrial Iron–Sulfur Cluster assembly machinery: The sub-complex formed by the iron donor, Yfh1, and the scaffold, Isu1, J. Biol. Chem., 2016, 291, 10378–10398 CrossRef CAS PubMed.
- O. Gakh, W. Ranatunga, D. Y. Smith IV, E. C. Ahlgren, S. Al-Karadaghi, J. R. Thompson and G. Isaya, Architecture of the Human Mitochondrial Iron–Sulfur Cluster Assembly Machinery, J. Biol. Chem., 2016, 291, 21296–21321 CrossRef CAS PubMed.
- Y. Shimomura, H. Kamikubo, Y. Nishi, T. Masako, M. Kataoka, Y. Kobayashi, K. Fukuyama and Y. Takahashi, Characterization and crystallization of an IscU-type scaffold protein with bound [2Fe–2S] cluster from the hyperthermophile, aquifex aeolicus, J. Biochem., 2007, 142, 577–586 CrossRef CAS PubMed.
- F. Prischi, P. V. Konarev, C. Iannuzzi, C. Pastore, S. Adinolfi, S. R. Martin, D. I. Svergun and A. Pastore, Structural bases for the interaction of frataxin with the central components of iron–sulphur cluster assembly, Nat. Commun., 2010, 1, 95 CrossRef PubMed.
- S. Adinolfi, F. Rizzo, L. Masino, M. Nair, S. R. Martin, A. Pastore and P. A. Temussi, Bacterial IscU is a well folded and functional single domain protein, Eur. J. Biochem., 2004, 271, 2093–2100 CrossRef CAS PubMed.
- S. S. Mansy, G. Wu, K. K. Surerus and J. A. Cowan, Iron–sulfur cluster biosynthesis. Thermatoga maritima IscU is a structured iron–sulfur cluster assembly protein, J. Biol. Chem., 2002, 277, 21397–21404 CrossRef CAS PubMed.
- S. A. Garland, K. Hoff, L. E. Vickery and V. C. Culotta, Saccharomyces cerevisiae ISU1 and ISU2: members of a well-conserved gene family for iron–sulfur cluster assembly, J. Mol. Biol., 1999, 294, 897–907 CrossRef CAS PubMed.
- J. Gerber, U. Muhlenhoff and R. Lill, An interaction between frataxin and Isu1/Nfs1 that is crucial for Fe/S cluster synthesis on Isu1, EMBO Rep., 2003, 4, 906–911 CrossRef CAS PubMed.
- O. Gakh, T. Bedekovics, S. F. Duncan, D. Y. Smith IV, D. S. Berkholz and G. Isaya, Normal and Friedreich ataxia cells express different isoforms of frataxin with complementary roles in iron–sulfur cluster assembly, J. Biol. Chem., 2010, 285, 38486–38501 CrossRef CAS PubMed.
- R. Yan, G. Kelly and A. Pastore, The scaffold protein IscU retains a structured conformation in the Fe–S cluster assembly complex, ChemBioChem, 2014, 15, 1682–1686 CrossRef CAS PubMed.
- J. H. Kim, M. Tonelli and J. L. Markley, Disordered form of the scaffold protein IscU is the substrate for iron–sulfur cluster assembly on cysteine desulfurase, Proc. Natl. Acad. Sci. U. S. A., 2012, 109, 454–459 CrossRef CAS PubMed.
- S. P. Wu, G. Wu, K. K. Surerus and J. A. Cowan, Iron–sulfur cluster biosynthesis. Kinetic analysis of [2Fe–2S] cluster transfer from holo ISU to apo Fd: role of redox chemistry and a conserved aspartate, Biochemistry, 2002, 41, 8876–8885 CrossRef CAS PubMed.
- D. C. Johnson, M. C. Unciuleac and D. R. Dean, Controlled expression and functional analysis of iron–sulfur cluster biosynthetic components within Azotobacter vinelandii, J. Bacteriol., 2006, 188, 7551–7561 CrossRef CAS PubMed.
- F. Bonomi, S. Iametti, A. Morleo, D. Ta and L. E. Vickery, Facilitated transfer of IscU-[2Fe2S] clusters by chaperone-mediated ligand exchange, Biochemistry, 2011, 50, 9641–9650 CrossRef CAS PubMed.
- M. Adrover, B. D. Howes, C. Iannuzzi, G. Smulevich and A. Pastore, Anatomy of an iron–sulfur cluster scaffold protein: Understanding the determinants of [2Fe–2S] cluster stability on IscU, Biochim. Biophys. Acta, 2015, 1853, 1448–1456 CrossRef CAS PubMed.
- H. Li, O. Gakh, D. Y. Smith IV and G. Isaya, Oligomeric yeast frataxin drives assembly of core machinery for mitochondrial iron–sulfur cluster synthesis, J. Biol. Chem., 2009, 284, 21971–21980 CrossRef CAS PubMed.
- J. D. Cook, K. C. Kondapalli, S. Rawat, W. C. Childs, Y. Murugesan, A. Dancis and T. L. Stemmler, Molecular details of the yeast frataxin-Isu1 interaction during mitochondrial Fe–S cluster assembly, Biochemistry, 2010, 49, 8756–8765 CrossRef CAS PubMed.
- J. Bridwell-Rabb, C. Iannuzzi, A. Pastore and D. P. Barondeau, Effector role reversal during evolution: the case of frataxin in Fe–S cluster biosynthesis, Biochemistry, 2012, 51, 2506–2514 CrossRef CAS PubMed.
- A. Pandey, D. M. Gordon, J. Pain, T. L. Stemmler, A. Dancis and D. Pain, Frataxin directly stimulates mitochondrial cysteine desulfurase by exposing substrate-binding sites, and a mutant Fe–S cluster scaffold protein with frataxin-bypassing ability acts similarly, J. Biol. Chem., 2013, 288, 36773–36786 CrossRef CAS PubMed.
- F. Foury, A. Pastore and M. Trincal, Acidic residues of yeast frataxin have an essential role in Fe–S cluster assembly, EMBO Rep., 2007, 8, 194–199 CrossRef CAS PubMed.
- T. Wang and E. A. Craig, Binding of yeast frataxin to the scaffold for Fe–S cluster biogenesis, Isu, J. Biol. Chem., 2008, 283, 12674–12679 CrossRef CAS PubMed.
- R. Shi, A. Proteau, M. Villarroya, I. Moukadiri, L. Zhang, J. F. Trempe, A. Matte, M. E. Armengod and M. Cygler, Structural basis for Fe–S cluster assembly and tRNA thiolation mediated by IscS protein–protein interactions, PLoS Biol., 2010, 8, e1000354 Search PubMed.
- E. N. Marinoni, J. S. de Oliveira, Y. Nicolet, E. C. Raulfs, P. Amara, D. R. Dean and J. C. Fontecilla-Camps, (IscS–IscU)2 complex structures provide insights into Fe2S2 biogenesis and transfer, Angew. Chem., Int. Ed. Engl., 2012, 51, 5439–5442 CrossRef CAS PubMed.
- B. Blanc, C. Gerez and S. Ollagnier de Choudens, Assembly of Fe/S proteins in bacterial systems: Biochemistry of the bacterial ISC system, Biochim. Biophys. Acta, 2015, 1853, 1436–1447 CrossRef CAS PubMed.
- F. Colin, A. Martelli, M. Clemancey, J. M. Latour, S. Gambarelli, L. Zeppieri, C. Birck, A. Page, H. Puccio and S. Ollagnier de Choudens, Mammalian frataxin controls sulfur production and iron entry during de novo Fe4S4 cluster assembly, J. Am. Chem. Soc., 2013, 135, 733–740 CrossRef CAS PubMed.
- I. Amela, P. Delicado, A. Gomez, E. Querol and J. Cedano, A dynamic model of the proteins that form the initial iron–sulfur cluster biogenesis machinery in yeast mitochondria, Protein J., 2013, 32, 183–196 CrossRef CAS PubMed.
- J. Bridwell-Rabb, N. G. Fox, C. L. Tsai, A. M. Winn and D. P. Barondeau, Human frataxin activates Fe–S cluster biosynthesis by facilitating sulfur transfer chemistry, Biochemistry, 2014, 53, 4904–4913 CrossRef CAS PubMed.
- J. Adamec, F. Rusnak, W. G. Owen, S. Naylor, L. M. Benson, A. M. Gacy and G. Isaya, Iron-dependent self-assembly of recombinant yeast frataxin: implications for Friedreich ataxia, Am. J. Hum. Genet., 2000, 67, 549–562 CrossRef CAS PubMed.
- F. Bou-Abdallah, S. Adinolfi, A. Pastore, T. M. Laue and N. D. Chasteen, Iron binding and oxidation kinetics in frataxin CyaY of Escherichia coli, J. Mol. Biol., 2004, 341, 605–615 CrossRef CAS PubMed.
- C. A. Söderberg, S. Rajan, A. V. Shkumatov, O. Gakh, S. Schaefer, E. C. Ahlgren, D. I. Svergun, G. Isaya and S. Al-Karadaghi, The molecular basis of iron-induced oligomerization of frataxin and the role of the ferroxidation reaction in oligomerization, J. Biol. Chem., 2013, 288, 8156–8167 CrossRef PubMed.
- O. Gakh, D. Y. Smith IV and G. Isaya, Assembly of the iron-binding protein frataxin in Saccharomyces cerevisiae responds to dynamic changes in mitochondrial iron influx and stress level, J. Biol. Chem., 2008, 283, 31500–31510 CrossRef CAS PubMed.
- A. Seguin, R. Sutak, A. L. Bulteau, R. Garcia-Serres, J. L. Oddou, S. Lefevre, R. Santos, A. Dancis, J. M. Camadro, J. M. Latour and E. Lesuisse, Evidence that yeast frataxin is not an iron storage protein in vivo, Biochim. Biophys. Acta, 2010, 1802, 531–538 CrossRef CAS PubMed.
- H. Li, O. Gakh, D. Y. Smith IV, W. K. Ranatunga and G. Isaya, Missense mutations linked to friedreich ataxia have different but synergistic effects on mitochondrial frataxin isoforms, J. Biol. Chem., 2013, 288, 4116–4127 CrossRef CAS PubMed.
- T. Karlberg, U. Schagerlof, O. Gakh, S. Park, U. Ryde, M. Lindahl, K. Leath, E. Garman, G. Isaya and S. Al-Karadaghi, The structures of frataxin oligomers reveal the mechanism for the delivery and detoxification of iron, Structure, 2006, 14, 1535–1546 CrossRef CAS PubMed.
- S. Park, O. Gakh, S. M. Mooney and G. Isaya, The ferroxidase activity of yeast frataxin, J. Biol. Chem., 2002, 277, 38589–38595 CrossRef CAS PubMed.
- S. Park, O. Gakh, H. A. O'Neill, A. Mangravita, H. Nichol, G. C. Ferreira and G. Isaya, Yeast frataxin sequentially chaperones and stores iron by coupling protein assembly with iron oxidation, J. Biol. Chem., 2003, 278, 31340–31351 CrossRef CAS PubMed.
- H. Nichol, O. Gakh, H. A. O'Neill, I. J. Pickering, G. Isaya and G. N. George, Structure of frataxin iron cores: an X-ray absorption spectroscopic study, Biochemistry, 2003, 42, 5971–5976 CrossRef CAS PubMed.
- R. A. Vaubel and G. Isaya, Iron–sulfur cluster synthesis, iron homeostasis and oxidative stress in Friedreich ataxia, Mol. Cell. Neurosci., 2013, 55, 50–61 CrossRef CAS PubMed.
- K. Aloria, B. Schilke, A. Andrew and E. A. Craig, Iron-induced oligomerization of yeast frataxin homologue Yfh1 is dispensable in vivo, EMBO Rep., 2004, 5, 1096–1101 CrossRef CAS PubMed.
- O. Gakh, S. Park, G. Liu, L. Macomber, J. A. Imlay, G. C. Ferreira and G. Isaya, Mitochondrial iron detoxification is a primary function of frataxin that limits oxidative damage and preserves cell longevity, Hum. Mol. Genet., 2006, 15, 467–479 CrossRef CAS PubMed.
- J. D. Cook, K. Z. Bencze, A. D. Jankovic, A. K. Crater, C. N. Busch, P. B. Bradley, A. J. Stemmler, M. R. Spaller and T. L. Stemmler, Monomeric yeast frataxin is an iron-binding protein, Biochemistry, 2006, 45, 7767–7777 CrossRef CAS PubMed.
- K. C. Kondapalli, N. M. Kok, A. Dancis and T. L. Stemmler, Drosophila frataxin: an iron chaperone during cellular Fe–S cluster bioassembly, Biochemistry, 2008, 47, 6917–6927 CrossRef CAS PubMed.
- S. Adinolfi, C. Iannuzzi, F. Prischi, C. Pastore, S. Iametti, S. R. Martin, F. Bonomi and A. Pastore, Bacterial frataxin CyaY is the gatekeeper of iron–sulfur cluster formation catalyzed by IscS, Nat. Struct. Mol. Biol., 2009, 16, 390–396 CAS.
- J. F. Turrens, Mitochondrial formation of reactive oxygen species, J. Physiol., 2003, 552, 335–344 CrossRef CAS PubMed.
- G. Layer, S. Ollagnier-de Choudens, Y. Sanakis and M. Fontecave, Iron–sulfur cluster biosynthesis: characterization of Escherichia coli CyaY as an iron donor for the assembly of [2Fe–2S] clusters in the scaffold IscU, J. Biol. Chem., 2006, 281, 16256–16263 CrossRef CAS PubMed.
- C. L. Tsai and D. P. Barondeau, Human frataxin is an allosteric switch that activates the Fe–S cluster biosynthetic complex, Biochemistry, 2010, 49, 9132–9139 CrossRef CAS PubMed.
- J. Gerber, K. Neumann, C. Prohl, U. Muhlenhoff and R. Lill, The yeast scaffold proteins Isu1p and Isu2p are required inside mitochondria for maturation of cytosolic Fe/S proteins, Mol. Cell. Biol., 2004, 24, 4848–4857 CrossRef CAS PubMed.
- S. A. Knight, N. B. Sepuri, D. Pain and A. Dancis, Mt-Hsp70 homolog, Ssc2p, required for maturation of yeast frataxin and mitochondrial iron homeostasis, J. Biol. Chem., 1998, 273, 18389–18393 CrossRef CAS PubMed.
- S. S. Branda, P. Cavadini, J. Adamec, F. Kalousek, F. Taroni and G. Isaya, Yeast and human frataxin are processed to mature form in two sequential steps by the mitochondrial processing peptidase, J. Biol. Chem., 1999, 274, 22763–22769 CrossRef CAS PubMed.
- G. L. Ellman, Tissue sulfhydryl groups, Arch. Biochem. Biophys., 1959, 82, 70–77 CrossRef CAS PubMed.
- P. W. Riddles, R. L. Blakeley and B. Zerner, Reassessment of Ellman's reagent, Methods Enzymol., 1983, 91, 49–60 CAS.
- G. L. Hura, A. L. Menon, M. Hammel, R. P. Rambo, F. L. Poole, 2nd, S. E. Tsutakawa, F. E. Jenney, Jr., S. Classen, K. A. Frankel, R. C. Hopkins, S. J. Yang, J. W. Scott, B. D. Dillard, M. W. Adams and J. A. Tainer, Robust, high-throughput solution structural analyses by small angle X-ray scattering (SAXS), Nat. Methods, 2009, 6, 606–612 CrossRef CAS PubMed.
- P. V. Konarev, M. V. Petoukhov, V. V. Volkov and D. I. Svergun, ATSAS 2.1, a program package for small-angle scattering data analysis, J. Appl. Crystallogr., 2006, 39, 277–286 CrossRef CAS.
- P. V. Konarev, V. V. Volkov, A. V. Sokolova, M. H. J. Koch and D. I. Svergun, PRIMUS: a Windows PC-based system for small-angle scattering data analysis, J. Appl. Crystallogr., 2003, 36, 1277–1282 CrossRef CAS.
- M. V. Petoukhov, P. V. Konarev, A. G. Kikhney and D. I. Svergun, ATSAS 2.1 – towards automated and web-supported small-angle scattering data analysis, J. Appl. Crystallogr., 2007, 40, S223–S228 CrossRef CAS.
- H. D. T. Mertens and D. I. Svergun, Structural characterization of proteins and complexes using small-angle X-ray solution scattering, J. Struct. Biol., 2010, 172, 128–141 CrossRef CAS PubMed.
- D. I. Svergun, M. V. Petoukhov and M. H. Koch, Determination of domain structure of proteins from X-ray solution scattering, Biophys. J., 2001, 80, 2946–2953 CrossRef CAS PubMed.
- V. V. Volkov and D. I. Svergun, Uniqueness of ab initio shape determination in small-angle scattering, J. Appl. Crystallogr., 2003, 36, 860–864 CrossRef CAS.
- P. Bernado, E. Mylonas, M. V. Petoukhov, M. Blackledge and D. I. Svergun, Structural characterization of flexible proteins using small-angle X-ray scattering, J. Am. Chem. Soc., 2007, 129, 5656–5664 CrossRef CAS PubMed.
- D. Svergun, C. Barberato and M. H. J. Koch, CRYSOL – A program to evaluate X-ray solution scattering of biological macromolecules from atomic coordinates, J. Appl. Crystallogr., 1995, 28, 768–773 CrossRef CAS.
- D. I. Svergun, M. H. Koch, P. A. Timms and R. P. May, Small Angle X-Ray and Neutron Scattering from Solutions of Biological Macromolecules, Oxford Universiry Press, New York, NY, 2013 Search PubMed.
- R. P. Rambo and J. A. Tainer, Accurate assessment of mass, models and resolution by small-angle scattering, Nature, 2013, 496, 477–481 CrossRef CAS PubMed.
- Z. Marelja, W. Stocklein, M. Nimtz and S. Leimkuhler, A novel role for human Nfs1 in the cytoplasm: Nfs1 acts as a sulfur donor for MOCS3, a protein involved in molybdenum cofactor biosynthesis, J. Biol. Chem., 2008, 283, 25178–25185 CrossRef CAS PubMed.
- G. Tang, L. Peng, P. R. Baldwin, D. S. Mann, W. Jiang, I. Rees and S. J. Ludtke, EMAN2: an extensible image processing suite for electron microscopy, J. Struct. Biol., 2007, 157, 38–46 CrossRef CAS PubMed.
- M. D. Winn, C. C. Ballard, K. D. Cowtan, E. J. Dodson, P. Emsley, P. R. Evans, R. M. Keegan, E. B. Krissinel, A. G. Leslie, A. McCoy, S. J. McNicholas, G. N. Murshudov, N. S. Pannu, E. A. Potterton, H. R. Powell, R. J. Read, A. Vagin and K. S. Wilson, Overview of the CCP4 suite and current developments, Acta Crystallogr., Sect. D: Biol. Crystallogr., 2011, 67, 235–242 CrossRef CAS PubMed.
- M. van Heel and M. Schatz, Fourier shell correlation threshold criteria, J. Struct. Biol., 2005, 151, 250–262 CrossRef CAS PubMed.
- E. F. Pettersen, T. D. Goddard, C. C. Huang, G. S. Couch, D. M. Greenblatt, E. C. Meng and T. E. Ferrin, UCSF Chimera – a visualization system for exploratory research and analysis, J. Comput. Chem., 2004, 25, 1605–1612 CrossRef CAS PubMed.
- C. A. Söderberg, A. V. Shkumatov, S. Rajan, O. Gakh, D. I. Svergun, G. Isaya and S. Al-Karadaghi, Oligomerization propensity and flexibility of yeast frataxin studied by X-ray crystallography and small-angle X-ray scattering, J. Mol. Biol., 2011, 414, 783–797 CrossRef PubMed.
- J. Yang and Y. Zhang, I-TASSER server: new development for protein structure and function predictions, Nucleic Acids Res., 2015, 43, W174–181 CrossRef PubMed.
- L. G. Trabuco, E. Villa, K. Mitra, J. Frank and K. Schulten, Flexible fitting of atomic structures into electron microscopy maps using molecular dynamics, Structure, 2008, 16, 673–683 CrossRef CAS PubMed.
- P. Emsley, B. Lohkamp, W. G. Scott and K. Cowtan, Features and development of Coot, Acta Crystallogr., Sect. D: Biol. Crystallogr., 2010, 66, 486–501 CrossRef CAS PubMed.
- V. B. Chen, W. B. Arendall, 3rd, J. J. Headd, D. A. Keedy, R. M. Immormino, G. J. Kapral, L. W. Murray, J. S. Richardson and D. C. Richardson, MolProbity: all-atom structure validation for macromolecular crystallography, Acta Crystallogr., Sect. D: Biol. Crystallogr., 2010, 66, 12–21 CrossRef CAS PubMed.
- S. Kalkhof and A. Sinz, Chances and pitfalls of chemical cross-linking with amine-reactive N-hydroxysuccinimide esters, Anal. Bioanal. Chem., 2008, 392, 305–312 CrossRef CAS PubMed.
- S. Madler, S. Gschwind and R. Zenobi, Role of arginine in chemical cross-linking with N-hydroxysuccinimide esters, Anal. Biochem., 2010, 398, 123–125 CrossRef PubMed.
- M. Gotze, J. Pettelkau, S. Schaks, K. Bosse, C. H. Ihling, F. Krauth, R. Fritzsche, U. Kuhn and A. Sinz, StavroX – a software for analyzing crosslinked products in protein interaction studies, J. Am. Soc. Mass Spectrom., 2012, 23, 76–87 CrossRef PubMed.
- D. M. Blow, Rearrangement of Cruickshank's formulae for the diffraction-component precision index, Acta Crystallogr., Sect. D: Biol. Crystallogr., 2002, 58, 792–797 CAS.
- S. Skou, R. E. Gillilan and N. Ando, Synchrotron-based small-angle X-ray scattering of proteins in solution, Nat. Protoc., 2014, 9, 1727–1739 CrossRef CAS PubMed.
- L. A. Kelley and M. J. Sternberg, Protein structure prediction on the Web: a case study using the Phyre server, Nat. Protoc., 2009, 4, 363–371 CrossRef CAS PubMed.
- P. Andrews, The gel-filtration behaviour of proteins related to their molecular weights over a wide range, Biochem. J., 1965, 96, 595–606 CrossRef CAS PubMed.
- S. Park and J. A. Imlay, High levels of intracellular cysteine promote oxidative DNA damage by driving the fenton reaction, J. Bacteriol., 2003, 185, 1942–1950 CrossRef CAS PubMed.
- S. P. Dzul, A. G. Rocha, S. Rawat, A. Kandegedara, A. Kusowski, J. Pain, A. Murari, D. Pain, A. Dancis and T. L. Stemmler, In vitro characterization of a novel Isu homologue from Drosophila melanogaster for de novo FeS-cluster formation, Metallomics, 2017, 9, 48–60 RSC.
- T. Yoon and J. A. Cowan, Iron–sulfur cluster biosynthesis. Characterization of frataxin as an iron donor for assembly of [2Fe–2S] clusters in ISU-type proteins, J. Am. Chem. Soc., 2003, 125, 6078–6084 CrossRef CAS PubMed.
- A. D. Smith, J. N. Agar, K. A. Johnson, J. Frazzon, I. J. Amster, D. R. Dean and M. K. Johnson, Sulfur transfer from IscS to IscU: the first step in iron–sulfur cluster biosynthesis, J. Am. Chem. Soc., 2001, 123, 11103–11104 CrossRef CAS PubMed.
- S. J. Ludtke, 3-D structures of macromolecules using single-particle analysis in EMAN, Methods Mol. Biol., 2010, 673, 157–173 CAS.
- K. Y. Chan, J. Gumbart, R. McGreevy, J. M. Watermeyer, B. T. Sewell and K. Schulten, Symmetry-restrained flexible fitting for symmetric EM maps, Structure, 2011, 19, 1211–1218 CrossRef CAS PubMed.
- L. G. Trabuco, E. Villa, E. Schreiner, C. B. Harrison and K. Schulten, Molecular dynamics flexible fitting: a practical guide to combine cryo-electron microscopy and X-ray crystallography, Methods, 2009, 49, 174–180 CrossRef CAS PubMed.
- A. Leitner, T. Walzthoeni, A. Kahraman, F. Herzog, O. Rinner, M. Beck and R. Aebersold, Probing native protein structures by chemical cross-linking, mass spectrometry, and bioinformatics, Mol. Cell. Proteomics, 2010, 9, 1634–1649 CAS.
- E. Krissinel and K. Henrick, Inference of macromolecular assemblies from crystalline state, J. Mol. Biol., 2007, 372, 774–797 CrossRef CAS PubMed.
- U. Schagerlöf, H. Elmlund, O. Gakh, G. Nordlund, H. Hebert, M. Lindahl, G. Isaya and S. Al-Karadaghi, Structural basis of the iron storage function of frataxin from single-particle reconstruction of the iron-loaded oligomer, Biochemistry, 2008, 47, 4948–4954 CrossRef PubMed.
- M. Manicki, J. Majewska, S. Ciesielski, B. Schilke, A. Blenska, J. Kominek, J. Marszalek, E. A. Craig and R. Dutkiewicz, Overlapping binding sites of the frataxin homologue assembly factor and the heat shock protein 70 transfer factor on the Isu iron–sulfur cluster scaffold protein, J. Biol. Chem., 2014, 289, 30268–30278 CrossRef CAS PubMed.
- N. G. Fox, M. Chakrabarti, S. P. McCormick, P. A. Lindahl and D. P. Barondeau, The Human Iron–Sulfur Assembly Complex Catalyzes the Synthesis of [2Fe–2S] Clusters on ISCU2 That Can Be Transferred to Acceptor Molecules, Biochemistry, 2015, 54, 3871–3879 CrossRef CAS PubMed.
- S. L. Sensi, D. Ton-That, J. H. Weiss, A. Rothe and K. R. Gee, A new mitochondrial fluorescent zinc sensor, Cell Calcium, 2003, 34, 281–284 CrossRef CAS PubMed.
- W. Maret, Zinc coordination environments in proteins as redox sensors and signal transducers, Antioxid. Redox Signaling, 2006, 8, 1419–1441 CrossRef CAS PubMed.
- A. Parent, X. Elduque, D. Cornu, L. Belot, J. P. Le Caer, A. Grandas, M. B. Toledano and B. D'Autreaux, Mammalian frataxin directly enhances sulfur transfer of NFS1 persulfide to both ISCU and free thiols, Nat. Commun., 2015, 6, 5686 CrossRef CAS PubMed.
- J. Majewska, S. J. Ciesielski, B. Schilke, J. Kominek, A. Blenska, W. Delewski, J. Y. Song, J. Marszalek, E. A. Craig and R. Dutkiewicz, Binding of the chaperone Jac1 protein and cysteine desulfurase Nfs1 to the iron–sulfur cluster scaffold Isu protein is mutually exclusive, J. Biol. Chem., 2013, 288, 29134–29142 CrossRef CAS PubMed.
- M. V. Petoukhov, D. Franke, A. V. Shkumatov, G. Tria, A. G. Kikhney, M. Gajda, C. Gorba, H. D. Mertens, P. V. Konarev and D. I. Svergun, New developments in the program package for small-angle scattering data analysis, J. Appl. Crystallogr., 2012, 45, 342–350 CAS.
- S. Moore, On the determination of cysteine and cysteic acid, J. Biol. Chem., 1963, 238, 235–237 CAS.
Footnotes |
| † Electronic supplementary information (ESI) available: Fig. S1–S14; Tables S1 and S2. See DOI: 10.1039/c7mt00089h |
| ‡ These authors contributed equally to this work. |
| This journal is © The Royal Society of Chemistry 2017 |