Molecular dynamics of dilute binary chromonic liquid crystal mixtures†
Oscar M.
Matus Rivas
 and
Alejandro D.
Rey
*
Department of Chemical Engineering, McGill University, Montreal, Quebec, H3A 0C5, Canada. E-mail: alejandro.rey@mcgill.ca
First published on 9th May 2017
Abstract
The spontaneous aggregation of binary mixtures of lyotropic chromonic liquid crystals (LCLCs) was investigated using atomistic molecular dynamics simulations. Equimolecular binary mixtures were simulated in a highly dilute regime using three LCLC mesogens, namely, Sunset Yellow FCF (SSY), disodium cromoglycate (DSCG) and Bordeaux dye (BD). The influence of their molecular shape, conformational flexibility and hydrogen bonding capability in the formation of aggregates was studied in detail. Stacking distance comparison, hydrogen bond distribution analysis and solvent accessible surface area calculations were performed along with molecular visualization. The mixtures exhibited three different molecular segregation modes where the number of mixed π–π stacks was minimized. Aggregation of chromonic binary mixtures depends strongly on mesogen cross-sectional area differences. However, the distribution of LCLC solubilizing groups and their H-bonding density formed around mixed stacks contributed significantly to achieving different mixture segregation patterns. Average stacking distances between π–π interactions were consistently seen to be around 0.34 nm. Mesogens with similar long axis molecular length and high hydrogen bonding capacity represent a likely choice for the preparation of chromonic binary mixtures. These findings contribute to the understanding of general aggregation rules for chromonic mesophases which are required for the design of novel chromonic supramolecular applications.
Design, System, ApplicationWe present an investigation of the basic spontaneous aggregation rules of dilute lyotropic chromonic liquid crystal binary mixtures from an atomistic perspective using molecular dynamics simulations. These water-soluble discotic materials may be used as precursors for the fabrication of highly ordered anisotropic dried films which can be exploited for the fabrication of supramolecular graphenic materials. We designed three binary mixtures composed of Sunset Yellow FCF, disodium cromoglycate, and Bordeaux dye mesogens. We elucidated and quantified how molecular geometry, polarizing group distribution, and conformational rigidity contributed to the miscibility of chromonics. Enthalpic and entropic contributions promoted the formation of different types of molecular segregation depending on the mixture analyzed. Binary chromonic mixing is favored for compounds with high hydrogen bonding capability, rigid structure, and similar molecular length. Chromonic mixtures represent an alternative to improve the functionality and stability range of liquid crystalline phases. |
1. Introduction
The use of discotic liquid crystals in the fabrication of self-organized supramolecular materials has generated great interest in nanotechnology and materials science.1–4 Lyotropic chromonic liquid crystals (LCLCs), also known as chromonics, are currently one of the most studied discotic mesogens. Chromonics are plank-like polyaromatic compounds functionalized with peripheral polar groups. In aqueous solution, they form reversible π–π aggregates by spontaneously stacking one molecule on top of another while minimizing unfavorable hydrophobic contacts between polyaromatic cores and water.5 The average separation distance between adjacent chromonic molecules is 0.34 nm in the stacking direction.6–9 This value is independent of concentration and temperature and has been reported from small angle X-ray diffraction and spectroscopy measurements.5,10,11 The formation of small chromonic aggregates starts at diluted solutions.8 As the concentration increases, columnar aggregates align more or less parallel to the preferred direction, transitioning from the isotropic state to the uniaxial nematic (N) and upon further increase in the concentration to the hexagonal columnar (M) phases. LCLC compounds include coloring dyes, pharmaceuticals, and nucleic acids.8LCLCs have been extensively investigated lately for their numerous potential applications which range from highly ordered anisotropic dried films,12–14 optical compensators,15,16 security printing,17 polarizers,18 micro-patterned chromonic films,19,20 biosensors,21,22 organic electronics23 and production of graphenic materials such as vertically aligned graphene layer arrays (VAGLAs).3,4
Although significant progress in fundamental understanding, synthesis, and characterization of chromonic materials has been made, their crucial self-ordering mechanisms have scarcely been explored.24 Hence, the success of the design of functionalized chromonic materials lies in a deep knowledge of the relation between their structure and inherent properties. These properties include the influence of concentration and temperature, ionic content, the effect of additives (e.g., urea and salt), shear rheology and the choice of chromonic molecular geometries,8,9,24 which include the distribution and types of polarizing groups as well as the nature of their hydrophobic cores.25
As in other material systems, blending and mixing is an efficient route to expand and improve functionality, performance, thermodynamic stability and more.26–32 The investigation of the self-assembly of chromonic mixtures represents a new research area since most efforts have been focused primarily on pure compounds only. Recently, an X-ray scattering and spectroscopy investigation of two archetypical LCLC compounds, Sunset Yellow FCF (SSY) and disodium cromoglycate (DSCG), was performed at room temperature for many concentrations.33 For most samples analyzed, phase separation occurs between SSY-rich and DSCG-rich mesophases. Homogeneous mixing took place either when the concentrations of both compounds were low or when one mesogen was abundant, forming N phases, while the other compound was sparse. Moreover, geometrical constraints in addition to cross-sectional area differences between SSY and DSCG molecules could have hindered the formation of intercalated stacks. Instead, separate SSY and DSCG columns would have formed.
On the other hand, a binary mixture of LCLC perylene dyes has been successfully used to fabricate broad spectrum polarizing films.34 Both dyes are reported to be entirely miscible despite the size of their aromatic cores differing considerably. Both molecules could have stacked within the same column.8 Thus, it is clear that chromonic mixtures require extensive research to understand in detail which factors affect their miscibility from a molecular perspective.
The objective of this investigation is to establish and characterize how molecular shape, conformational rigidity, and hydrogen bonding (H-bonding) capability influence the aggregation of dilute chromonic binary mixtures using an atomistic molecular dynamics (MD) simulation approach. This methodology, pioneered by Chami and Wilson,35 has been successfully employed to investigate the structure and dynamics of chromonic aggregates in a dilute regime.35–38 Since LCLCs can be oriented using shear-induced alignment techniques,39,40 highly dilute solutions of chromonic materials may present a promising route to achieve a paranematic state, which has been proven to be a novel way to process liquid-crystalline materials such as liquid crystal collagen films.41 The findings presented herein contribute to the development of general aggregation rules of chromonic materials and, consequently, to the design of novel supramolecular applications, including new graphene precursors, that can be exploited in the paranematic state.
The LCLCs explored in this report are Sunset Yellow FCF (SSY),10,35,36,42–48 disodium cromoglycate (DSCG)11,38,44,49–54 and Bordeaux dye (BD)5,44 (see Fig. 1). DSCG is an anti-asthmatic drug and so far the most studied chromonic material and it was commercialized as Cromolyn or Intal. Its symmetrical structure consists of two naphthyl rings substituted with carboxylate and carbonyl groups that are connected by a semi-rigid bridge.38,51 Moreover, SSY is a sulfonated food colouring dye extensively studied as well. It has a rigid structure composed of phenyl and naphthyl aromatic rings connected by an azo group. SSY NH hydrazone tautomer has been shown to predominate in aqueous solution.42,43 On the other hand, BD is an anionic material obtained from the sulfonation of the dibenzimidazole derivative of naphthalenetetracarboxylic acid. BD has a symmetric single polyaromatic ring with no connecting groups. It has been used as a precursor for the fabrication of VAGLAs.3,4
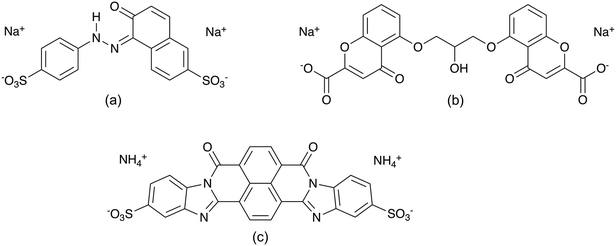 | ||
| Fig. 1 Molecular structure of (a) NH hydrazone Sunset Yellow FCF, (b) disodium cromoglycate, and (c) Bordeaux dye LCLCs. | ||
The formation of liquid crystalline phases for SSY, DSCG, and BD at room temperature has been reported to appear approximately at 30, 8.5 and 6 wt%, respectively.5,10,55 This characteristic behavior between mesogens is attributed to their molecular structural differences, summarized in Table 1, along with their solubilizing groups, illustrated in Fig. 1.
| Compound | Long axis length (nm) | Cross-sectional area of aggregates44 (nm2) | Conformational flexibility | Symmetric molecule | Polyaromatic ring number |
|---|---|---|---|---|---|
| a Estimated from ab initio density functional theory calculations. | |||||
| Sunset Yellow FCF | 1.0 (ref. 43) | 1.21 ± 0.12 | Rigid | No | 2 |
| Disodium cromoglycate | 1.9 (ref. 51) | 2.39 ± 0.08 | Semi-rigid | Yes | 2 |
| Bordeaux dye | 2.0a | 3.24 ± 0.04 | Rigid | Yes | 1 |
The organization of this manuscript is as follows. Section 2 presents the computational methodology and calculation details. Section 3.1 discusses the visualization and self-assembly of chromonic mixtures. Section 3.2 examines the intermolecular separation distances of the aggregates. Section 3.3 studies the influence of hydrogen bonds (H-bonds) in chromonic stacking. Section 3.4 analyzes the effect of molecular size variations in the formation of π–π stacks with the aid of solvent accessible surface area calculations.
2. Methodology
Geometry optimization of LCLC initial atomic positions was performed using ab initio density functional theory (DFT). The revised Perdew–Burke–Ernzerhof (revPBE) generalized-gradient approximation (GGA) exchange-correlational functional was utilized with a double-ζ polarized (DZP) basis set and norm-conserving Troullier–Martins pseudopotentials as implemented in the SIESTA code.56,57Molecular interactions of LCLCs were described using the general AMBER force field (GAFF)58 where the overall energy of the system E is given by
Water molecules were simulated using the well-established TIP3P-Ew model.60 Sodium cations were modeled after Joung and Cheatham III parameters61 while ammonium cations were simulated analogously to the other chromonic molecules using GAFF parameters.
The LAMMPS code was utilized to run all full-atomistic molecular dynamics simulations.62 Equilibration runs were performed by running 10 ns in the canonical ensemble (NVT) followed by a 200 ns run in the isobaric–isothermal ensemble (NPT) to ensure that the self-aggregation process was fully achieved. Production runs were completed in the NPT ensemble for at least 80 ns. All MD simulations used a 2 fs integration time step. The temperature was kept constant at 300 K using a Nose–Hoover thermostat with a damping parameter of 0.1 ps while the pressure was controlled at 1 atm using a Parrinello–Rahman barostat with a damping parameter of 1.0 ps.63 Long-range Coulomb interactions were included in the model using a particle–particle particle–mesh (PPPM) solver.64 TIP3P water bonds and angles were kept fixed using the SHAKE algorithm with a 10−4 tolerance.65 A single cut-off radius of 1.0 nm was employed for both LJ and Coulomb interactions for all simulations.
Three different equimolecular mixtures were prepared: (i) DSCG–BD, (ii) SSY–BD and (iii) SSY–DSCG. All mixtures were simulated at a highly dilute regime by placing four chromonic molecules of each compound in a box of water (5.0 nm × 5.0 nm × 5.0 nm). The corresponding concentrations ci for each mesogen are (i) cDSCG = 2.6 wt%, cBD = 3.4 wt%; (ii) cSSY = 2.6 wt%, cBD = 3.4 wt%; and (iii) cSSY = 2.5 wt%, cDSCG = 2.5 wt%. For all mixtures, the molar ratio between chromonic species is 1![[thin space (1/6-em)]](https://www.rsc.org/images/entities/char_2009.gif) :
:![[thin space (1/6-em)]](https://www.rsc.org/images/entities/char_2009.gif) 1, i.e., equimolar. All molecules were placed randomly in the simulation box using the Packmol code.66 This choice was made due to the essentially lacking information on chromonic mixture phase diagrams as well as BD data at low concentrations, except for the SSY–DSCG system, whose phase diagram was determined by Yamaguchi et al., and the concentration choice was verified to be at the isotropic phase.33 However, this methodology provides the first detailed description of how molecular geometry and other structural factors discussed above impact on the miscibility of different chromonic mesogens. Furthermore, since the SSY–DSCG phase diagram exhibits several single-phase and coexisting regions,33 and the other mixtures could have similar complex phases as well, the logical starting point for this investigation is to explore the highly dilute regime of chromonic binary mixtures which is useful for achieving the paranematic state.
1, i.e., equimolar. All molecules were placed randomly in the simulation box using the Packmol code.66 This choice was made due to the essentially lacking information on chromonic mixture phase diagrams as well as BD data at low concentrations, except for the SSY–DSCG system, whose phase diagram was determined by Yamaguchi et al., and the concentration choice was verified to be at the isotropic phase.33 However, this methodology provides the first detailed description of how molecular geometry and other structural factors discussed above impact on the miscibility of different chromonic mesogens. Furthermore, since the SSY–DSCG phase diagram exhibits several single-phase and coexisting regions,33 and the other mixtures could have similar complex phases as well, the logical starting point for this investigation is to explore the highly dilute regime of chromonic binary mixtures which is useful for achieving the paranematic state.
Molecular visualizations were generated using VMD software.67 H-bonds were registered when the separation distance r between donor and acceptor atoms was 0.35 nm, forming an angle θ ≤ 30°,68 as implemented in the HBonds Plugin available in VMD. Solvent accessible surface area (SASA) calculations were utilized to quantify the geometric exposure between selected chromonic π–π stacks and the solvent, as performed in VMD. This computation is achieve by rolling a probe sphere of radius 0.14 nm, which approximates the van der Waals radius of water, over the van der Waals surface of the chromonic molecules.69 SASA is different from the molecular area of the aggregates, but it is useful for quantifying and comparing the hydrophobic effect on mixed chromonic stacks.
3. Results and discussion
3.1 Description of self-assembly of LCLC mixtures
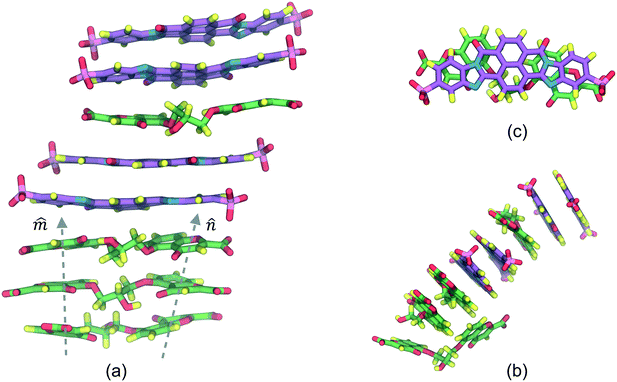
The DSCG–BD model was organized in a face-on single stacking column divided into two sections: a predominant BD segment on top followed by a DSCG region at the bottom (see Fig. 2). In the BD-rich section, two BD molecules confined a single DSCG one that remained relatively flat throughout the production runs. The long axes ratio between these chromonic species, defined as LR1 = LDSCG/LBD, is LR1 ≈ 0.95. DSCGs at the bottom of the stack form independent face-on π–π interactions between each pair of polyaromatic rings. These normal planes, identified as vectors![[m with combining circumflex]](https://www.rsc.org/images/entities/i_char_006d_0302.gif) and
and ![[n with combining circumflex]](https://www.rsc.org/images/entities/i_char_006e_0302.gif) in Fig. 2a, provide a small degree of flexibility around the central linking groups of DSCG materials.38 Variations in the orientation of
in Fig. 2a, provide a small degree of flexibility around the central linking groups of DSCG materials.38 Variations in the orientation of ![[m with combining circumflex]](https://www.rsc.org/images/entities/i_char_006d_0302.gif) and
and ![[n with combining circumflex]](https://www.rsc.org/images/entities/i_char_006e_0302.gif) planes, which are not necessarily parallel to each other, caused the partial decoupling of the lowest DSCG mesogen, forming only a single face-on π–π interaction with its closest neighbor within the stacking column and a lateral T-shaped interaction (see Fig. 2b). Eventually, this pronounced bent conformation returned to the base of the column. Moreover, chromonics in this model preferred to aggregate between the same species to maintain the number of DSCG–BD interactions low, even though LR1 is close to 1. This behavior is presumably caused by differences in hydrophobic core sizes of each molecule (see Fig. 2c). Thus, the DSCG–BD mixture segregated in an intra-columnar mode.
planes, which are not necessarily parallel to each other, caused the partial decoupling of the lowest DSCG mesogen, forming only a single face-on π–π interaction with its closest neighbor within the stacking column and a lateral T-shaped interaction (see Fig. 2b). Eventually, this pronounced bent conformation returned to the base of the column. Moreover, chromonics in this model preferred to aggregate between the same species to maintain the number of DSCG–BD interactions low, even though LR1 is close to 1. This behavior is presumably caused by differences in hydrophobic core sizes of each molecule (see Fig. 2c). Thus, the DSCG–BD mixture segregated in an intra-columnar mode.
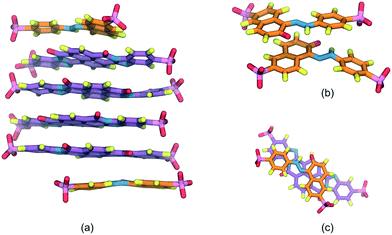
The SSY–BD model, presented in Fig. 3, formed two differentiated aggregates, i.e., a SSY-dimer (Fig. 3b) and a multi-component column composed of BD at the center with two SSY at the ends (Fig. 3a). In the latter, SSY–BD aggregation occurs even though their molecular size is reasonably different since its long axes ratio, LR2 = LSSY/LBD, is LR2 ≈ 0.50 (see Fig. 3c). Consequently, larger sections of the hydrophobic cores of BD are exposed to the water solvent forming partial π–π interactions with relatively low stability. This behavior results in the impediment to adding more SSY molecules at the ends of the main stack due to steric and electrostatic limitations. Instead, the formation of a SSY-dimer is thermodynamically favored. However, these observations suggest that SSY–BD aggregation is dependent not only on hydrophobic core sizes but also on the hydrophilic interactions between the chromonics and the water solvent. Therefore, this model exhibited a segregated ends mode.
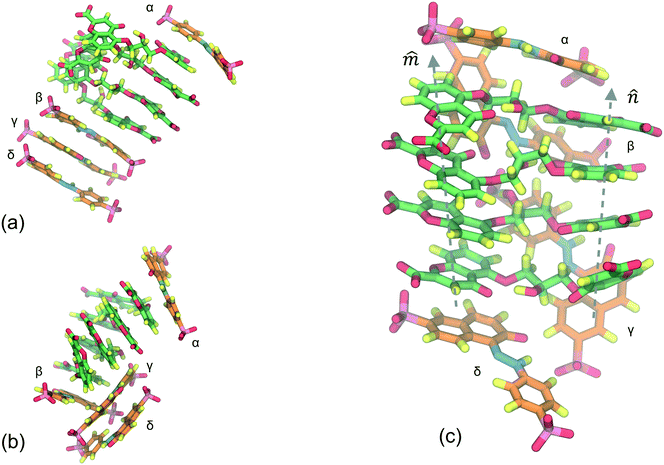
Fig. 4 presents the SSY–DSCG system aggregation behavior whose long axes ratio, LR3 = LSSY/LDSCG, is LR3 ≈ 0.53. Initially, a single aggregate is seen which is formed by DSCG molecules at the center with a SSY-trimer at the bottom and a SSY molecule on top (see Fig. 4a). A constant deviation on the orientation of DSCG ![[m with combining circumflex]](https://www.rsc.org/images/entities/i_char_006d_0302.gif) and
and ![[n with combining circumflex]](https://www.rsc.org/images/entities/i_char_006e_0302.gif) stacking planes caused an extra exposure of DSCG central linking groups towards the solvent. Hence, due to hydrophobic effect, the SSY-trimer is divided into a dimer that forms a T-shaped interaction with the main DSCG column. The remaining SSY–DSCG interactions are preserved at the ends (see Fig. 4 and 5a). As the simulation progresses, the orientation of stacking axes
stacking planes caused an extra exposure of DSCG central linking groups towards the solvent. Hence, due to hydrophobic effect, the SSY-trimer is divided into a dimer that forms a T-shaped interaction with the main DSCG column. The remaining SSY–DSCG interactions are preserved at the ends (see Fig. 4 and 5a). As the simulation progresses, the orientation of stacking axes ![[m with combining circumflex]](https://www.rsc.org/images/entities/i_char_006d_0302.gif) and
and ![[n with combining circumflex]](https://www.rsc.org/images/entities/i_char_006e_0302.gif) keep fluctuating. Consequently, the SSY-dimer splits into individual mesogens that are continuously attracted to the main DSCG column (see Fig. 4c). Additionally, SSY molecules are identified in Fig. 4 as particles α, β, γ and δ. On the upper section of the aggregate, SSY α remained, forming a constant SSY–DSCG interaction during the production run. However, the bottom SSY–DSCG interaction interchanged SSY β and δ molecules. This stochastic aggregation pattern, or wrapped aggregation mode, can be considered as the average aggregation of SSY–DSCG since it was confirmed by monitoring the system for an additional 100 ns. Again, different molecular cross-sectional areas between SSY and BD molecules allowed the formation of partial π–π interactions (see Fig. 5b). This feature is reminiscent of the previous model examined, since solubilizing sites seem to contribute to their formation but with lower stability since they could easily be disrupted and reformed.
keep fluctuating. Consequently, the SSY-dimer splits into individual mesogens that are continuously attracted to the main DSCG column (see Fig. 4c). Additionally, SSY molecules are identified in Fig. 4 as particles α, β, γ and δ. On the upper section of the aggregate, SSY α remained, forming a constant SSY–DSCG interaction during the production run. However, the bottom SSY–DSCG interaction interchanged SSY β and δ molecules. This stochastic aggregation pattern, or wrapped aggregation mode, can be considered as the average aggregation of SSY–DSCG since it was confirmed by monitoring the system for an additional 100 ns. Again, different molecular cross-sectional areas between SSY and BD molecules allowed the formation of partial π–π interactions (see Fig. 5b). This feature is reminiscent of the previous model examined, since solubilizing sites seem to contribute to their formation but with lower stability since they could easily be disrupted and reformed.
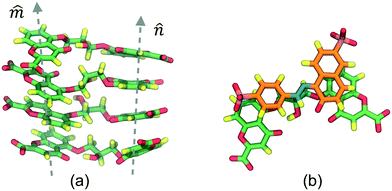 | ||
Fig. 5
(a) Detail of DSCG ![[m with combining circumflex]](https://www.rsc.org/images/entities/i_char_006d_0302.gif) and and ![[n with combining circumflex]](https://www.rsc.org/images/entities/i_char_006e_0302.gif) stacking axes taken from Fig. 4c where surrounding SSY molecules are omitted to facilitate their inspection. The orientation of the axes is not parallel. Thus, DSCG central bridges are accessible to the solvent. (b) Representation of the top SSY–DSCG π–π interaction. Water and ions are omitted for clarity. stacking axes taken from Fig. 4c where surrounding SSY molecules are omitted to facilitate their inspection. The orientation of the axes is not parallel. Thus, DSCG central bridges are accessible to the solvent. (b) Representation of the top SSY–DSCG π–π interaction. Water and ions are omitted for clarity. | ||
Quantitative observations of the three chromonic mixtures confirm the formation of unique segregation patterns for each model. These results suggest that mixing is favored when Lr → 1. For mixtures with intermediate Lr, weaker π–π stacks are observed as well between distinct species. However, observations indicate that their stability and segregation modes are a function of the H-bonding network formed around them and the conformational flexibility of their structure.
3.2 Molecular separation distance analysis
We initially defined separation distance calculations: the separation distance between the center of mass of two adjacent chromonic molecules, dC, and the stacking distance, dS, defined as the vertical projection between two average normal vectors computed from the aromatic cores of an adjacent pair. This methodology is based on the work by Akinshina et al.,37 which was successfully employed to study the stacking separation of a non-ionic chromonic mesogen.Fig. 6 shows the structural analysis of the DSCG–BD model. The time evolution of distances, dC and dS, were calculated for the top pair of BD molecules in Fig. 6a. The average values are dC = 0.41 ± 0.03 nm and dS = 0.34 ± 0.02 nm. Thus, dS represents accurately the experimental stacking distance reported from X-ray scattering measurements, while dC suggests that stacked BD molecules usually displaced each other from a hypothetical parallel vertical axis. Analogous results were obtained for the rest of the chromonic species analyzed in this study. Therefore, only the stacking distance dS will be discussed hereafter. Also, all chromonic pairs discussed next are numbered in descending order as they appear in Fig. 2–4. A summary of the average stacking distances between chromonic pairs for all mixtures is presented in the ESI.†
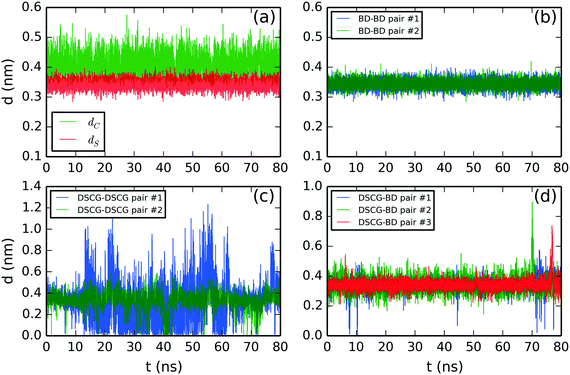 | ||
| Fig. 6 Molecular stacking distance between DSCG–BD mixture pairs. (a) Comparison between the center of mass distance (dC) and stacking distance (dS) of the BD–BD top pair. Stacking distance between (b) BD–BD, (c) average DSCG–DSCG and (d) BD–DSCG π–π interactions. All chromonic pairs were numbered in descending order as they appear in Fig. 2. | ||
BD–BD stacking distances are shown in Fig. 6b. They showed an average separation of 0.34 ± 0.02 nm and 0.34 ± 0.01, respectively. DSCG–DSCG stacking distances were calculated for each pair averaging over both stacking axes. Thus, the second DSCG–DSCG pair (green line in Fig. 6b) exhibits a mean molecular separation of 0.35 ± 0.08 nm while the first one (blue line in Fig. 6c) shows an average stacking distance of 0.35 ± 0.07 nm between 0–12 ns and 63–78 ns of the production run. In the remaining simulation time, this pair was partially dislocated because its lowest DSCG molecule folded and partially separated from the base of the column, as previously discussed in Fig. 2b. Finally, DSCG–BD pairs exhibited a mean separation distance of 0.34 ± 0.05 nm for pairs #1 and #2, and 0.34 ± 0.04 nm for pair #3 (see Fig. 6d).
Fig. 7 illustrates the molecular aggregation distances of the SSY–BD model. The SSY-dimer showed a mean separation distance of 0.34 ± 0.04 nm (see Fig. 7a). Also, BD–BD pairs exhibited an average molecular separation of 0.34 ± 0.02 nm (see Fig. 7b) while SSY–BD pairs exhibited 0.34 ± 0.02 and 0.34 ± 0.03 nm (see Fig. 7c). In this mixture, all π–π interactions remained attached for the whole simulation time.
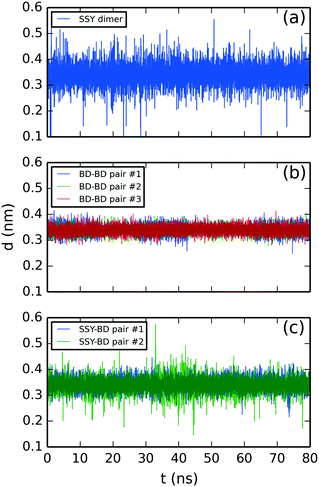 | ||
| Fig. 7 Molecular stacking distance of SSY–BD mixture between (a) SSY-dimer, (b) BD–BD, and (c) SSY–BD π–π interactions. All chromonic pairs were numbered in descending order as they appear in Fig. 3. | ||
Lastly, the structural analysis of the SSY–DSCG system is illustrated in Fig. 8–11. First, the stacking distances of DSCG–DSCG interactions were studied separately for both stacking axes ![[m with combining circumflex]](https://www.rsc.org/images/entities/i_char_006d_0302.gif) and
and ![[n with combining circumflex]](https://www.rsc.org/images/entities/i_char_006e_0302.gif) (see Fig. 5a). Fig. 8a shows the separation of axis
(see Fig. 5a). Fig. 8a shows the separation of axis ![[m with combining circumflex]](https://www.rsc.org/images/entities/i_char_006d_0302.gif) while Fig. 8b that of axis
while Fig. 8b that of axis ![[n with combining circumflex]](https://www.rsc.org/images/entities/i_char_006e_0302.gif) . The average separation found was 0.34 ± 0.03 nm for
. The average separation found was 0.34 ± 0.03 nm for ![[m with combining circumflex]](https://www.rsc.org/images/entities/i_char_006d_0302.gif) -axis pairs and 0.35 ± 0.03 nm for
-axis pairs and 0.35 ± 0.03 nm for ![[n with combining circumflex]](https://www.rsc.org/images/entities/i_char_006e_0302.gif) -axis pairs.
-axis pairs.
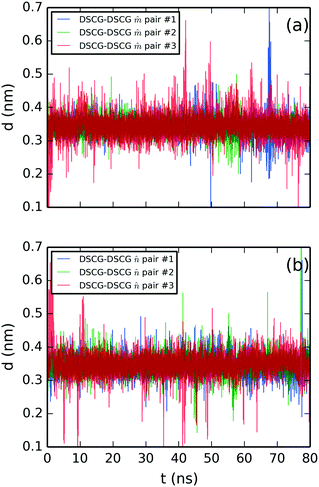 | ||
Fig. 8 Molecular stacking distance between DSCG–DSCG π–π interactions in a SSY–DSCG mixture for aromatic pairs (a) on axis ![[m with combining circumflex]](https://www.rsc.org/images/entities/i_char_006d_0302.gif) and (b) axis and (b) axis ![[n with combining circumflex]](https://www.rsc.org/images/entities/i_char_006e_0302.gif) as depicted in Fig. 5a. All chromonic pairs were numbered in descending order as they appear in Fig. 5a. as depicted in Fig. 5a. All chromonic pairs were numbered in descending order as they appear in Fig. 5a. | ||
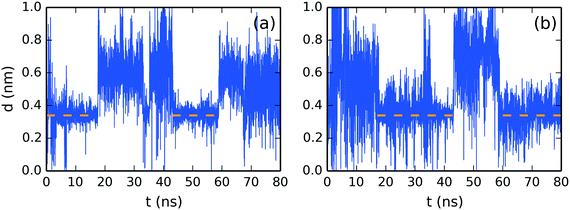
Fig. 9 presents the stacking distance between the top SSY–DSCG π–π interaction as depicted in Fig. 4. This choice was made since the SSY mesogen (SSY α) remained always aggregated to the main DSCG stack, as opposed to the bottom of the main DSCG stack, where several complex conformational changes took place. Fig. 9 shows the molecular separation between SSY and each DSCG naphthyl ring. It was found that SSY molecules moved from one DSCG polyaromatic ring to another one throughout the production run. The mean aggregated distances are represented as dashed lines for clarity. The average separation observed was 0.35 ± 0.07 nm for axis ![[m with combining circumflex]](https://www.rsc.org/images/entities/i_char_006d_0302.gif) and 0.36 ± 0.09 for axis
and 0.36 ± 0.09 for axis ![[n with combining circumflex]](https://www.rsc.org/images/entities/i_char_006e_0302.gif) . The molecular twist angle between DSCG stacking axes
. The molecular twist angle between DSCG stacking axes ![[m with combining circumflex]](https://www.rsc.org/images/entities/i_char_006d_0302.gif) and
and ![[n with combining circumflex]](https://www.rsc.org/images/entities/i_char_006e_0302.gif) were studied using the normalized orientational correlation function, Ci(t) = (
were studied using the normalized orientational correlation function, Ci(t) = (![[m with combining circumflex]](https://www.rsc.org/images/entities/i_char_006d_0302.gif) i·
i·![[n with combining circumflex]](https://www.rsc.org/images/entities/i_char_006e_0302.gif) i), where
i), where ![[m with combining circumflex]](https://www.rsc.org/images/entities/i_char_006d_0302.gif) i and
i and ![[n with combining circumflex]](https://www.rsc.org/images/entities/i_char_006e_0302.gif) i are the average normalized orientational stacking vectors for each aromatic side of the i DSCG molecule (see Fig. 5a). The time correlation for each DSCG mesogen is shown in Fig. 10. These results indicate that DSCG normal π-planes do not remain parallel. Instead, they oscillate for the whole simulation time. The average preferred orientation of the stacking axes
i are the average normalized orientational stacking vectors for each aromatic side of the i DSCG molecule (see Fig. 5a). The time correlation for each DSCG mesogen is shown in Fig. 10. These results indicate that DSCG normal π-planes do not remain parallel. Instead, they oscillate for the whole simulation time. The average preferred orientation of the stacking axes ![[m with combining circumflex]](https://www.rsc.org/images/entities/i_char_006d_0302.gif) and
and ![[n with combining circumflex]](https://www.rsc.org/images/entities/i_char_006e_0302.gif) was approximately at Ci(t) = 0.67 ± 0.12 which roughly corresponds to an angle of 48°. This orientation confirms that the DSCG stack forms a semi-rigid aggregated conformation where the central linking chains are not confined at the center and thus permit the formation of interactions with other available chromonic molecules to avoid hydrophobic effects.
was approximately at Ci(t) = 0.67 ± 0.12 which roughly corresponds to an angle of 48°. This orientation confirms that the DSCG stack forms a semi-rigid aggregated conformation where the central linking chains are not confined at the center and thus permit the formation of interactions with other available chromonic molecules to avoid hydrophobic effects.
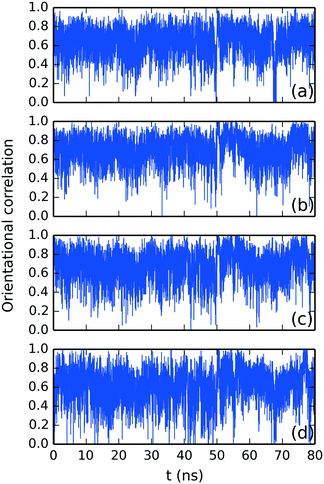 | ||
Fig. 10 Time correlation function for the average normalized orientational stacking vectors ![[m with combining circumflex]](https://www.rsc.org/images/entities/i_char_006d_0302.gif) and and ![[n with combining circumflex]](https://www.rsc.org/images/entities/i_char_006e_0302.gif) for DSCG molecules (a) #1, (b) #2, (c) #3 and (d) #4 in descending order as observed in Fig. 5a. for DSCG molecules (a) #1, (b) #2, (c) #3 and (d) #4 in descending order as observed in Fig. 5a. | ||
To confirm the creation of SSY–DSCG T-shaped interactions, the evolution of the molecular distance between the top molecule of the SSY-dimer (SSY γ) and its closest DSCG central chain (see Fig. 4) is presented in Fig. 11. The SSY-dimer is formed at around 10 ns, where this SSY γ moves close to the DSCG main stack. This T-shaped interaction remained attached with an average separation of 0.38 ± 0.05 nm. Furthermore, the small perturbation seen at around 70 ns corresponds to the rupture of the SSY-dimer into individual mesogens. However, SSY γ continued to move close to the DSCG stack for the remaining production run time.
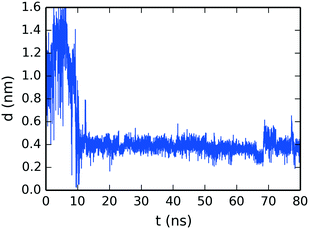 | ||
| Fig. 11 Time evolution of the mean separation distance between the top molecule of the SSY-dimer and its closest DSCG mesogen as seen in Fig. 4b. | ||
Therefore, the variation of DSCG ![[m with combining circumflex]](https://www.rsc.org/images/entities/i_char_006d_0302.gif) and
and ![[n with combining circumflex]](https://www.rsc.org/images/entities/i_char_006e_0302.gif) axes caused the partial dislocation of SSY mesogens around the main stack. It also suggests that not only entropic interactions, such as H-bonding, collaborate on the segregation mode of this mixture, but also enthalpic contributions that avoided the formation of isolated SSY aggregates, such as the SSY–SSY dimer in the DSCG–BD model.
axes caused the partial dislocation of SSY mesogens around the main stack. It also suggests that not only entropic interactions, such as H-bonding, collaborate on the segregation mode of this mixture, but also enthalpic contributions that avoided the formation of isolated SSY aggregates, such as the SSY–SSY dimer in the DSCG–BD model.
3.3 Hydrogen bonding analysis
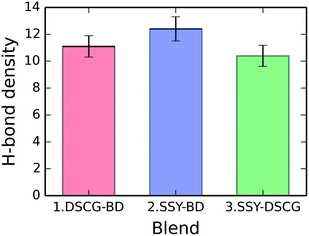
H-bonding between water molecules (donors) and chromonic polar groups (acceptors) were examined for each binary mixture. Fig. 12 shows the mixtures' total H-bonding density, which consists of the average number of H-bonds per molecule for each blend. The SSY–BD model presents an average of 12.4 ± 0.9 H-bonds per molecule followed by the DSCG–BD and SSY–DSCG models with 11.1 ± 0.8 and 10.4 ± 0.8, respectively. For the SSY–BD mixture, only the main stacking column was considered (see Fig. 3).The distribution of the average number of H-bonds per molecule for every solubilizing group is presented in Table 2 for each binary mixture. Sulfonate groups in SSY and BD molecules and carboxylate groups in DSCG ones exhibited the highest average number of H-bonds per molecule occurrences, as expected. These groups, which are the most polar ones within each mesogen, are mainly responsible for the formation of the dynamic H-bonding network around chromonic aggregates and water.
| Hydrophilic group | Mixture #1: DSCG–BD | Mixture #2: SSY–BD | Mixture #3: SSY–DSCG | |||
|---|---|---|---|---|---|---|
| DSCG | BD | SSY | BD | SSY | DSCG | |
| Carboxylate | 6.7 ± 0.9 | — | — | — | — | 7.6 ± 1.0 |
| Hydroxyl | 0.7 ± 0.3 | — | — | — | — | 0.1 ± 0.2 |
| Carbonyl | 2.4 ± 0.5 | 1.8 ± 0.4 | 1.2 ± 1.3 | 1.8 ± 0.4 | 0.9 ± 0.4 | 1.5 ± 0.4 |
| Sulfonate | — | 9.2 ± 1.0 | 10.4 ± 1.3 | 9.0 ± 1.1 | 10.0 ± 1.0 | — |
| Hydrazone | — | — | 0.9 ± 0.5 | — | 0.8 ± 0.4 | — |
| Azole | — | 1.4 ± 0.4 | — | 1.6 ± 0.4 | — | — |
| Total | 9.8 ± 1.1 | 12.5 ± 1.2 | 12.5 ± 1.5 | 12.4 ± 1.2 | 11.7 ± 1.2 | 9.2 ± 1.1 |
BD mesogens have a consistent H-bonding density of approximately 12.5 H-bonds per molecule, regardless of the system analyzed. However, the H-bonding density for SSY and DSCG molecules varied slightly depending on the mixture they were in. DSCG registered 9.8 ± 1.1 and 9.2 ± 1.1 H-bonds per molecule for DSCG–BD and SSY–DSCG models, respectively. It represents a roughly 10% variation where carboxyl and hydroxyl groups were the most affected. Similarly, SSY shows 12.5 ± 1.2 and 11.7 ± 1.2 H-bonds per molecule for the SSY–BD and SSY–DSCG models, respectively. In this case, the variation corresponds to approximately 8.5%. Therefore, the H-bonding density of DSCG and SSY can be altered depending on their accompanying molecule.
Comparing the distribution of the solubilizing groups around each compound and their corresponding H-bonding density shows that DSCG has a lower H-bonding presence around its geometrical center relative to the other chromonics. This effect is accentuated in the SSY–DSCG mixture, when the DSCG stack adopted relatively twisted conformations compared to the DSCG–BD model.
H-bonding between flat molecules, i.e., SSY–BD model, was the most efficient mode. Likewise, when DSCG mesogens were paired with BDs, the broad distribution of the hydrophobic cores of the latter forced most DSCG molecules to remain relatively flat. Consequently, H-bond number was maximized. For both systems, BD molecules had the largest molecular size. On the other hand, in the SSY–DSCG model, where DSCG has the largest cross-sectional area, the relatively bent nature of DSCG and the formation of T-shaped interactions minimized the H-bonding density of this model. Therefore, the H-bonding capability of the chromonic binary mixtures analyzed is affected by the different segregation modes previously discussed.
3.4 Solvent accessible surface area (SASA) analysis
SASA analysis evaluated the relative strength of mixed π–π interactions by comparing their geometrical exposure to the solvent. We separated these calculations into hydrophobic and hydrophilic contributions which allowed us to quantify how cross-sectional area differences affected the stability of the three chromonic segregation modes.First, we compared mixed π–π interactions between SSY–BD and SSY–DSCG models at the ends of their stacking columns (see Fig. 3 and 4). These results, shown in Table 3, were averaged over all possible occurrences. Both mixtures have practically the same overall SASA, which is around 7 nm2. However, SSY–BD stacks showed a 5% larger hydrophilic accessibility compared to SSY–DSCG ones. Therefore, SSY–BD interactions confined hydrophobic cores more efficiently even though their long axes ratio LR2 is slightly smaller than LR3 for the SSY–DSCG blend. These results are in good agreement with H-bonding density and separation distance analysis discussed before since they show that SSY–BD stacks form relatively stronger and stable π–π interactions than SSY–DSCG ones. In addition, they confirm that H-bonds are favored between rigid chromonic species.
| π–π interaction | Hydrophilic (nm2) | Hydrophobic (nm2) | Total (nm2) |
|---|---|---|---|
| SSY–BD | 4.2 ± 0.2 | 3.0 ± 0.2 | 7.2 ± 0.3 |
| SSY–DSCG | 3.9 ± 0.2 | 3.4 ± 0.6 | 7.3 ± 0.6 |
The second scenario studied was DSCG–BD mixed π–π interactions. They were compared to DSCG–DSCG and BD–BD stacks since all of them are only seen inside the stacking column in Fig. 2. These results are summarized in Table 4.
| π–π interaction | Hydrophilic (nm2) | Hydrophobic (nm2) | Total (nm2) |
|---|---|---|---|
| DSCG–DSCG | 2.4 ± 0.3 | 2.1 ± 0.2 | 4.5 ± 0.4 |
| BD–BD | 3.7 ± 0.2 | 2.2 ± 0.1 | 5.9 ± 0.2 |
| DSCG–BD | 3.3 ± 0.2 | 1.8 ± 0.3 | 5.1 ± 0.4 |
The hydrophobic SASA is relatively similar in all three inner interactions. Nevertheless, the hydrophilic accessibility is clearly favored for BD–BD pairs compared to DSCG–DSCG ones, since the former have a more homogeneous distribution of polarizing groups around their polyaromatic cores and a flatter structure. Therefore, a stronger H-bonding capacity is expected for BD molecules, as discussed above. On the other hand, DSCG–BD interfaces have a hydrophilic SASA approximately intermediate to that of DSCG–DSCG and BD–BD ones. This intermediate behavior confirms that the BD flat structure enhanced the formation of H-bonds with adjacent DSCG mesogens by constraining the twisting of their stacking planes.
Therefore, SASA results confirm that chromonic binary blends with a long axes ratio close to unity may form stable mixtures by confining their hydrophobic cores efficiently. Even though chromonic mixture affinity is strongly dependent on molecular size differences, namely enthalpic interactions, the distribution of their solubilizing groups and, consequently, the formation of H-bonding interactions (entropic interactions), also played a crucial role defining the segregation modes discussed here.
4. Conclusions
The spontaneous aggregation between equimolecular SSY, DSCG, and BD binary blends were reproduced from a MD simulation scheme at highly dilute concentrations. Three different types of molecular segregation were found, depending on the mixture analyzed. These segregation modes are summarized in Fig. 13. Chromonic mixture aggregation affinity depended strongly on mesogen molecular size. However, the chromonics' conformational flexibility and distribution of their solubilizing groups also influenced the stability of the mixtures. Therefore, both π–π interactions (enthalpic contributions) and H-bonding network strength (entropic terms) synergistically promoted the formation of such segregation modes. All segregation modes promoted the minimization of the number of π–π interactions between distinct chromonic species. Stacking distances between aggregated molecules were preserved at approximately 0.34 nm for nearly all π–π stacks observed.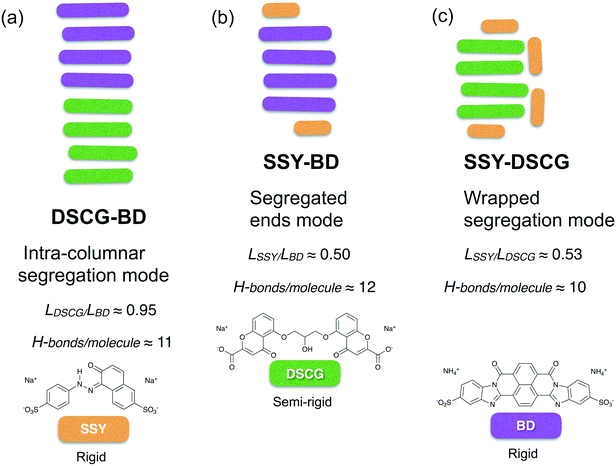 | ||
| Fig. 13 Segregation modes summarized for the three dilute chromonic binary mixtures studied: (a) DSCG-BD, (b) SSY-BD and (c) SSY-DSCG. | ||
In the DSCG–BD mixture, where particles have a comparable molecular radius but different degrees of flexibility and distribution of their hydrophobic cores, molecules aggregated within the same stacking column with predominant DSCG-rich and BD-rich regions. This phenomenon was referred to as intra-columnar segregation (see Fig. 13a). Therefore, DSCG and BD mesogens may represent a promising choice for the preparation of chromonic binary mixtures.
The effect of H-bonding on the aggregation of chromonics was more evident in mixtures that contained SSY molecules. For instance, in the SSY–BD mixture, mixed π–π stacks were distinguished only at the ends of the main BD column since the long axis length of SSY is approximately one-half that of BD. The remaining SSY molecules self-assembled into an independent dimer. Therefore, a relatively large area of BD hydrophobic cores was exposed to the solvent, minimizing the strength of SSY–BD π–π interactions. However, the H-bonding density of SSY–BD pairs was robust enough to maintain SSY molecules permanently attached to BD ones. This aggregation pattern was referred to as segregated ends mode (see Fig. 13b).
Similarly, the SSY–DSCG mixture formed relatively weaker mixed π–π interactions compared to the previous model since H-bond density around SSY–DSCG pairs was found to be slightly weaker than that of SSY–BD. Moreover, variations in the orientation of the stacking axes of DSCG cores constantly perturbed SSY mesogens because of the additional hydrophobic surface exposure lowering the H-bonding density of individual chromonic species as well. This effect originated a wrapped segregation mode where the remaining SSY mesogens stacked around the DSCG column in the form of T-shaped interactions (see Fig. 13c).
Although this methodology provided detailed atomistic information on the aggregation of chromonic mixtures at very low concentrations, it does not consider the effect of repulsive interactions due to the formation of large chromonic columns in more concentrated regimes. Hence, the formation of aggregates with more than one molecule in their cross-sectional areas, such as BD or CI Acid Red 266, has not been predicted yet.24 Therefore, novel simulation developments on reliable coarse-grained models are required to capture this phenomenon.24 Also, the advent of such new simulation methodologies would allow investigating more concentrated chromonic phases. However, this work lays the groundwork for the understanding of the molecular-level aggregation rules of chromonic binary mixtures in highly dilute regimes which are crucial for the processing of these materials in the paranematic state. Furthermore, these findings provide insight into the potential preparation of single-phase mixed chromonic blends based on simple molecular attributes, such as molecular geometry, polarizing group distribution, and conformational rigidity.
Furthermore, understanding the role of the distribution of chromonic functional groups and their effect on the formation of H-bonds may also contribute to the development of novel chromonic molecular designs by fine-tuning these non-covalent interactions concerning various counter-ions, dopants and even ionic solvents distinct from water.
Acknowledgements
This research has been supported by the Natural Science and Engineering Research Council of Canada (223086) (NSERC). OMR is grateful for financial assistance from Consejo Nacional de Ciencia y Tecnología (CONACyT) and McGill Engineering Doctoral Award (MEDA) scholarships. A. D. R is grateful to McGill University for financial support through the James McGill Professorship appointment. The authors are thankful to Calcul Québec for access to and support from its parallel computing facilities.References
- R. H. Hurt and Z. Y. Chen, Phys. Today, 2000, 53, 39–44 CrossRef CAS.
- K. Jian, H.-S. Shim, D. Tuhus-Dubrow, S. Bernstein, C. Woodward, M. Pfeffer, D. Steingart, T. Gournay, S. Sachsmann and G. P. Crawford, Carbon, 2003, 41, 2073–2083 CrossRef CAS.
- F. Guo, A. Mukhopadhyay, B. W. Sheldon and R. H. Hurt, Adv. Mater., 2011, 23, 508–513 CrossRef CAS PubMed.
- F. Guo and R. Hurt, Macromol. Chem. Phys., 2012, 213, 1164–1174 CrossRef CAS.
- M. R. Tomasik and P. J. Collings, J. Phys. Chem. B, 2008, 112, 9883–9889 CrossRef CAS PubMed.
- S.-W. Tam-Chang and L. Huang, Chem. Commun., 2008, 1957–1967 RSC.
- P. J. Collings, A. Dickinson and E. Smith, Liq. Cryst., 2010, 37, 701–710 CrossRef CAS.
- J. Lydon, J. Mater. Chem., 2010, 20, 10071–10099 RSC.
- H.-S. Park and O. D. Lavrentovich, Liquid Crystals Beyond Displays: Chemistry, Physics, and Applications, 2012, p. 449 Search PubMed.
- V. R. Horowitz, L. A. Janowitz, A. L. Modic, P. A. Heiney and P. J. Collings, Phys. Rev. E: Stat., Nonlinear, Soft Matter Phys., 2005, 72, 041710 CrossRef PubMed.
- D. M. Agra-Kooijman, G. Singh, A. Lorenz, P. J. Collings, H.-S. Kitzerow and S. Kumar, Phys. Rev. E: Stat., Nonlinear, Soft Matter Phys., 2014, 89, 062504 CrossRef PubMed.
- T. Sergan and J. Kelly, Liq. Cryst., 2000, 27, 1481–1484 CrossRef CAS.
- T. Schneider, A. Golovin, J. C. Lee and O. D. Lavrentovich, J. Inf. Disp., 2004, 5, 27–38 CrossRef.
- T. Schneider, K. Artyushkova, J. E. Fulghum, L. Broadwater, A. Smith and O. D. Lavrentovich, Langmuir, 2005, 21, 2300–2307 CrossRef CAS PubMed.
- M. Lavrentovich, T. Sergan and J. Kelly, Liq. Cryst., 2003, 30, 851–859 CrossRef CAS.
- M. Lavrentovich, T. Sergan and J. Kelly, Mol. Cryst. Liq. Cryst., 2004, 409, 21–28 CrossRef CAS.
- L. Huang, S. W. Tam-Chang, W. Seo and K. Rove, Adv. Mater., 2007, 19, 4149–4152 CrossRef CAS.
- T. Sergan, T. Schneider, J. Kelly and O. Lavrentovich, Liq. Cryst., 2000, 27, 567–572 CrossRef CAS.
- S.-W. Tam-Chang, J. Helbley, T. D. Carson, W. Seo and I. K. Iverson, Chem. Commun., 2006, 503–505 RSC.
- J. Y. Kim, K. Nayani, H. S. Jeong, H.-J. Jeon, H.-W. Yoo, E. H. Lee, J. O. Park, M. Srinivasarao and H.-T. Jung, Phys. Chem. Chem. Phys., 2016, 18, 10362–10366 RSC.
- S. Shiyanovskii, O. Lavrentovich, T. Schneider, T. Ishikawa, I. Smalyukh, C. Woolverton, G. Niehaus and K. Doane, Mol. Cryst. Liq. Cryst., 2005, 434, 259–270 Search PubMed.
- S. V. Shiyanovskii, T. Schneider, I. I. Smalyukh, T. Ishikawa, G. Niehaus, K. Doane, C. J. Woolverton and O. Lavrentovich, Phys. Rev. E: Stat., Nonlinear, Soft Matter Phys., 2005, 71, 020702 CrossRef CAS PubMed.
- V. Nazarenko, O. Boiko, M. Anisimov, A. Kadashchuk, Y. A. Nastishin, A. Golovin and O. Lavrentovich, Appl. Phys. Lett., 2010, 97, 284 CrossRef.
- A. Masters, Liq. Cryst. Today, 2016, 25, 30–37 CrossRef.
- S. K. Pal and S. Kumar, Biosens. Nanotechnol., 2014, 267–314 CAS.
- M. Golmohammadi and A. D. Rey, Entropy, 2008, 10, 183–199 CrossRef CAS.
- M. Golmohammadi and A. D. Rey, Liq. Cryst., 2009, 36, 75–92 CrossRef CAS.
- M. Golmohammadi and A. D. Rey, J. Non-Newtonian Fluid Mech., 2010, 165, 698–711 CrossRef CAS.
- M. Golmohammadi and A. D. Rey, J. Chem. Phys., 2010, 133, 034903 CrossRef PubMed.
- A. Rey, Mol. Cryst. Liq. Cryst., 1996, 281, 155–170 CrossRef CAS.
- A. D. Rey, Rheol. Acta, 1995, 34, 461–473 CrossRef CAS.
- A. D. Rey, Liq. Cryst., 1996, 20, 147–159 CrossRef CAS.
- A. Yamaguchi, G. P. Smith, Y. Yi, C. Xu, S. Biffi, F. Serra, T. Bellini, C. Zhu and N. A. Clark, Phys. Rev. E, 2016, 93, 012704 CrossRef PubMed.
- S.-W. Tam-Chang, W. Seo, K. Rove and S. M. Casey, Chem. Mater., 2004, 16, 1832–1834 CrossRef CAS.
- F. Chami and M. R. Wilson, J. Am. Chem. Soc., 2010, 132, 7794–7802 CrossRef CAS PubMed.
- W. Xiao, C. Hu, D. J. Carter, S. Nichols, M. D. Ward, P. Raiteri, A. L. Rohl and B. Kahr, Cryst. Growth Des., 2014, 14, 4166–4176 CAS.
- A. Akinshina, M. Walker, M. R. Wilson, G. J. Tiddy, A. J. Masters and P. Carbone, Soft Matter, 2015, 11, 680–691 RSC.
- O. M. Matus Rivas and A. D. Rey, Carbon, 2016, 110, 189–199 CrossRef CAS.
- T. Crowley, C. Bottrill, D. Mateer, W. Harrison and G. Tiddy, Colloids Surf., A, 1997, 129, 95–115 CrossRef.
- I. K. Iverson and S.-W. Tam-Chang, J. Am. Chem. Soc., 1999, 121, 5801–5802 CrossRef CAS.
- O. Aguilar Gutierrez and A. D. Rey, Langmuir, 2016, 32, 11799–11812 CrossRef CAS PubMed.
- D. Edwards, J. Jones, O. Lozman, A. Ormerod, M. Sintyureva and G. Tiddy, J. Phys. Chem. B, 2008, 112, 14628–14636 CrossRef CAS PubMed.
- H.-S. Park, S.-W. Kang, L. Tortora, Y. Nastishin, D. Finotello, S. Kumar and O. D. Lavrentovich, J. Phys. Chem. B, 2008, 112, 16307–16319 CrossRef CAS PubMed.
- A. J. Dickinson, N. D. LaRacuente, C. B. McKitterick and P. J. Collings, Mol. Cryst. Liq. Cryst., 2009, 509, 9–720 Search PubMed.
- L. Joshi, S.-W. Kang, D. M. Agra-Kooijman and S. Kumar, Phys. Rev. E: Stat., Nonlinear, Soft Matter Phys., 2009, 80, 041703 CrossRef PubMed.
- H.-S. Park, S.-W. Kang, L. Tortora, S. Kumar and O. D. Lavrentovich, Langmuir, 2011, 27, 4164–4175 CrossRef CAS PubMed.
- X. Yao, K. Nayani, J. O. Park and M. Srinivasarao, J. Phys. Chem. B, 2016, 120, 4508–4512 CrossRef CAS PubMed.
- A. Shams, X. Yao, J. O. Park, M. Srinivasarao and A. D. Rey, Soft Matter, 2015, 11, 5455–5464 RSC.
- J. Lydon, Curr. Opin. Colloid Interface Sci., 1998, 3, 458–466 CrossRef CAS.
- J. Lydon, Curr. Opin. Colloid Interface Sci., 2004, 8, 480–490 CrossRef CAS.
- Y. A. Nastishin, H. Liu, T. Schneider, V. Nazarenko, R. Vasyuta, S. Shiyanovskii and O. Lavrentovich, Phys. Rev. E: Stat., Nonlinear, Soft Matter Phys., 2005, 72, 041711 CrossRef PubMed.
- K. Nayani, R. Chang, J. Fu, P. W. Ellis, A. Fernandez-Nieves, J. O. Park and M. Srinivasarao, Nat. Commun., 2015, 6, 8067 CrossRef CAS PubMed.
- A. Shams, X. Yao, J. O. Park, M. Srinivasarao and A. D. Rey, Phys. Rev. E: Stat., Nonlinear, Soft Matter Phys., 2014, 90, 042501 CrossRef PubMed.
- A. Shams, X. Yao, J. O. Park, M. Srinivasarao and A. D. Rey, Liq. Cryst., 2015, 42, 506–519 CrossRef CAS.
- G. R. Van Hecke, K. K. Karukstis and S. Rayermann, Phys. Chem. Chem. Phys., 2015, 17, 1047–1052 RSC.
- N. Troullier and J. L. Martins, Phys. Rev. B: Condens. Matter Mater. Phys., 1991, 43, 1993 CrossRef CAS.
- J. M. Soler, E. Artacho, J. D. Gale, A. García, J. Junquera, P. Ordejón and D. Sánchez-Portal, J. Phys.: Condens. Matter, 2002, 14, 2745 CrossRef CAS.
- J. Wang, R. M. Wolf, J. W. Caldwell, P. A. Kollman and D. A. Case, J. Comput. Chem., 2004, 25, 1157–1174 CrossRef CAS PubMed.
- D. Case, T. Darden, T. Cheatham III, C. Simmerling, J. Wang, R. Duke, R. Luo, R. Walker, W. Zhang and K. Merz, There is no corresponding record for this reference.
- D. J. Price and C. L. Brooks III, J. Chem. Phys., 2004, 121, 10096–10103 CrossRef CAS PubMed.
- I. S. Joung and T. E. Cheatham III, J. Phys. Chem. B, 2008, 112, 9020–9041 CrossRef CAS PubMed.
- S. Plimpton, J. Comput. Phys., 1995, 117, 1–19 CrossRef CAS.
- W. Shinoda, M. Shiga and M. Mikami, Phys. Rev. B: Condens. Matter Mater. Phys., 2004, 69, 134103 CrossRef.
- R. W. Hockney and J. W. Eastwood, Computer simulation using particles, crc Press, 1988 Search PubMed.
- J.-P. Ryckaert, G. Ciccotti and H. J. Berendsen, J. Comput. Phys., 1977, 23, 327–341 CrossRef CAS.
- L. Martínez, R. Andrade, E. G. Birgin and J. M. Martínez, J. Comput. Chem., 2009, 30, 2157–2164 CrossRef PubMed.
- W. Humphrey, A. Dalke and K. Schulten, J. Mol. Graphics, 1996, 14, 33–38 CrossRef CAS PubMed.
- M. Haughney, M. Ferrario and I. R. McDonald, J. Phys. Chem., 1987, 91, 4934–4940 CrossRef CAS.
- E. Hamed, T. Xu and S. Keten, Biomacromolecules, 2013, 14, 4053–4060 CrossRef CAS PubMed.
Footnote |
| † Electronic supplementary information (ESI) available. See DOI: 10.1039/c7me00019g |
| This journal is © The Royal Society of Chemistry 2017 |


