 Open Access Article
Theoretical models of inhibitory activity for inhibitors of protein–protein interactions: targeting menin–mixed lineage leukemia with small molecules†
Wiktoria
Jedwabny
a,
Szymon
Kłossowski
b,
Trupta
Purohit
b,
Tomasz
Cierpicki
b,
Jolanta
Grembecka
*b and
Edyta
Dyguda-Kazimierowicz
 *a
*a
aDepartment of Chemistry, Wrocław University of Science and Technology, Wyb. Wyspiańskiego 27, 50-370 Wrocław, Poland. E-mail: Edyta.Dyguda@pwr.edu.pl; Tel: +48 71 320 3200
bDepartment of Pathology, University of Michigan, 1150 W. Medical Center Dr, MSRBI, Rm 4510D, Ann Arbor, MI 48109, USA. E-mail: Jolantag@umich.edu; Fax: +734 763 8764; Tel: +734 615 9319
First published on 12th September 2017
Abstract
Development and binding affinity predictions of inhibitors targeting protein–protein interactions (PPI) still represent a major challenge in drug discovery efforts. This work reports application of a predictive non-empirical model of inhibitory activity for PPI inhibitors, exemplified here for small molecules targeting the menin–mixed lineage leukemia (MLL) interaction. Systematic ab initio analysis of menin–inhibitor complexes was performed, revealing the physical nature of these interactions. Notably, the non-empirical protein–ligand interaction energy comprising electrostatic multipole and approximate dispersion terms (E(10)El,MTP + EDas) produced a remarkable correlation with experimentally measured inhibitory activities and enabled accurate activity prediction for new menin–MLL inhibitors. Importantly, this relatively simple and computationally affordable non-empirical interaction energy model outperformed binding affinity predictions derived from commonly used empirical scoring functions. This study demonstrates high relevance of the non-empirical model we developed for binding affinity prediction of inhibitors targeting protein–protein interactions that are difficult to predict using empirical scoring functions.
I. Introduction
Protein–protein interactions (PPI) between Mixed Lineage Leukemia (MLL) or MLL fusion proteins and menin are associated with a subtype of acute leukemia named MLL leukemia,1 which constitutes 5–10% of acute leukemia in adults2 and about 70% of acute leukemia in children.3 The treatment of MLL leukemia patients is currently ineffective,4 with a 5 year survival rate of about 35%.5 The menin–MLL protein–protein interaction has been well validated as a therapeutic target in MLL leukemia using both genetic1 and pharmacologic approaches.6–11 Therefore, inhibition of the menin–MLL interaction appears to be of crucial importance for the development of novel targeted therapy against aggressive leukemia resulting from the leukemogenic activity of MLL fusion proteins.Our recently identified inhibitors disrupting the oncogenic activity of MLL fusion proteins by blocking the protein–protein interaction between menin and MLL belong to the thienopyrimidine class of compounds.6,7 These compounds directly bind to menin at MLL binding sites with low nanomolar binding affinities. We have also demonstrated that substantial improvement in inhibitory activity resulted from incorporation of fluorine atoms into an ethyl group on the thienopyrimidine scaffold.7 In particular, the MI-2-2 compound bearing a trifluoroethyl substituent exhibited an over 20-fold increase in the binding affinity compared to its non-fluorinated counterpart.6,7 Indeed, compounds with fluorine atoms are estimated to constitute about 20–25% of currently known drugs, as fluorine substituents affect both binding affinity and physicochemical properties of small molecules.12–14 While a rational approach for designing favorable fluorine interactions with proteins has recently been proposed,10 complementary methods providing insight into the physical nature of protein–ligand interactions would possibly augment these predictions. Furthermore, development of potent small molecule inhibitors targeting protein–protein interactions still constitutes a major challenge in the drug discovery field,15–17 and therefore identification of computational methods for effective prediction of binding affinities for PPI inhibitors represents a very important task and should attract a lot of attention in the drug discovery community.
Currently available methods used to estimate inhibitory activity are mostly based on empirical scoring functions or force fields, yielding widely different predictions.18,19 Due to significant computational cost, more accurate quantum chemical estimates are impractical in high throughput drug design and their applicability to protein–ligand interactions has been rather limited.20,21 However, alternative non-empirical models could be systematically derived by partitioning the ab initio energy of the corresponding inhibitor–receptor interactions into well defined components using state-of-the-art perturbation or variational theories.22 Analytical formulas for separate binding energy terms can be the subject of subsequent approximations leading to affordable non-empirical scoring models of general applicability. We have previously shown that the electrostatic term alone was sufficient to rank polar or charged inhibitors of phenylalanine ammonia-lyase (PAL),22 leucine aminopeptidase (LAP)22 and urokinase (uPA).23 Further results characterizing essentially nonpolar inhibitors of fatty acid amide hydrolase (FAAH)24 indicated that supplementing the electrostatic multipole term with the long-range dispersion contribution was required to afford reasonable correlation with experimental binding affinity data.
In contrast to empirical scoring functions derived from limited training sets, unified non-empirical models based on long-range multipole electrostatic and dispersion interactions might be more universal and less arbitrary. Assessment of the performance of non-empirical interaction energy analysis is especially important in the context of inhibitors targeting protein–protein interactions. Compared to widely studied enzyme–inhibitor interactions, experimental and computational characterization of small molecule PPI inhibition faces numerous challenges.25 Unlike buried binding cavities present in enzymes, binding sites at protein–protein interfaces are relatively flat and solvent exposed.26 Although several empirical and semi-empirical approaches have been successfully applied to rank selected PPI inhibitors,27–30 empirical scoring methods and knowledge-based potentials have not been trained to work with ligands that bind to PPI interfaces.31,32 Therefore, models of inhibitory activity derived from ab initio quantum mechanical methods might then be particularly useful to describe the activity of PPI inhibitors more accurately as no parameterization is required here and the applicability of these methods might be more general.
This work aims to develop systematic non-empirical models of inhibitory activity for small molecule inhibitors blocking the protein–protein interaction between menin and MLL. The choice of the protein system and compounds was made to address the accuracy of description of PPI inhibition by small molecules using computational approaches. As already mentioned, we successfully applied this non-empirical model to FAAH inhibitors with the interaction energy being expressed by the long-range electrostatic and dispersion terms.24 To determine whether such a model can be applied to PPI inhibitors represents a major focus of this work.
The theoretical model of inhibitory activity reported here involves a representative model of the MLL binding site on menin (Fig. 1) and a set of menin–MLL inhibitors that we have already characterized experimentally6,7,10 (Table 1). To limit the computational cost required for reference ab initio calculations of binding energy, only a subset of menin–MLL inhibitors reported in ref. 6, 7 and 10 was selected. Compound selection was made to accommodate the menin–MLL inhibitors with distinct substituents on the thienopyrimidine scaffold and a range of activity broad enough for the resulting model to be reliable. This system was used to develop a non-empirical model for activity prediction of menin–MLL inhibitors. Predictive capabilities of this approach were tested against new thienopyrimidine inhibitors of the menin–MLL interaction, developed independently to examine the influence of varying substituents to this scaffold on their inhibitory activity. Remarkably, nearly quantitative agreement was achieved between theoretically assessed and experimentally measured IC50 values. Competitive computational cost and more favorable performance of the non-empirical method applied here over those of commonly used empirical scoring functions indicate that this method can be successfully applied to rank newly designed inhibitors targeting protein–protein interactions.
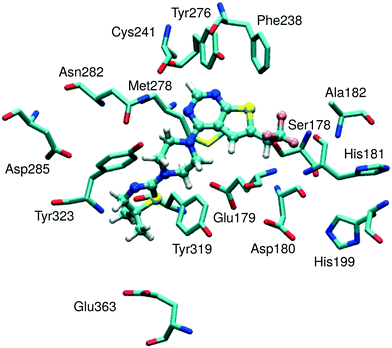 | ||
| Fig. 1 Representative model of a menin binding site with an MI-2-2 inhibitor bound. The model was derived from the structure of the menin–MI-2-2 complex (4GQ4 in PDB). | ||
| Inhibitor | Structure | IC50 [μM] |
|---|---|---|
| a Inhibitory activity values are taken from ref. 7. b Inhibitory activity values are taken from ref. 10. c Inhibitory activity values are taken from ref. 6. | ||
| MI-2-2 |
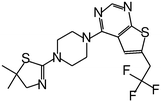
|
0.046 |
| MI-859 |
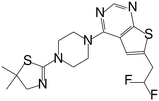
|
0.065 |
| MI-319 |
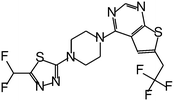
|
0.082 |
| MI-2-3 |
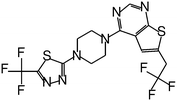
|
0.092 |
| MI-836 |
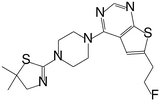
|
0.260 |
| MI-2 |
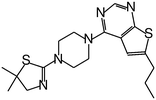
|
0.45 |
| MI-273 |

|
0.674 |
| MI-20 |
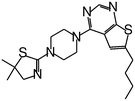
|
0.75 |
| MI-2-4 |

|
0.765 |
| MI-326 |
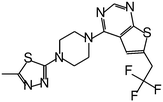
|
0.779 |
| MI-19 |

|
1.200 |
| MI-333 |

|
1.653 |
| MI-12 |

|
14 |
| MI-16 |
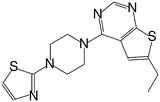
|
46 |
| MI-4 |

|
52 |
| MI-10 |
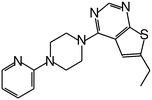
|
58 |
| MI-11 |

|
87 |
| MI-6 |
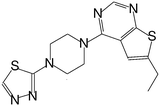
|
193 |
II. Methods
Physical nature of the menin–inhibitor interactions
To analyze the physical nature of interactions between menin and small molecule inhibitors blocking the menin–MLL interaction, the binding energy was calculated according to the Hybrid Variational-Perturbation Theory (HVPT).33,34 This approach enables the study of relatively large systems (e.g., enzyme–inhibitor complexes modelled as representative sets of protein amino acid residues and the corresponding ligands) at a reasonable computational cost.22,35–39 The HVPT decomposition scheme of the interaction energy defines partitioning of the second-order Møller–Plesset (MP2) binding energy (EMP2) into the electrostatic multipole (E(10)EL,MTP), penetration (E(10)EL,PEN), exchange (E(10)EX), delocalization (E(R0)DEL) and correlation (E(2)CORR) terms, as shown in eqn (1):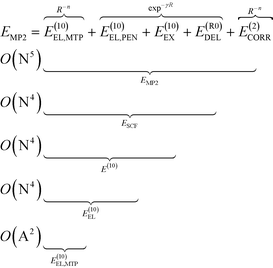 | (1) |
The subsequent contributions to the MP2 binding energy are characterized by increasing computational cost, as indicated by O(X) scaling, where N and A stand for the number of atomic orbitals and atoms, respectively (see eqn (1)).
The E(10)EL,MTP term in eqn (1) represents the long-range electrostatic multipole binding energy calculated from atomic multipole expansion.40 This term includes interactions of Mulliken atomic charges in addition to interactions of atomic dipoles, quadrupoles, hexadecapoles, etc., representing the anisotropy of atomic charge distribution.
The short-range penetration term E(10)EL,PEN is defined as E(10)EL,PEN = E(10)EL − E(10)EL,MTP, where E(10)EL represents the first-order electrostatic energy. The first-order repulsive exchange term E(10)EX is calculated from the first-order Heitler–London energy, E(10)![[thin space (1/6-em)]](https://www.rsc.org/images/entities/char_2009.gif) :
:![[thin space (1/6-em)]](https://www.rsc.org/images/entities/char_2009.gif) E(10)EX = E(10) − E(10)EL. The classical induction and charge transfer terms are represented by the higher order delocalization energy, E(R0)DEL, which is obtained as the difference between the counterpoise-corrected self-consistent field (SCF) variational energy, ESCF, and the first-order Heitler-London energy, E(10). The correlation term, accounting for dispersion and exchange–dispersion interactions as well as the intramolecular correlation contribution, is defined as: E(2)CORR = EMP2 − ESCF. As emphasized in eqn (1), all the subsequent corrections to EMP2 interaction energy could be categorized into long- and short-range interactions varying with the intermolecular distance, R, as R−n(n ∈
E(10)EX = E(10) − E(10)EL. The classical induction and charge transfer terms are represented by the higher order delocalization energy, E(R0)DEL, which is obtained as the difference between the counterpoise-corrected self-consistent field (SCF) variational energy, ESCF, and the first-order Heitler-London energy, E(10). The correlation term, accounting for dispersion and exchange–dispersion interactions as well as the intramolecular correlation contribution, is defined as: E(2)CORR = EMP2 − ESCF. As emphasized in eqn (1), all the subsequent corrections to EMP2 interaction energy could be categorized into long- and short-range interactions varying with the intermolecular distance, R, as R−n(n ∈ ![[Doublestruck N]](https://www.rsc.org/images/entities/char_e171.gif) ) and exp−γR(γ > 0), respectively. In the above equations, the zero value of the second superscript represents uncorrelated interaction energy contributions, and the E(2)CORR term denotes the inter- and intra-molecular correlation contributions.
) and exp−γR(γ > 0), respectively. In the above equations, the zero value of the second superscript represents uncorrelated interaction energy contributions, and the E(2)CORR term denotes the inter- and intra-molecular correlation contributions.
Within the HVPT decomposition scheme, the dispersion component is included in the computationally demanding E(2)CORR correlation energy term, scaling with the fifth power of molecular size expressed by the number of atomic orbitals, N. The recently derived atom–atom potential function, EDas, fitted to benchmark values of dispersion interactions41,42 has been a far more affordable alternative to these costly calculations, as they scale with the square number of atoms O(A2), in contrast to ab initio calculations scaling at least with the fifth power of the number of orbitals, O(N5). Following the remarkable performance of the EDas function to describe noncovalent interactions in hydrogen-bonded complexes,43 we applied this approximate dispersion term in our model for inhibitory activity prediction.
Calculation of binding energy
The structures of menin–MLL inhibitors considered herein are given in Table 1. The crystal structure of menin in complex with the MI-2-2 inhibitor (PDB accession code 4GQ4;7 1.27 Å resolution) was used for modeling of the geometry of the remaining complexes. The structures of inhibitors were built using Schrödinger Suite 2012 (ref. 44) and further refined by all-atom optimization in the Maestro44 implemented OPLS 2005 force field,45 with the convergence set to a non-hydrogen atom RMSD of 0.1 Å. The preparation of the protein structure involved: (i) determination of the optimal hydrogen bonding network for the protein crystal structure with Protein Preparation Wizard46 PROPKA implementation,47–50 at pH 7.5, i.e. the pH matching the experimental conditions for the measurements of inhibitory activities, (ii) building of missing hydrogen atoms with Maestro, and (iii) optimization of the hydrogen atoms in Maestro and the OPLS 2005 force field, following the optimization protocol provided by Protein Preparation Wizard (heavy atoms were kept frozen and the convergence criterion was defined as the hydrogen atom RMSD of 0.3 Å). The same protein receptor structure was used for the following binding energy calculations and scoring of all the menin–MLL inhibitors considered herein. Non-empirical interaction energy evaluation involved a limited-size model of the receptor, composed of selected amino acid residues, as described in the following discussion.Binding energy calculations involved a menin binding site represented by 15 amino acid residues (Fig. 1) selected by their closest proximity to the ligand, namely within approximately 4 Å from MI-2-2 (see Table S1, ESI,† for the distances between MI-2-2 and menin residues). Negatively charged Asp180 and positively charged His199 residues constituted an ionic pair, and such a pair was included in further calculations (i.e., as a neutral Asp180–His199 dimer formed by counter-charged residues). There were no counter-charged amino acid residues in close proximity to the remaining negatively charged residues (Glu179, Asp285 and Glu363). The dangling bonds arising from cutting the residues out of the protein structure were saturated by hydrogen atoms.
The menin–inhibitor binding energy was calculated as the sum of the above defined intermolecular energy components obtained for each inhibitor–amino acid residue pair with a modified34 version of GAMESS51 program using the 6-31G(d)52–54 basis set. Counterpoise correction was applied to eliminate the basis set superposition error.55
Binding affinity predictions using empirical scoring functions
To perform empirical scoring with the menin–inhibitor complexes obtained in a way described in the previous section, the following functions implemented in Discovery Studio 3.5 Suite56 were used: LigScore,57 Piecewise Linear Potential (PLP),58,59 Jain,60 Potential of Mean Force (PMF),61,62 Ludi,63,64 and Discovery Studio binding free energy.65 Two commonly used docking programs, AutoDock Vina66 and GOLD 4.0,67 were also employed in the scoring of the enzyme–inhibitor interactions. Calculations performed with AutoDock Vina and GOLD involved no docking to avoid the influence of the docking procedure on the scoring results. All available Gold scoring functions were tested, i.e., GoldScore, ChemScore, and Astex Statistical Potential (ASP). PyMOL68 and the PyMOL AutoDock/Vina plugin69 were used for the preparation of the receptor and inhibitors for scoring in AutoDock Vina. The latter was carried out with a 22.5 Å cubic grid centered on the MI-2-2 inhibitor. A GOLD scoring run was performed with a spherical grid centered in the same way and encompassing the amino acid residues within 15.0 Å radius from the point of origin.The performance of particular scoring methods was evaluated by means of the Pearson's correlation coefficient calculated with respect to experimentally determined inhibitory activity6,7,10 (see Table 1). Scoring functions, for which the higher score indicates the greater binding potency, were assigned to the opposite of the calculated value of the correlation coefficient to enable direct comparison with the results of non-empirical binding energy calculations, assigning lower interaction energy values to more potent inhibitors. The results were additionally compared in terms of the success rate of prediction, Npred (the predictivity). Following nonparametric statistics, the predictivity refers to the percentage of concordant pairs among all possible pairs of complexes within a given set. A concordant pair denotes two complexes with computationally evaluated relative stability being of the same sign as the relative experimental binding affinity (see ref. 70 for details).
Development of novel menin–MLL inhibitors
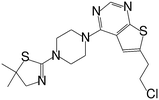
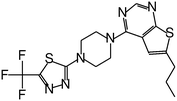
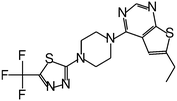
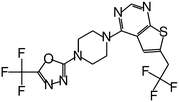
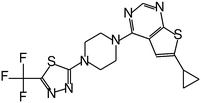
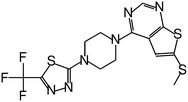
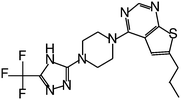
The development and synthesis of compounds: MI-2-2, MI-859, MI-319, MI-2-3, MI-836, MI-2, MI-273, MI-20, MI-2-4, MI-326, MI-19, MI-333, MI-12, MI-16, MI-4, MI-10, MI-11, and MI-6 which were used to develop the theoretical model of inhibitory activity, was described before.6,7,10 Novel menin–MLL inhibitors (compounds 1, 2, 3, 4, 5, 6, and 7) were designed using the menin–MI-2-2 complex7 to test the effect of varying substituents on the MI-2-2 scaffold. These new compounds were obtained from synthesis on demand from the contract research organization. All compounds were provided with the certificate of analysis and in addition were fully characterized in-house by MS and NMR (see the ESI† for characterization of compounds 1, 2, 3, 4, 5, 6, and 7).Biological activity of menin–MLL inhibitors
The inhibitory activity of compounds: MI-2-2, MI-859, MI-319, MI-2-3, MI-836, MI-2, MI-273, MI-20, MI-2-4, MI-326, MI-19, MI-333, MI-12, MI-16, MI-4, MI-10, MI-11, and MI-6, was reported before.6,7,10 Inhibition of the menin–MLL interaction by compounds 1–7 was assessed by the fluorescence polarization (FP) assay using the protocol described previously.6,71 Briefly, the fluorescein-labeled MLL (MBM1) peptide at 10 nM, menin at 100 nM and compounds at varying concentrations were used for IC50 determination in FP buffer (50 mM Tris, pH 7.5, 50 mM NaCl, 1 mM DTT). The compounds (5% final DMSO concentration) were added to the menin–MLL peptide complex and incubated for 1 h before changes in fluorescence polarization were measured using a PHERAstar microplate reader (BMG).III. Results and discussion
Interaction energy calculations for menin–inhibitor complexes
We performed the ab initio quantum mechanics calculations of the non-empirical interaction energy between menin and the thienopyrimidine class of our recently developed menin–MLL inhibitors with inhibitory activity spanning over the five orders of magnitude (Table 1). Eighteen compounds were initially selected to calculate their interaction energy with the representative model of the menin binding site comprising 15 amino acid residues positioned in the closest proximity to the ligand molecules (Fig. 1). The total binding energy values at the subsequent levels of theory, obtained as a sum of the interaction energy values calculated in a pairwise manner for each amino acid residue on menin and the corresponding ligand molecule, for all menin–inhibitor complexes are listed in Table 2. The total interaction energy calculated at the highest level of theory, EMP2 (eqn (1)), has negative values for all inhibitors included in this study, ranging from −37.8 to −26.8 kcal mol−1 (Table 2), which supports their favorable interactions with menin. The dominant component of the total interaction energy is the electrostatic term E(10)EL, which changes from −49.6 to −41.0 kcal mol−1, supporting the importance of the electrostatic contribution to the ligand binding affinity for this class of menin–MLL inhibitors. The positive values of the E(10) energy, originating from the repulsive E(10)EX term, suggest the presence of short contacts between inhibitors and binding site residues.23ESCF energy values are also mostly positive, but substantially smaller than E(10) values due to stabilizing delocalization interactions. Finally, the correlation term (E(10)CORR) restores the stabilizing characteristics reflected by the negative values of the total interaction energy calculated at the reference MP2 level of theory. The interaction energy estimate composed of the multipole component of the electrostatic energy and the approximate dispersion term (E(10)EL,MTP + EDas), has resulted in the lowest (the most negative) values (Table 2) due to the lack of repulsive contributions in this particular energy expression.| Inhibitor | E (10)EL,MTP | E (10)EL | E (10) | E SCF | E MP2 | E (10)EL,MTP + EDas |
|---|---|---|---|---|---|---|
| a In units of kcal mol−1. b Percentage of successful predictions [%]. c Correlation coefficient for the correlation of the energy obtained at a given level of theory and the experimental inhibitory activity expressed as pIC50. d Standard error of estimate, in units of kcal mol−1. | ||||||
| MI-2-2 | −26.0 | −48.1 | 20.3 | 2.2 | −37.6 | −100.2 |
| MI-859 | −25.0 | −48.8 | 22.9 | 5.4 | −35.3 | −98.0 |
| MI-319 | −25.6 | −47.0 | 19.5 | 2.6 | −35.5 | −97.7 |
| MI-2-3 | −26.1 | −47.4 | 19.6 | 2.7 | −35.7 | −99.2 |
| MI-836 | −25.9 | −49.6 | 20.4 | 2.8 | −37.8 | −96.8 |
| MI-2 | −23.3 | −45.9 | 21.9 | 3.4 | −36.8 | −94.7 |
| MI-273 | −22.1 | −49.3 | 31.9 | 14.5 | −28.0 | −101.8 |
| MI-20 | −21.6 | −44.1 | 23.9 | 5.7 | −35.7 | −95.5 |
| MI-2-4 | −19.9 | −48.3 | 33.4 | 17.2 | −26.8 | −92.3 |
| MI-326 | −26.2 | −47.2 | 17.9 | 1.1 | −36.7 | −97.4 |
| MI-19 | −22.1 | −44.1 | 22.8 | 5.0 | −34.8 | −92.3 |
| MI-333 | −26.8 | −48.2 | 17.9 | 1.0 | −36.9 | −97.4 |
| MI-12 | −25.7 | −43.9 | 11.7 | −3.5 | −34.6 | −80.9 |
| MI-16 | −19.3 | −41.7 | 22.4 | 6.4 | −30.3 | −80.9 |
| MI-4 | −23.4 | −41.6 | 14.0 | −1.0 | −32.4 | −78.5 |
| MI-10 | −20.9 | −41.7 | 23.3 | 7.0 | −30.9 | −88.4 |
| MI-11 | −20.9 | −41.0 | 21.0 | 5.2 | −30.8 | −86.0 |
| MI-6 | −19.3 | −41.0 | 22.1 | 6.2 | −30.2 | −80.5 |
| N pred | 69.3 | 81.7 | 49.0 | 55.6 | 69.9 | 81.1 |
| R | −0.63 | −0.87 | 0.17 | 0.03 | −0.55 | −0.87 |
| SE | 2.1 | 1.6 | 5.2 | 5.1 | 2.9 | 3.9 |
For all menin–inhibitor complexes included in this study, Tyr276 serves as a hydrogen bond donor interacting with the nitrogen atom of the thienopyrimidine ring in the menin–MLL inhibitors. Compared to the remaining residues, Tyr276 significantly contributes to the total interaction energy of all inhibitors (Table S2, ESI†). The interaction energy values associated with essentially all Tyr276–inhibitor pairs fluctuate around −15 and −6 kcal mol−1 for E(10)EL and EMP2 energy, respectively, indicating the presence of strong hydrogen bonding in all menin–inhibitor complexes studied here. In addition, Asn282, Met278, and Glu179 also appear to have a pronounced impact on inhibitor binding affinities due to their substantial contribution to the total binding energy (Table S2, ESI†). The involvement of the remaining menin residues in inhibitor binding seems to be less significant.
Correlation of interaction energy with inhibitory activity of menin–MLL inhibitors
The highest absolute values of EMP2 and E(10)EL were obtained for the most potent inhibitors described here (Table 2). Likewise, the weakest MI-6 inhibitor is characterized by the lowest absolute values of EMP2 and E(10)EL energies, suggesting a possible correlation with the ligand binding affinity. To quantify the relationship between the interaction energy and inhibitory activity, the interaction energy values calculated at different levels of theory were correlated with the IC50 values of menin–MLL inhibitors measured using the fluorescence polarization assay (Table 1). The relationship between the total interaction energies calculated at selected levels of theory and the inhibitory activity of respective inhibitors is plotted in Fig. 2.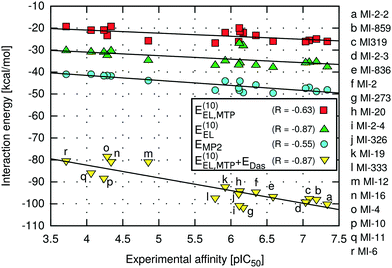 | ||
| Fig. 2 Menin–inhibitor binding energies at different levels of theory as a function of inhibitory activity. | ||
Very strong correlation was obtained for E(10)EL energy, resulting in a remarkably high correlation coefficient R, equal to −0.87 (Fig. 2). Furthermore, the electrostatic multipole term E(10)EL,MTP also demonstrates correlation with the inhibitory activity of menin–MLL inhibitors (R = −0.63; Fig. 2). These results indicate that the electrostatic interaction energy appears to be sufficient to represent the differences in the menin–inhibitor binding affinities within this class of compounds. This is likely related to the nature of the protein binding site, as the inhibitor binding pocket on menin features a number of polar amino acid residues. Indeed, only four out of 15 residues included in these calculations possess non-polar side chains, while the remaining 11 amino acid residues bear polar or charged side chains (e.g., Glu179, Asp285, Glu363, Asp180, His199, Ser178, and Asn282; see Fig. 1). Accordingly, the dominant contribution of the electrostatic effects in the interaction energy is reflected by its good correlation with the binding affinity characterizing these compounds.
In contrast, the remaining components of the interaction energy, i.e., E(10) and ESCF energy terms, do not exhibit satisfactory correlation with the inhibitory activity of the thienopyrimidine class of menin–MLL inhibitors (Table 2). The lack of correlation between the inhibitory activity and E(10) interaction energy presumably arises from including the short-range interaction energy component, which is very sensitive to any inaccuracies that might occur in the modelled protein–ligand complexes. The repulsive exchange term depends exponentially on the intermolecular distance and shortening of the intermonomer separation has a large impact on the corresponding binding energy.23,72 Recent systematic analysis of 66 biomolecular complexes72 indicated that considering only the long-range electrostatic term (without taking into account the repulsive exchange term) leads to much better estimates of relative ligand binding affinities. More importantly, this phenomenon is valid even for shortened intermolecular distances resulting from force field inadequacy73 or the basis set superposition error.74 Interestingly, it has been shown that augmenting the multipole electrostatic term with EDas dispersion approximation can further improve predictions of relative stabilities within a particular set of protein–ligand complexes.24
Indeed, despite the prevalence of electrostatic interactions in menin–inhibitor complexes, the E(10)EL,MTP + EDas model, in which both electrostatic and dispersion interactions are incorporated, is characterised by the strong correlation with the inhibitory activity, reflected by the high value of the correlation coefficient (R = −0.87; Fig. 2). Therefore, it seems that the interactions of predominantly electrostatic nature could be accurately and inexpensively described if the dispersion effects are incorporated in addition to the electrostatic term. Moreover, the significantly improved predictivity of E(10)EL,MTP + EDas compared to that of EMP2 energy is probably due to the absence of the repulsive exchange term, E(10)EX, which is included at the MP2 level of theory. As mentioned above, this particular term is very sensitive to the presence of intermolecular short contacts commonly occurring in modelled structures of protein–ligand complexes.23,72 In fact, the preparation of the menin–inhibitor complexes applied herein involved a simple optimization procedure employing rigid receptor representation. More sophisticated refinement protocols were avoided to verify the applicability of the proposed approach to quick assessment of the structural modifications in, e.g., the lead optimization stage. Possible unresolved steric clashes have probably resulted in the overly magnified repulsive exchange term, E(10)EX, and the loss of correlation at the higher levels of theory (up to the EMP2 energy), which include this particular interaction energy contribution.
In general, dispersion interactions are not absolutely required to properly describe the inhibitor binding forces within systems with dominant electrostatic interactions, such as menin–inhibitor complexes. However, a simple electrostatic model of interaction energy is clearly insufficient in the case of nonpolar hydrophobic systems.24 The performance of the E(10)EL,MTP + EDas model proposed herein appears to be satisfactory regardless of the physical nature of the inhibitory activity, and thus such a model could be used universally in the inhibitor design process without an unnecessary increase in the computational cost.
Differences in ligand binding affinities might arise from the interactions of inhibitors with a subset of amino acid residues in the binding site. The significant contribution to the total binding energy does not necessarily indicate that a given amino acid residue is responsible for the observed inhibitory activity differences, as such interaction could be similar for all tested inhibitors. Residues that contribute the most to the relative inhibitory activity might be identified by monitoring the changes in correlation coefficients upon removal of particular residues from the binding site model (Table S3, ESI†). Accordingly, the interaction of inhibitors with Glu179, Asp285, Tyr276, and Tyr323 residues seems to be the most important in terms of the differences in the binding potencies. Upon removal of these residues from the model of the menin binding site, the values of the corresponding correlation coefficients become substantially worse (Table S3, ESI†). Therefore, the interaction with Glu179, Asp285, Tyr276, and Tyr323 residues appears to influence the relative binding affinities and should be carefully studied while designing novel menin–MLL inhibitors.
Scoring with empirical functions
We have also applied a number of empirical scoring approaches available in the Discovery Studio,56 GOLD 4.0,67 and AutoDock Vina66 programs to compare their predictive capability with the quantum mechanics-based models presented in Table 2. The performances of these empirical scoring methods, reflected by the correlation of the calculated binding affinity estimate with the experimentally measured inhibitory activity, are compared in Table 3. Overall, the empirical scoring functions tested herein yielded varying predictions with respect to the experimentally established ranking of the menin–MLL inhibitors. Only four out of 15 scoring functions exhibited favorable predictive capabilities, as demonstrated by the R correlation coefficient and Npred (defined as the percentage of successful predictions) values exceeding or close to 0.8 and 75%, respectively. The best performance was obtained for the LigScore1 scoring function implemented in Discovery Studio (R = −0.81, Npred = 75.2%; Table 3). However, the performance of the majority of the remaining empirical scoring approaches evaluated here is unsatisfactory, with poor correlation reflected by unsatisfactory R values (R < 0.7) and insufficient predictivity (Table 3). Utterly different predictive abilities of empirical scoring functions might originate from the inherent parameterization carried out with training sets, which are rarely applicable to all protein–ligand complexes. Besides, selection of the best performing scoring function for new designed ligands represents a challenge due to high variability of the results obtained from various scoring functions applied. An additional challenge posed here is the fact that we are dealing with inhibitors of protein–protein interactions. Distinct features of binding pockets existing in such complexes may not be accounted for by the empirical scoring methods calibrated with classical protein–ligand interactions, such as enzyme–inhibitor complexes.31,32| Scoring function | R | N pred |
|---|---|---|
| a Correlation coefficient between the calculated binding affinity estimate and the experimental inhibitory activity expressed as pIC50. b Percentage of successful predictions [%]. | ||
| E (10)EL,MTP + EDas | −0.87 | 81.1 |
| LigScore1 | −0.81 | 75.2 |
| Jain | −0.80 | 77.8 |
| E binding (Discovery Studio 3.5) | −0.79 | 74.5 |
| PLP2 | −0.79 | 80.4 |
| PLP1 | −0.74 | 77.8 |
| PMF04 | −0.65 | 73.2 |
| Ludi2 | −0.62 | 72.6 |
| LigScore2 | −0.43 | 69.9 |
| Ludi1 | −0.40 | 58.8 |
| Ludi3 | −0.23 | 54.3 |
| PMF | +0.24 | 41.2 |
| Goldscore | −0.64 | 69.9 |
| ASP | −0.62 | 70.6 |
| Chemscore | −0.28 | 60.1 |
| Binding affinity (AutoDock Vina) | −0.67 | 73.2 |
While plausible predictions were obtained with selected empirical scoring approaches, the E(10)EL,MTP + EDas model of inhibitory activity appears to outperform the classical scoring functions presented herein, resulting in remarkable agreement with the experimental data characterized by R = −0.87 and Npred = 81.1%. The computational cost of the E(10)EL,MTP + EDas function is as attainable as that of empirical scoring models.24 Unlike the latter, no parameterization employing empirical data was involved to develop the E(10)EL,MTP + EDas model. Successful prediction of the relative binding affinities of menin–MLL inhibitors suggests that small molecule inhibitors that block protein–protein interactions are within the range of applicability of this particular non-empirical scoring method.
Binding affinity predictions of novel menin–MLL inhibitors
We then aimed to use the non-empirical interaction energy calculations to predict the binding affinity of new menin–MLL inhibitors. Rapid prediction of the inhibitory activity of novel menin–MLL inhibitors can be made with the following relationship derived from the linear least-squares regression analysis of experimental pIC50 data and calculated E(10)EL,MTP + EDas values (the latter are given in kcal mol−1), resulting in the following equation: | (2) |
To examine the applicability of this method to predict the activity of new menin–MLL inhibitors, seven novel compounds with varying substituents on the thienopyrimidine scaffold of MI-2-2 were selected. The development, synthesis and characterization of these compounds were performed as a part of the structure–activity studies directed at optimization of the lead compound. The structures and inhibitory activities of seven novel menin–MLL inhibitors are presented in Table 4. With the exception of the least potent compound 7, the range of inhibitory activity characterizing these novel menin–MLL inhibitors is similar to the reference set of compounds listed in Table 1. The highest potency was obtained for compounds 1 and 2 (IC50 = 193 nM and 650 nM, respectively), while other compounds showed inhibitory activity in the micromolar range (Table 4).
The predictive capabilities of eqn (2) were then tested against the set of novel menin–MLL inhibitors (Table 4), and the calculated interaction energy for the new compounds was used to predict their theoretical IC50 values. The systematic analysis of the interaction energy values calculated at the subsequent levels of theory for these seven menin–MLL complexes is provided in Table S4, ESI.† As observed in the case of the initial set of 18 menin–MLL inhibitors (Table 2), the EMP2 binding energy is characterized by negative values, ranging from −34.5 to −30.5 kcal mol−1 (Table S4, ESI†). The interactions formed by these new menin–MLL inhibitors are essentially electrostatic in nature, which is reflected by E(10)EL binding energy values exceeding −35 kcal mol−1. Accounting for the repulsive E(10)EX term, possibly overestimated due to shortened intermonomer distances,23 results in positive values of both E(10) and the subsequent ESCF binding energy terms. The delocalization and correlation contributions are both required to restore the stabilizing nature of the interaction energy obtained at the reference MP2 level of theory. The correlation between the calculated EMP2 binding energy and the experimental binding potency is reflected by the correlation coefficient R = −0.65 (Table S4, ESI†). Noticeably, the R values of −0.83 and −0.84 characterize the electrostatic term, E(10)EL, and the E(10)EL,MTP + EDas energy values, respectively, confirming the prevalence of electrostatic interactions at the inhibitor–protein interface and the adequacy of the E(10)EL,MTP + EDas function for the description of menin–MLL inhibition.
The performance of empirical scoring functions already considered for the training set of menin–MLL inhibitors (Table 3) was also tested on the set of seven inhibitors analyzed herein. The predictive capabilities of these empirical models are presented in Table S5, ESI.† Similarly to the results obtained in the training set of 18 inhibitors (Table 3), only two of the empirical scoring approaches considered here yielded predictions characterized with R correlation coefficients exceeding or close to 0.8 (Table S5, ESI†). The best estimates of the experimental inhibitory activity of seven menin–MLL inhibitors were obtained with the LigScore2 scoring function implemented in Discovery Studio (R = −0.84 and Npred = 66.7%; Table S5, ESI†). Most of the empirical scoring models tested herein exhibited either weak or no agreement with the experimental data. The fact that all but one of the inhibitors within the test set are fluorine-rich compounds might contribute to the poor performance of the empirical functions when applied to this particular set. Unlike most of the empirical approaches, the non-empirical E(10)EL,MTP + EDas model also appears to exhibit satisfactory predictive capabilities over the test set (R = −0.84 and Npred = 66.7%; Table S4, ESI†).
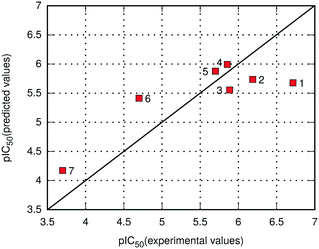
As already noted, the E(10)EL,MTP + EDas energy was employed for the prediction of binding potency of 7 new menin–MLL inhibitors according to eqn (2). The comparison of the calculated and experimental pIC50 values for new menin–MLL inhibitors is provided in Fig. 3, resulting in a very good correlation described by R = −0.84. As shown in Fig. 3, the inhibitory activity of all these compounds reported here is predicted with nearly quantitative accuracy. Compounds 1–5 are relatively similar in terms of their binding potency (Table 4). When applied to the inhibition constant, an order of magnitude change is associated with approximately 1.3 kcal mol−1 increment in the free energy of binding.75 Therefore, it would not be reasonable to expect that such small differences in the pIC50 values might be very accurately captured by any computational method, as they exceed the accuracy of most quantum chemical calculations. Accordingly, the performance of the E(10)EL,MTP + EDas scoring function in predicting the inhibitory activity of novel menin–MLL inhibitors is adequate, with the binding potency of these compounds reproduced with nearly quantitative agreement. Considering that six out of seven inhibitors discussed here are fluorine-rich compounds, these results also suggest that the E(10)EL,MTP + EDas approach is capable of capturing the changes in the binding properties resulting from fluorine substitutions. Overall, very good agreement between the experimental and theoretical data presented herein demonstrates the usefulness and applicability of the non-empirical interaction energy calculations for successful predictions of inhibitory activity of menin–MLL inhibitors and possibly other inhibitors targeting protein–protein interactions.
IV. Conclusions
Binding affinity prediction for newly designed protein inhibitors still represents a challenge, in particular for the more complex systems, such as inhibitors of protein–protein interactions. Here, we applied quantum chemical calculations of the interaction energy for the complexes of menin–MLL inhibitors to formulate and test the non-empirical model of inhibitory activity. Systematic analysis of the binding energy calculated at the consecutive levels of theory and comparison of the interaction energy with inhibitory activity of the menin–MLL inhibitors resulted in a strong correlation obtained for the E(10)EL interaction energy component, indicating that electrostatic interactions are very important in the system. Furthermore, our studies resulted in the validation of a simplified model, the E(10)EL,MTP + EDas non-empirical function comprising long-range interaction energy components, namely the electrostatic multipole and dispersion contributions. This model showed satisfactory correlation between the calculated interaction energy and experimentally measured inhibitory activity for the menin–MLL inhibitors. Importantly, the non-empirical E(10)EL,MTP + EDas model outperformed numerous empirical scoring functions tested here for comparison. As computationally inexpensive electrostatic multipole and approximate dispersion terms are employed herein, such a non-empirical function could become a computational approach as affordable as widely used empirical scoring methods for activity prediction of protein inhibitors, including inhibitors of protein–protein interactions.As revealed by the analysis of the interaction energy, binding of menin–MLL inhibitors is essentially electrostatic in nature. The non-empirical E(10)EL,MTP + EDas model has already been proven to be applicable to mostly nonpolar enzyme–inhibitor complexes.24 This contribution indicates the relevance of the E(10)EL,MTP + EDas model to polar or charged complexes. The range of applicability of this particular model for binding affinity prediction seems to encompass inhibitors of protein–protein interactions and ligands with multiple fluorine substitutions. Finally, the successful prediction of inhibitory activity of new menin–MLL inhibitors validates the usefulness of the E(10)EL,MTP + EDas model in the structure-based development of novel inhibitors, including inhibitors of protein–protein interactions, for which majority of empirical scoring functions provide rather poor predictions of ligand binding affinity. As demonstrated by nearly quantitative agreement between the predicted and experimental binding potency within the validation set of inhibitors, the E(10)EL,MTP + EDas model allows for the inexpensive and reliable assessment of the influence of structural changes made to the parent scaffold on the inhibitory activity of the resulting compounds. Further computational efforts will be directed at determination of the applicability of the E(10)EL,MTP + EDas model for testing of prospective PPI inhibitors characterized with more extensive structural differences.
Conflicts of interest
Drs. Grembecka and Cierpicki receive research support from Kura Oncology Inc. They also receive compensation as members of the Scientific Advisory Board of Kura Oncology, and they have equity ownership in the company. Other co-authors declare no potential conflict of interest.Acknowledgements
This project was supported by the National Institute of Health (NIH) grants R01 CA160467 to J. G. and R01 CA181185 to T. C., LLS Scholar (1215-14) to J. G. and American Cancer Society Research Scholar grant (RSG-13-130-01-CDD) to J. G. This project was financed in part by a statutory activity subsidy from the Polish Ministry of Science and Higher Education for the Faculty of Chemistry of Wrocław University of Science and Technology and in part by the Wrocław Research Centre EIT+ within the project “Biotechnologies and advanced medical technologies” – BioMed (POIG.01.01.02-02-003/08) co-financed by the European Regional Development Fund (Operational Programme Innovative Economy, 1.1.2). We also thank Wrocław University of Science and Technology and the University of Michigan for support. Calculations were performed at the Wrocław Supercomputer and Networking Center (WCSS). Discovery Studio calculations were carried out with Bioviva Polish Academic Country Wide licence.References
- A. Yokoyama, T. C. P. Somervaille, K. S. Smith, O. Rozenblatt-Rosen, M. Meyerson and M. L. Cleary, Cell, 2005, 123, 207–218 CrossRef CAS PubMed.
- R. Marschalek, Br. J. Haematol., 2011, 152, 141–154 CrossRef CAS PubMed.
- D. Tomizawa, K. Koh, T. Sato, N. Kinukawa, A. Morimoto, K. Isoyama, Y. Kosaka, T. Oda, M. Oda, Y. Hayashi, M. Eguchi, K. Horibe, T. Nakahata, S. Mizutani and E. Ishii, Leukemia, 2007, 21, 2258–2263 CrossRef CAS PubMed.
- R. K. Slany, Hematol. Oncol., 2005, 23, 1–9 CrossRef CAS PubMed.
- J. F. DiMartino and M. L. Cleary, Br. J. Haematol., 1999, 106, 614–626 CrossRef CAS PubMed.
- J. Grembecka, S. He, A. Shi, T. Purohit, A. G. Muntean, R. J. Sorenson, H. D. Showalter, M. J. Murai, A. M. Belcher, T. Hartley, J. L. Hess and T. Cierpicki, Nat. Chem. Biol., 2012, 8, 277–284 CrossRef CAS PubMed.
- A. Shi, M. J. Murai, S. He, G. Lund, T. Hartley, T. Purhoit, G. Reddy, M. Chruszcz, J. Grembecka and T. Cierpicki, Blood, 2012, 120, 4461–4469 CrossRef CAS PubMed.
- S. He, T. J. Senter, J. Pollock, C. Han, S. K. Upadhyay, T. Purohit, R. D. Gogliotti, C. W. Lindsley, T. Cierpicki, S. R. Stauffer and J. Grembecka, J. Med. Chem., 2014, 57, 1543–1556 CrossRef CAS PubMed.
- D. Borkin, S. He, H. Miao, K. Kempinska, J. Pollock, J. Chase, T. Purohit, B. Malik, T. Zhao, J. Wang, B. Wen, H. Zong, M. Jones, G. Danet-Desnoyers, M. L. Guzman, M. Talpaz, D. L. Bixby, D. Sun, J. L. Hess, A. G. Muntean, I. Maillard, T. Cierpicki and J. Grembecka, Cancer Cell, 2015, 27, 589–602 CrossRef CAS PubMed.
- J. Pollock, D. Borkin, G. Lund, T. Purohit, E. Dyguda-Kazimierowicz, J. Grembecka and T. Cierpicki, J. Med. Chem., 2015, 58, 7465–7474 CrossRef CAS PubMed.
- D. Borkin, J. Pollock, K. Kempinska, T. Purohit, X. Li, B. Wen, T. Zhao, H. Miao, S. Shukla, M. He, D. Sun, T. Cierpicki and J. Grembecka, J. Med. Chem., 2016, 59, 892–913 CrossRef CAS PubMed.
- H. J. Böhm, D. Banner, S. Bendels, M. Kansy, B. Kuhn, K. Muller, U. Obst-Sander and M. Stahl, ChemBioChem, 2004, 5, 637–643 CrossRef PubMed.
- K. Mueller, C. Faeh and F. Diederich, Science, 2007, 317, 1881–1886 CrossRef CAS PubMed.
- S. Purser, P. R. Moore, S. Swallow and V. Gouverneur, Chem. Soc. Rev., 2008, 37, 320–330 RSC.
- D. P. Ryan and J. M. Matthews, Curr. Opin. Struct. Biol., 2005, 15, 441–446 CrossRef CAS PubMed.
- T. Cierpicki and J. Grembecka, Immunol. Rev., 2015, 263, 279–301 CrossRef CAS PubMed.
- G. Zinzalla and D. E. Thurston, Future Med. Chem., 2009, 1, 65–93 CrossRef CAS PubMed.
- A. R. Leach, B. K. Shoichet and C. E. Peishoff, J. Med. Chem., 2006, 49, 5851–5855 CrossRef CAS PubMed.
- D. Plewczyński, M. Łaźniewski, R. Augustyniak and K. Ginalski, J. Comput. Chem., 2011, 32, 742–755 CrossRef PubMed.
- N. D. Yilmazer and M. Korth, J. Phys. Chem. B, 2013, 117, 8075–8084 CrossRef CAS PubMed.
- U. Ryde and P. Söderhjelm, Chem. Rev., 2016, 116, 5520–5566 CrossRef CAS PubMed.
- E. Dyguda, J. Grembecka, W. A. Sokalski and J. Leszczyński, J. Am. Chem. Soc., 2005, 127, 1658–1659 CrossRef CAS PubMed.
- R. Grzywa, E. Dyguda-Kazimierowicz, M. Sieńczyk, M. Feliks, W. A. Sokalski and J. Oleksyszyn, J. Mol. Model., 2007, 13, 677–683 CrossRef CAS PubMed.
- W. Giedroyć-Piasecka, E. Dyguda-Kazimierowicz, W. Beker, M. Mor, A. Lodola and W. A. Sokalski, J. Phys. Chem. B, 2014, 118, 14727–14736 Search PubMed.
- M. R. Arkin, Y. Tang and J. A. Wells, Chem. Biol., 2014, 21, 1102–1114 CrossRef CAS PubMed.
- R. J. Bienstock, Curr. Pharm. Des., 2012, 18, 1240–1254 CrossRef CAS PubMed.
- Z.-Y. Jiang, M.-C. Lu, L.-L. Xu, T.-T. Yang, M.-Y. Xi, X.-L. Xu, X.-K. Guo, X.-J. Zhang, Q.-D. You and H.-P. Sun, J. Med. Chem., 2014, 57, 2736–2745 CrossRef CAS PubMed.
- H. Li, H. Xiao, L. Lin, D. Jou, V. Kumari, J. Lin and C. Li, J. Med. Chem., 2014, 57, 632–641 CrossRef CAS PubMed.
- J. Chen, J. Wang, Q. Zhang, K. Chen and W. Zhu, Sci. Rep., 2015, 5, 17421 CrossRef CAS PubMed.
- W. Huang, L. Cai, C. Chen, X. Xie, Q. Zhao, X. Zhao, H.-Y. Zhou, B. Han and C. Peng, J. Biomol. Struct. Dyn., 2016, 34, 341–351 CAS.
- L. Laraia, G. McKenzie, D. R. Spring, A. R. Venkitaraman and D. J. Huggins, Chem. Biol., 2015, 22, 689–703 CrossRef CAS PubMed.
- M. A. Kuenemann, O. Sperandio, C. M. Labbé, D. Lagorce, M. A. Miteva and B. O. Villoutreix, Prog. Biophys. Mol. Biol., 2015, 119, 20–32 CrossRef CAS PubMed.
- W. A. Sokalski, S. Roszak and K. Pecul, Chem. Phys. Lett., 1988, 153, 153–159 CrossRef CAS.
- R. W. Góra, W. A. Sokalski, J. Leszczyński and V. Pett, J. Phys. Chem. B, 2005, 109, 2027–2033 CrossRef PubMed.
- J. Grembecka, P. Kedzierski and W. A. Sokalski, Chem. Phys. Lett., 1999, 313, 385–392 CrossRef CAS.
- P. Kedzierski, W. A. Sokalski and M. Krauss, J. Comput. Chem., 2000, 21, 432–445 CrossRef CAS.
- W. A. Sokalski, P. Kedzierski and J. Grembecka, Phys. Chem. Chem. Phys., 2001, 3, 657–663 RSC.
- B. Szefczyk, A. J. Mulholland, K. E. Ranaghan and W. A. Sokalski, J. Am. Chem. Soc., 2004, 126, 16148–16159 CrossRef CAS PubMed.
- K. M. Langner, P. Kedzierski, W. A. Sokalski and J. Leszczyński, J. Phys. Chem. B, 2006, 110, 9720–9727 CrossRef CAS PubMed.
- W. A. Sokalski and A. Sawaryn, J. Chem. Phys., 1987, 87, 526–534 CrossRef CAS.
- K. Pernal, R. Podeszwa, K. Patkowski and K. Szalewicz, Phys. Rev. Lett., 2009, 103, 263201–263204 CrossRef PubMed.
- R. Podeszwa, K. Pernal, K. Patkowski and K. Szalewicz, J. Phys. Chem. Lett., 2010, 1, 550–555 CrossRef CAS.
- J. Hoja, A. Sax and K. Szalewicz, Chem. – Eur. J., 2014, 20, 2292–2300 CrossRef CAS PubMed.
- Schrödinger Suite 2012, Maestro version 9.3, Schrödinger, LLC, New York, NY, 2012 Search PubMed.
- J. L. Banks, H. S. Beard, Y. Cao, A. E. Cho, W. Damm, R. Farid, A. K. Felts, T. A. Halgren, D. T. Mainz, J. R. Maple, R. Murphy, D. M. Philipp, M. P. Repasky, L. Y. Zhang, B. J. Berne, R. A. Friesner, E. Gallicchio and R. M. Levy, J. Comput. Chem., 2005, 26, 1752–1780 CrossRef CAS PubMed.
- Schrödinger Suite 2012, Protein Preparation Wizard: Epik 2.3, Impact 5.8, Prime 3.1, Schrödinger, LLC, New York, NY, 2012 Search PubMed.
- H. Li, A. D. Robertson and J. H. Jensen, Proteins, 2005, 61, 704–721 CrossRef CAS PubMed.
- D. C. Bas, D. M. Rogers and J. H. Jensen, Proteins, 2008, 73, 765–783 CrossRef CAS PubMed.
- M. H. M. Olsson, C. R. Søndergard, M. Rostkowski and J. H. Jensen, J. Chem. Theory Comput., 2011, 7, 525–537 CrossRef CAS PubMed.
- C. R. Søndergard, M. H. M. Olsson, M. Rostkowski and J. H. Jensen, J. Chem. Theory Comput., 2011, 7, 2284–2295 CrossRef PubMed.
- M. W. Schmidt, K. K. Baldridge, J. A. Boatz, S. T. Elbert, M. S. Gordon, J. H. Jensen, S. Koseki, N. Matsunaga, K. A. Nguyen, S. J. Su, T. L. Windus, M. Dupuis and J. A. Montgomery, J. Comput. Chem., 1993, 14, 1347–1363 CrossRef CAS.
- P. C. Hariharan and J. A. Pople, Theor. Chim. Acta, 1973, 28, 213–222 CrossRef CAS.
- M. M. Francl, W. J. Pietro, W. J. Hehre, J. S. Binkley, D. J. DeFrees, J. A. Pople and M. S. Gordon, J. Chem. Phys., 1982, 77, 3654–3665 CrossRef CAS.
- V. A. Rassolov, J. A. Pople, M. A. Ratner and T. L. Windus, J. Chem. Phys., 1998, 109, 1223–1229 CrossRef CAS.
- S. Boys and F. Bernardi, Mol. Phys., 1970, 19, 553–566 CrossRef CAS.
- Accelrys Software Inc., Discovery Studio Modeling Environment, Release 3.5, 2012 Search PubMed.
- A. Krammer, P. D. Kirchhoff, X. Jiang, C. M. Venkatachalam and M. Waldman, J. Mol. Graphics Modell., 2005, 23, 395–407 CrossRef CAS PubMed.
- D. K. Gehlhaar, G. M. Verkhivker, P. A. Rejto, C. J. Sherman, D. B. Fogel, L. J. Fogel and S. T. Freer, Chem. Biol., 1995, 2, 317–324 CrossRef CAS PubMed.
- D. K. Gehlhaar, D. Bouzida and P. A. Rejto, in Reduced Dimensionality in Ligand-Protein Structure Prediction: Covalent Inhibitors of Serine Proteases and Design of Site-Directed Combinatorial Libraries, American Chemical Society, 1999, ch. 19, vol. 719, pp. 292–311 Search PubMed.
- A. N. Jain, J. Comput.-Aided Mol. Des., 1996, 10, 427–440 CrossRef CAS PubMed.
- I. Muegge and Y. C. Martin, J. Med. Chem., 1999, 42, 791–804 CrossRef CAS PubMed.
- I. Muegge, J. Med. Chem., 2006, 49, 5895–5902 CrossRef CAS PubMed.
- H. J. Böhm, J. Comput.-Aided Mol. Des., 1994, 8, 243–256 CrossRef.
- H. J. Böhm, J. Comput.-Aided Mol. Des., 1998, 12, 309–323 CrossRef.
- J. Tirado-Rives and W. L. Jorgensen, J. Med. Chem., 2006, 49, 5880–5884 CrossRef CAS PubMed.
- O. Trott and A. J. Olson, J. Comput. Chem., 2010, 31, 455–461 CAS.
- G. Jones, P. Willett, R. C. Glen, A. R. Leach and R. Taylor, J. Mol. Biol., 1997, 267, 727–748 CrossRef CAS PubMed.
- PyMOL(TM) Molecular Graphics System, Version 1.5.0.1., Schrödinger, LLC Search PubMed.
- D. Seeliger and B. L. de Groot, J. Comput.-Aided Mol. Des., 2010, 24, 417–422 CrossRef CAS PubMed.
- K. M. Langner, W. Beker and W. A. Sokalski, J. Phys. Chem. Lett., 2012, 3, 2785–2789 CrossRef CAS.
- J. Grembecka, A. M. Belcher, T. Hartley and T. Cierpicki, J. Biol. Chem., 2010, 285, 40690–40698 CrossRef CAS PubMed.
- W. Beker, K. M. Langner, E. Dyguda-Kazimierowicz, M. Feliks and W. A. Sokalski, J. Comput. Chem., 2013, 34, 1797–1799 CrossRef CAS PubMed.
- R. S. Paton and J. M. Goodman, J. Chem. Inf. Model., 2009, 49, 944–955 CrossRef CAS PubMed.
- R. Wieczorek, L. Haskamp and J. J. Dannenberg, J. Phys. Chem. A, 2004, 198, 6713–6723 CrossRef.
- J. M. Berg, J. L. Tymoczko and L. Stryer, Biochemistry, W.H. Freeman, Basingstoke, 7th edn, 2012 Search PubMed.
Footnote |
| † Electronic Supplementary Information (ESI) available: Detailed characterization of the compound collection; structural characteristics of the menin–MI-2-2 complex; and additional computational results. See DOI: 10.1039/c7md00170c |
| This journal is © The Royal Society of Chemistry 2017 |

