
 Open Access Article
 This Open Access Article is licensed under a
 Creative Commons Attribution 3.0 Unported Licence
Open channel deterministic lateral displacement for particle and cell sorting†
Trung S. H.
Tran
 ,
Bao D.
Ho
,
Jason P.
Beech
and
Jonas O.
Tegenfeldt
*
,
Bao D.
Ho
,
Jason P.
Beech
and
Jonas O.
Tegenfeldt
*
NanoLund and Division of Solid State Physics, Physics Department, Lund University, PO Box 118, 221 00, Lund, Sweden. E-mail: jonas.tegenfeldt@ftf.lth.se; Tel: +46 46 222 8063
First published on 19th September 2017
Abstract
We present the use of capillary driven flow over patterned surfaces to achieve cheap and simple, but powerful separation of biologically relevant particle systems. The wide use of microfluidics is often hampered by the propensity for devices to clog due to the small channel sizes and the inability to access the interior of devices for cleaning. Often the devices can only be used for a limited duration and most frequently only once. In addition the cost and power requirements of flow control equipment limits the wider spread of the devices. We address these issues by presenting a simple particle- and cell-sorting scheme based on controlled fluid flow on a patterned surface. The open architecture makes it highly robust and easy to use. If clogging occurs it is straightforward to rinse the device and reuse it. Instead of external mechanical pumps, paper is used as a capillary pump. The different fractions are deposited in the paper and can subsequently be handled independently by simply cutting the paper for downstream processing and analyses. The sorting, based on deterministic lateral displacement, performs equivalently well in comparison with standard covered devices. We demonstrate successful separation of cancer cells and parasites from blood with good viability and with relevance for diagnostics and sample preparation. Sorting a mixture of soil and blood, we show the potential for forensic applications.
Introduction
Cell separation is a critical process in cell biology, disease diagnostics and prognosis. While standard techniques such as FACS and MACS are widely used, there is a need to miniaturize systems in order to minimize sample and reagent use, simplify systems for the user, and integrate components into comprehensive analysis tools. Depending on the exact applications, different types of microfluidic sorting schemes may be utilized. Inertial1 and acoustophoretic methods2 give high volumetric throughput but with a relatively low size resolution and must be operated at low particle concentrations. Deterministic lateral displacement (DLD) is a method of particle separation, based on the continuous flow of particles through an array of obstacles that exhibits exceptional resolution in size-based separations.3 DLD has been used for cell and bioparticle separations such as blood fractionation,4–8 trypanosome enrichment from blood,9,10 cancer cell isolation11–13 and CTC cell cluster isolation from whole blood,14 DNA and exosome separation,15 and the separation of cells based on parameters other than size, namely shape and deformability,16,17 and dielectric properties.18 Early theoretical work by Inglis et al.19 and Davis et al.20 describing the critical size in DLD arrays has been improved upon by studying the effects of post shape.21,22 Further improvements to theoretical descriptions have been made by considering other parameters such as diffusion,23 dynamical properties,17 and alternative trajectories through DLD arrays.23–25 Being a passive method its basic operation does not require any application of external fields, like those used in acoustophoresis, and because it functions at high particle concentrations and low flow rates, relevant throughput can be achieved without the pressures required to generate the high particle velocities needed for inertial-effect based approaches. Even at high volume flow rates (10 mL min−1) DLD has been shown to separate a variety of cells with minimal effect on viability.12 Taken together, these qualities make DLD our method of choice for the development of a simple, cheap but effective approach to particle separation.Here we show that by removing the lid of the DLD devices and using capillary flow we are able to perform separations, equally powerful as those in closed devices, but with many added advantages. While the benefits of open fluidics in general26,27 and of capillary driven DLD has been demonstrated previously,28,29 we here show proof of principle of their usefulness for sorting of biologically relevant particles not only based on size but also based on morphology and dielectric properties with relevance for e.g. medical diagnostics and forensics. What is more, this can be done in devices that are cheaper and easier to fabricate, since oxygen plasma and bonding is not required, and also cheaper and easier to run since pressure controllers are not required. A common limitation of standard fluidics devices, based on sealed small channels, is a propensity to clog, especially when handling complex samples. The difficulties to clean these closed devices make them unsuitable for prolonged and repeated use. We show that our open devices are easy to clean and reuse, which together with the use of the paper capillary pumps further contributes to the lowering of the costs. While standard pumps and pressure control units are ultimately more versatile, they are bulky, power consuming and expensive. We show that paper capillary pumps are compatible with open DLD devices allowing us to handle larger volumes than can fit into a device alone, and that they have the added advantage of doubling as sample collection substrates, further simplifying downstream process steps and analyses.
Results and discussion
Device fabrication and assembly
Both open and closed devices are fabricated in PDMS using replica molding on SU8 masters (see Materials and methods section). The final step in fabricating closed devices is to bond a glass slide to the PDMS cast and to then attach fluidics connectors. Open devices are much simpler in that they require neither of these two last steps. In order for the open device to function, PDMS must be rendered hydrophilic using e.g. oxygen plasma or, alternatively, prewetted by submersion in water. Fig. S3† in the supplementary material shows an overview of hydrophobic, hydrophilic and pre-wetted devices. Pre-wetting is much simpler to perform and negates the requirement of an oxygen plasma system, helping to keep the method cheap and simple. When a device is submerged in water the device features (channels and arrays) will fill with water after 5 minutes. When the PDMS slab is removed from submersion, water runs off of all flat areas and the only liquid remaining is that which is trapped within the patterned areas constituting the device. Sample can now be applied to the inlets and paper to the outlets and the sample will flow through the patterned areas of the device, confined to within the defined height of the features.DLD devices in open configuration
Fig. 1A and B show a typical configuration of a closed DLD device. PDMS is bonded to glass to form closed channels and a pump or pressure control unit is used to drive flow through the device. As shown in Fig. 1C and D, our approach is to remove the glass lid and replace the pressure-driven flow with capillary flow. Provided the channels are hydrophilic, any aqueous solution placed at the inlet of the device will flow into the channels until they are filled. For our typical DLD devices (e.g. device 1, 20 mm length, 4 mm width and 24 μm depth, see ESI,† Fig. S1) the array volume is approximately 1.1 μL. | ||
| Fig. 1 Comparison of closed and open devices. (A and B) Conventional closed device where fluid is confined inside channels in a complicated setup of tubes and a pump or a pressure control unit. (C and D) Open DLD without lid. In these devices the interplay between surface tension and geometry keeps the fluid confined to the separation array and a paper reservoir at the outlet maintains flow, via capillary action, and collects the sample. We see, by observing the red and blue food coloring, that the flow is laminar in both devices. | ||
To run the device, reservoirs are mounted at the device inlets and tested for volumes up to 60 μL using the paper capillary pump. At the beginning of the device there is a transition in liquid height from the reservoir to the bulk of the separation array. In this transition zone the sample flows across the top of the array, but the liquid height falls to that of the posts within 1–5 mm. Fig. 1D shows how we are able to maintain a stable, laminar flow (of red and blue food dye in this case) in the device using the paper capillary pump. The figure also shows how the fluids are collected in the paper. The resulting flow rates are measured to be 71 ± 19 nL s−1, which is comparable to what we achieve with an applied pressure of 21 mBar in a corresponding closed device. This also compares well with a closed device driven by a paper capillary pump.
The liquid in the reservoirs gives a hydrostatic pressure that is less than 1 mBar and is therefore negligible in comparison with the equivalent driving pressure in a closed device. The result is that the liquid is pulled through the device by the negative pressure imposed by the capillary pump, minimizing any liquid build-up on top of the posts.
To estimate the liquid profile along the device we resorted to three approaches. Direct imaging (Fig. 2A and B) indicates that the liquid is indeed thicker at the beginning of the device close to the reservoirs and that it levels out rather quickly away from the reservoirs. Confocal imaging supports the conclusion giving a direct view of the profile (Fig. 2C–F). Finally we studied the flow in the channels. We measure the velocities of the flow (Fig. S4B†) and combine that with the cross sectional area of the device based on the design parameters to obtain a value of the volumetric flow. The resulting flow rate is consistent with what we obtain in direct measurements of the volumetric flow rate (Fig. S5†) and measurements of the average flow by measuring the elapsed time between loading of a defined volume and the emptying of the reservoirs (Fig. S4D†) suggesting that the liquid is indeed filling the device to the top of the pillars. Note that there is a trend of lower flow velocities close to the reservoirs, in line with the local buildup of liquid on top of the post array that we observe by direct inspection.
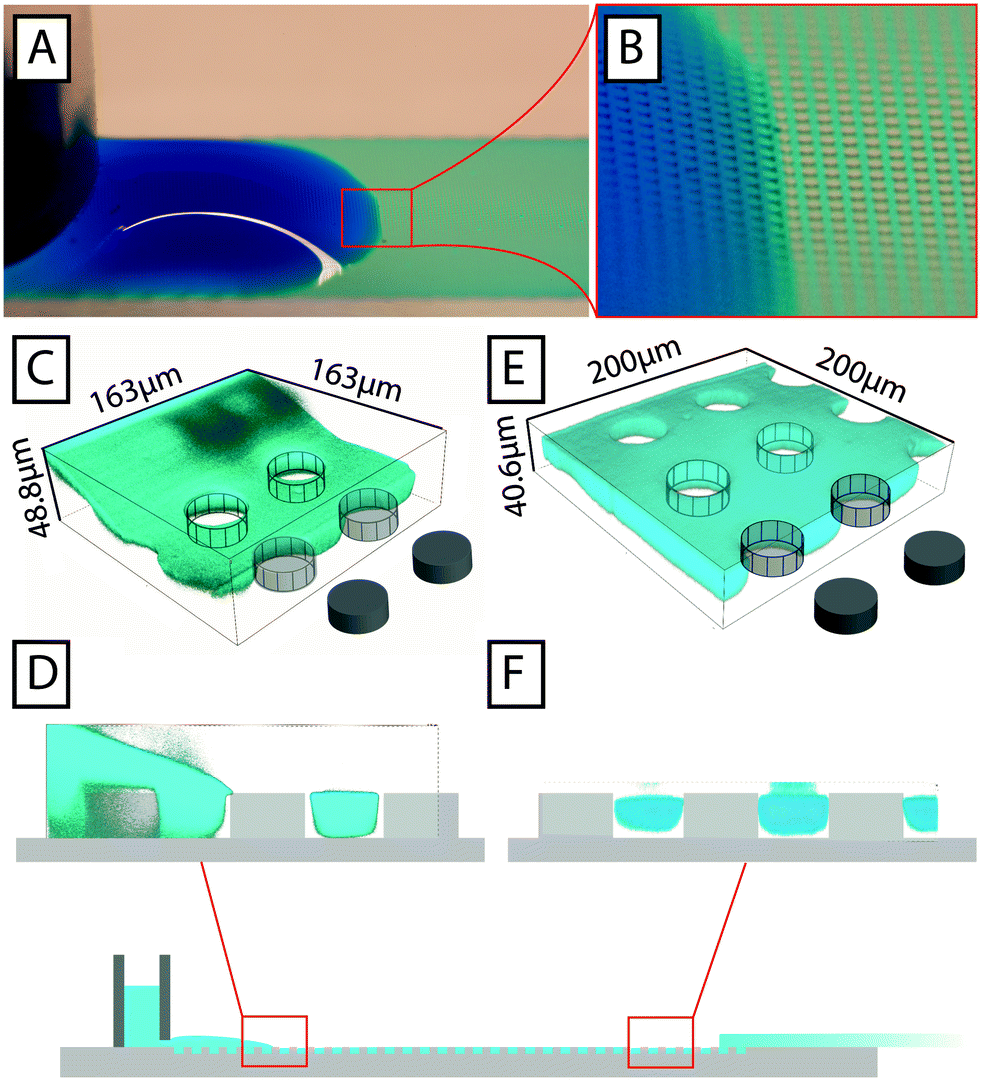 | ||
| Fig. 2 Images of aqueous fluids in an open DLD device. A) Photograph of an aqueous solution of food color in an open device. B) Close-up of the transition between the area where the fluid forms a droplet and where it is confined to the post array. C) and D) 3d rendering and cross section, respectively, of confocal images of an aqueous solution of FITC in the same device, taken near to the reservoir. The drop formed by the reservoir can be seen to fall below the height of the posts. E) and F) 3d rendering and cross section, respectively, at the end of the device closest to the paper. The device is filled with liquid but no liquid can be seen above the posts. | ||
The throughput of the paper capillary pump driven device is ultimately limited by the absorption rate of the paper. In a very simplified but illustrative picture the paper capillary pump can be viewed as a battery with an internal resistance and a hydromotive force in analogy to standard electrical batteries. If the external load is much less than the internal flow resistance, the flow rate is limited by the internal resistance. By measuring the flow rates in a free paper as well as a paper connected to a device (Fig. S5†), we could estimate the internal resistance, 16 × 1012 kg s−1 m−4, which is within an order of magnitude of the resistance of our closed devices, 30 × 1012 kg s−1 m−4 (from Fig. S4†), and open devices 23 × 1012 kg s−1 m−4 (from Fig. S5†). From these data we could also estimate the hydromotive force to 32 mBar. Higher throughputs can now be realized by decreasing the device flow resistance through an increase in the depth of the devices or by using paper pumps with higher absorption rates. While the flow in narrow strips of paper follows the Washburn law30 such that the flow rate is inversely proportional to the square root of time, we use wider strips of paper where the liquid fans out leading to a constant flow rate as shown by Mendez et al.31 To obtain specific volumes and flow rates as a function of time, the paper capillary pumps can be programmed by selecting appropriate geometries of the paper.32–34 Further details on the flow generated in our open devices by the paper capillary pump can be found in the ESI.†
In addition to the simplifications compared to standard DLD devices we can demonstrate good separation performance. Fig. 3B shows the separation of 3 μm and 7 μm polystyrene microspheres. The sample (a mixture of the two beads) was placed in one inlet and buffer placed in the other. As the sample stream flows through the device, in parallel with the buffer stream, the mechanism of DLD causes the 7 μm particles, which are larger than the critical size, Dc, to be displaced into the buffer stream while the 3 μm particles, which are smaller than Dc remain in the sample stream. This lateral displacement is caused by steric interactions between particles and posts, which cause particles to move with a component perpendicular to the flow direction. The net result is the continuous, spatial separation of particles, Fig. 3B, in this case based on size. We also show here how the particles are collected in the paper, in regions divided by wax lines, which we will return to below. Despite the lack of a lid in our open DLD devices, flow is well defined and confined to the pillar array, and high-resolution separations can be performed fully comparable to those demonstrated for closed DLD devices. Fig. 3C shows experimental comparison of 3 devices and 10 particle sizes run in open configurations. Filled circles show particles following the flow (as expected if they are below the critical size) and open circles show those that are displaced (above the critical size). These points fall on either side of the expected critical size (indicated by red double arrows) as calculated using the empiric expressions given by Inglis et al.35 and Davis et al.20 for closed devices demonstrating good correspondence between particle behavior in open and closed configurations.
 | ||
| Fig. 3 An overview of open DLD, device layout and typical results. (A) Particles are introduced via one inlet and buffer via the other. The mechanism of deterministic lateral displacement pushes particles (yellow) larger than a critical size, Dc, from the sample stream to the co-flowing buffer stream as they move along the device. Smaller particles (red) remain in the sample stream. (B) Paper is used both as a capillary pump and as a method of sample collection. Here colored beads are visualized after separation and collected in zones in the paper pump defined with wax (yellow/green 7 μm and red 3 μm, black lines are wax). Time averaged images of fluorescent beads (green 7 μm and red 3 μm) in the beginning and end of the device show the trajectories of the beads in the device, which lead to separation. Note the collection of particles in separate, wax-delimited zones in the paper. (C) The behavior of open DLD devices is consistent with that of standard closed DLD devices. The red double arrows indicate theoretical critical sizes for a conventional closed device based on Davis' estimate.20 The results for the open DLD are shown with filled black circles for particles in zigzag mode (following the flow), and open circles for particles in displacement mode (displaced into the buffer stream). The grey bars indicate the upper limit of the particle sizes as imposed by the gap sizes between posts. | ||
Application areas – proof of principle
To show the applicability of open DLD devices to relevant bio-separations, we tested separation of a range of relevant bioparticles in different modalities, as described below.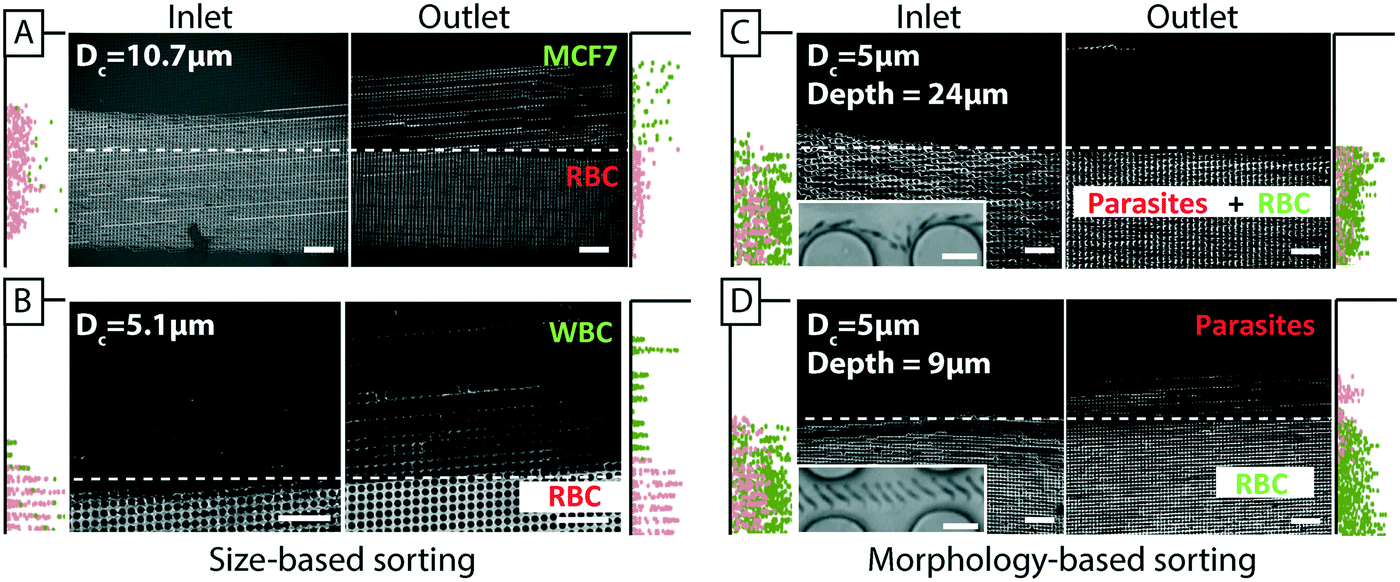 | ||
| Fig. 4 Cell and parasite sorting in open DLD devices. All images show plots of inlet distributions (to the left) and outlet distributions (to the right) together with time-averaged micrographs of different cells moving through open DLD devices. The micrographs show the trajectories of the different cells in each case and the outlet distributions show the resulting separations. (A) Size-based separation of RBCs (red dots) and MCF7 cells (green dots) (B) sizebased sorting of RBCs (red dots) and WBCs (green dots) (C) in a 24 μm deep device RBCs (green dots) and parasites (T. cyclops) (red dots) have the same trajectories, but in a shallower device (9 μm deep) (D) they are separated. Scale bars 100 μm and 10 μm for the insets. | ||
 | ||
| Fig. 5 Sorting of complex samples in open DLD devices. Even if large particles become trapped at the beginning of a device they do not block the flow of liquid and smaller particles as they would in a closed device. This allows extremely “dirty” samples to be analysed. A mixture of soil and RBCs is introduced into an open device. Despite the large amount of soil particles trapped at the beginning of the device (A), a clean fraction of RBCs is collected at the end of the device (B). (C) & (D) A combination of filtering and continuous separation of suspensions of cells containing large clusters that would otherwise block the inlets of a closed device. | ||
A common challenge in microfluidics is the aggregation of cells that often lead to clogging even with careful surface passivation. Using the open DLD we clearly demonstrate the retention of cell aggregates of MCF7 cells while the individual cells are collected at the end of the device (Fig. 5C and D). While cell aggregates may be of interest in their own right,37 in many cases, such as in cell culturing, drug screening and fluorescence activated cell sorting, it is often necessary to remove cell aggregates. Those experiments are conducted in device 3 with Dc = 14 μm (see ESI,† Fig. S1).
Application of electric fields
Electrokinetic effects can be utilized in DLD devices to widen the scope and add specificities associated with the distribution of charge on the particles of interest as shown previously by Beech et al.18 in closed DLD devices. We added electrodes to the inlet and outlet reservoirs of a DLD device generating an electric field in the device. The electric field lines were “squeezed” between the insulating PDMS posts and field gradients were generated near the post surfaces. Polarizable particles interacted with the field gradient and the resulting dielectrophoretic (DEP) forces were used to modify the DLD-based behavior and tune size-based separations. Because there is no lid on an open device it is easy to access the fluid at any point in the device, during a separation. In the example shown in Fig. 6 electrodes are dipped into the fluid (KCl with a conductivity of 24 mS m−1) and an AC electric field is applied. In a closed device the electrodes are usually mounted in the inlet and outlet reservoirs, which are 30 mm apart in this device. Here we could easily place them 3 mm apart allowing for the generation of much higher fields at a given voltage. In Fig. 6B we see the effects of adding an electric field. In the absence of an applied voltage, 3.1 μm sulphate-terminated polystyrene and 4.8 μm carboxy-terminated polystyrene microspheres are following the flow (zigzagging), which is to be expected in a device with a critical diameter of 5.1 μm (device 1, see ESI,† Fig. S1), showing that the electrodes do not greatly perturb the flow. At 400 V applied AC voltage (100 Hz) the 4.8 μm microspheres are displaced and separation is achieved. At 700 V, all microspheres are displaced.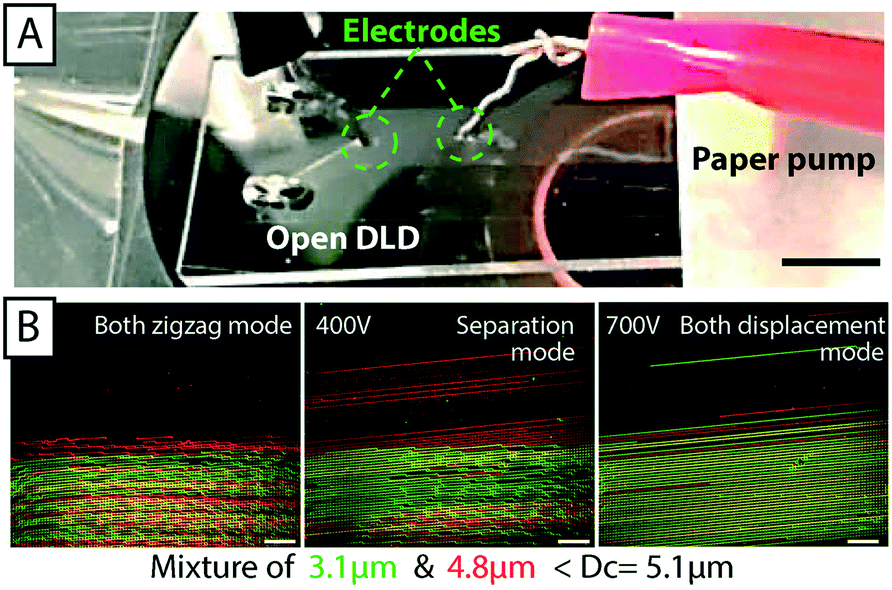 | ||
| Fig. 6 Combination of electrokinetics and open DLD. (A) With direct access to the fluid it is straight-forward to position external electrodes at any point in the device. Scale bar 3 mm. An AC field at 100 Hz and various applied voltages (B) 0 V/400 V/700 V, change the trajectories of particles consistent with what was previously shown by Beech et al.18 in closed DLD devices. Scale bars 100 μm. | ||
Applying electrodes in this manner, rather than in the inlets and outlets, decouples the electrode geometry from the flow geometry in a very simple way, giving us freedom to apply any number of electrodes in any pattern and at any angle to the flow direction.
Sample collection and recovery
The paper at the end of the device functions not only as a capillary pump but also as a sample recovery matrix from which fractions can be cut in a manner similar to that shown by Osborn et al.38 Filter paper with a thickness of 150 μm and a pore size of 25–60 μm has excellent absorption. Liquid reservoirs of the required volume can be defined using a wax printer. The wax lines serve to maintain the separation of collected fractions (Fig. 1, 3 and 7). Fluorescent samples with good signal can be imaged directly in the paper with low magnification (Fig. 3 and 7). For samples with lower, or no fluorescent signal, higher magnification together with transmitted light can be used to image cells. In Fig. 7 separated MCF7 cells and RBCs are imaged inside the paper reservoirs. | ||
| Fig. 7 Paper functions both as a capillary pump and as a collection reservoir for separated cells. (A and C) A sample containing RBCs (red fluorescence) and MCF7 cells (blue fluorescence) is introduced into an open DLD. RBCs (smaller than Dc) and MCF7 cells (larger than Dc) follow different trajectories through the device (from left to right) and can be collected to the right in two areas on the paper, separated by a printed wax line. The RBCs are more numerous than the MCF7 cells and can easily be seen in the paper through their red color (no fluorescence). Note the green dotted line that delineates the boarders of the device. (B) Trapped MCF7 cells and RBCs imaged in the paper. The high concentration makes it difficult to pick out individual cells in the image, but as (D) shows, very few RBCs were observed in the top zone where the MCF7 fraction dominates. (E) No MCF7 cells are seen in the RBC fraction. | ||
To recover cells from the paper, we have developed a simple protocol that does not negatively affect viability or proliferation (Fig. 8). The desired fractions are cut out of the paper and placed inside a liquid medium of choice (e.g. in a 1.5 mL Eppendorf tube). Gentle vortexing releases most of the collected sample from the paper and subsequent centrifugation may then be performed to concentrate and/or collect the freed cells or particles. Fig. 8D shows a micrograph of MCF7 cells after separation in an open device, release from paper, and collection via centrifugation. Fig. 8E shows the recovery of 75% of cells from filter paper using this method.
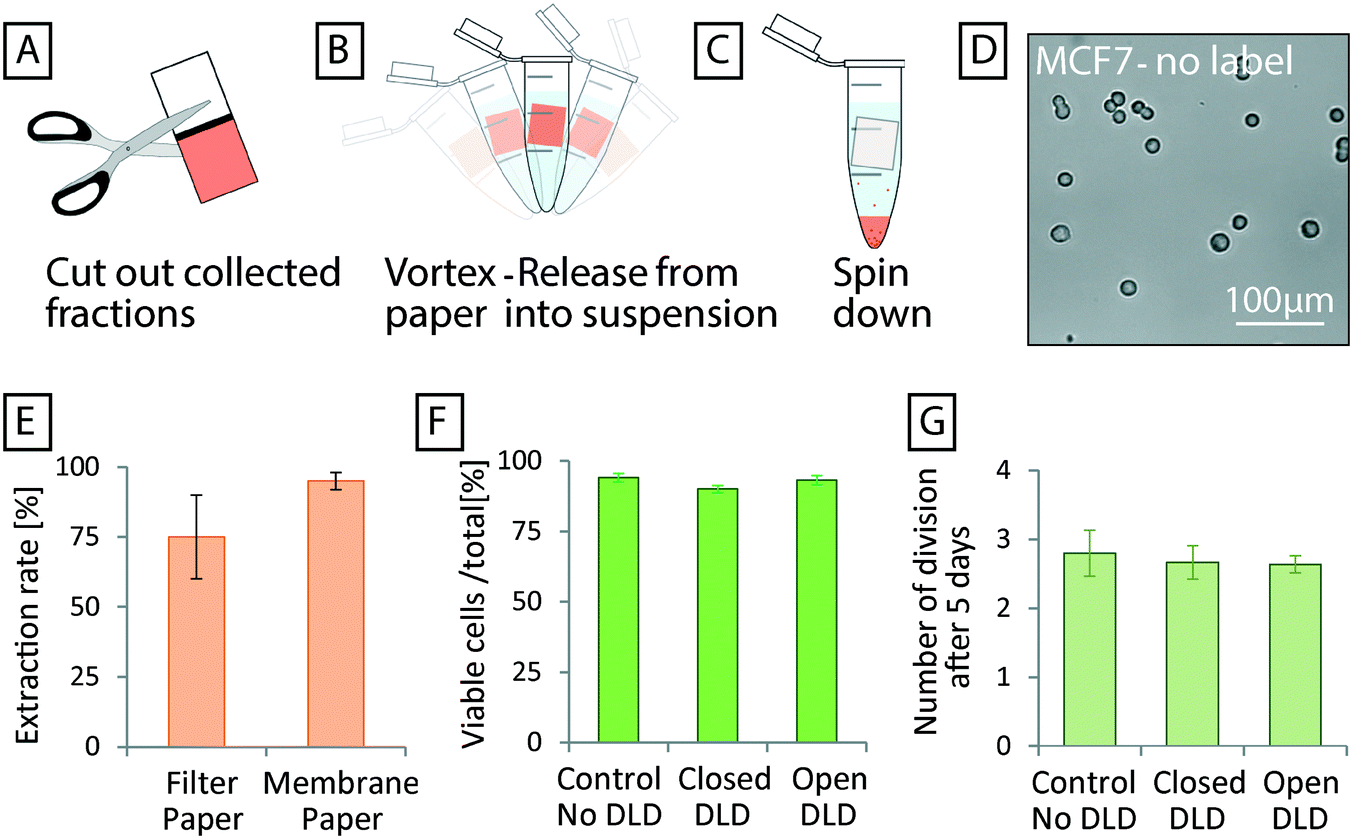 | ||
| Fig. 8 Post-separation sample recovery. (A) Separated fractions are accumulated in the paper and kept separated by hydrophobic wax lines. The desired fractions are collected separately by dividing the paper along the wax line. (B) To re-suspend the collected fractions vortexing is used, which shakes the cells free of the paper matrix, followed by (C) centrifugation. (D) MCF7 cells after separation and collected using the process described in (A)–(C). (E) Recovery statistics for the filter paper and the two-layer system. Error bars show max/min values from 5 experiments. (F) Cell viability and (G) proliferation assay for MCF7 after separation in closed and open DLD. Error bars show the standard deviation in (F) and (G). No significant difference could be seen in the proliferation rates of sorted and non-sorted cells. | ||
While having good absorptive qualities, which is good for maintaining flow, fibrous filter paper with large pore size, is not ideal for sample collection due to trapping of particles and cells within the structure of the paper. Instead a two-layer paper system was used to increase the collection rate. By sandwiching a layer of filter membrane (1 μm pore size, polycarbonate membrane) between the filter paper and the device, the good absorptive qualities of the filter paper could be used while the polycarbonate membrane stopped the particles/cells from entering the paper and becoming trapped. Particles and cells captured on the surface of the polycarbonate membrane were easily resuspended with higher yields observed. Fig. 8E shows how 95% of cells could be recovered using the extra membrane layer.
To measure the effect of sorting in both open and closed devices on the health of cells, we performed viability and proliferation assays of MCF7 cells. Cell counting using viability dyes (trypan blue) was conducted to measure the percentage of viable cells and the rate of proliferation. Fig. 8F demonstrates viabilities of >90% for sorted cells. A small difference in the viability of cells (control, open, and closed devices) could be seen in our measurements but the difference has no practical significance and shows nothing more than the common variation between cultures using these cells. Furthermore, Fig. 8G shows that after 5 days of culturing, no difference in the proliferation rates of cells, (∼2.5 divisions in 5 days), can be seen as a consequence of sorting.
The performance of the devices is qualitatively comparable to the conventional closed devices with clear separation of the different fractions. Purity and capture rate are performance parameters that do not depend on the DLD as much as on the overall design and will have to be optimized carefully for each specific application. For example the paper capillary pump in Fig. 3B can be extended to three lanes instead of two. In that way the purity of the sample collected in the two extreme lanes can be enhanced by discarding the central lane. The data in Fig. 4 shows clearly that by appropriate choice of cut-offs we would be able to achieve close to 100% purity of the separated fractions. With longer devices, this is expected to be done with minimum loss of capture efficiency.
Cleaning and reusing devices
The fouling of devices with particles and cells is the most common reason for device failure and limits device lifetime. Fouling can be due to several mechanisms. Particles can adhere to surfaces and they can become trapped because they are too large to move through constrictions. These mechanisms are also linked. For example, particles can stick to one another, forming agglomerations that are much more likely to get stuck. Fig. 9A shows an image of 4.5 and 10 μm particles that have become stuck in a closed device with a Dc = 5.1 μm and gap size of 11 μm after operating for 30 min (device 1, see ESI,† Fig. S1). At this point the device has ceased to work and particles are no longer able to enter the array. This kind of clogging is detrimental for all kinds of microfluidics devices, in particular for DLD devices since a well-defined flow direction is crucial for the successful operation. Even a small deviation of flow direction may change the critical size significantly. | ||
| Fig. 9 Cleaning and reusing open DLD devices. (A) Depending on the array parameters, particle sizes and surface chemistries, devices eventually clog. (B) A closed device after attempted cleaning using sonication, high pressures and reversing the flow direction. (C) An open device after sonication and rinsing is almost completely free of particles (30 times fewer). Those remaining are highlighted with arrows. Channel walls are shown in red dashed lines. | ||
Closed devices are most often irreversibly sealed (to avoid leaking) and are difficult to clean and reuse. Fig. 9B shows the same device after sonication, reversal of the flow direction and an increase in pressure in an effort to remove clogging. Despite these efforts many particles remain stuck in the device and the device is unusable. Open devices are considerably easier to clean and can be cleaned to a much higher degree. Fig. 9C shows the same kind of device as above after first being run in an open configuration and then cleaned by sonication and rinsing. This device is free of particles after rinsing and can be reused.
Conclusion
We have shown that by combining patterned surfaces in PDMS with paper based capillary pumps we can fabricate potentially cheap, simple to use, and reusable continuous flow separation devices. We have demonstrated proof-of-principle separations of samples based on size and morphology and what is more, in samples containing very large contaminant particles. Being open, access to flowing fluid is possible in these devices allowing for easy electric contact through electrodes. Flow rates can be held constant by choice of size and properties of the paper used in the capillary pump. Paper is not only useful as a pump but also as a matrix for the collection of separated fractions. The separational functionality of DLD is retained in open devices paving the way for simple, robust and clogging insensitive sorting using pillar arrays with potential applications in medicine and forensic science. Our device opens up for sample preparation applications in paper fluidics based diagnostics.39,40The limitations and challenges introduced by working with open devices on the other hand include the risk for evaporation, contamination and biohazard.41 These issues can be mitigated through a cover that is positioned in close proximity, yet not in contact with the actual device.
Materials and methods
PDMS device fabrication
In a contact mask aligner (Karl Suss MJB3 and MJB4, Munich, Germany), negative photoresist SU8 (MicroChem, Newton, MA, USA) spun on a 3′′ silicon wafer was exposed with UV light through a chrome-mask designed in L-Edit 11.02 (Tanner Research, Monrovia, CA USA) and printed by Delta Mask (Delta Mask, Enschede, The Netherlands). Before casting of PDMS, a monolayer of 1H,1H,2H,2H-perfluorooctyltrichlorosilane (ABCR GmbH & Co. KG, Karlsruhe, Germany) was applied in the gas phase to the master as an anti-adhesion agent to facilitate demoulding. A 10![[thin space (1/6-em)]](https://www.rsc.org/images/entities/char_2009.gif) :1 mixture (monomer:curing agent) of PDMS (Sylgard 184, Dow Corning, Midland, MI, USA) was degassed, poured onto the master then baked for 2 hours at 80 °C. For the closed devices vias are punched and an oxygen plasma treatment step (Plasma Preen II-862, Plasmatic Systems, Inc., North Brunswick, NJ, USA) is performed to enable bonding to glass slides and the attaching of silicone tubes for fluidic connections, none of which are necessary for the open devices. In Fig. S2† (supplementary of device fabrication), a comparison among a protocol of closed DLD fabrication and optional protocol for open DLD fabrication (with and without oxygen plasma plus reservoir) is presented.
:1 mixture (monomer:curing agent) of PDMS (Sylgard 184, Dow Corning, Midland, MI, USA) was degassed, poured onto the master then baked for 2 hours at 80 °C. For the closed devices vias are punched and an oxygen plasma treatment step (Plasma Preen II-862, Plasmatic Systems, Inc., North Brunswick, NJ, USA) is performed to enable bonding to glass slides and the attaching of silicone tubes for fluidic connections, none of which are necessary for the open devices. In Fig. S2† (supplementary of device fabrication), a comparison among a protocol of closed DLD fabrication and optional protocol for open DLD fabrication (with and without oxygen plasma plus reservoir) is presented.
Paper capillary pump
A two-layer paper system was used as a capillary pump and for sample capture and collection for the experiments described in Fig. 8. For liquid absorption (Herzberg flow rate42 110 s/100 mL), filter paper of 0.15 mm thickness, a 25–60 μm pore size and 8 μm particle retention (Grade 600, VWR, Sweden) was used. For sample capture a layer of polycarbonate paper (Grade 28158, VWR, Sweden), (1 μm pore size) was sandwiched between the separation device and the lower grade filter paper. For the other experiments only the filter paper was used. Wax barriers were printed onto the filter paper using a wax printer (ColorQube 8570, Xerox, USA) followed by baking for 3 minutes at 100 ° C.For the experiments characterizing the evaporation, a grid was printed onto the paper to facilitate measurement of the wetted area. The grid was printed using a standard laser writer (Canon iR-ADV C5250i).
Sample preparation (beads, RBCs, WBCs, parasites and MCF7 cells)
Fluorescently labeled polystyrene microspheres with varying diameters (from 1 μm to 20 μm) (Polyscience Inc., Warrington, PA, USA) were suspended in MilliQ water and 1% SDS and used in both closed and open DLD devices for calibration.Small volumes of blood (10 μL) were obtained from healthy, consenting donors via finger pricking. Blood samples were diluted 20 times in autoMACS™ running buffer (Miltenyi Biotec, Auburn, CA, USA).
Trypanosoma cyclops parasites were thawed (after storage in 10% dimethyl sulfoxide (DMSO, Fluka, St. Louis, MO, USA: 41639) at −80 °C) and cultured in Cunningham's medium with 20% fetal calf serum (FCS, Sigma-Aldrich) at 28 °C. Parasites were harvested after proliferating to cover 80% of the culture dish and spiked into blood samples.
MCF-7 (breast carcinoma cell lines obtained from the American Type Culture Collection (ATCC)) was cultured at 37 °C and 5% CO2. Cell culture medium was Dulbecco's modified Eagle's medium (DMEM), 10% FBS and 1% penicillin streptomycin (Sigma-Aldrich). After one week of subculture, the cells proliferated to fill more than 80% of the culture flasks and were considered ready for separation experiments.
Image acquisition and analysis
Particle and cell distributions were calculated from images acquired using an inverted epifluorescence microscope (Nikon Eclipse Ti, Nikon Corporation, Tokyo, Japan) and scientific CMOS camera (Flash4.0 V2, Hamamatsu, Japan). ImageJ 1.48v software downloaded from the National Institutes of Health, and NIS-elements 4.51 were used for image analysis and the preparation of figures. Images of particle trajectories are generated by time-averaging. Two color-images generated by adding color to separate images, taken in succession with different filter sets, and superimposing.Conflicts of interest
There are no conflicts to declare.Acknowledgements
We thank Stefan Holm and Bo Baldetorp for their kind donation of trypanosomes and MCF-7 cells respectively. This work was carried out within NanoLund at Lund University with funding from the Child Cancer Foundation (MT2013-0031), LAPASO (EU FP7 project 607350) and the Swedish Research Council (VR) grant no. 2015-05426. All device processing was conducted within Lund Nano Lab. We thank Christelle Prinz for valuable comments after carefully reading the manuscript.References
- D. Di Carlo, D. Irimia, R. G. Tompkins and M. Toner, Proc. Natl. Acad. Sci. U. S. A., 2007, 104, 18892–18897 CrossRef CAS PubMed.
- T. Laurell, F. Petersson and A. Nilsson, Chem. Soc. Rev., 2007, 36, 492–506 RSC.
- L. R. Huang, E. C. Cox, R. H. Austin and J. C. Sturm, Science, 2004, 304, 987–990 CrossRef CAS PubMed.
- J. A. Davis, D. W. Inglis, K. J. Morton, D. A. Lawrence, L. R. Huang, S. Y. Chou, J. C. Sturm and R. H. Austin, Proc. Natl. Acad. Sci. U. S. A., 2006, 103, 14779–14784 CrossRef CAS PubMed.
- D. W. Inglis, M. Lord and R. E. Nordon, J. Micromech. Microeng., 2011, 21, 054024 CrossRef.
- C. I. Civin, T. Ward, A. M. Skelley, K. Gandhi, Z. P. Lee, C. R. Dosier, J. L. D'Silva, Y. Chen, M. Kim, J. Moynihan, X. C. Chen, L. Aurich, S. Gulnik, G. C. Brittain, D. J. Recktenwald, R. H. Austin and J. C. Sturm, Cytometry, Part A, 2016, 89A, 1073–1083 CrossRef PubMed.
- K. K. Zeming, T. Salafi, C. H. Chen and Y. Zhang, Sci. Rep., 2016, 6, 22934 CrossRef CAS PubMed.
- M. Yamada, W. Seko, T. Yanai, K. Ninomiya and M. Seki, Lab Chip, 2017, 17, 304–314 RSC.
- S. H. Holm, J. P. Beech, M. P. Barrett and J. O. Tegenfeldt, Lab Chip, 2011, 11, 1326–1332 RSC.
- S. H. Holm, J. P. Beech, M. P. Barrett and J. O. Tegenfeldt, Anal. Methods, 2016, 8, 3291–3300 RSC.
- Z. B. Liu, F. Huang, J. H. Du, W. L. Shu, H. T. Feng, X. P. Xu and Y. Chen, Biomicrofluidics, 2013, 7, 011801 CrossRef PubMed.
- K. Loutherback, J. D'Silva, L. Y. Liu, A. Wu, R. H. Austin and J. C. Sturm, AIP Adv., 2012, 2, 042107 CrossRef PubMed.
- H. Okano, T. Konishi, T. Suzuki, T. Suzuki, S. Ariyasu, S. Aoki, R. Abe and M. Hayase, Biomed. Microdevices, 2015, 17, 59 CrossRef PubMed.
- S. H. Au, J. Edd, A. E. Stoddard, K. H. K. Wong, F. Fachin, S. Maheswaran, D. A. Haber, S. L. Stott, R. Kapur and M. Toner, Sci. Rep., 2017, 7, 2433 CrossRef PubMed.
- B. H. Wunsch, J. T. Smith, S. M. Gifford, C. Wang, M. Brink, R. L. Bruce, R. H. Austin, G. Stolovitzky and Y. Astier, Nat. Nanotechnol., 2016, 11, 936–940 CrossRef CAS PubMed.
- J. P. Beech, S. H. Holm, K. Adolfsson and J. O. Tegenfeldt, Lab Chip, 2012, 12, 1048–1051 RSC.
- E. Henry, S. H. Holm, Z. M. Zhang, J. P. Beech, J. O. Tegenfeldt, D. A. Fedosov and G. Gompper, Sci. Rep., 2016, 6, 34375 CrossRef CAS PubMed.
- J. P. Beech, P. Jonsson and J. O. Tegenfeldt, Lab Chip, 2009, 9, 2698–2706 RSC.
- D. W. Inglis, J. A. Davis, R. H. Austin and J. C. Sturm, Lab Chip, 2006, 6, 655–658 RSC.
- J. A. Davis, Doctoral thesis, Princeton, 2008 Search PubMed.
- Z. Zhang, E. Henry, G. Gompper and D. A. Fedosov, J. Chem. Phys., 2015, 143, 243145 CrossRef PubMed.
- K. Loutherback, K. S. Chou, J. Newman, J. Puchalla, R. H. Austin and J. C. Sturm, Microfluid. Nanofluid., 2010, 9, 1143–1149 CrossRef.
- B. R. Long, M. Heller, J. P. Beech, H. Linke, H. Bruus and J. O. Tegenfeldt, Phys. Rev. E, 2008, 78, 046304 CrossRef PubMed.
- J. Frechette and G. Drazer, J. Fluid Mech., 2009, 627, 379–401 CrossRef.
- S. C. Kim, B. H. Wunsch, H. Hu, J. T. Smith, R. H. Austin and G. Stolovitzky, Proc. Natl. Acad. Sci. U. S. A., 2017, 114, E5034–E5041 CAS.
- J. Melin, W. van der Wijngaart and G. Stemme, Lab Chip, 2005, 5, 682–686 RSC.
- B. P. Casavant, E. Berthier, A. B. Theberge, J. Berthier, S. I. Montanez-Sauri, L. L. Bischel, K. Brakke, C. J. Hedman, W. Bushman, N. P. Keller and D. J. Beebe, Proc. Natl. Acad. Sci. U. S. A., 2013, 110, 10111–10116 CrossRef CAS PubMed.
- J. P. Beech and J. O. Tegenfeldt, Capillary driven separation on patterned surfaces, microTAS 2009, The 13th International Conference on Miniaturized Systems for Chemistry and Life Sciences, Jeju, Korea, November 1–5, 2009, pp. 785–787 Search PubMed.
- K. Morton, O. K. C. Tsui, C. K. Tung, J. C. Sturm, S. Y. Chou and R. Austin, New J. Phys., 2010, 12, 085008 CrossRef.
- E. W. Washburn, Phys. Rev., 1921, 17, 273–283 CrossRef.
- S. Mendez, E. M. Fenton, G. R. Gallegos, D. N. Petsev, S. S. Sibbett, H. A. Stone, Y. Zhang and G. P. Lopez, Langmuir, 2010, 26, 1380–1385 CrossRef CAS PubMed.
- E. Elizalde, R. Urteaga and C. L. Berli, Lab Chip, 2015, 15, 2173–2180 RSC.
- P. Yager, T. Edwards, E. Fu, K. Helton, K. Nelson, M. R. Tam and B. H. Weigl, Nature, 2006, 442, 412–418 CrossRef CAS PubMed.
- B. M. Cummins, R. Chinthapatla, B. Lenin, F. S. Ligler and G. M. Walker, Technology, 2017, 5, 21–30 CrossRef.
- D. W. Inglis, J. A. Davis, R. H. Austin and J. C. Sturm, Lab Chip, 2006, 6, 655–658 RSC.
- S. H. Holm, J. P. Beech, M. P. Barrett and J. O. Tegenfeldt, Anal. Methods, 2016, 8, 5726–5726 RSC.
- A. F. Sarioglu, N. Aceto, N. Kojic, M. C. Donaldson, M. Zeinali, B. Hamza, A. Engstrom, H. Zhu, T. K. Sundaresan, D. T. Miyamoto, X. Luo, A. Bardia, B. S. Wittner, S. Ramaswamy, T. Shioda, D. T. Ting, S. L. Stott, R. Kapur, S. Maheswaran, D. A. Haber and M. Toner, Nat. Methods, 2015, 12, 685–691 CrossRef CAS PubMed.
- J. L. Osborn, B. Lutz, E. Fu, P. Kauffman, D. Y. Stevens and P. Yager, Lab Chip, 2010, 10, 2659–2665 RSC.
- Y. Yang, E. Noviana, M. P. Nguyen, B. J. Geiss, D. S. Dandy and C. S. Henry, Anal. Chem., 2017, 89, 71–91 CrossRef CAS PubMed.
- K. Yamada, H. Shibata, K. Suzuki and D. Citterio, Lab Chip, 2017, 17, 1206–1249 RSC.
- Y. Temiz, R. D. Lovchik, G. V. Kaigala and E. Delamarche, Microelectron. Eng., 2015, 132, 156–175 CrossRef CAS.
- W. Herzberg, Papierprüfung, Springer, Berlin, Heidelberg, 1921, p. 109, DOI:10.1007/978-3-662-25211-6_18.
Footnote |
| † Electronic supplementary information (ESI) available. See DOI: 10.1039/c7lc00707h |
| This journal is © The Royal Society of Chemistry 2017 |