 Open Access Article
Creative Commons Attribution 3.0 Unported Licence
A new droplet-forming fluidic junction for the generation of highly compartmentalised capsules†
J.
Li
 and
D. A.
Barrow
 *
*
Applied Microfluidic Laboratory, School of Engineering, Cardiff University, Cardiff, UK. E-mail: LiJ40@cardiff.ac.uk; Barrow@cardiff.ac.uk
First published on 14th July 2017
Abstract
A new oscillatory microfluidic junction is described, which enables the consistent formation of highly uniform and complex double emulsions, and is demonstrated for the encapsulation of four different reagents within the inner droplets (called cores) of the double emulsion droplets. Once the double emulsion droplets had attained a spherical form, the cores assumed specific 3D arrangements, the orchestration of which appeared to depend upon the specific emulsion morphology. Such double emulsion droplets were used as templates to produce highly compartmentalised microcapsules and multisomes. Based on these construct models, we numerically demonstrated a model chemical reaction sequence between and within the liquid cores. This work could provide a platform to perform space/time-dependent applications, such as programmed experiments, synthesis, and delivery systems.
Introduction
Droplet microfluidics1 is usually based on liquid droplet formation in another immiscible phase, and can provide large numbers of uniform, independent, and controllable droplets.2,3 Such droplets have been widely applied to diverse chemistries,4 for instance, in d-PCR,5 organic synthesis,6 the fabrication of microparticles,7 and various cell manipulations.8,9 In addition, droplet microfluidics shows outstanding performance in the generation of consistent multiple emulsions,10 when compared to conventional batch methodologies, though the volumes produced are often far lower. Complex multiple emulsion droplets11 can be continuously formed and processed,12,13 within modular or monolithically integrated, microfluidic devices and systems, which enable the fabrication of micro-scale vesicles/particles with cellular-like, internal structures14 with certain arrangement.15,16 Such constructs provide a generic, hierarchical platform, which can enable programmed chemical interactions that are required for the engineering of (bio)chemistry and synthetic biology.17–20Droplet-forming, fluidic junctions are important elements in droplet microfluidics, and include the T-shaped junction,21 the flow-focusing junction22 (also called the cross-shaped junction), and the co-flow junction.23 The droplet formation process in these junctions has been well studied,24 and indicates that the dynamic flow profiles,25 the methods to deliver fluids,26 the channel wettability and their geometries,27–30 as well as the liquid phase properties31 (e.g. chemical composition,32 dynamic viscosity,33 interfacial tensions,34 surfactant composition,35 suspension components,36etc.) can all influence the attained droplet morphology. Generally, the strategy to form multiple emulsions is to use a series of droplet-forming junctions, within either microcapillary-based37 or planar, chip-based, microfluidic devices, by either one-step methods38 or multi-step methods.39 The one-step method demonstrates the fine control over the formation of multi-layer droplets,40 whilst the multi-step method exhibits the ability to generate compartmentalised droplets, by encapsulating multiple inner droplets41 (here, we adopt the terminology “cores”,42 to describe the encapsulated droplets, so as to differentiate them from the overall multiple emulsion droplets). However, due to the existence of hydrodynamic instabilities during droplet breakup, the sequential emulsification process is constrained by the need to synchronise droplet formation at each droplet-forming junction.43 In part, this is because the relatively simple architectures of these classical fluidic junctions have limited scope to spatially confine fluidic interfacial interactions. Consequentially, by using such simple junction architectures, a feed of a first emulsion, into a new secondary immiscible phase, could result in droplet polydispersity, not only due to the absolute size of the overall droplet, but also because of the variations of the encapsulated liquid cores. Therefore, generally, to obtain more precision over compartmentalised droplet formation, superior flow rate controls are required, to constrain the control of droplet morphology within a desired narrow range.43
In the work presented here, we evaluate a new bifurcated microfluidic geometry (the bat-wing junction) that was designed to form complex multiple emulsions, in a stepwise emulsification mechanism, via its feature of precision flow sectioning. We studied the flow oscillation behaviour at fluid-flow bifurcations within the geometry, and studied their influence on the control of droplet breakup and size. Also, we evaluated this geometry for the generation of double emulsion droplets, where we encapsulated multiple reagents, and evaluated the precision control over the number and relative size of the inner cores and their final 3-dimensional orchestration. Further, by numerical simulations, we studied an example of how these multicore constructs could enable sequential chemical reactions within and between such cores, which may open up new applications in (bio)chemical technology, such as smart chemicals delivery and the formation of artificial cells.
Experimental
Chemicals and materials
Trimethylolpropane triacrylate (TMPTA, 246808), photoinitiator 2-hydroxy-2-methylpropiophenone (405655, 5% v/v in TMPTA), glycerol (G5516), mineral oil (M8410), oil red O (O9755), thymol blue (32728), and potassium carbonate (P1472, 3% w/w aqueous solution) were purchased from Sigma-Aldrich Corporation. The optical polymer Norland optical adhesive 61 (NOA 61) was purchased from Tech Optics Ltd.Fabrication and setup of the microfluidic device
Circular microfluidic chips (50 mm diameter, 3 mm thick) were fabricated from polytetrafluoroethylene (PTFE) using a surface-milling machine (LPKF, C30) fitted with dual-branch, fishtail routers rotating at 30![[thin space (1/6-em)]](https://www.rsc.org/images/entities/char_2009.gif) 000 rpm. The resulting rectilinear duct surfaces typically had a roughness (Ra) of ∼2 μm as measured with a VEECO NT3300 white-light interferometer. A 10 mm thick ground glass disc coated with a 100 um thick perfluoroalkoxy (Goodfellow Cambridge Ltd., UK) film was placed over the PTFE disc, so as to provide both (i) a continuous duct geometry with a continuous water contact angle of ∼108° and (ii) a robust viewing window when mechanically compressed within a stainless steel integration and fluidic interface manifold (Fig. S1†).
000 rpm. The resulting rectilinear duct surfaces typically had a roughness (Ra) of ∼2 μm as measured with a VEECO NT3300 white-light interferometer. A 10 mm thick ground glass disc coated with a 100 um thick perfluoroalkoxy (Goodfellow Cambridge Ltd., UK) film was placed over the PTFE disc, so as to provide both (i) a continuous duct geometry with a continuous water contact angle of ∼108° and (ii) a robust viewing window when mechanically compressed within a stainless steel integration and fluidic interface manifold (Fig. S1†).
Experiment and measurement
In the experiments, water/polymer/oil (W/P/O) was used as a template for the formation of double emulsions and fabricated using a stepwise emulsification method on a PTFE substrate microfluidic chip, without any PTFE surface treatment. Constant flow-rate, fluid delivery from 10 mL gas-tight syringes (SGE Analytical Science), through PEEK and PFA interconnects, was enabled via syringe displacement pumps (KD Scientific, model 789200L). The morphology of the double emulsion was controlled by the input flow rates, importantly, without adding any surfactant. The core–shell-shaped W/P segments were photo-cured, on the fly, within a length of PTFE outlet tubing (1.5 mm inner diameter) by exposure to a UV light source (5 W 365 nm-wavelength UV LED, placed 1 cm away from the tubing). Solid samples were collected in a beaker filled with a stirred carrier phase, and washed three times with acetone before analysis. A real-time video was recorded to study the droplet formation using a high-speed (400 fps) camera (MS40KD2C1, Mega Speed Corporation) mounted on a Nikon AZ100 microscope. Dimensional images of solid capsules were recorded using a Nikon MM-800 measuring microscope, and analysed with Nikon NIS-elements D 3.2 software.Computational fluid dynamics simulation
Three-dimensional, time-dependent, computational fluid dynamics simulations were developed to model the droplet breakup process at the bat-wing junction, by using COMSOL Multiphysics 5.0 software (COMSOL Inc., Burlington, MA). The isosurface, volume arrow, velocity magnitude and pressure distributions were plotted as geometric median surfaces to demonstrate the droplet breakup process. Numerical data were obtained for the analysis.Results and discussion
Description of bat-wing junction geometry and operation
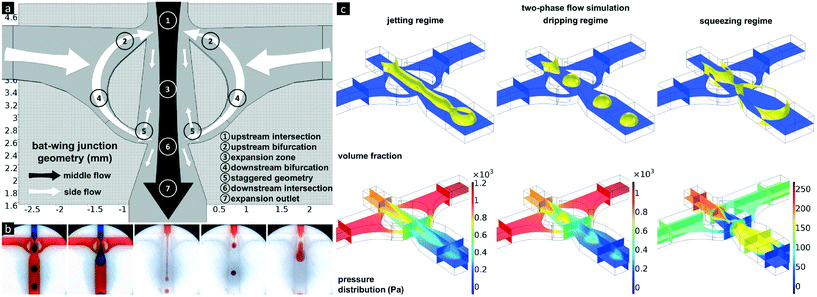
The structures of droplet-forming junctions play an important role in droplet formation, due to the influence of spatial constraints on the delivery, and the interactions, of the fluids employed. The bat-wing junction was designed to comprise two cross-shaped intersections, aligned end-to-end and sharing the side inlets with bifurcations as shown in Fig. 1a. The two intersections were linked by an expansion zone, and terminated with an expansion outlet. These width-expanding structures were utilised to focus and dissipate the fluid flows and create local maximum velocity magnitude points, where the highest shear force occurs. The upstream and downstream bifurcations couple the pressures at the two intersections, and form a uniform pressure gradient, within the expansion zone. The widths of the bifurcations are narrower than the central channel, so as to be easily obstructed by the middle flow. The staggered geometry serves as a fluid shunt and directs the fluid delivery, either upwards or downwards, according to the local dynamic pressure distribution.Single emulsion formation
Similar to other droplet-forming junctions, three droplet formation regimes were observed when using the bat-wing junction. As shown in Fig. 1b, the two left images show the water droplet (blue) break-up in mineral oil (red), in both dripping and squeezing regimes. The three images to the right demonstrate the TMPTA droplet (red) break-up in mineral oil (transparent), in jetting, dripping and squeezing regimes, respectively. Three-dimensional, computational fluid dynamics simulations were conducted to study the details of the droplet formation at the bat-wing junction (Fig. 1c). It was found that the continuous phase flow was predicted to oscillate between the upstream and downstream bifurcations. This oscillation was related to the dispersed phase position, inside the expansion zone, during droplet formation (Fig. 2a and b, Video S1†). Continuing with the droplet formation process, while the dispersed phase (only) blocks the upstream bifurcation, the local pressure at the blockage starts to increase, forming a vortex, and most of the continuous phase flows through the downstream bifurcation. If the incoming dispersed phase blocks both the upstream and downstream bifurcations, the continuous phase is squeezed within the expansion zone that lies between the upstream and downstream bifurcations. The continuous phase accumulates in the expansion zone, squeezing the dispersed phase into an hourglass form, which eventually leads to break-off or sectioning. Since the volumes of the continuous phase from the upstream and downstream bifurcations flowing into the expansion zone vary dramatically during a droplet formation cycle (Fig. 2c), this in turn induces different flow patterns during droplet breakup (Fig. 2d). Hence, the droplet breakup point, as well as the droplet size, could be controlled by the continuous phase inflow rate (Fig. 2e). This feature of the bat-wing junction was utilised as a precise packaging tool, to assemble uniform, dispersed phase segments of definable length, during the emulsification process within the microchannel.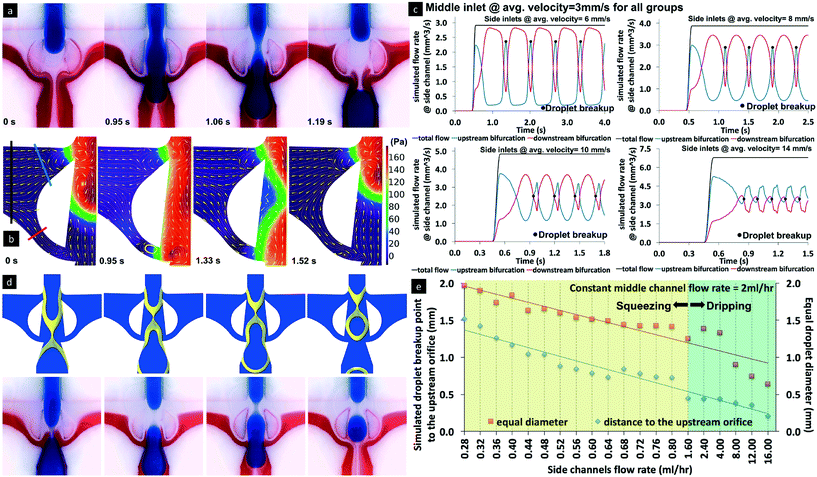 | ||
| Fig. 2 Control of droplet break-up at the bat-wing junction. The channel geometry refers to Fig. 1a. a. Time sequence images of the water droplet formation in the squeezing regime. The dispersed phase blocks all the bifurcations, and the continuous phase flows into the expansion zone from two directions. The blue/clear/red phases' flow rates are 1/0.3/0.3 ml h−1. b. Time sequence images of the two-phase droplet breakup simulation in the squeezing regime. The yellow cones show the local flow direction. Eddy flow (as shown by the yellow contour) appears where the blockage occurs (the expansion zone and the bifurcations) and the size changes with time. The colour gradient shows the pressure distribution. The flow rate in the top inlet is 1 ml h−1 and those in the side inlets are both 0.5 ml h−1. c. Continuous phase flows oscillated between the upstream and the downstream bifurcations. The average flow rates were measured at the cross-section of the coloured lines shown in b. These images also indicate that different amounts of the continuous phase flowed into the expansion zones under different inlet combinations. d. Coupled CFD simulations and laboratory experiments illustrate the different water droplet breakup locations in oil at the bat-wing junction. All dispersed phases' input rates are 2 ml h−1. The continuous phase flow rates, from left to right, are 0.28 ml h−1, 0.52 ml h−1, 0.64 ml h−1 and 1.60 ml h−1, respectively. e. The relationship between the continuous phase flow rate with the droplet breakup point and droplet size. When the continuous phase flow rate is increased, the droplet breakup location moves upward with droplet size reduction. | ||
It was also found that a passive satellite droplet removal mechanism resulted from the squeezing regime, within the bat-wing junction. This was due to the incoming dispersed phase blocking the upstream bifurcation, just after the droplet break-up, resulting in the continuous phase being forced through the downstream bifurcation. Any formed satellite droplets were found to remain at a stationary position inside the expansion zone, and effectively merged with the incoming dispersed phase, due to the surfactant-free emulsion templates (Video S2†).
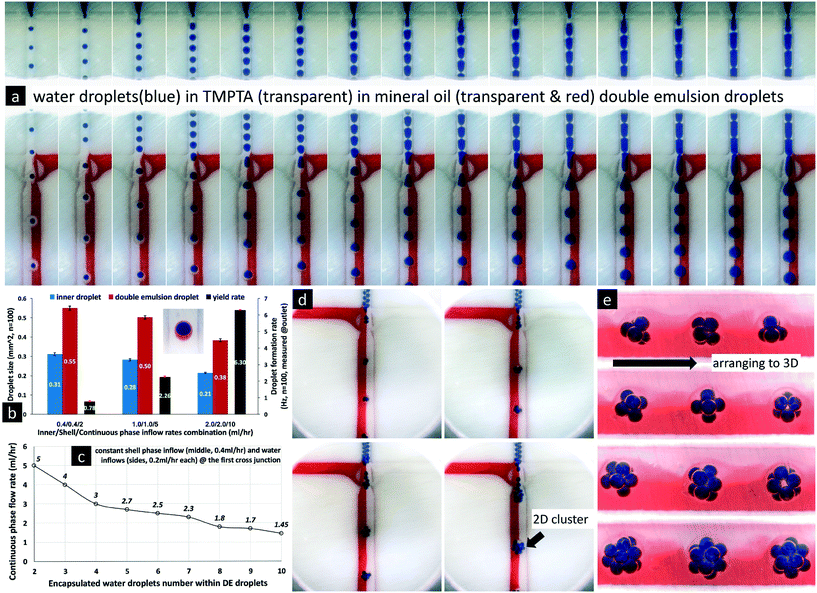 | ||
| Fig. 3 Control of double emulsion formation with uniform inner droplets at the bat-wing junction. The channel geometry refers to Fig. 1a. a. Core–shell-shaped double emulsion droplet formation by the two-step method, using the bat-wing as the second droplet-forming junction. The shell phase flow rates are all 0.2 ml per hour, and the inner phase (blue) flow rates are 0.05, 0.1, 0.2, 0.3…, 1.3, and 1.4 ml per hour from left to right, respectively. b. The size distributions and the formation rates of the double emulsion droplets under different inlet combinations. From left to right, the standard deviations of the inner droplet sizes (blue) are ±2.47%, ±2.01%, and ±1.58%, and the standard deviations of the total double emulsion droplet size (blue + pink) are ±1.85%, ±1.85%, and ±1.86%, respectively. c. Control of the inner droplet number within double emulsion droplets by tuning the continuous phase flow rate. d. Images of double emulsion droplet formation in a 600 micron deep channel, encapsulating 2, 4, 6, and 10 inner droplets. e. The 3D arrangements of the inner droplets within the spherical-shaped double emulsion droplets. The DE droplets just flowed to the 1.2 mm deep channel, from d, to attain spherical forms with the inner droplets self-arranging, moving from left to right. The top to bottom rows illustrate 4, 6, 8, and 12 inner droplets within the double emulsion droplets, respectively. | ||
Next, we tested the consistency, by which the bat-wing junction formed core–shell-shaped double emulsion droplets, by measuring both their yield rates and size distributions. As shown in Fig. 3b, while the inflow rate ratios of inner/shell phases were held constant, the yield rates of double emulsion droplets at the outlet were elevated by increasing the total inflow rate. The variations in time intervals between adjacent droplets entering the outlet were ±4.84%, ±4.74% and ±3.47%, for the three groups in Fig. 3b, from left to right, respectively. At the same time, the sizes of the double emulsion droplets were reduced, while the total inflow rate was increased. The size variations (n = 100 for each group) of the inner core droplets were ±2.47%, ±2.01% and ±1.58%, and those of the total double emulsion droplets were ±1.85%, ±1.85% and ±1.86%, from low to high inflow rates. These results suggested that the bat-wing junction could form highly replicated, core–shell-shaped double emulsion droplets, by a two-step method under different inflow rate combinations.
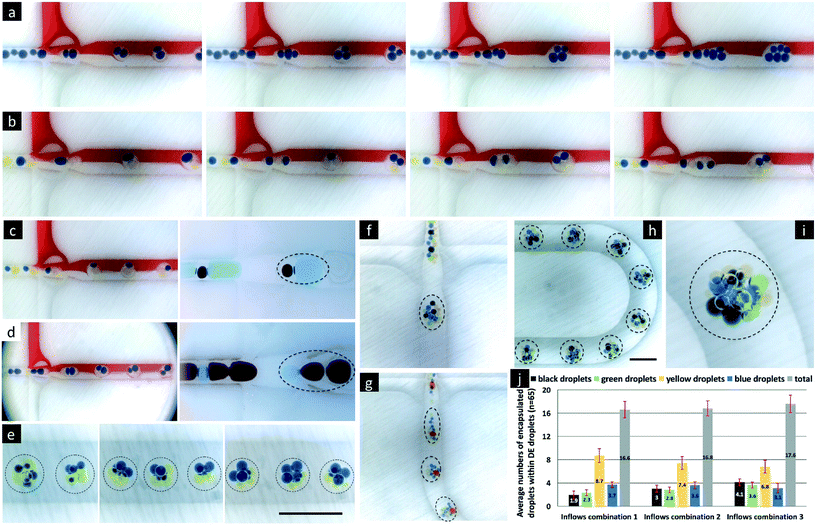 | ||
| Fig. 4 Control of double emulsion formation with multiple types of inner droplets at the bat-wing junction. The channel geometry refers to Fig. 1a. All the scale bars indicate 1.2 mm. a–c. Double emulsion droplet formation from the first emulsions with even-numbered inner droplet groups. d. Double emulsion droplet formation from the first emulsions with odd-numbered inner droplet groups. e. The 3D arrangements of inner droplets within spherical double emulsion droplets. From left to right, the yellow/blue inner phase flow rates are 0.3/0.1, 0.2/0.2, and 0.3/0.1 ml h−1, respectively. The shell phase and continuous phase flow rates are 0.8 ml h−1 and 3.0 ml h−1 as constants. f–i. Double emulsion droplet formation encapsulating four types of inner droplets, and their 3D arrangement within the spherical droplets. j. The numbers of inner core droplets within the double emulsions under different inflow combinations. | ||
Microcapsules and multisomes
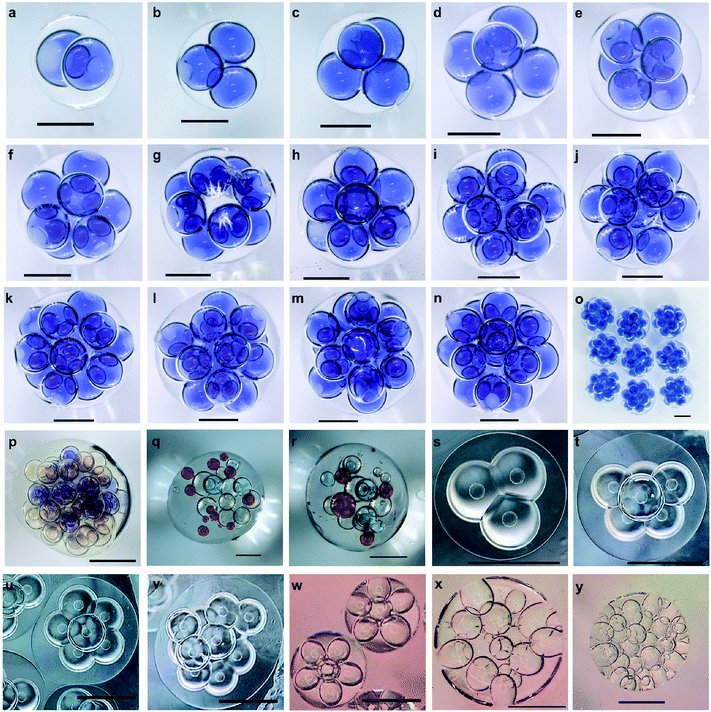
So far, we have demonstrated how to form highly uniform double emulsion droplets that encapsulate multiple types of inner droplet cores, with controllable morphology, using the bat-wing junction and a stepwise emulsification method. The 3D geometrical arrangement of inner droplet cores appeared to depend on both their number and size and the specific contiguous order within the first emulsion. These double emulsion droplets could represent very interesting templates, to fabricate highly compartmentalised micro-constructs with given functionalities. Fig. 5a–r show solid polymeric microcapsules, which were solidified from the double emulsion droplets and produced using the methodologies described above. Once the droplets had attained an approximately spherical form, the shell phase was photopolymerised, on the fly, using a 365 nm UV light source. The photopolymerised shells formed an effectively fixed encapsulating matrix, within which the inner droplet cores, containing chemical reagents, were held in a constant, 3-dimensional geometrical orchestration. This fixation thereby enabled subsequent metrological analysis. Such multicore microcapsules, with a liquid encapsulation matrix, may be used to enable multiple-reagent release or in situ chemical synthesis in relation to external stimuli. Such encapsulation matrices could include a wide range of degradable polymers (e.g. polylactic acid) and semi-permeable materials (e.g. NOA61, as used here) or employ bilayer lipid membranes decorated with functional inter-core or inter-droplet proteins. In contrast to the aforementioned constructs fixed within a photopolymerised polymer, ‘soft’ analogues (e.g. multisomes) were formed from water/squalene/TMPTA emulsions (Fig. 5s–v) or water/squalene/3% alginate emulsions (Fig. 5w–y), using the same methods as used before, but on PMMA-based microfluidic chips. The numbers of the inner water droplets were controlled, and the lipids, which were pre-suspended in squalene, were assembled around them to form monolayers. Once the double emulsion droplets had attained spherical forms, the inner droplet cores, again self-arranged, and high-order, 3D droplet interface bilayer networks were established. Such artificial vesicles hold great potential for biotechnology developments and medical applications.44Finally, we simulated model sequential reactions and molecular diffusion within a typical multicore construct. This model consisted of 3D inner droplet arrangements that were based on the practical experiments demonstrated in this paper. Fig. 6a models a gas capture process within a 13-core, gas-permeable microcapsule that encapsulated the active reagents. The chemical reaction within the central core was the last in this sequential chain reaction, due to the specific geometrical arrangement of cores. Fig. 6b models the sequential chemical reactions within a multicore multisome that contained four types of cores, each with a different reagent. The diffusion of the water-soluble reagents was influenced by the bilayer positions, which also depended upon the inner droplet core arrangements. The reactions took place while the molecules diffused within the multisome. These demonstrations may provide the beginnings of more precise engineering tools for programmed chemistry and synthetic biology.
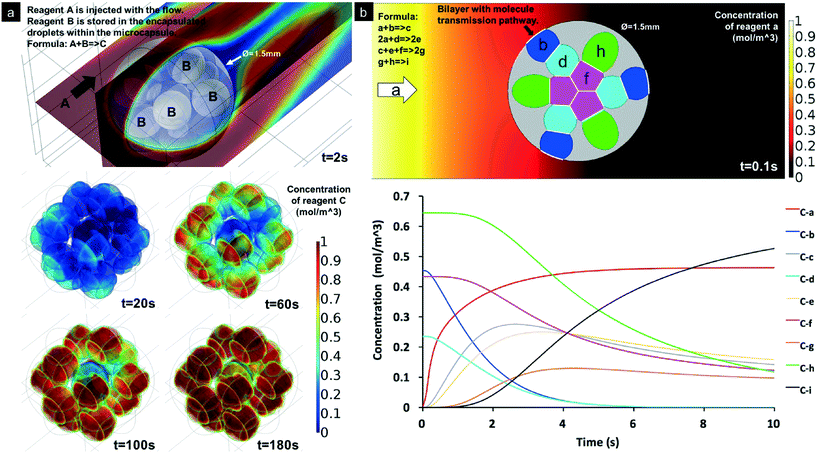 | ||
| Fig. 6 Simulated sequential chemical reactions within the compartmentalised capsules. a. Reagent A is captured by the reaction when flowing over the compartmentalised microcapsules (13 inner droplets, reproduced from Fig. 5i). The top image shows the concentration of A. The microcapsule encapsulates B within the inner droplets. The four bottom images show the increasing concentration of C within the droplets. b. Demonstration of chain chemical reactions within a multisome (reproduced from Fig. 5x), which is defined to load four water-soluble reagents b, d, f and h, represented by different colours. The top image shows the model geometry. Reagent a is assumed as the molecule that can transmit through the lipid bilayer (white lines). The bottom image shows the concentrations of the chemical compounds within the multisomes. | ||
Conclusions
In summary, we demonstrate a novel, droplet-forming fluidic junction, for which we coined the term, the ‘bat-wing junction’. Its bifurcation structures oscillate the side flows during droplet formation, and the droplet break-up point and droplet size were regulated, by adjusting only the continuous phase inflow rate. We also found that the junction acted as a passive satellite droplet removal mechanism, due to its inherent flow confinement behaviour. This junction can be used in stepwise emulsification methods, to precisely section a patterned first emulsion and then form uniform double emulsion droplets, which can encapsulate inner cores (droplets) of various sizes and reagent composition. It was found that once the double emulsions attained a spherical form in the capillary, the inner core self-arranged in certain 3D geometric orchestrations, which appeared to depend upon their sizes, numbers and order, within the double emulsion droplets. We produced highly compartmentalised microcapsules and multisomes from these double emulsion droplets, on the fly, to inherit the formed droplet morphologies. We further demonstrated by numerical simulation how these microconstructs could possibly enable sequential chemical reactions, as a generic platform for diverse applications, ranging from (bio)chemical synthesis45/analysis,46 cell passage,47 smart drug delivery,48,49 computation50 and self-repair materials,51 and artificial cells.52Certain limitations exist in the work reported here that could be explored further, including critically the spatial constraints due to the 2.5D nature of the planar bat-wing junction used in this study. For this, a truly 3-dimensional bat-wing junction could be manufactured by the adoption of novel additive manufacturing methods, such as 3D-printing.53,54 This could enable the more exact sectioning of a first emulsion into even more accurately defined, internally compartmentalised capsules. Also, additional precision control of individual cores (size, order, reagent concentration, etc.) within the first emulsion (before sectioning as double emulsion droplets) could be found by employing pulseless, fluid propulsion mechanisms. Further, sequential droplet processing could be enabled by liquid carrier phase exchange,55 vesicle/particle surface overcoating,56 and non-invasive in-flow droplet characterization.57 Such improved characterisation could be enabled through non-invasive, on-the-fly, interferometric or tomographic methodologies, and could enable the increased resolution of individual core droplet volumes and dimensions.
Acknowledgements
This work was supported by the National Research Network Wales for advanced engineering and materials (NRN097), funded by the Higher Education Funding Council for Wales and the Welsh Government. We thank Dr. Oliver Castell and Mr. Divesh Baxani for the preparation of the lipid solvents and helpful discussion.Notes and references
- S. Y. Teh, R. Lin, L. H. Hung and A. P. Lee, Lab Chip, 2008, 8, 198–220 RSC.
- H. Gu, M. H. Duits and F. Mugele, Int. J. Mol. Sci., 2011, 12, 2572–2597 CrossRef CAS PubMed.
- M. K. Mulligan and P. R. Jonathan, Microfluid. Nanofluid., 2012, 13, 65–73 CrossRef CAS.
- H. Song, D. L. Chen and R. F. Ismagilov, Angew. Chem., Int. Ed., 2006, 45, 7336–7356 CrossRef CAS PubMed.
- M. Baker, Nat. Methods, 2010, 7, 351–355 CrossRef CAS.
- P. M. Valencia, et al. , ACS Nano, 2010, 4, 1671–1679 CrossRef CAS PubMed.
- Q. Xu, et al. , Small, 2009, 5, 1575–1581 CrossRef CAS PubMed.
- T. Aikawa, T. Konno, M. Takai and K. Ishihara, Langmuir, 2011, 28, 2145–2150 CrossRef PubMed.
- V. L. Workman, S. B. Dunnett, P. Kille and D. D. Palmer, Macromol. Rapid Commun., 2008, 29, 165–170 CrossRef CAS.
- A. S. Utada, et al. , Science, 2005, 308, 537–541 CrossRef CAS PubMed.
- R. K. Shah, et al. , Mater. Today, 2008, 11, 18–27 CrossRef CAS.
- M. Li, et al. , Lab Chip, 2017, 17, 635–639 RSC.
- D. V. Amato, H. Lee, J. G. Werner, D. A. Weitz and D. L. Patton, ACS Appl. Mater. Interfaces, 2017, 9, 3288–3293 CAS.
- W. Wang, M. J. Zhang and L. Y. Chu, Acc. Chem. Res., 2013, 47, 373–384 CrossRef PubMed.
- J. Guzowski and P. Garstecki, Phys. Rev. Lett., 2015, 114, 188302 CrossRef PubMed.
- J. Guzowski, S. Jakiela, P. M. Korczyk and P. Garstecki, Lab Chip, 2013, 13, 4308–4311 RSC.
- C. Schmitt, A. H. Lippert, N. Bonakdar, V. Sandoghdar and L. M. Voll, Front. Bioeng. Biotechnol., 2016, 4, 1–12 Search PubMed.
- K. Torbensen, F. Rossi, S. Ristori and A. Abou-Hassan, Lab Chip, 2017, 17, 1179–1189 RSC.
- D. T. Chiu, et al. , Chem, 2017, 2, 201–223 CAS.
- D. K. Baxani, et al. , Angew. Chem., 2016, 128, 14452–14457 CrossRef.
- P. Garstecki, M. J. Fuerstman, H. A. Stone and G. M. Whitesides, Lab Chip, 2006, 6, 437–446 RSC.
- S. L. Anna, N. Bontoux and H. A. Stone, Appl. Phys. Lett., 2003, 82, 364–366 CrossRef CAS.
- Y. C. Tan, J. Collins and A. P. Lee, Micro TAS, Lake Tahoe, 2003 Search PubMed.
- C. X. Zhao and A. P. Middelberg, Chem. Eng. Sci., 2011, 66, 1394–1411 CrossRef CAS.
- C. A. Stan, S. K. Tang and G. M. Whitesides, Anal. Chem., 2009, 81, 2399–2402 CrossRef CAS PubMed.
- H. Kim, D. Luo, D. Link, D. A. Weitz, M. Marquez and Z. Cheng, Appl. Phys. Lett., 2007, 91, 133106 CrossRef.
- M. Hashimoto, P. Garstecki and G. M. Whitesides, Small, 2007, 3, 1792–1802 CrossRef CAS PubMed.
- L. Yobas, S. Martens, W. L. Ong and N. Ranganathan, Lab Chip, 2006, 6, 1073–1079 RSC.
- C. C. Roberts, et al. , Lab Chip, 2012, 12, 1540–1547 RSC.
- P. Garstecki, M. J. Fuerstman and G. M. Whitesides, Nat. Phys., 2005, 1, 168–171 CrossRef CAS.
- W. Lee, L. M. Walker and S. L. Anna, Phys. Fluids, 2009, 21, 032103 CrossRef.
- S. Matosevic and B. M. Paegel, J. Am. Chem. Soc., 2011, 133, 2798–2800 CrossRef CAS PubMed.
- Z. Nie, et al. , Microfluid. Nanofluid., 2008, 5, 585–594 CrossRef CAS.
- L. Peng, M. Yang, S. S. Guo, W. Liu and X. Z. Zhao, Biomed. Microdevices, 2011, 13, 559–564 CrossRef PubMed.
- S. L. Anna and H. C. Mayer, Phys. Fluids, 2006, 18, 121512 CrossRef.
- S. H. Tan, S. S. Murshed, N. T. Nguyen, T. N. Wong and L. Yobas, J. Phys. D: Appl. Phys., 2008, 41, 165501 CrossRef.
- T. Si, H. Feng, X. Luo and R. X. Xu, Microfluid. Nanofluid., 2015, 18, 967–977 CrossRef.
- A. R. Abate, J. Thiele and D. A. Weitz, Lab Chip, 2011, 11, 253–258 RSC.
- S. Okushima, T. Nisisako, T. Torii and T. Higuchi, Langmuir, 2004, 20, 9905–9908 CrossRef CAS PubMed.
- S. H. Kim and D. A. Weitz, Angew. Chem., Int. Ed., 2011, 50, 8731–8734 CrossRef CAS PubMed.
- W. Wang, et al. , Lab Chip, 2011, 11, 1587–1592 RSC.
- F. Caruso, R. A. Caruso and H. Möhwald, Science, 1998, 282, 1111–1114 CrossRef CAS PubMed.
- A. R. Abate and D. A. Weitz, Small, 2009, 5, 2030–2032 CrossRef CAS PubMed.
- G. Villar, A. J. Heron and H. Bayley, Nat. Nanotechnol., 2011, 6, 803–808 CrossRef CAS PubMed.
- A. L. Hiddessen and B. J. Hindson, U.S. Pat. 9598725, 2017 Search PubMed.
- Y. Ding and J. Choo, Microfluid. Nanofluid., 2017, 21, 58 CrossRef.
- H. F. Chan, et al. , Sci. Rep., 2013, 3, 03462 CrossRef PubMed.
- C. X. Zhao, Adv. Drug Delivery Rev., 2013, 65, 1420–1446 CrossRef CAS PubMed.
- D. Liu, H. Zhang, F. Fontana, J. Hirvonen and H. A. Santos, Lab Chip, 2017, 17, 1856–1883 RSC.
- A. Adamatzky, BioSystems, 2012, 109, 72–77 CrossRef PubMed.
- O. Teall, et al., Proceedings of the 11th fib International PhD Symposium in Civil Engineering, FIB, 2016, pp. 639–646 Search PubMed.
- M. Bayoumi, H. Bayley, G. Maglia and K. T. Sapra, Sci. Rep., 2017, 7, 45167 CrossRef CAS PubMed.
- A. J. Morgan, et al. , PLoS One, 2016, 11, e0152023 Search PubMed.
- C. M. B. Ho, S. H. Ng, K. H. H. Li and Y. J. Yoon, Lab Chip, 2015, 15, 3627–3637 RSC.
- O. K. Castell, C. J. Allender and D. A. Barrow, Lab Chip, 2009, 9, 388–396 RSC.
- S. A. Peyman, A. Iles and N. Pamme, Lab Chip, 2009, 9, 3110–3117 RSC.
- S. U. Hassan, A. M. Nightingale and X. Niu, Micromachines, 2017, 8, 58 CrossRef.
Footnote |
| † Electronic supplementary information (ESI) available: Supplementary Fig. 1 and 2 and supplementary Videos 1–3. See DOI: 10.1039/c7lc00618g |
| This journal is © The Royal Society of Chemistry 2017 |

