
Smartphone based hand-held quantitative phase microscope using the transport of intensity equation method†
Xin
Meng‡
a,
Huachuan
Huang‡
bc,
Keding
Yan‡
d,
Xiaolin
Tian
a,
Wei
Yu
a,
Haoyang
Cui
e,
Yan
Kong
a,
Liang
Xue
*e,
Cheng
Liu
*a and
Shouyu
Wang
*a
aDepartment of Optoelectronic Information Science and Engineering, School of Science, Jiangnan University, Wuxi, Jiangsu 214122, China. E-mail: wsy_photonics@yahoo.com; cheng.liu@hotmail.co.uk
bInstitute of Fluid Physics, China Academy of Engineering Physics, Mianyang, Sichuan 621900, China
cSchool of Manufacturing Science and Engineering, Southwest University of Science and Technology, Mianyang, Sichuan 621010, China
dSchool of Electronic Information Engineering, Xi'an Technological University, Xi'an, Shaanxi 710032, China
eCollege of Electronics and Information Engineering, Shanghai University of Electric Power, Shanghai 200090, China. E-mail: xueliangokay@gmail.com
First published on 30th November 2016
Abstract
In order to realize high contrast imaging with portable devices for potential mobile healthcare, we demonstrate a hand-held smartphone based quantitative phase microscope using the transport of intensity equation method. With a cost-effective illumination source and compact microscope system, multi-focal images of samples can be captured by the smartphone’s camera via manual focusing. Phase retrieval is performed using a self-developed Android application, which calculates sample phases from multi-plane intensities via solving the Poisson equation. We test the portable microscope using a random phase plate with known phases, and to further demonstrate its performance, a red blood cell smear, a Pap smear and monocot root and broad bean epidermis sections are also successfully imaged. Considering its advantages as an accurate, high-contrast, cost-effective and field-portable device, the smartphone based hand-held quantitative phase microscope is a promising tool which can be adopted in the future in remote healthcare and medical diagnosis.
Introduction
Observations and measurements under the microscope are the gold standard for disease screening and diagnosis. However, the disadvantages of bulky equipment and high prices limit the wide use of commercial microscopes. In order to meet the different imaging needs of remote medical diagnosis, especially for point of care testing, smartphone based portable microscopes attract much attention since they can reduce costs with compact designs.1,2 Furthermore, sample imaging and post processing including statistical analysis and data communications can be accomplished with a smartphone. Considering these advantages, various smartphone based microscopes were proposed: Fletcher et al. designed cellscopes for multi-mode imaging.3–6 Wachsmann-Hogiu et al. proposed a bright field microscope for high quality imaging, as well as automatic cellular recognition and counting.7 Bogoch et al. used a mobile phone microscope in the diagnosis of soil-transmitted helminth infections.8 In order to simplify the imaging system, Shih et al. designed a compact smartphone microscope with inkjet printed lenses.9 Additionally, Yang et al. presented a lens-free smartphone based microscope using ambient illumination for high resolution bright field imaging.10 Besides the bright field mode, Ozcan et al. designed fluorescence testing platforms for the observation of samples including cells, DNA molecules, nanoparticles and viruses.11–17 Cattamanchi et al. reported a mobile digital fluorescence microscope for tuberculosis diagnosis.18 Chan et al. proposed an integrated smartphone based device for the wireless multiplexed diagnosis of infected patients.19However, considering that cells are often transparent under visible light illumination, traditional intensity based techniques cannot provide high-contrast images. Though the fluorescence mode can obviously improve the imaging quality, the required staining is invasive to samples. As a label-free technique, quantitative phase imaging20–31 can enhance the imaging contrast effectively. Furthermore, compared with qualitative phase contrast techniques, it also provides quantitative cellular phases for further measurements and analysis such as live cell monitoring32,33 and tomography.34–36 Based on quantitative phase imaging, miniaturized digital holographic microscopes37–40 attract much attention considering their quantitative phase imaging capabilities and cost-effective designs. Using affordable light sources and compact structures, Ozcan et al. designed various portable smartphone based digital holographic microscopes for sample observations and measurements.41,42 Lee et al. also proposed low-cost designs for molecular diagnostics by digital holography on a smartphone platform.43,44 Though light-emitting diodes (LEDs) can be used as sources in portable digital holographic microscopes, a pinhole is still required to satisfy the illumination coherence demands, obviously limiting the illumination intensity as well as decreasing the signal to noise ratio in the imaging. Moreover, the captured images are fringes which are not straightforward to use for sample observations. Though both the quantitative intensity and phase of samples can be retrieved from holograms, time consuming procedures including back-propagation and phase retrieval are still necessary. Another quantitative phase imaging technique based on the transport of intensity equation (TIE) does not rely on coherent illumination.45–56 Furthermore, the in-focus intensity can be directly captured offering more sample details with the retrieved phases from multi-focal intensities. A phase retrieval algorithm via solving the Poisson equation has high speed and efficiency since it avoids time-consuming phase unwrapping. Considering the advantages of the TIE method, in this paper, a hand-held smartphone based quantitative phase microscope is designed with a cost-effective LED illumination source and microscope system. Using a 3-D printed shell, the integrated portable microscope, with dimensions of 15.5 cm × 9.2 cm × 16.1 cm, is suitable for field detection and point of care testing. Multi-focal intensities as over-, in- and under-focus images are captured via manual focusing of the smartphone without additional mechanical scanning, and the quantitative phase distribution can be retrieved using a self-developed Android application.
In the following sections, we will firstly demonstrate both the hardware and software designs of a hand-held smartphone based quantitative phase microscope. Next, a random phase plate with a phase difference of ∼π was measured in order to test the accuracy of the portable smartphone microscope. Finally, to further demonstrate its performance, different biological samples such as a red blood cell smear, a Pap smear, and monocot root and broad bean epidermis sections were imaged. With its advantages of being accurate, high-contrast, cost-effective and field-portable, the smartphone based hand-held quantitative phase microscope is a promising tool which can be further applied in field testing and mobile healthcare.
Design of the smartphone based hand-held quantitative phase microscope
Fig. 1(A) shows the design of the smartphone based hand-held quantitative phase microscope. An LED acts as the illumination source, and various wavelength needs can be satisfied by using different LEDs. Here, the samples are put behind the light source, a micro-objective (60×, Edmund Optics, US) is used for sample magnification and another eyepiece (Edmund Optics, US) is attached in order to connect the smartphone camera and micro-objective. Fig. 1(B) shows the optical system of the smartphone based phase microscope. Furthermore, in order to integrate all the illumination, magnification and imaging parts, a 3-D printed shell was fabricated to realize a hand-held quantitative phase microscope as shown in Fig. 1(C) and (D). In order to perform quantitative phase measurements, the TIE method is adopted which needs multi-plane intensities for phase recovery. The smartphone (Nubia Z9 mini, China) has a manual focusing function and thus all the over-, in- and under-focus images can be captured without mechanical scanning as shown in Fig. S1 of the ESI.† It is worth noting that in order to obtain high-accuracy phase imaging, the defocus distance should be accurately calibrated before practical measurements are performed. Firstly, a test chart (1951 USAF resolution test chart, Edmund Optics, US) was set at the sample position. After sample focusing with the smartphone camera, quantitative manual focusing was applied to shift the imaging plane. Using a precision translation stage (MT1-Z8 Thorlabs, US) to scan the calibration target along the optical axis, various images at different focal planes can be captured. According to the focus criteria,57–59 the equivalent defocus distance in the sample plane can be physically determined. The process of defocus calibration is illustrated in detail in Fig. S2 and S3 of the ESI.† In experiments, the equivalent defocus distance is ∼5.0 μm in the sample plane with an uncertainty of 0.1 μm caused by the minimum step of the precision translation stage. Additionally, with a similar procedure, the depth of focus was measured as ∼1.0 μm. | (1) |
 | ||
| Fig. 1 (A) Design and (B) optical system of the smartphone based hand-held quantitative phase microscope; (C) and (D) integrated smartphone based hand-held quantitative phase microscope with its 3-D printed shell. | ||
In order to calculate and exhibit the sample phase distributions, the TIE shown in eqn (1) should be solved from the over-, in- and under-focus intensities. In eqn (1), ∂I/∂z indicates the intensity gradient which can be computed from the multi-focal images, k is the wave number and φ is the sample phase distribution.
Here, we employed FFT-based inversion solvers for quantitative phase retrieval (the detailed derivation is listed in the ESI†). Moreover, an Android application based on a smartphone platform and software based on a computer platform were both designed for solving the Poisson equation. Fig. 2 shows the self-developed Android application: firstly, the user must read in all the over-, in- and under-focus images; then, input the necessary parameters such as the wavelength and defocusing distance; finally, the phase distributions are computed automatically. Moreover, the details of the software based on the computer platform are illustrated in Fig. S4 of the ESI.†
 | ||
| Fig. 2 Self-developed Android application: (A) cover of the smartphone TIE application; (B) reading in all the over-focus, in-focus and under-focus images; (C) inputting the required parameters; (D) calculation and display of the quantitative phase distributions. | ||
Furthermore, we have also measured the time required for phase retrieval via both the smartphone and computer based self-developed software. For images with a total of 256 × 256 pixels, the smartphone needed ∼7.4 s for phase computation and display with a Qualcomm Snapdragon 615 and 2GB RAM. The time for the computer platform was ∼0.8 s using a laptop with an Intel Core i5 CPU M520 at 2.40 GHz with 4 GB RAM.
Before practical measurements of biological samples, a random phase plate (fabricated by the Shanghai Institute of Optics and Fine Mechanics, Chinese Academy of Sciences) was used to test the phase imaging accuracy of the smartphone based hand-held quantitative phase microscope. There are only two phase steps with an average height difference of ∼604 nm measured by atomic force microscopy (AFM). Taking the refractive index of the glass as 1.516 and with a red light LED as the illumination source with a central wavelength of 620 nm and full width at half maximum (FWHM) bandwidth of 17 nm, there is a phase step of ∼π. Fig. 3(A)–(C) list the over-, in- and under-focus intensities, respectively, captured by the smartphone based quantitative phase microscope. Using the TIE phase retrieval algorithm, the quantitative phase distribution can be calculated as shown in Fig. 3(D), in which two steps are obvious. Moreover, in order to quantitatively evaluate the phase difference from the retrieved phase distribution, Fig. 3(E) and (F) describe the phases along the respective lines shown in Fig. 3(D), indicating a phase difference of ∼π, which is in accordance with the results certificated by AFM shown in Fig. S5 in the ESI.† Moreover, the uncertainty in the defocus calibration was also considered here. As the uncertainty in the defocus calibration was 0.1 μm, while the defocus interval was ∼5.0 μm, there was ∼2% relative error in the intensity gradient according to eqn (1). With quantitative error analysis based on the numerical simulations in Fig. S6 in the ESI,† this shows that the error in the defocus interval calibration may lead to a 3.6% error increase in the phase retrieval, however, this is not much of a loss of accuracy. With both experiments and calculations, the proposed certification using the random phase plate clearly proves that the smartphone based hand-held quantitative phase microscope can realize high-accuracy phase imaging.
 | ||
| Fig. 3 Phase certification using a random phase plate. (A)–(C) Over-focus, in-focus and under-focus intensities captured by smartphone based quantitative phase microscope; (D) phase retrieved from (A)–(C) based on solving the Poisson equation; (E) and (F) phases along the red and blue lines, respectively. The black bar in (D) indicates 15 μm. | ||
Quantitative phase measurements of biological samples
After certification of the phase imaging accuracy, the smartphone based hand-held quantitative phase microscope was firstly adopted for measuring the phases of human red blood cells. The sample used was a commercial human red blood cell smear (Keda Biological Sample Company, China). Fig. 4(A)–(C) list the over-, in- and under-focus images captured by the smartphone camera using manual focusing. Note that the chosen region was located around the imaging center in order to avoid distortion at the edge of the field of view. The effective defocus distance in the sample plane was ∼5.0 μm as before. Furthermore, the central wavelength of the green light illumination was ∼520 nm with a FWHM of 22 nm. The quantitative phase distribution of the chosen field of view after solving the TIE is shown in Fig. 4(D). The retrieved cellular phases obviously indicate that the red blood cells behave as special biconcave structures. Moreover, the quantitative phase imaging not only improves the imaging contrast, but also provides tools for automatic sample recognition and quantitative analysis, as referred to in Fig. S7 in the ESI.† As an example, using automatic cellular recognition according to the retrieved phase distribution, Fig. 4(E) and (F) show a statistical analysis of the cellular roundness, area and volume. The roundness of these red blood cells is 0.9681 ± 0.0153, which is rather close to 1, indicating that most of them have circular configurations. The statistical cellular area is 46.10 ± 7.39 μm2, while the cellular area of a red blood cell model60 which draws from a large number of observations and measurements is 45.96 μm2. Furthermore, the red blood cells can be treated as homogeneous samples with a refractive index of 1.41, while for the human red blood cell smear, the environmental refractive index is around 1.42, matching paraffin wax, and thus the thicknesses of the cells can be computed as well as their volumes. With the measured phase, the average cellular volume is 84.81 ± 17.12 μm3, close to that of the red blood cell model,60 90.20 μm3.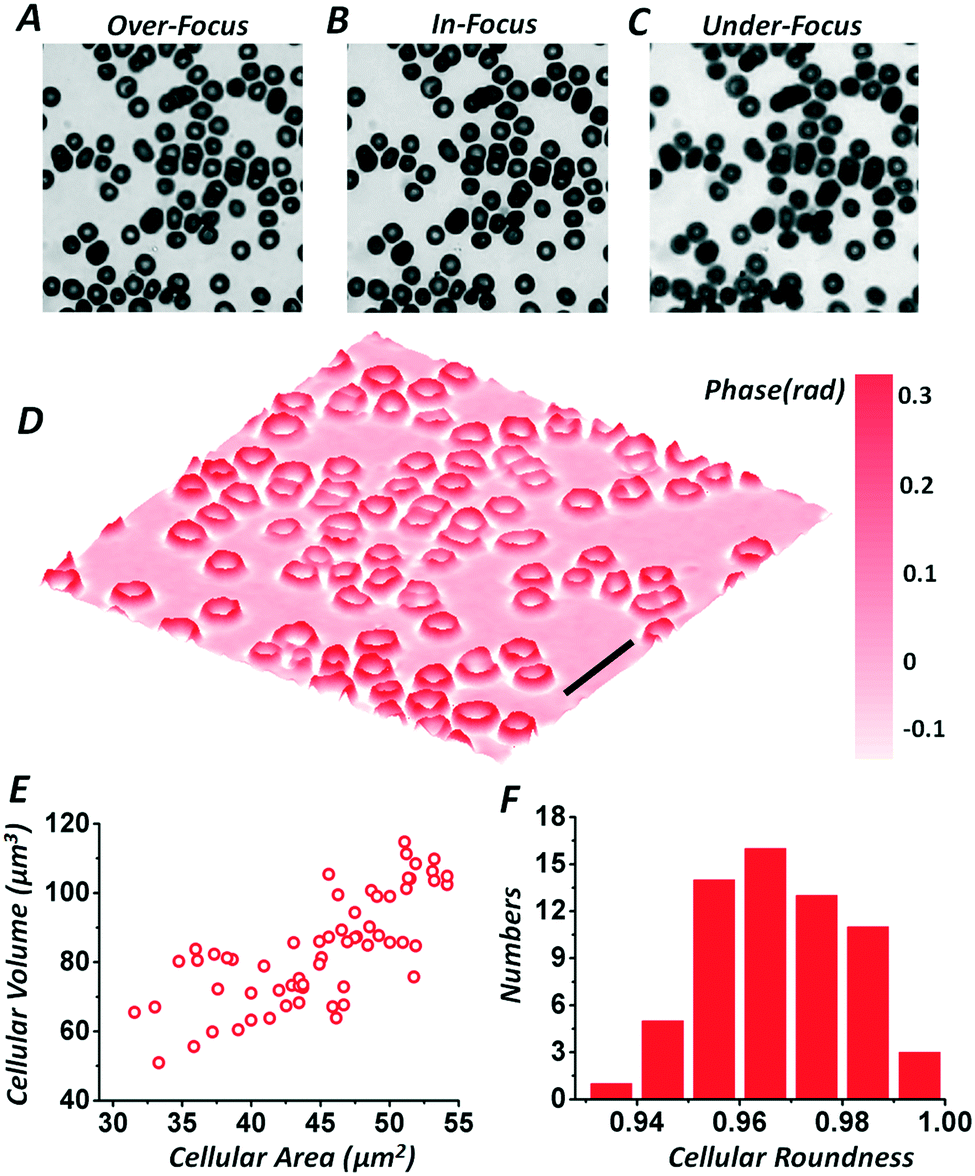 | ||
| Fig. 4 Quantitative phase imaging of red blood cells. (A)–(C) Over-focus, in-focus and under-focus intensities captured by the smartphone based quantitative phase microscope; (D) phase retrieved from (A)–(C) according to the TIE method; (E)–(F) statistical analyses of the cellular area, volume and roundness. The black bar in (D) indicates 20 μm. | ||
Besides simple samples such as red blood cells, the smartphone based hand-held quantitative phase microscope can also provide high-accuracy phase imaging for various other specimens. Fig. 5 shows the quantitative phase distributions of a Pap smear and monocot root and broad bean epidermis sections retrieved from multi-plane intensities recorded by this smartphone based microscope. Compared with direct imaging of the samples, the phase imaging not only improves the imaging contrast, but also provides another perspective for sample observations and measurements. Based on the practical measurements of different samples shown in Fig. 4 and 5, it is believed that the smartphone based hand-held quantitative phase microscope can realize both quantitative intensity and phase images, offering more sample details which can be potentially applied to remote healthcare and medical diagnosis.
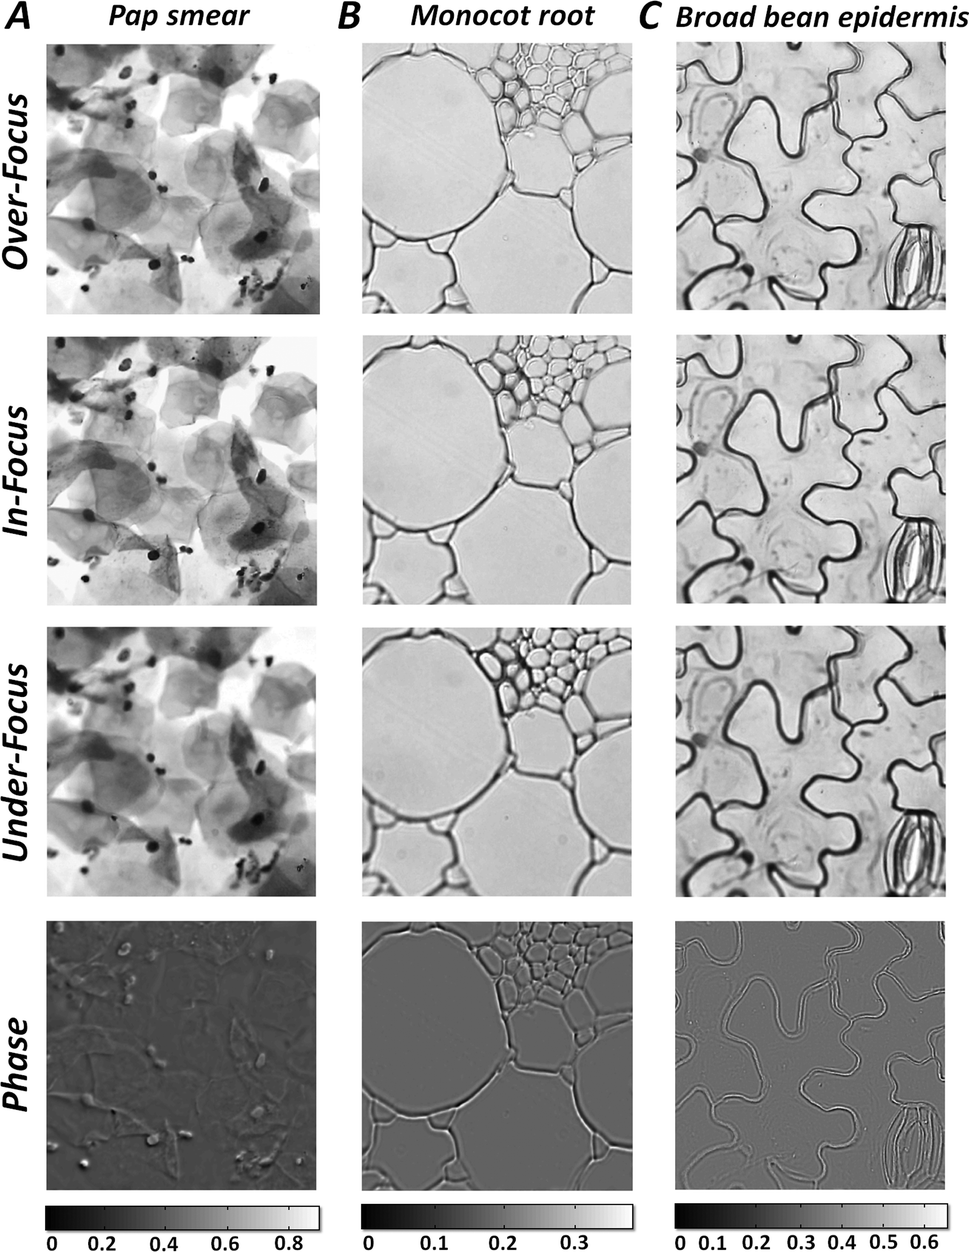 | ||
| Fig. 5 Both multi-focal images and retrieved phases of (A) a pap smear, (B) monocot root and (C) broad bean epidermis using the smartphone based hand-held quantitative phase microscope. | ||
Conclusions
In this paper, a smartphone based TIE phase microscope is proposed. With a 3-D printed shell, the microscope imaging system consisting of a light source, micro-objective, eyepiece and smartphone can be integrated into a hand-held device. The cost effective microscope can provide quantitative phase imaging of various samples from multi-focal intensities captured by the smartphone camera using manual focusing. As certificated by random phase plate testing, it is proved that the hand-held quantitative phase microscope can provide high-accuracy phase imaging. Moreover, by combining this with self-developed software including functions such as automatic cellular recognition and measurement, not only can quantitative phase images of various biological samples be measured, but also their configuration parameters can be statistically analyzed. It is believed that the proposed smartphone based hand-held quantitative phase microscope is a promising tool which can be adopted in the future in remote healthcare and medical diagnosis.Author contributions
S. W. and L. X. conceived the idea and supervised the project with C. L.; X. M. built the optical system, X. M., X. T., W. Y. and Y. K. did experiments and analyzed data; H. H. designed and fabricated the 3-D printed shell; K. Y., H. C. and L. X. developed both the Android app and computer based software. X. M., H. H., K. Y., L. X., C. L. and S. W. wrote and revised the manuscript. All the authors reviewed the manuscript.Acknowledgements
The work is supported by Natural Science Foundation of China (11404207), Natural Science Foundation of Jiangsu Province of China (BK2012548, BK20130162), Fundamental Research Funds for the Central Universities (JUSRP115A14) and Local Colleges and Universities Capacity Building Program (15110500900, 14110500900).Notes and references
- A. Ozcan, Lab Chip, 2014, 14, 3187–3197 RSC.
- J. C. Contreras-Naranjo, Q. Wei and A. Ozcan, IEEE J. Sel. Top. Quantum Electron., 2016, 22, 7100414 CrossRef.
- A. Skandarajah, C. D. Reber, N. A. Switz and D. A. Fletcher, PLoS One, 2014, 9, e96906 Search PubMed.
- D. N. Breslauer, R. N. Maamari, N. A. Switz, W. A. Lam and D. A. Fletcher, PLoS One, 2009, 4, e6320 Search PubMed.
- N. A. Switz, M. V. D'Ambrosio and D. A. Fletcher, PLoS One, 2014, 9, e95330 Search PubMed.
- R. K. D. Ephraim, E. Duah, J. S. Cybulski, M. Prakash, M. V. D'Ambrosio, D. A. Fletcher, J. Keiser, J. R. Andrews and I. I. Bogoch, Am. J. Trop. Med. Hyg., 2015, 92, 1253–1256 CrossRef PubMed.
- Z. J. Smith, K. Chu, A. R. Espenson, M. Rahimzadeh, A. Gryshuk, M. Molinaro, D. M. Dwyre, S. Lane, D. Matthews and S. Wachsmann-Hogiu, PLoS One, 2011, 6, e17150 CAS.
- I. I. Bogoch, J. R. Andrews, B. Speich, J. Utzinger, S. M. Ame, S. M. Ali and J. Keiser, Am. J. Trop. Med. Hyg., 2013, 88, 626–629 CrossRef PubMed.
- Y. L. Sung, J. Jeang, C. H. Lee and W. C. Shih, J. Biomed. Opt., 2015, 20, 047005 CrossRef PubMed.
- S. A. Lee and C. Yang, Lab Chip, 2014, 14, 3056–3063 RSC.
- H. Zhu, O. Yaglidere, T. W. Su, D. Tseng and A. Ozcan, Lab Chip, 2011, 11, 315–322 RSC.
- H. Zhu, I. Sencan, J. Wong, S. Dimitrov, D. Tseng, K. Nagashimaa and A. Ozcan, Lab Chip, 2013, 13, 1282–1288 RSC.
- Q. Wei, H. Qi, W. Luo, D. Tseng, S. J. Ki, Z. Wan, Z. Göröcs, L. A. Bentolila, T. T. Wu, R. Sun and A. Ozcan, ACS Nano, 2013, 7, 9147–9155 CrossRef CAS PubMed.
- Q. Wei, W. Luo, S. Chiang, T. Kappel, C. Mejia, D. Tseng, R. Y. L. Chan, E. Yan, H. Qi, F. Shabbir, H. Ozkan, S. Feng and A. Ozcan, ACS Nano, 2014, 8, 12725–12733 CrossRef CAS PubMed.
- H. Zhu, S. Mavandadi, A. F. Coskun, O. Yaglidere and A. Ozcan, Anal. Chem., 2011, 83, 6641–6647 CrossRef CAS PubMed.
- H. Zhu, U. Sikora and A. Ozcan, Analyst, 2012, 137, 2541–2544 RSC.
- H. C. Koydemir, Z. Gorocs, D. Tseng, B. Cortazar, S. Feng, R. Y. Chan, J. Burbano, E. McLeod and A. Ozcan, Lab Chip, 2015, 15, 1284–1293 RSC.
- A. Tapley, N. Switz, C. Reber, J. L. Davis, C. Miller, J. B. Matovu, W. Worodria, L. Huang, D. A. Fletcher and A. Cattamanchi, J. Clin. Microbiol., 2013, 51, 1774–1778 CrossRef PubMed.
- K. Ming, J. Kim, M. J. Biondi, A. Syed, K. Chen, A. Lam, M. Ostrowski, A. Rebbapragada, J. J. Feld and W. C. Chan, ACS Nano, 2015, 9, 3060–3074 CrossRef CAS PubMed.
- M. Mir, B. Bhaduri, R. Wang, R. Zhu and G. Popescu, Prog. Opt., 2012, 57, 133–217 Search PubMed.
- P. Memmolo, V. Bianco, F. Merola, L. Miccio, M. Paturzo and Z. Ferraro, IEEE Photonics J., 2014, 6, 0701106 Search PubMed.
- M. K. Kim, SPIE Rev., 2010, 1, 018005 Search PubMed.
- D. Roitshtain, N. A. Turko, B. Javidi and N. T. Shaked, Opt. Lett., 2016, 41, 2354–2357 Search PubMed.
- S. Cho, S. Kim, Y. Kim and Y. K. Park, Trends Biotechnol., 2012, 30, 71–79 CrossRef CAS PubMed.
- W. Choi, C. Fang-Yen, K. Badizadegan, S. Oh, N. Lue, R. R. Dasari and M. S. Feld, Nat. Methods, 2007, 4, 717–719 CrossRef CAS PubMed.
- I. Moon, F. Yi, Y. H. Lee, B. Javidi, D. Boss and P. Marquet, Opt. Express, 2013, 21, 30947–30957 CrossRef PubMed.
- V. Bianco, P. Memmolo, M. Paturzo, A. Finizio, B. Javidi and P. Ferraro, Light: Sci. Appl., 2016, 5, e16142 CrossRef CAS.
- G. C. Caprio, M. A. Ferrara, L. Miccio, F. Merola, P. Memmolo, P. Ferraro and G. Coppola, J. Biophotonics, 2014, 8, 779–789 CrossRef PubMed.
- V. Bianco, M. Paturzo, V. Marchesano, I. Gallotta, E. D. Schiavi and P. Ferraro, Lab Chip, 2015, 15, 2117–2124 RSC.
- G. Zheng, R. Horstmeyer and C. Yang, Nat. Photonics, 2013, 7, 739–745 CrossRef CAS PubMed.
- W. Yu, S. Wang, S. Veetil, S. Gao, C. Liu and J. Zhu, Phys. Rev. B, 2016, 93, 241105 CrossRef.
- Y. Jiang, J. Jiang and Y. Park, Opt. Express, 2012, 20, 9673–9681 CrossRef PubMed.
- N. T. Shaked, T. M. Newpher, M. D. Ehlers and A. Wax, Appl. Opt., 2010, 49, 2872–2878 CAS.
- S. O. Isikman, W. Bishara, H. Zhu and A. Ozcan, Appl. Phys. Lett., 2011, 98, 161109 Search PubMed.
- N. C. Pégard, M. L. Toth, M. Driscoll and J. W. Fleischer, Lab Chip, 2014, 14, 4447–4450 RSC.
- F. Merola, P. Memmolo, L. Miccio, R. Savoia, M. Mugnano, A. Fontana, G. D'Ippolito, A. Sardo, A. Iolascon, A. Gambale and P. Ferraro, Light: Sci. Appl., 2017, 6, e16241 Search PubMed.
- S. O. Isikman, I. Sencan, O. Mudanyali, W. Bishara, C. Oztoprak and A. Ozcan, Lab Chip, 2010, 10, 1109–1112 RSC.
- T. W. Su, A. Erlinger, D. Tseng and A. Ozcan, Anal. Chem., 2010, 82, 8307–8312 CrossRef CAS PubMed.
- A. Greenbaum, N. Akbari, A. Feizi, W. Luo and A. Ozcan, PLoS One, 2013, 8, e76475 CAS.
- M. Lee, O. Yaglidere and A. Ozcan, Biomed. Opt. Express, 2011, 2, 2721–2730 CrossRef PubMed.
- D. Tseng, O. Mudanyali, C. Oztoprak, S. O. Isikman, I. Sencan, O. Yaglidere and A. Ozcan, Lab Chip, 2010, 10, 1787–1792 RSC.
- Y. Zhang, Y. Wu, Y. Zhang and A. Ozcan, Sci. Rep., 2016, 6, 27811 CrossRef CAS PubMed.
- H. Im, C. M. Castro, H. Shao, M. Liong, J. Song, D. Pathania, L. Fexon, C. Min, M. Avila-Wallace, O. Zurkiya, J. Rho, B. Magaoay, R. H. Tambouret, M. Pivovarov, R. Weissleder and H. Lee, Proc. Natl. Acad. Sci. U. S. A., 2015, 112, 5613–5618 CrossRef CAS PubMed.
- H. Im, Y. I. Park, D. Pathania, C. M. Castro, R. Weissleder and H. Lee, Lab Chip, 2016, 16, 1340–1345 RSC.
- Y. Zhu, Z. Zhang and G. Barbastathis, Opt. Express, 2014, 22, 28966–28976 CrossRef PubMed.
- Y. Zhu, A. Shanker, L. Tian, L. Waller and G. Barbastathis, Opt. Express, 2014, 22, 26696–26711 CrossRef PubMed.
- L. Tian, J. C. Petruccelli and G. Barbastathis, Opt. Lett., 2012, 37, 4131–4133 CrossRef PubMed.
- L. Waller, Y. Luo, S. Y. Yang and G. Barbastathis, Opt. Lett., 2010, 35, 2961–2963 CrossRef PubMed.
- Z. Jingshan, J. Dauwels, M. Vazquez and L. Waller, Opt. Express, 2013, 21, 18125–18137 CrossRef PubMed.
- L. Tian, J. Petruccelli, Q. Miao, H. Kudrolli, V. Nagarkar and G. Barbastathis, Opt. Lett., 2013, 38, 3418–3421 Search PubMed.
- S. Kou, L. Waller, G. Barbastathis and C. Sheppard, Opt. Lett., 2010, 35, 447–449 Search PubMed.
- J. Liu, T. Xu, W. Yue, J. Sun and G. Situ, Opt. Express, 2015, 23, 29154–29162 Search PubMed.
- X. Tian, W. Yu, X. Meng, A. Sun, L. Xue, C. Liu and S. Wang, Opt. Lett., 2016, 41, 1427–1430 CrossRef PubMed.
- L. Waller, L. Tian and G. Barbastathis, Opt. Express, 2010, 18, 12552–12561 CrossRef PubMed.
- J. Zhong, R. Claus, J. Dauwels, L. Tian and L. Waller, Opt. Express, 2014, 22, 10661–10674 CrossRef PubMed.
- W. Yu, X. Tian, X. He, X. Song, L. Xue, C. Liu and S. Wang, Appl. Phys. Lett., 2016, 109, 071112 CrossRef.
- X. Tian, X. Meng, W. Yu, X. Song, L. Xue, C. Liu and S. Wang, J. Opt., 2016, 18, 15302 Search PubMed.
- P. Memmolo, M. Paturzo, B. Javidi, P. A. Netti and P. Ferraro, Opt. Lett., 2014, 39, 4719–4722 CrossRef PubMed.
- P. Memmolo, C. Distante, M. Paturzo, A. Finizio and B. Javidi, Opt. Lett., 2011, 36, 1945–1947 CrossRef CAS PubMed.
- S. V. Tsinopoulos and D. Polyzos, Appl. Opt., 1999, 38, 5499–5510 CrossRef CAS PubMed.
Footnotes |
| † Electronic supplementary information (ESI) available. See DOI: 10.1039/c6lc01321j |
| ‡ These authors contributed equally to this work. |
| This journal is © The Royal Society of Chemistry 2017 |