 Open Access Article
La–Ce isotope measurements by multicollector-ICPMS†
Christiane
Schnabel
 *abc,
Carsten
Münker
ab and
Erik
Strub
 cd
cd
aInstitut für Geologie und Mineralogie, Universität zu Köln, Zülpicherstr. 49b, 50674 Cologne, Germany. E-mail: cschnab2@uni-koeln.de
bSteinmann Institut, Poppelsdorfer Schloss, Meckenheimer Allee 169, 53115 Bonn, Germany
cAbteilung Nuklearchemie, Universität zu Köln, Zülpicherstr. 45, 50674 Cologne, Germany
dForschungszentrum Jülich GmbH, INM-5, 52425 Jülich, Germany
First published on 12th October 2017
Abstract
The 138La–138Ce decay system (half-life 1.02 × 10¹¹ years) is a potentially highly useful tool to unravel information about the timing of geological processes and about the interaction of geological reservoirs on earth, complementing information from the more popular 147Sm–143Nd and 176Lu–176Hf isotope systems. Previously published analytical protocols were limited to TIMS. Here we present for the first time an analytical protocol that employs MC-ICPMS, with an improved precision and sensitivity. To perform sufficiently accurate La–Ce measurements, an efficient ion-chromatographic procedure is required to separate Ce from the other rare earth elements (REE) and Ba quantitatively. This study presents an improved ion-chromatographic procedure that separates La and Ce from rock samples using a three-step column separation. After REE separation by cation exchange, Ce is separated employing an Ln Spec column and selective oxidation. In the last step, a cation clean-up chemistry is performed to remove all remaining interferences. Our MC-ICPMS measurement protocol includes all stable Ce isotopes (136Ce, 138Ce, 140Ce and 142Ce), by employing a 1010 ohm amplifier for the most abundant isotope 140Ce. An external reproducibility of ±0.25ε-units (2 r.s.d) has been routinely achieved for 138Ce measurements for as little as 150–600 ng Ce, depending on the sample–skimmer cone combinations being used. Because the traditionally used JMC-304 Ce reference material is not commercially available anymore, a new reference material was prepared from AMES laboratory Ce metal (Cologne-AMES). In order to compare the new material with the previously reported isotopic composition of AMES material prepared at Mainz (Mainz-AMES), Cologne-AMES and JMC-304 were measured relative to each other in the same analytical session, demonstrating isotope heterogeneity between the two AMES and different JMC-304 batches used in the literature. To enable sufficiently precise age correction of radiogenic 138Ce and to perform isochron dating, a protocol was developed where La and Ce concentrations are determined by isotope dilution (ID), using an isotope tracer enriched in 138La and 142Ce. The new protocols were applied to determine the variations of Ce isotope compositions and La–Ce concentrations of certified geochemical reference materials (CRMs): BCR-2, BCR-1, BHVO-2, JR-1, JA-2, JB-3, JG-1, JR-1, JB-1b, AGV-1 and one in-house La Palma standard.
1 Introduction
The nuclide 138La (relative abundance 0.089%) decays by branched decay to both 138Ce (0.25%) and 138Ba (71.66%) with a long half-life (1.02 × 10¹¹ years1) by β− decay and electron capture (EC), respectively (Fig. 1).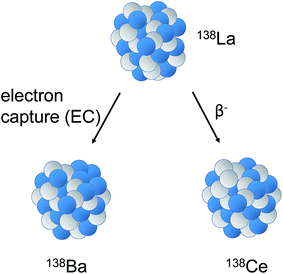 | ||
| Fig. 1 Sketch illustrating decay of 138La to stable 138Ba (electron capture (EC), 65.5%) and 138Ce (β− decay, 34.4%, t1/2 = 1.02 × 10¹¹ years). | ||
Due to a different behavior of La and Ce during geological processes, the 138La–138Ce isotope system can provide viable geological information, especially when coupled with other radiogenic isotope systems like 147Sm–143Nd and 176Lu–176Hf. So far, previously published analytical protocols for the 138La–138Ce decay system focused on thermal ionisation mass spectrometry (TIMS).2–5
Pioneering studies on the 138La–138Ce geochronometer in the 1980's focused on age determinations.4 Since this first geochemical application, the 138La–138Ce isotope system has also been used as a geochemical tracer.6–16 In the past, Ce isotope measurements have shown to be very challenging because of the isobaric interference from 138Ba (relative abundance 71.7%) on 138Ce (0.251%) and of 142Nd (27.2%) on 142Ce (11.114%). A further challenge is the simultaneous measurement of all Ce isotopes due to the extremely high abundance of 140Ce (88.450%) relative to the much smaller 136Ce (0.185%) and radiogenic 138Ce (0.251%).17
Interfering elements such as Ba and Nd can be separated from Ce by cation-exchange chromatography. The first routine protocol for Ce separation was introduced by Tanaka and Masuda using α-hydroxy-isobutyric acid (α-HIBA) and a AG50W-X8 resin columns.4 Similar procedures based on this separation scheme have been further developed for rock samples.6,18–21 The separation of Ce from other REE using an oxidative extraction technique was first proposed by Rehkämper et al.22 Tazoe et al.23 proposed the separation of Ce using oxidative extraction technique with chelating resin (Ln Spec). Ohno and Hirata24 used a combination of a TRU Spec resin column and a Ln Spec column to separate Ce.
Previous isotope measurements of Ce in geological material have been performed using TIMS or MC-ICP-MS.2–5,24 In all of these studies, only the isotopes 136Ce, 138Ce and 142Ce were measured, with two exceptions where 140Ce was also measured.9,10 In most previous studies, 138Ce abundances were reported as 138Ce/142Ce.3,5,14,25,26 As reference material, JMC-304 Ce has been predominantly used as a synthetic standard, and BCR-1 as a natural geological standard.19,20,27,28 In few studies, no measurements of reference materials were explicitly reported, making direct comparisons of reported Ce isotope values for geological samples difficult.10,11,29 In more recent studies, AMES Ce metal prepared at MPI Mainz was introduced (below referred to as Mainz AMES) and proposed as a reference standard material, as the original stock of JMC-304 is not commercially available anymore.2,3,21 A direct comparison of Ce isotope data from different studies is therefore not straightforward and there is an urgent need for a validated and widely available reference material.
Precise and accurate concentration measurements of La and Ce are required for age correction of measured Ce isotope values and for isochron dating. However, sufficiently precise measurements by employing isotope dilution have rarely been performed.6,15,19,27 The goal of this work is the development of an analytical protocol for sufficiently precise and accurate Ce isotope and La–Ce concentration measurements for geological samples using MC-ICPMS. Two new synthetic reference standards (Cologne-AMES and JMC-304 batch number: 15952) were prepared and calibrated against the Mainz-AMES standard used in previous studies. Additionally, for concentration measurements, a 138La–142Ce spike was prepared and calibrated. The new protocol has been validated by performing combined Ce isotope and La–Ce concentration measurements by isotope dilution on a variety of geological reference materials.
2 Analytical protocols
Reagents and sample digestion procedures
For comparison with previous studies, a new JMC-304 solution was prepared from an own batch of JMC 304 Ce-oxide (batch number: 15952). In 2007, Willbold prepared a new reference material from Ce-AMES metal (Mainz-AMES).2 In addition to this reference material, a new solution was also prepared from Ce-AMES metal during the course of this study (below referred to as Cologne-AMES), expecting that both synthetic Ce-AMES standards are isotopically indistinguishable. These 3 different standards (Mainz-AMES, Cologne-AMES and Cologne-JMC-304) were all used as reference solutions for Ce-IC and Ce-ID measurements in our study and were also calibrated relative to each other in terms of their Ce isotope composition. Additionally, a diluted La-Alfa Aesar™ standard solution and a La solution prepared from AMES metal were used as reference materials for La-ID measurements.Concentrated HF (24 M), HCl (12 M) and HNO3 (14 M) were single-distilled to minimize acid blanks which were monitored before each batch of samples. Reagent grade H2O2 (30%) and KBrO3 (purity ≥ 99.8%) were used. The total Ce chemistry blanks for isotope measurements ranged from 286 pg to 567 pg and can be neglected. Depending on the Ce concentrations, 70–240 mg of sample were used for measurements. The reference materials BHVO-2, BCR-2, JG-1, BCR-1, JB-3 and BIR-1 provided by USGS and GSJ and an in house standard (La Palma basalt LP-1) were analyzed during the course of this study. These samples were digested in a 1![[thin space (1/6-em)]](https://www.rsc.org/images/entities/char_2009.gif) :
:![[thin space (1/6-em)]](https://www.rsc.org/images/entities/char_2009.gif) 1 mixture of HF (24 N) and HNO3 (14 N) at 120 °C in Savillex® beakers on a hotplate. The standards AGV-1, JR-1, JB-1b and JA-2 also provided by USGS and GSJ were digested in a 1
1 mixture of HF (24 N) and HNO3 (14 N) at 120 °C in Savillex® beakers on a hotplate. The standards AGV-1, JR-1, JB-1b and JA-2 also provided by USGS and GSJ were digested in a 1![[thin space (1/6-em)]](https://www.rsc.org/images/entities/char_2009.gif) :
:![[thin space (1/6-em)]](https://www.rsc.org/images/entities/char_2009.gif) 1 mixture of HF (24 N) and HNO3 (14 N) at 180 °C in Parr® bombs to ensure complete dissolution of refractory minerals. After both digestion steps, 1 mL of HClO4 was added to prevent precipitation of La/Ce-bearing fluorides. Following this step, the samples were dried down, re-dissolved once in 2 mL HNO3 (14 N), and evaporated to dryness on the hotplate again. Complete dissolution was ensured by dissolving in 6 N HCl solution overnight. After digestion, each sample solution was split into two aliquots. One aliquot, typically ca. 90% of the aliquot, was used for Ce isotope measurements (IC cut) while the remaining 10% aliquot (ID cut) was spiked with a mixed La–Ce isotope tracer prepared during the course of this study (see below). The spiked ID cut was put on the hotplate for at least 12 hours to ensure full sample–spike equilibrium. Both cuts were dried down and each was taken up in 1 mL 1 N HCl/(0.1 N HF) prior to ion exchange chemistry.
1 mixture of HF (24 N) and HNO3 (14 N) at 180 °C in Parr® bombs to ensure complete dissolution of refractory minerals. After both digestion steps, 1 mL of HClO4 was added to prevent precipitation of La/Ce-bearing fluorides. Following this step, the samples were dried down, re-dissolved once in 2 mL HNO3 (14 N), and evaporated to dryness on the hotplate again. Complete dissolution was ensured by dissolving in 6 N HCl solution overnight. After digestion, each sample solution was split into two aliquots. One aliquot, typically ca. 90% of the aliquot, was used for Ce isotope measurements (IC cut) while the remaining 10% aliquot (ID cut) was spiked with a mixed La–Ce isotope tracer prepared during the course of this study (see below). The spiked ID cut was put on the hotplate for at least 12 hours to ensure full sample–spike equilibrium. Both cuts were dried down and each was taken up in 1 mL 1 N HCl/(0.1 N HF) prior to ion exchange chemistry.
Chemical separation procedures for cerium isotope measurements (Ce-IC) and La–Ce concentration measurements (La–Ce-ID)
The ion chromatographic procedure for Ce separation consists of three steps (Table 1). In the first step (modified from Patchett and Tatsumoto30), the REE fraction was separated from the bulk matrix using 5 mL cation resin (height = 23.5 cm, internal diameter = 8 mm, BIORAD® AG-50W-X8, 200–400 mesh, hydrogen form). The column was preconditioned in 2 resin volumes (rv) 1 N HCl (optional 1 N HCl/0.1 N HF). The centrifuged sample was loaded in 1 mL 1 N HCl/(0.1 N HF). After loading, the matrix was eluted with 2.8 rv 1 N HCl/(0.1 N HF). Strontium and Ba were eluted with 10 rv 2.5 N HCl and 4 rv 3 N HNO3, respectively. Finally, the REEs were eluted with 7 rv 6 N HCl (Fig. 2).| 1 | BIORAD AG-50W-X8 | |
|---|---|---|
| (Resin volume: 5 mL) | ||
| Step | Resin volumes (rv) | Acid |
| Precondition | 2 rv | 1 N HCl/(0.1 N HF) |
| Load sample | 0.2 rv | 1 N HCl/(0.1 N HF) |
| Rinse matrix | 2.8 rv | 1 N HCl/(0.1 N HF) |
| Sr | 10 rv | 2.5 N HCl |
| Ba | 4 rv | 3 N HNO3 |
| REE | 7 rv | 6 N HCl |
| Cleaning | 10 rv | 6 N HCl |
| 10 rv | 3 N HNO3 | |
| 2 | LN-SPEC® | |
|---|---|---|
| (Resin volume: 0.5 mL) | ||
| Step | Resin volumes (rv) | Acid |
| Cleaning | 12 rv | 10 N HNO3 |
| Precondition | 12 rv | 10 N HNO3/20 mM KBrO3 |
| Eluting REE3+ | 16 rv | 10 N HNO3/20 mM KBrO3 |
| Washout | 4 rv | 10 N HNO3 |
| Washout | 4 rv | Milli Q |
| Eluting Ce3+ | 10 rv | 6 N HCl/1% H2O2 |
| 3 | BIORAD AG-50W-X8 | Step | BIORAD AG-50W-X8 | |||
|---|---|---|---|---|---|---|
| (Resin volume: 2 mL) | (Resin volume: 2 mL resin) | |||||
| Step | Resin volumes (rv) | Acid | Resin volumes (rv) | Acid | ||
| Precondition | 5 rv | 3 N HNO3 | Precondition | 5 rv | 3 N HNO3 | |
| Load sample | 0.25 rv | 3 N HNO3 | Load sample | 0.25 rv | 3 N HNO3 | |
| Eluting Ba, K | 3.25 rv | 3 N HNO3 | Eluting Ba,K | 3.25 rv | 3 N HNO3 | |
| Washout | 3 rv | 6 N HCl | Eluting Ce | 7.5 rv | 6 N HCl | |
| Eluting La | 7.5 rv | 6 N HCl | Cleaning | 10 rv | 6 N HCl | |
| Cleaning | 10 rv | 6 N HCl | 10 rv | 3 N HNO3 | ||
| 10 rv | 3 N HNO3 | |||||
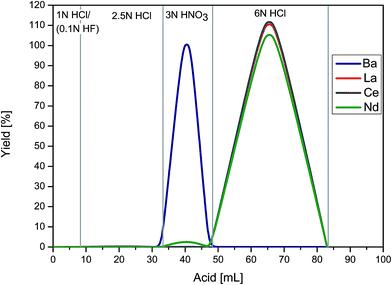 | ||
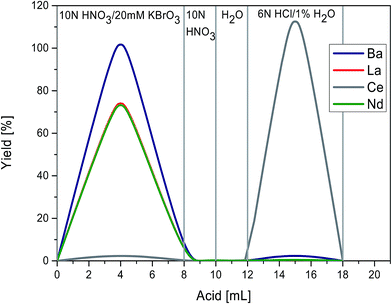
| Fig. 2 Elution scheme illustrating separation of the REEs from the matrix using cation resin in stage 1. | ||
The second step is based on protocols in Tazoe et al.23 and Hirahara et al.31 The extracted REE fraction was dissolved in 10 N HNO3/20 mM KBrO3 and loaded onto a 0.5 mL Ln Spec® resin column (height = 8.5 cm, internal diameter = 5 mm). In this step, Ce3+ is oxidized to Ce4+, while all other REE remain in trivalent state. For cleaning, the column was rinsed two times with 4 rv 10 N HNO3 and conditioned three times with 4 rv 10 N HNO3/20 mM KBrO3. Trivalent REE were subsequently eluted with 16 rv 10 N HNO3/20 mM KBrO3 and Ce was eluted as Ce3+ after reduction with 6 N HCl/1% H2O2 (Fig. 3). The yields of Ce were generally very high, with more than 95%. The collected Ce fraction was dried down and re-dissolved two times in 250 μL 14 N HNO3 with 10 μL H2O2 and subsequently taken up in 0.5 mL 3 N HNO3 for clean-up chemistry.
In the third step, a clean-up of the Ce was performed to remove remaining Ba and K. This separation step is based on the last 2 steps of the first stage chemistry employing cation resin. The dissolved Ce cut was loaded onto a 2 mL AG50-X8 column (height = 17 cm, internal diameter = 7 mm) and Ba and K were eluted with 3 rv 3 N HNO3. Ce was stripped with 7.5 rv mL 6 N HCl. The yield of this 3 step column calibration was better than 80%.
In contrast to hitherto published ion-chromatographic procedures, the technique presented here is rapid, because the resin volumes could be reduced and pH-dependent α-HIBA is not used anymore.3 In addition, this technique could be used for samples sizes up to 250 mg (ref. 31) and an efficient clean-up chemistry was developed to remove all remaining impurities. Otherwise, no accurate measurement by MC-ICPMS is possible.
For La- and Ce-ID measurements, the same ion exchange procedure as described above was used, except for collecting the complete REE3+ fraction in the 2nd column stage and a small modification in the clean-up chemistry. During the clean-up chemistry, the first 3 rv 6 N HCl in the stripping step were discarded and only the following 7.5 rv 6 N HCl were collected because only then all of the La is eluted from the column.
Preparation of a mixed La–Ce isotope tracer
In order to accurately calibrate the mixed La–Ce tracer solution, gravimetric dilution was performed by using a Mettler Toledo analytical balance to prepare one mixed standard solution from concentrated stock solutions of each element, using 99.996% pure La and 99.996% pure Ce metal ingots provided by AMES laboratory as starting material. The metals were first dissolved in 14 N HNO3 and then ultimately diluted to a 1.4 N HNO3 solution. The element concentrations of the La–Ce normal are known to within 0.1% including all propagated errors (characterization was performed using MC-ICPMS). A mixed isotope tracer was prepared using two individual concentrated solutions of isotopically enriched 138La and 142Ce, respectively. To prepare these concentrated solutions, ca. 0.87 mg of 138La2O3 powder (138La enrichment 7%, Oak Ridge National Laboratory, USA) and ca. 47 mg of 142CeO2 powder (142Ce enrichment 95.1%, Campro Scientific, Germany) were each dissolved in 14 N HNO3. Prior to mixing, the purity of both tracer solutions was verified by MC-ICPMS through the measurement of potentially interfering isobars. The 138La isotope trace solution was checked for the masses 136, 137, 140, 142 and 144 and the 142Ce isotope trace solution was checked for the masses 137, 139 and 144.The isotope tracer was calibrated using variable mixtures of tracer and normal solutions. For the separation of La and Ce fractions from these mixtures, two different separation procedures were used. In the first calibration run, a 2.5 mL Ln Spec column (height = 25 cm, internal diameter = 3.2 mm) was preconditioned in 7.5 rv 0.15 N HCl. The spike/normal mixtures were loaded onto a 2.5 mL Ln Spec column in 0.5 mL 0.15 N HCl, and La was eluted in 7.5 rv 0.15 N HCl. Cerium was eluted with 17.5 rv 6 N HCl (Table 2 and Fig. 4). This method was also tested for the Ce separation of rock samples but for two reasons the method is not used anymore. First, a substantial fraction of Pr was collected together with Ce. Saji et al.32 have pointed out that the molecular interference of 141PrH affects the mass 142Nd during MC-ICPMS measurements. Secondly, the yield of this method varies between different sample matrices, possibly due to non-reproducible redox conditions on the column (Ce3+/Ce4+).
| Step | Ln SPEC | |
|---|---|---|
| (Resin volume: 2.5 mL) | ||
| Resin volumes | Acid | |
| Precondition | 7.5 rv | 0.15 N HCl |
| Load sample | 0.2 rv | 0.15 N HCl |
| La | 7.5 rv | 0.15 N HCl |
| REE | 17.5 rv | 6 N HCl |
| Cleaning | 20 rv | 6 N HCl |
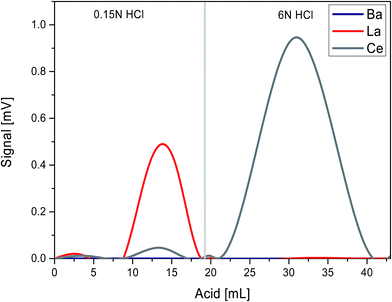 | ||
| Fig. 4 Elution scheme illustrating separation of La and Ce from REEs using a long Ln Spec column (see also Table 2). | ||
The second calibration run was performed employing steps 2–3 of the standard procedure described above (Table 1).
In order to determine the isotope compositions and the concentrations of each element in the mixed La–Ce tracer, 9 different mixtures of the spike and diluted AMES metal solution (La–Ce normal I) were prepared and analyzed after chemical separation. The mass fraction of Ce and La in the mixed spike La–Ce mix I are 922.6 ± 0.2 ng g−1 Ce (2 r.s.d) and 126.1 ± 1.1 ng g−1 La (2 r.s.d), respectively. The La/Ce ratio was calculated as 0.1370 ± 0.00004 (2 r.s.d, corresponding to ±0.22%), where errors denote the external reproducibility obtained by the different mixtures. Details and abundances of minor isotopes in the mixed isotope tracer are given in Table 3.
| Isotope | 138La [μmol g−1] [2 r.s.d] | 142Ce [μmol g−1] [2 r.s.d] | 138La/139La [2 s.e.] | 136Ce/142Ce [2 s.e.] | 138Ce/142Ce [2 s.e.] | 140Ce/142Ce [2 s.e.] |
|---|---|---|---|---|---|---|
| 7.128 × 10⁻⁵ ± 0.16% | 6.183 × 10⁻³ ± 0.12% | 0.08507 ± 0.12% | 0.0000600 ± 0.92% | 0.000100 ± 1.42% | 0.05200 ± 0.01% |
La–Ce measurements by MC-ICP-MS
| Cup | L4 | L3 | L2 | L1 | C | H1 | H2 | H3 | H4 |
|---|---|---|---|---|---|---|---|---|---|
| Measured isotopes | 134Xe | 135Ba | 136Ce | 137Ba | 138Ce | 139La | 140Ce | 142Ce | 144Nd |
| Amplifier | 1012 | 1011 | 1011 | 1012 | 1011 | 1011 | 1010 | 1011 | 1011 |
| Interferences | 136Xe, 136Ba | 138Ba, 138La | 142Nd |
Each analysis consisted of 60 cycles (2 blocks of 30 cycles with 8.389 s integration time), resulting in ca. 10 minutes of data collection. All Ce isotopes (136, 138, 140 and 142) were measured in static mode. During the different measurement sessions, the 140Ce ion beam intensity was kept at 250–280 V for both standards and samples. Measured Ce isotope ratios were normalized to both 136Ce/140Ce 0.002124072 (ref. 18 and 33) and 136Ce/142Ce of 0.01688 (ref. 33) to correct for mass bias using the exponential law. The accuracy of measured Ce isotopes ratios is affected by the isobars 136Xe, 136Ba, 138Ba, 138La, and 142Nd. To correct the 142Ce signal, the measured signal on mass 144 was monitored, using a 142Nd/144Nd ratio of 1.141870 (ref. 34) that was artificially fractionated using the measured 136Ce/140Ce mass bias and then subtracted from the 142Ce signal. Likewise, the 138Ce signal was corrected for 138Ba and 138La using the measured masses 137 and 139 and artificially fractionated Ba and La isotope abundances ratios of 138Ba/137Ba = 6.383458 (ref. 17) and 138La/139La = 0.000902414.33 The 136Ce signal was corrected using the measured masses 134Xa and 137Ba and artificially fractionated Xe and Ba isotope abundance ratios of 136Xe/134Xe = 0.848750 (ref. 17) and 136Ba/137Ba = 0.699163105,17 respectively.
The external reproducibility achieved for 138Ce measurements, as determined by multiple analyses of JMC-304, was significantly better, once 136Ce/140Ce was used for mass bias correction (±25 ppm) rather than 136Ce/142Ce (±40 ppm, all 2 r.s.d). Samples were measured using the standard-sample bracketing approach with our in house JMC-304 solution as standard. In recent studies, Mainz-AMES has been used as reference standard but the amounts of Mainz-AMES available were insufficient to perform larger amounts of measurements.2,3,21 Therefore, the Mainz-AMES and Cologne-AMES standards were measured relative to our in house JMC-304 solution ca. 3 times before and after the standard-sample bracketing sequence. The daily mean value of the JMC-304 standard were used to calculate ε138Ce (eqn (1))
| ε138CeJMC 304 = [(138Ce/136Ce)sample/(138Ce/136Ce)JMC 304 − 1] × 104 | (1) |
Details for re-calculating ε138Ce from ε138CeJMC 304 relative to Cologne-AMES, Mainz-AMES and CHUR can be found below.
The effects of interfering Ba, La and Nd on the accuracy of measured Ce isotope ratios measurements were evaluated using a ca. 600 ppb JMC-304 Ce standard solution doped with each interfering element at different concentrations (ESI Table 2† and Fig. 5). The accuracy of measured ε138Ce values is compromised at 137Ba/140Ce higher than ca. 4 × 10⁻⁶, 139La/140Ce higher than 2 × 10⁻², and the accuracy of measured ε142Ce values is affected at 144Nd/140Ce higher than 2.5 × 10⁻⁴.
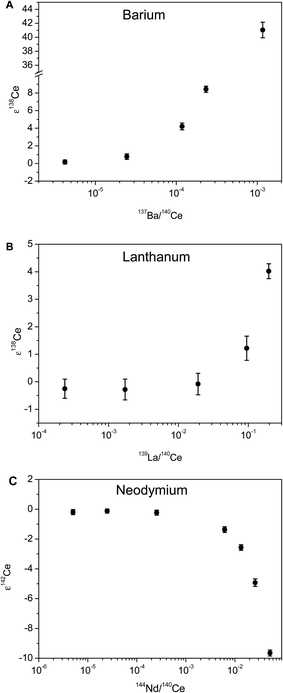 | ||
| Fig. 5 Measured ε138Ce values and ε142Ce value plotted against measured ratios of (A) 137Ba/140Ce (B) 139La/140Ce (C) 144Nd/140Ce. | ||
Given the typical abundance sensitivity of MC-ICPMS instruments (during the course of measurements ca. 2 ppm), a tailing correction may be required for isotopes on the low mass side of 140Ce with a relative abundance by a factor of ca. 100 higher than those of 138Ce and 136Ce. In contrast to TIMS measurements, where the instrumental back end vacuum may vary during the course of a single measurement, vacuum conditions during MC-ICPMS measurements are more stable, as the system is operated in steady state.3 Consequently, tail measurements were only made at the beginning and at the end of each analytical session using the JMC 304 standard with the cup configuration shown in Table 5. The integration time was 8.389 seconds with a total number of 30 integrations. Although both tail measurements typically are consistent within the uncertainty, sample standard bracketing was always applied in order to monitor putative short term variations in instrumental vacuum condition. The tail correction was made offline after the measurement using an algorithm fit (eqn (2)) through the individual half mass data points to obtain the best-fit parameters a(1), a(2), and a(3).2,35
 | (2) |
| Cup | L4 | L3 | L2 | L1 | C | H1 | H2 | H3 | H4 |
|---|---|---|---|---|---|---|---|---|---|
| Measured mass | 135.5 | 137.5 | 138.5 | 139.5 | 140.5 | 142.5 | 144.5 | ||
| Amplifier | 1011 | 1012 | 1011 | 1011 | 1010 | 1011 | 1011 |
Typical values were a(1) = 1 × 10⁻¹⁵ to 1 × 10⁻¹⁰, a(3) = 0.3–0.2 and a(4) = 1 × 10⁻⁵ to 1 × 10⁻⁶. The tailing ratio 138Ce/140Ce was then calculated by dividing I(m) by the 140Ce intensity. Throughout the course of our measurements peak tailing varied between 1 × 10⁻⁷ and 1 × 10⁻⁸, which is regarded as negligible, as it only would cause shifts in the measured 138Ce abundances between 0.001 ε-units and 0.0001 ε-units.
| Cup | L4 | L3 | L2 | L1 | C | H1 | H2 | H3 | H4 |
|---|---|---|---|---|---|---|---|---|---|
| Isotope | 136Ce | 137Ba | 138La(Ce) | 139La | 140Ce | 142Ce | 144Nd | 146Nd | 147Sm |
| Amplifier | 1012 | 1011 | 1011 | 1012 | 1011 | 1011 | 1011 | 1011 | 1011 |
| Interference | 136Xe, 136Ba | 138Ce(La), 138Ba | 142Nd |
3 Cerium isotope compositions of synthetic reference materials and rock standards
Synthetic reference materials (JMC-304, cologne and Mainz-AMES batches)
In this study, three different Ce reference materials were used to evaluate analytical precision, reproducibility and accuracy of the Ce measurements by MC-ICPMS. The three solutions are (i) Johnson Matthey reference material JMC-304 (batch 15952), (ii) AMES metal solution distributed by M. Willbold (Mainz-AMES) and (iii) AMES metal solution prepared at Cologne (Cologne-AMES). As already described above, two highly concentrated (1000 ppm) stock solutions of Ce have been prepared by dissolving 1 g high-purity CeO2 powder (JMC-304 (batch 15952)) and 1 g of AMES Laboratory Ce metal (Cologne-AMES) in 14 N HNO3. Splits of these solutions were diluted in 0.1 N HNO3 to running solutions with typical concentrations of 450 ppb.Results of repeated measurements in one analytical session are shown as example in Fig. 6. The mean values for ε138Ce relative to JMC-304 for this session are −0.03 ± 0.12 (2 r.s.d) for JMC-304, +0.73 ± 0.11 for Cologne-AMES and +2.44 ± 0.14 for AMES. Fig. 6 shows also clearly discernable ε138Ce compositions of the three standards, indicating that Cologne-AMES and Mainz-AMES are isotopically heterogeneous.
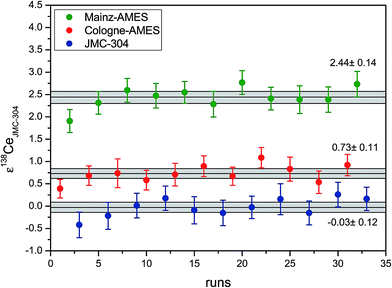 | ||
| Fig. 6 Comparison of 138Ce compositions of (i) JMC 304 reference material, (ii) Cologne-AMES and (iii) Mainz-AMES for a single analytical session (March 2015). All values are given relative to JMC-304. The ε138Ce value is calculated as 138Ce/136Ce, normalized to 136Ce/140Ce using a 136Ce/140Ce of 0.002124072 (ref. 18 and 33) and the exponential law. The weighted means of ε138Ce are −0.03 ± 0.12 for JMC-304, +0.73 ± 0.11 for Cologne-AMES and +2.44 ± 0.14 for Mainz-AMES (all 2 r.s.d). | ||
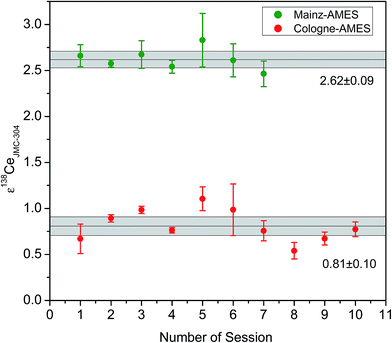
Results of long term measurements for the standards Cologne-AMES and Mainz-AMES are shown in ESI Table 3† and Fig. 7. The means for ε138Ce relative to the JMC-304 are +0.83 ± 0.10 for Cologne-AMES and +2.61 ± 0.09 for Mainz-AMES, respectively. The results are in a good agreement with the results of the single analytical session illustrated in Fig. 6.
The hitherto published 138Ce isotope values for the JMC-304 standard display a large scatter even after adjusting for the different mass fractionation procedures being applied.3 A probable source of these differences is the use of different JMC-304 batches that appear to be isotopically heterogeneous. Therefore, any direct data comparison with older studies is difficult because the individual JMC-304 batches used in the different studies have not always been specified. Comparison of data obtained using two different JMC-304 batches relative to Mainz-AMES (this study and Bellot et al.3) confirm that the two JMC-304 batches used are compositionally different. Whereas the ε138Ce value for the JMC-304 batch relative to Mainz-AMES in Bellot et al.3 is given as −1.15 ± 0.38 (2 r.s.d), the ε138Ce value for the JMC-304 batch used in this study relative to Mainz-AMES is −2.46 ± 0.28 (2 r.s.d). Both values are outside analytical uncertainty, confirming that the two JMC-304 batches are clearly isotopically distinguishable.
ESI Table 4† and Fig. 8 shows the results of absolute 138Ce/136Ce ratio measurements for the Mainz-AMES standard that has previously been characterized.2 As mentioned above, the tailing effects in this study were negligible and no offline tailing correction was applied. A ratio of 136Ce/140Ce of 0.002124072 (ref. 18 and 33) was initially used in our study to correct the mass bias (blue dots in Fig. 8), because the external reproducibility is significantly better. To compare our measured 138Ce/136Ce ratios with those obtained in recent TIMS studies (Willbold,2 Doucelance et al.21 and Bellot et al.3), the measured 138Ce/136Ce ratios were also normalized to 136Ce/142Ce of 0.01688 (ref. 33) and these data are additionally shown in ESI Table 4† and Fig. 8 (red dots). Importantly, Doucelance et al.21 and Bellot et al.3 both used this 136Ce/142Ce ratio for normalization.
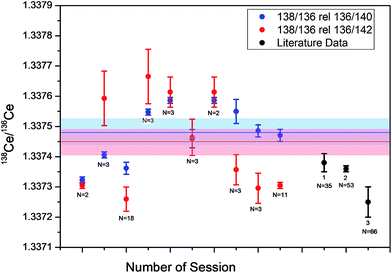 | ||
| Fig. 8 Absolute 138Ce/136Ce composition (error bars 2 r.s.d.) obtained for the Mainz AMES standard for 10 different analytical sessions (red/blue dots). The black dots are literature data: (1) Willbold,2 (2) Doucelance et al.,21 (3) Bellot et al.3 | ||
The average absolute 138Ce/136Ce normalized to 136Ce/142Ce were 1.33738 ± 0.00001 in Willbold,2 1.33736 ± 0.00001 in Doucelance et al.21 1.33725 ± 0.00005 in Bellot et al.3 and 1.33745 ± 0.00004 in this study (10 individual sessions). The absolute 138Ce/136Ce normalized to 136Ce/140Ce obtained in this study was 1.33748 ± 0.00003. Both values agree within error, but a tentative systematic difference of +0.52ε-units for 138Ce/136Ce normalized to 136Ce/142Ce compare to Willbold2 and the larger scatter in our study can be explained through non-ideal mass bias correction and cup efficiency. Importantly, the external reproducibility of our analytical protocol within an individual session is significantly better (±0.25 ε-units), because run parameters are not changed and measured sample values are always referenced to the standards measured in the individual session.
Recalculation relative to the chondritic uniform reservoir (CHUR) value
By direct measurements of meteorite samples, Makishima et al.18 and Makishima and Masuda27 defined the average chondritic uniform reservoir (CHUR) value by an 138Ce/142Ce value of 0.0225652 ± 0.0000024 which is in a good agreement with the 138Ce/142Ce value of 0.0225654 ± 0.0000007 obtained for two chondrites:3 both studies used the same 136Ce/138Ce value (136Ce/138Ce = 0.01688 (ref. 33)) for mass bias correction. In this study, no meteorites were measured but the same reference standards (Mainz-AMES, JMC-304) were used. A comparison with CHUR values reported in older studies is not straightforward, as the JMC-304 batches used in the different studies do not appear to be homogenous, as pointed out above. If the ε138Ce of JMC-304 from Makashima and Nakamura18 is recalculated relative to their own CHUR value, an ε138CeCHUR of +1.46 is obtained for JMC-304. In contrast, the reported ε138CeCHUR for JMC-304 relative to CHUR in the study of Bellot et al.3 is +2.30. This indicates that the different JMC-304 batches used in these two studies are not identical. If the JMC-304 measurements relative to Mainz-AMES in the Bellot et al.3 study (ε138CeAMES = −0.93) and in our study (ε138CeAMES = −2.61) are now considered, there appears to be clear evidence that different JMC-304 batches have been utilized in all three studies. In summary, our results indicate that JMC-304 is not a suitable standard to accurately cross-reference CHUR values reported from older studies. In our study, the ε138Ce value reported for Mainz-AMES relative to CHUR of +3.24 ± 0.23 from the study of Bellot et al.3 was used for calculating the standard data reported in this study relative to CHUR because two unambiguously identical splits of the same reference standard were used in both studies.Cerium isotope composition and La–Ce concentration measurements for geological reference materials
Both accuracy and precision of our new MC-ICPMS protocol were further tested by La–Ce measurements of replicate digestions of the geological reference material BCR-2. Five fractions of this basaltic reference standard were digested following the procedure described above. The measured mean ε138Ce value obtained using a standard Ni sample cone and a H-type skimmer cone (H) is 0.11 ± 0.14 (2 r.s.d) relative to CHUR. Furthermore, the same solutions were measured with an X-Skimmer cone in combination with a standard Ni sample cone (X) to improve sensitivity. The sensitivity for Ce was improved by a factor of ca. 2.4 using the X-skimmer cone, and a mean ε138Ce value of 0.28 ± 0.33 (2 r.s.d) relative to CHUR was obtained which is indistinguishable within uncertainty. The mean values obtained for the element concentrations of BCR-2 were 24.97 ± 0.22 (2 r.s.d) for La [ppm] and 53.21 ± 0.54 for Ce [ppm], the La/Ce ratio is 0.4693 ± 0.0008. The data are reported in ESI Fig. 1 and Table 7.†The ε138Ce values obtained for different cone combinations are in a good agreement. As a result, Ce isotope composition studies can also be performed by using a standard Ni sample cone and an X-type skimmer cone, where the amount of sample being required can be decreased by a factor of ca. 2.4. The study of Raczek et al.36 showed, that the two rock standards BCR-1 and BCR-2 have indistinguishable Nd isotope compositions. Therefore, it can be assumed that the Ce isotope compositions are also identical (cf. Bellot et al.3). Independent of the cone combination our ε138Ce(CHUR) results are in a good agreement with the result of BCR-1.8 But the ε138Ce(CHUR) value obtained for BCR-2 of this study overlaps barely with a recent TIMS study.3 Notably, Bellot et al.3 assume an analytical bias as cause for the discrepancy of their BCR-2 data and the BCR-1 data of Tanaka et al.8 The La–Ce isotope dilution data obtained BCR-2 are in a good agreement with the studies of Raczek et al.36 and Baker et al.37 that also employed isotope dilution. In addition to multiple analyses of the BCR-2 reference material, further La–Ce analyses were performed for 9 reference rock samples (BCR-1, BHVO-2, JR-1, JA-2, JB-3, JG-1, JB-1b, AGV-1, JR-1) and one La Palma basalt (LP-1, in-house standard). The results are reported in Table 7 and Fig. 9.
| Sample | Type of cone | ε 138Ce (JMC304) | 2 r.s.d [ppm] | ε 138Ce (CHUR) | 2 r.s.d [ppm] | ε 138Ce (CHUR)/ literature data | Ce [ppm] | La [ppm] | La/Ce | 138La/136Ce | 138La/142Ce | La/Ce literature data |
|---|---|---|---|---|---|---|---|---|---|---|---|---|
| 1 BCR-2 | H | −0.78 | 0.30 | −0.15 | 0.30 | 53.04 | 24.90 | 0.4695 | 0.2280 | 0.003852 | ||
| X | −0.44 | 0.36 | 0.19 | 0.36 | ||||||||
| 2 BCR-2 | H | −0.46 | 0.34 | 0.17 | 0.34 | 52.83 | 24.81 | 0.4695 | 0.2280 | 0.003853 | ||
| X | −0.51 | 0.29 | 0.12 | 0.29 | ||||||||
| 3 BCR-2 | H | −0.37 | 0.23 | 0.26 | 0.23 | 53.36 | 25.05 | 0.4694 | 0.2280 | 0.003852 | ||
| 4 BCR-2 | H | −0.59 | 0.25 | 0.04 | 0.25 | 53.27 | 25.01 | 0.4696 | 0.2281 | 0.003853 | ||
| X | −0.80 | 0.39 | 0.17 | 0.39 | ||||||||
| 5 BCR-2 | H | −0.88 | 0.22 | 0.25 | 0.22 | 53.53 | 25.08 | 0.4685 | 0.2276 | 0.003845 | ||
| X | −1.28 | 0.25 | 0.63 | 0.25 | ||||||||
| Mean ± 2 r.s.e | H | −0.61 | 0.14 | 0.11 | 0.14 | 53.21 | 24.97 | 0.4693 | 0.2279 | 0.003851 | ||
| X | −0.76 | 0.33 | 0.28 | 0.33 | ||||||||
| JR-1 batch 1 | −1.78 | 0.31 | −1.15 | 0.31 | −1.0 ± 0.4 (ref. 8) | 58.91 | 36.47 | 0.6192 | 0.3014 | 0.005092 | ||
| JB-1b batch 1 | H | −1.41 | 0.21 | −0.78 | 0.21 | 68.83 | 39.59 | 0.5752 | 0.2800 | 0.004730 | ||
| JB-1b batch 2 | H | −1.13 | 0.30 | −0.50 | 0.30 | 69.15 | 39.73 | 0.5746 | 0.2797 | 0.004750 | ||
| JB-1b batch 3 | H | −0.90 | 0.24 | −0.27 | 0.24 | 68.88 | 39.83 | 0.5783 | 0.2815 | 0.004756 | ||
| AGV-1 batch 1 | H | −1.39 | 0.20 | −0.76 | 0.20 | 58.81 | 36.25 | 0.6164 | 0.3000 | 0.005069 | 0.5651 (ref. 36) | |
| AGV-1 batch 2 | H | −1.33 | 0.20 | −0.70 | 0.20 | 58.95 | 37.28 | 0.6325 | 0.3078 | 0.005200 | ||
| LP-1 batch 1 | H | −1.95 | 0.24 | −1.32 | 0.24 | 170.40 | 85.33 | 0.5008 | 0.2438 | 0.004118 | ||
| LP-1 batch 2 | H | −1.92 | 0.19 | −1.29 | 0.19 | 170.12 | 85.03 | 0.4998 | 0.2433 | 0.004110 | ||
| BHVO-2 batch 1 | H | −1.93 | 0.22 | −1.30 | 0.22 | −0.35 ± 0.76 (ref. 3) | 37.84 | 15.35 | 0.4056 | 0.1974 | 0.003335 | 0.4053 (ref. 36) |
| BHVO-2 batch 2 | H | −2.25 | 0.24 | −1.62 | 0.24 | 37.91 | 15.35 | 0.4050 | 0.1971 | 0.003330 | ||
| BCR-2 batch 1 | H | −0.70 | 0.26 | −0.07 | 0.26 | 0.39 ± 0.31 (ref. 3) | 53.36 | 25.27 | 0.4735 | 0.2305 | 0.003894 | 0.4707 (ref. 36) |
| BCR-2 batch 2 | H | −0.85 | 0.22 | −0.22 | 0.22 | 53.35 | 25.17 | 0.4714 | 0.2296 | 0.003879 | 0.4712 (ref. 37) | |
| JG-1 batch 1 | H | −0.57 | 0.21 | +0.06 | 0.21 | −0.8 ± 1.1 (ref. 8) | 54.49 | 26.32 | 0.4831 | 0.2351 | 0.003973 | |
| JG-1 batch 2 | H | −0.20 | 0.22 | +0.43 | 0.22 | 39.44 | 18.56 | 0.4705 | 0.2290 | 0.003870 | ||
| JA-2 batch 1 | H | −0.87 | 0.21 | −0.24 | 0.21 | 33.63 | 16.11 | 0.4791 | 0.2332 | 0.003939 | ||
| JA-2 batch 2 | H | −0.88 | 0.21 | −0.25 | 0.21 | 33.75 | 16.14 | 0.4782 | 0.2327 | 0.003932 | ||
| BCR-1 batch 1 | H | −0.80 | 0.24 | −0.17 | 0.24 | −0.3 ± 0.4 (ref. 8) | 53.79 | 25.36 | 0.4714 | 0.2294 | 0.003877 | 0.4709 (ref. 36) |
| BCR-1 batch 2 | H | −0.79 | 0.26 | −0.16 | 0.26 | 54.01 | 25.49 | 0.4720 | 0.2298 | 0.003882 | 0.4716 (ref. 37) | |
| JB-3 batch 1 | H | −2.20 | 0.22 | −1.57 | 0.22 | −1.6 ± 1.1 (ref. 8) | 21.27 | 8.42 | 0.3958 | 0.1927 | 0.003255 | |
| JB-3 batch 2 | H | −2.24 | 0.22 | −1.61 | 0.22 | 21.32 | 8.44 | 0.3957 | 0.1926 | 0.003254 |
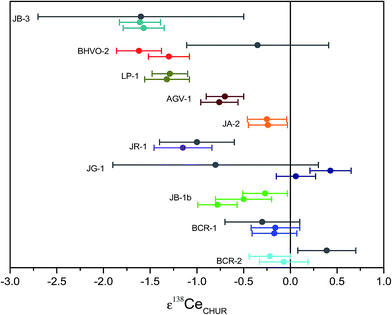 | ||
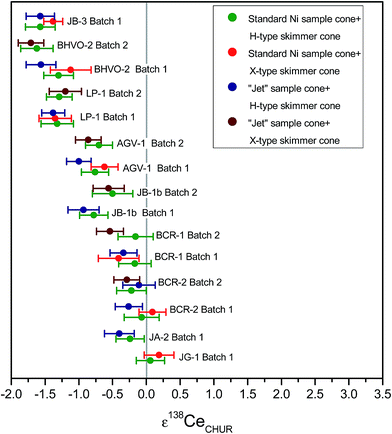
| Fig. 9 Measured Ce isotope ratios for rock reference samples given in ε-units relative CHUR. Reported uncertainties correspond to 2 r.s.d. Grey dots are literature data from Tanaka8 (JR-1, JG-1, JB-3 and BCR-1) and Bellot et al.3 (BHVO-2 and BCR-2). | ||
The external reproducibility of our new analytical protocol was tested by multiple processing of BCR-2 (Table 7 and Fig. 9). The uncertainty for BCR-2 using a standard Ni sample cone and an H-type skimmer cone is ±0.14ε, which is significantly smaller than in previous studies (±0.31ε to ±1.1ε).3,8 The external reproducibility was also assessed for other reference materials by double processing of each sample. The mean ε138Ce value for all BCR-2 sample using a standard Ni sample cone and an H-type skimmer cone is 0.04 ± 0.14 (2 r.s.d) which overlaps only slightly within error with the value reported in a recent TIMS study. As discussed in the previous section, it is possible that an analytical bias cause the discrepancy of 0.5ε-units.3 The study of Raczek et al.36 showed, that the two rock standards BCR-1 and BCR-2 have the same Nd isotope composition. Therefore, it was previously assumed (Bellot et al.3) that the Ce isotope compositions are also identical which is confirmed by our results (Table 7 and Fig. 9). The data obtained for BCR-1 in our study are also in a good agreement with literature data for BCR-1, if normalized relative to CHUR.8 The analytical bias mentioned above might also be an explanation for the difference of the BHVO-2 data between our study and the study of Bellot et al.3
The Ce isotope composition and the La–Ce concentration data obtained in this study are in an excellent agreement between two duplicates for the samples BCR-1, BCR-2, BHVO-2, JB-3, JA-2, LP-1, JB-1b, JR-1 and AGV-1. The granite sample JG-1 shows good agreement with respect to measured Ce isotope compositions,8 but also shows deviations in measured La–Ce concentration data which could be an indication of sample heterogeneity.
By the advent of special interface cone designs like wide-angle skimmer cones (X-cones) or “Jet”-sample cones with wider aperture, the sensitivity of MC-ICPMS instruments could be increased by up to an order of magnitude of 4–6.5 for Nd measurements.38 To assess the potential of MC-ICPMS for high sensitivity measurements, the effects of four different Ni-cone combinations were investigated: standard sample cone with H-type skimmer cone (H), standard sample cone with X-type skimmer cone (X), “Jet” sample cone with H-type skimmer cone (J), and “Jet” sample cone with X-type skimmer cone (J/X). By using “Jet” sample cone and H-type skimmer cone, the signal sensitivity for a given concentration of Ce could be improved by a factor of 2.4. The same factor can be achieved by using X-type skimmer cone and standard Ni sample cone. By using a combination of X-type skimmer cone and “Jet” sample cone, the signal sensitivity for Ce could be improved by a factor of ca. 4. The Ce isotope results for the different cone combinations are shown in ESI Table 5† and Fig. 10. In general, the Ce isotope data are in a good agreement, independent of the cone combination used, and no increase of the standard error of the mean is observed at a given intensity. This observation indicates that our ion exchange protocol produced sufficiently clean Ce-cuts to avoid matrix effects, in particular during use of “Jet” sample cone.39,40
4 Conclusions
Our study presents the first complete MC-ICPMS protocol for separation of La–Ce from rock matrices and measurements of Ce isotope compositions as well as La–Ce concentrations by isotope dilution. The protocol enables static measurements of all Ce isotopes (136Ce, 138Ce, 140Ce and 142Ce), also including the large abundance isotope 140Ce that is measured with a 1010 ohm amplifier. The external reproducibility achieved for 138Ce measurements was significantly better, once 136Ce/140Ce was used for mass bias correction (±0.25), rather than 136Ce/142Ce (±0.40, all 2 r.s.d.). Two synthetic reference solutions (Cologne-AMES and JMC-304 batch 15952) were prepared and were measured relative to each other and relative to the Mainz-AMES reference material in 10 analytical sessions. The weighted means relative to JMC-304 of ε138Ce are 0.0 ± 0.12 (all 2 r.s.e) for JMC-304, 0.83 ± 0.11 for Cologne-AMES and 2.61 ± 0.09 for Mainz-AMES, with better external reproducibilities than have been previously reported.2 The average 138Ce/136Ce value measured in this study is 1.33745 ± 4 (2 r.s.e, N = 51) for Mainz-AMES; the deviation of +0.52ε-units from the value published by Willbold2 can be explained through non-ideal mass bias correction and possibly by cup efficiency.A comparison with other TIMS studies demonstrates isotopic heterogeneity between different JMC-304 batches and shows that there are at least 3 different batches being analysed in different laboratories.3,8 There is also a clearly resolvable isotopic heterogeneity between the Cologne-AMES batch prepared during the course of this study and the Mainz-AMES batch. This underlines that there is an urgent need for a consensus on reference materials being used for Ce isotope measurements.
For La–Ce concentration measurements by isotope dilution, a mixed 138La/142Ce isotope tracer was prepared and calibrated against a solution prepared from high-purity AMES metal. The external reproducibility achieved for replicate digestions of the BCR-2 basaltic reference material was ±1.02 (2 r.s.d., %) for La and ±0.90 (2 r.s.d., %) for Ce concentration measurements and ±0.19 (2 r.s.d., %) for La/Ce ratios.
Measurements of Ce isotope compositions and La–Ce concentrations were performed on 10 geological reference material (JG-1, JA-2, BCR-2, BCR-1, JB-1b, AGV-1, BHVO-2, JR-1 and JB-3) and one in house La Palma basalt standard (LP-1). Replicate digestion of 5 BCR-2 splits has shown the high accuracy and precision of the presented analytical method (±0.38, 2 r.s.d). A repetitive measurement of different rock samples using variable interface/cone combinations involving “Jet”-sample cones and X-skimmer cones showed a good agreement of the results within analytical resolution. The signal sensitivity of cerium could be improved by a factor of 2.4 by using the X-skimmer cones and by a factor of 4 by using X-skimmer cones and “Jet”-sample cones.
In summary, the new analytical protocol for MC-ICPMS measurements presented here opens new avenues for applying the La–Ce geochronometer to a variety of terrestrial rock samples and meteorites. The results will open new avenues to investigate geodynamic processes on earth and to better understand processes active during the formation of the earth and the solar system.
Conflicts of interest
There are no conflicts of interest.Acknowledgements
We thank Mathias Willbold for providing a split of his Ce AMES standard solution prepared at MPI Mainz. Comments by two anonymous reviewers helped to improve the manuscript. This work has been funded by ERC grant No. 669666 “Infant Earth”.References
- A. A. Sonzogni, Nucl. Data Sheets, 2003, 98, 515–664 CrossRef CAS.
- M. Willbold, J. Anal. At. Spectrom., 2007, 22, 1364–1372 RSC.
- N. Bellot, M. Boyet, R. Doucelance, C. Pin, C. Chauvel and D. Auclair, Geochim. Cosmochim. Acta, 2015, 168, 261–279 CrossRef CAS.
- T. Tanaka and A. Masuda, Nature, 1982, 300, 515–518 CrossRef CAS.
- A. Masuda, H. Shimizu, S. Nakai, A. Makishima and S. Lahti, Earth Planet. Sci. Lett., 1988, 89, 316–322 CrossRef CAS.
- N. Nakamura, M. Tatsumoto and K. R. Ludwig, J. Geophys. Res., 1984, 89, B438–B444 CrossRef.
- H. Shimizu, T. Tanaka and A. Masuda, Nature, 1984, 307, 251–252 CrossRef CAS.
- T. Tanaka, H. Shimizu, Y. Kawata and A. Masuda, Nature, 1987, 327, 113–117 CrossRef CAS.
- A. Dickin, Nature, 1987, 326, 283–284 CrossRef CAS.
- A. Dickin, N. W. Jones, M. F. Thirlwall and R. N. Thompson, Contrib. Mineral. Petrol., 1987, 96, 455–464 CrossRef CAS.
- A. Dickin, Nature, 1988, 333, 403 CrossRef CAS.
- H. Shimizu, S. Nakai, S. Tasaki, A. Masuda, D. Bridgwater, A. P. Nutman and H. Baadsgaard, Earth Planet. Sci. Lett., 1988, 91, 159–169 CrossRef CAS.
- H. Shimizu, N. Umemoto, A. Masuda and P. W. U. Appel, Geochim. Cosmochim. Acta, 1990, 54, 1147–1154 CrossRef CAS.
- H. Amakawa, J. Ingri, M. Akimasa and H. Shimizu, Earth Planet. Sci. Lett., 1991, 105, 554–565 CrossRef CAS.
- H. Shimizu, H. Sawatari, Y. Kawata, P. N. Dunkley and A. Masuda, Contrib. Mineral. Petrol., 1992, 110, 242–252 CrossRef CAS.
- M. Tanimizu and T. Tanaka, Geochim. Cosmochim. Acta, 2002, 66, 4007–4014 CrossRef CAS.
- M. Berglund and M. E. Wieser, Pure Appl. Chem., 2011, 83, 397–410 CrossRef CAS.
- A. Makishima and E. Nakamura, Chem. Geol., 1991, 94, 1–11 CrossRef CAS.
- A. Makishima and A. Masuda, Chem. Geol., 1994, 118, 1–8 CrossRef CAS.
- A. Makishima and A. Masuda, Geochem. J., 1994, 28, 115–122 CrossRef CAS.
- R. Doucelance, N. Bellot, M. Boyet, T. Hammouda and C. Bosq, Earth Planet. Sci. Lett., 2014, 407, 175–186 CrossRef CAS.
- M. Rehkämper, M. Gärtner, S. J. G. Galer and S. L. Goldstein, Chem. Geol., 1996, 129, 201–208 CrossRef.
- H. Tazoe, H. Obata and T. Gamo, J. Anal. At. Spectrom., 2007, 22, 616 RSC.
- T. Ohno and T. Hirata, Anal. Sci., 2013, 29, 47–53 CrossRef CAS PubMed.
- H. Shimizu, S.-G. Lee, A. Masuda and M. Adachi, Geochem. J., 1996, 30, 57–69 CrossRef CAS.
- S.-G. Lee, A. Masuda, H. Shimizu and Y.-S. Song, Geochem. J., 2001, 35, 175–187 CrossRef CAS.
- A. Makishima and A. Masuda, Chem. Geol., 1993, 106, 197–205 CrossRef CAS.
- A. Makishima, E. Nakamura, S. Akimoto, I. H. Campbell and R. I. Hill, Chem. Geol., 1993, 104, 293–300 CrossRef CAS.
- Y. K. Xiao, W. G. Liu and Y. M. Zhou, Int. J. Mass Spectrom. Ion Processes, 1994, 136, 181–189 CrossRef CAS.
- P. J. Patchett and M. Tatsumoto, Contrib. Mineral. Petrol., 1980, 75, 263–267 CrossRef.
- Y. Hirahara, Q. Chang, T. Miyazaki, T. Takahashi and J. Kimura, JAMSTEC Rep. Res. Dev., 2012, vol. 15, pp. 27–33 Search PubMed.
- N. S. Saji, D. Wielandt, C. Paton and M. Bizzarro, J. Anal. At. Spectrom., 2016, 31, 1490–1504 RSC.
- A. Makishima, H. Shimizu and A. Masuda, Mass Spectrosc., 1987, 35, 64–72 CrossRef CAS.
- M. F. Thirlwall, Chem. Geol., 1991, 94, 85–104 CrossRef CAS.
- M. Pfeifer, N. S. Lloyd, S. T. M. Peters, F. Wombacher, B.-M. Elfers, T. Schulz, C. Münker, M. Köhler, R. D. Loss, T. Walczyk and T. Prohaska, J. Anal. At. Spectrom., 2017, 32, 130–143 RSC.
- I. Raczek, K. P. Jochum and A. W. Hofmann, Geostand. Geoanal. Res., 2003, 27, 173–179 CrossRef CAS.
- J. Baker, T. Waight and D. Ulfbeck, Geochim. Cosmochim. Acta, 2002, 66, 3635–3646 CrossRef CAS.
- K. Newman, J. Anal. At. Spectrom., 2012, 27, 63–70 RSC.
- T. Schulz, C. Münker and S. T. M. Peters, Earth Planet. Sci. Lett., 2013, 362, 246–257 CrossRef CAS.
- S. T. M. Peters, C. Münker, F. Wombacher and B. M. Elfers, Chem. Geol., 2015, 413, 132–145 CrossRef CAS.
Footnote |
| † Electronic supplementary information (ESI) available. See DOI: 10.1039/c7ja00256d |
| This journal is © The Royal Society of Chemistry 2017 |

