 Open Access Article
Measurement of uranium-236 in particles by secondary ion mass spectrometry
David S.
Simons
 *a and
John D.
Fassett
b
aMaterial Measurement Laboratory, National Institute of Standards and Technology, Gaithersburg, MD 20899-8371, USA. E-mail: david.simons@nist.gov
bDakota Consulting, Inc., 1110 Bonifant Street, Silver Spring, MD 20910, USA
First published on 12th January 2017
Abstract
The determination of the relative isotopic abundance by secondary ion mass spectrometry of 236U in uranium-containing material is complicated by the presence of 235U1H+ ions at the same nominal mass as the uranium isotopic peak. The net intensity of the 236U signal is usually determined by a peak-stripping procedure, whereby the 235U1H+ contribution is obtained by applying the 238U1H+/238U+ ratio to the 235U+ signal. The subtraction of one signal from another has consequences for the uncertainty of the final 236U abundance determination that may be especially significant when the amount of sample is limited, as is the case with small uranium particles that are of great interest for nuclear safeguards. We have developed a model based on Poisson counting statistics to determine the effects of various parameters on the uncertainty of the 236U abundance, including uranium enrichment level, hydride-to-parent ratio, uranium mass consumed during analysis, single versus multichannel counting, and sample substrate composition. The model predictions have been successfully tested against experimental measurements of uranium oxide particles of both 3% and 90% enrichment in 235U.
Introduction
Secondary ion mass spectrometry (SIMS) is used routinely to measure the isotopic composition of uranium in particles for nuclear safeguard applications.1 When large-geometry SIMS instruments (LG-SIMS) are used for these measurements, almost all spectral interferences that would be problematic in smaller geometry SIMS instruments can be eliminated with little or no effect on instrument transmission, and the measurement of the relative abundances of 234U, 235U, and 238U is straightforward when instrumental mass fractionation is calibrated with suitable isotopic reference materials.1 This same conclusion does not apply for 236U because the 236U+ ion that is the measured species of choice under oxygen ion bombardment is affected by a spectral interference from 235U1H+ that is separated in mass from 236U+ by only one part in 38![[thin space (1/6-em)]](https://www.rsc.org/images/entities/char_2009.gif) 000. These two peaks could in principle be resolved in LG-SIMS instruments, but the resulting measurement would suffer from a severe signal reduction that is unacceptable when the sample is a micrometer-sized particle of very limited mass.
000. These two peaks could in principle be resolved in LG-SIMS instruments, but the resulting measurement would suffer from a severe signal reduction that is unacceptable when the sample is a micrometer-sized particle of very limited mass.
The uranium hydride ion fraction in SIMS is affected by several variables including the intrinsic hydrogen content of the sample, the sample chamber vacuum conditions, and the current density of the primary ion beam. Control of these variables can reduce the hydride fraction but the smallest practical level that is typically observed when uranium oxide particles are mounted on commonly used graphite substrates is in the range of 10−4. The conventional method to account for the uranium hydride interference issue in SIMS is to determine its contribution at m/z 236 by measuring the 238U1H+/238U+ ratio and assuming that the 235U1H+/235U+ ratio is identical.1 This assumption is reasonable because hydride ion formation is a chemical process that should affect all of the isotopes of an element in a similar manner. This approach also assumes that no 239Pu+ is present in the spectrum since it cannot be practically resolved from 238U1H+ and would otherwise create a bias in the correction procedure. Although in principle the 234U1H+ signal would affect the measurement of 235U+, in practice this situation can be ignored because the hydride correction is expected to be less than 0.01% of the 235U+ signal.
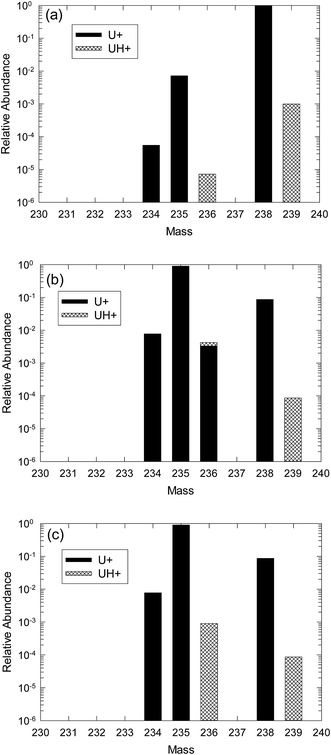
The effect of the presence of uranium hydride ions on the measurement of 236U can be shown graphically with several examples. Fig. 1(a) displays a hypothetical plot of positive ion SIMS signals in the uranium mass region from example 1, an isotopically natural uranium sample, with relative ion intensities plotted on a logarithmic scale. The uranium ion abundances are shown in black bars and the uranium hydride ions in cross-hatched bars. For this example, the hydride ion fraction is assumed to be 10−3. 236U is produced by thermal neutron capture of 235U. In uranium ore some thermal neutrons are present due to spontaneous fission, resulting in a relative isotopic abundance of 236U on the order of 10−10,2 which is well below the detectability of conventional SIMS measurements. Therefore, the only measurable signal at m/z 236 for this example is 235U1H+ at a relative abundance of 7.2 × 10⁻⁶ with respect to the total U signal.
Example 2 demonstrates the effect of hydride production on highly-enriched recycled uranium that contains a significant amount of 236U. The presence of measureable 236U that is well above the level in uranium ore is an indicator that the uranium was exposed to a significant neutron fluence, usually in a nuclear reactor, during its history. Fig. 1(b) shows a plot of relative abundances for CRM U900 (ref. 3) that is enriched to 90 atom percent in 235U and also contains about 0.33 atom percent of 236U. Again a hydride fraction of 10−3 is assumed. In this case the hydride contribution at m/z 236 at a relative abundance of 9 × 10⁻⁴ is much larger than for natural uranium but it contributes only about 25% additional signal to the actual 236U signal in this material.
Example 3 is a material similar to U900, but containing only the very low natural level of 236U, as would be the case in an enrichment scenario that involved only natural uranium feed. This situation is depicted in Fig. 1(c). The amount of 235UH is the same as in Fig. 1(b) but the relative uncertainty of the calculated amount of 236U will be much larger than in the previous case because the net amount after the hydride correction will be much smaller (essentially zero). The correction in this case is more problematic than for natural uranium both because the hydride signal at m/z 236 is more than 100 times larger and because the signal at m/z 239 that is used for the correction is about 10 times smaller, thus creating a larger statistical uncertainty.
It is useful to understand the level of uncertainty with which the net 236U abundance can be determined by SIMS in a particular circumstance, and what steps can be taken to minimize that uncertainty. To this end we have developed a mathematical model of the SIMS measurement process.
The equation to determine the 236U content at m/z 236 relative to the reference isotope of 235U based upon the procedure mentioned above is given as follows:
 | (1) |
 | (2) |
The uncertainties in the net 236U ratios can be derived by a propagation-of-errors approach from the above equations, where the terms are assumed to be statistically independent. This assumption will generally be valid if the denominators of the ratios in eqn (1) and (2) are much larger than the numerators, i.e., the reference isotope is the major isotope. When 235U is the reference isotope, the equation for the variance of the 236U/235U ratio is:
 | (3) |
 | (4) |
The detection limit for the measurement of 236U by SIMS in uranium oxide particles was calculated recently by Ranebo et al. for a specific set of conditions.1 One condition assumed that 0.1 pg of uranium was consumed in the SIMS measurement. A second condition assumed that 1 pg was consumed, corresponding to 2.5 × 10⁹ atoms, an amount contained in a pure spherical UO2 particle with a diameter of about 0.6 μm. They also assumed a 1% efficiency for converting uranium atoms into detected ions and a hydride formation ratio of 8 × 10⁻⁴ based on their experience with typical measured values for high performance magnetic sector SIMS instruments. They then calculated the 236U detection limit as a function of enrichment level by a Monte Carlo method based on eqn (2) above with the definition of the detection limit being 3 times the standard deviation of the background. By this definition there is only a 1% probability of a false positive decision that 236U is present if a measured value is at the detection limit. In this case the background was assumed to be the net ratio calculated in eqn (2) above when no 236U is actually present, with the uncertainties in the measured ratios determined by Poisson counting statistics and a small detector noise component. The calculations assume that a multicollector detection system such as the one available on the Cameca IMS-1280† is used to capture the counts of all of the uranium and relevant hydride species simultaneously. The results of the calculations by Ranebo et al. show that the 236U detection limit in atom percent for consumption of 1 pg of uranium during analysis by SIMS is a strong function of the enrichment level as a consequence of the hydride correction, rising from less than 0.0002% for natural uranium to about 0.005% for 90% enriched particles.
In the remainder of this paper we extend the approach of Ranebo et al. with a modified method of calculating detection limits, investigate the effects of various parameters on the measurement uncertainty and detection limit of 236U in particles by SIMS and compare our calculations with experimental measurements.
Analytical calculations of 236U detection limit and uncertainty
We have developed an analytical approach based on eqn (1) and (3) for enrichments greater than 50% in 235U and eqn (2) and (4) for enrichments less than 50%. The calculations are made in an Excel spreadsheet and allow the following parameters to be varied:(a) Uranium isotopic composition, fixing 234U/235U = 0.01 and summing all U abundances to 100%.
(b) Total number of U atoms consumed, fixing the SIMS utilization efficiency at 1%, consistent with experimental measurements.1,4
(c) Hydride ratio.
(d) Single or multichannel detection; if single channel detection is assumed, m/z 234, 236 and 239 are each assumed to be monitored for 25% of the time and m/z 235 and 238 for 12.5%; settling time between species is ignored for simplicity; if multichannel detection is assumed, all species are monitored for 100% of the time.
(e) The detector noise is assumed to make a negligible contribution to the measured signals. In our experience the noise level of pulse-counting electron multiplier detection systems can be routinely maintained below 0.003 counts per s.
The calculation proceeds as follows. After fixing the isotopic composition, number of U atoms, hydride ratio and detection mode, the numbers of ions detected at m/z 234, 235, 236, 238 and 239 are calculated. Either 235U or 238U is selected as the reference species depending on which is more abundant, and isotopic ratios are calculated, including 236U from eqn (1) or (2). Ratio uncertainties are calculated based on Poisson counting statistics. The uncertainty of the 236U ratio is calculated from either eqn (3) or (4). Finally, the isotopic ratios are converted to atom percents, and the atom percent uncertainties are calculated from the isotopic ratio uncertainties according to formulas that have been previously derived.5,6 For this final step it is important that the reference isotope for the ratios is the most abundant one to minimize errors due to covariance effects.
As an initial test, the detection limit for 236U was calculated by this procedure for a range of enrichments using the same assumptions as were used by Ranebo et al. for the data in their Fig. 11(b) (1 pg case) except for the lack of a detector noise component. The graph of our data appears to be visually identical to theirs, validating the present approach. In the following sections we investigate the effects of several parameters on the 236U detection limit.
Effect of hydride ratio when 236U is not present
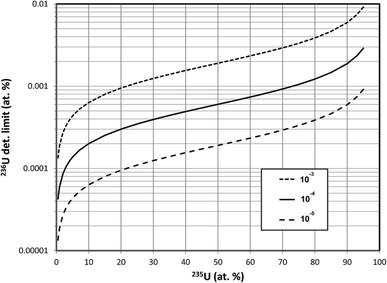
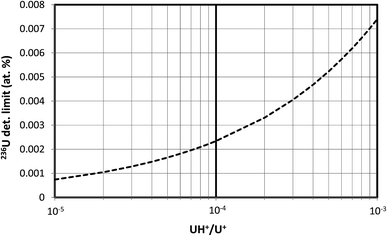
In this section we assume that 1010 atoms of U are consumed in the SIMS measurement, equivalent to a mass of about 4 pg and a corresponding pure UO2 particle diameter of about 0.9 μm. A single pulse-counting detector rather than a multichannel detector is assumed because the former is more widely applicable. Calculations were made for three different hydride ratios, 10−3, 10−4 and 10−5, spanning the experimentally observed range of uranium hydride ion ratios.The results of these detection limit calculations are shown in Fig. 2 for the 3 hydride ratios, where the 236U detection limit in atom percent has been plotted on a logarithmic scale. The detection limit decreases by a factor of 10 when the hydride ratio decreases by a factor of 100; that is, the detection limit scales as the square root of the hydride ratio. If we consider a detection limit of 0.0001 atom percent as a benchmark for determining whether 236U is present in a particle, then this limit cannot be achieved by SIMS with a hydride ratio of 10−3 while consuming 1010 atoms of U unless the particle is highly depleted in 235U. The 235U enrichment must be below 3% to achieve this benchmark if the hydride ratio is 10−4, and it must be below 20% if a hydride ratio of 10−5 can be achieved. For a fixed 235U enrichment of 93%, Fig. 3 shows the 236U detection limit as a continuous function of the hydride ratio, illustrating the square-root relationship. For a hydride ratio of 10−3 the detection limit is 0.0074 atom percent, falling to 0.0023 atom percent for a ratio of 10−4 and to 0.00074 atom percent for a ratio of 10−5. To achieve a detection limit of 0.0001 atom percent for this example a hydride ratio below 2 × 10⁻⁷ would be required.
Effect of uranium mass consumed
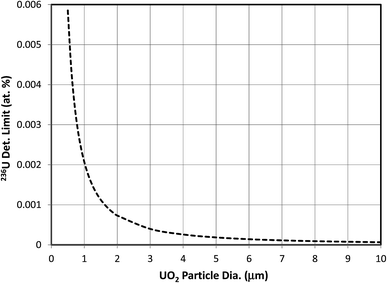
The effect of consumed mass on the 236U detection limit was investigated by holding other parameters constant. The same conditions as in the previous section were assumed, with a fixed hydride ratio of 10−4. Fig. 4 shows the effect of particle mass, plotted as equivalent diameter of a UO2 particle, on the detection limit for a 93% enriched particle. U3O8 particles of equivalent mass would have 11% larger diameters as a result of their lower density. Since the detection limit is controlled by the Poisson statistics of the m/z 236 and m/z 239 counts, it scales as the inverse square root of the mass, or as the inverse diameter to the 3/2 power. In this example the detection limit does not fall below 0.0001 atom percent unless the diameter is greater than 7.5 μm. This size of particle contains more than 400 times the mass of a 1 μm particle. The likelihood of finding such a large particle in an environmental sample is very small, and it would require an inordinately long time to sputter that much material in a SIMS experiment while maintaining high ion transmission and keeping the major isotope count rate below 106 counts per s to avoid significant counting losses due to pulse overlap in the pulse-counting system. The count-rate limitation could be avoided and the data could be acquired faster if the signals from the major U isotopes were recorded with Faraday cups.Effect of hydride ratio when 236U is present
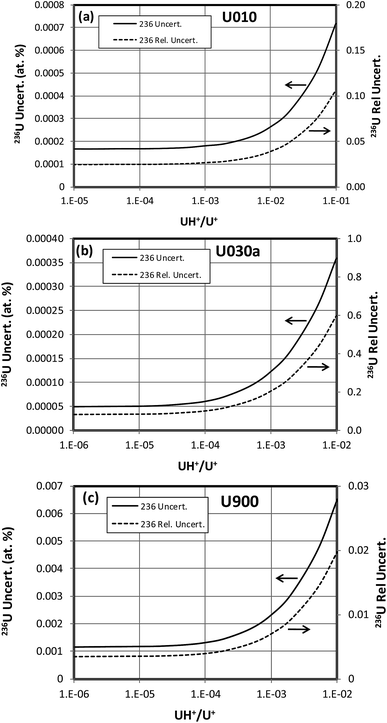
When a significant amount of 236U is actually present in a sample the uncertainty (standard deviation) of its abundance determination is of interest rather than the detection limit, which is relevant when little or no 236U is present. To calculate this uncertainty we take the square root of the variance determined by eqn (3) or (4). This uncertainty has been calculated as a function of hydride ratio for three different uranium isotopic reference materials: CRM U010 (1.0037 atom percent 235U, 0.00681 atom percent 236U), CRM U030a (3.0404 atom percent 235U, 0.000599 atom percent 236U) and CRM U900 (90.196 atom percent 235U, 0.3327 atom percent 236U).3 As in the previous section, particles containing 1010 atoms of uranium, 1% efficiency and a single detector are assumed. The results of the calculations are plotted in Fig. 5. For all three cases the uncertainty reaches a limiting value for decreasing hydride ratios. This behavior is a consequence of the contribution of the 236U term in eqn (3) or (4) which remains even when the terms involving the hydride ratio become negligible. For purposes of comparison we arbitrarily define a practical hydride ratio threshold as the hydride ratio where the uncertainty is 20% greater than its minimum value, so a ratio below that threshold wouldn't make much improvement in the 236U uncertainty. For these three examples the ratio thresholds are 3 × 10⁻³, 1 × 10⁻⁴ and 1.5 × 10⁻⁴ respectively. Although the 236U uncertainties depend on the size of the particle and the number of uranium ions detected, the hydride thresholds do not. Therefore, it appears that there is little value in achieving hydride ratios below 10−4 when a significant amount of 236U is present.The 236U abundance level has an effect on its absolute uncertainty, the effect being stronger when the hydride ratio is low. Fig. 6 shows the results of calculations of the absolute and relative uncertainties (standard deviations) of 236U abundance for 93% 235U enrichment, 1010 atoms and a 10−4 hydride ratio as the 236U relative abundance varies from 0% to 1%. The absolute uncertainty increases from about 0.0009 atom percent with no 236U present to about 0.002 atom percent with 1% 236U whereas the relative uncertainty is less than 1% when the 236U abundance is greater than 0.1%, as is typically the case for highly enriched uranium (HEU) that has been enriched from recycled reactor fuel. This calculation indicates that SIMS can determine the 236U abundance in recycled HEU with a low relative uncertainty despite the additional contribution due to the hydride correction. Fig. 7 shows a similar plot for 3% 235U enrichment with the other parameters held the same. Here the absolute uncertainty of the 236U abundance increases from 0.000035% to 0.00063% as the relative abundance increases from 0% to 0.1%, and the relative uncertainty is less than 10% when the 236U abundance is greater than 0.0006%.
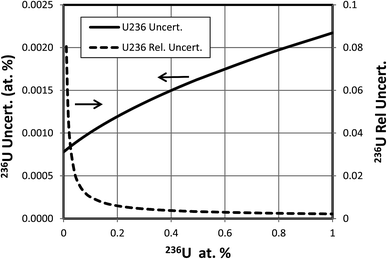 | ||
| Fig. 6 Absolute and relative uncertainties for different levels of 236U abundance in 93% enriched particle. Additional assumptions described in text. | ||
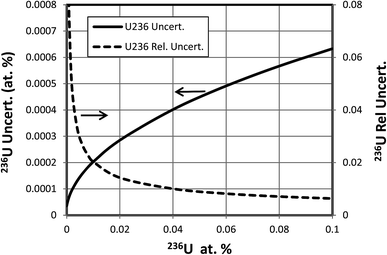 | ||
| Fig. 7 Absolute and relative uncertainties for different levels of 236U abundance in 3% enriched particle. Additional assumptions described in text. | ||
Effect of single vs. multichannel detection
With the exception of the comparison of the results with Ranebo et al., the examples in this report have been derived with the assumption of a single pulse-counting detector and peak-switching. The effect of using the multicollector on the IMS-1280 according to this model can be easily determined by applying 100% counting time to each of the acquired isotopes in the model calculations. Because the single detector calculations assumed 25% counting time each for m/z 236 and 239, the multichannel case results in 4 times greater counts for each of these species, and therefore a factor of 2 lower uncertainty in the net 236U abundance if all other parameters are held the same.Prospects for reducing the hydride ratio
Several different approaches may reduce the uranium hydride ion production during SIMS analysis. If the hydrogen source is from the residual vacuum in the sample chamber one may attempt to improve the vacuum in the vicinity of the sample by improved pumping, including use of a cold trap if the source is from residual water vapor. If the hydrogen source is from the sample itself, it might be driven off by heating the sample although this could also alter the chemical form of the uranium. A third potential source is the substrate on which particles are mounted. Pyrolytic graphite or vitreous carbon are commonly used for mounting uranium particles because these materials have high purity, low vapor pressure, and produce no significant high mass polyatomic ions that could create spectral interferences with uranium ions. However, literature reports indicate that high purity graphite may contain as much as 1% hydrogen that can be reduced by vacuum annealing, but reabsorption will occur when the graphite is exposed to air.7 To assess the effect of the substrate on uranium hydride ion production we have investigated the hydride ion signal from uranium oxide particles mounted on graphite as a function of time (ion dose) and compared the results with those obtained from particles mounted on a silicon substrate.A particle of CRM U900 several micrometers in size, selected from a dispersion of particles on a pyrolytic graphite substrate, was bombarded in an LG-SIMS instrument with an O− primary ion beam of 23 keV impact energy and 30 nA ion current. The beam was focused by Köhler illumination to an oval spot about 50 μm × 75 μm in size centered over the particle. The secondary ion species 238U+ and 238U1H+ were monitored as the particle was eroded by ion sputtering. The pressure in the sample chamber during this analysis was 8.9 × 10⁻⁸ Pa.
Fig. 8 shows the results of this measurement, with the 238U+ intensity and the 238U1H+/238U+ ratio plotted on different axes. The 238U+ intensity rises, goes through a maximum, and then decreases monotonically as the mass of the particle is eroded by sputtering. The hydride ratio drops quickly from an initial value above 10−2 and then decreases more slowly to a value approaching 10−4. In the region where the 238U+ signal is at a maximum the hydride ratio is about 10−3.
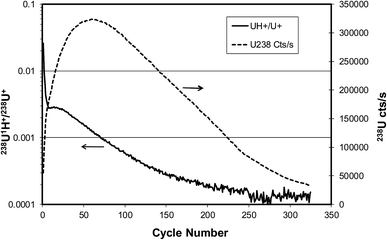 | ||
| Fig. 8 Evolution of 238U+ signal (dashed line) and 238U1H+/238U+ ratio (solid line) for U900 U3O8 particle on graphite substrate sputtered by 23 keV O− ion beam. | ||
A similar experiment was conducted by measuring the same two species from a U900 particle on a semiconductor grade silicon substrate. In this case the primary ion current was 50 nA and the sample chamber pressure was 1.3 × 10⁻⁷ Pa. The results shown in Fig. 9 are dramatically different from the graphite case. For the silicon substrate the uranium signal rises rapidly after sputtering begins, then decreases rapidly, then rises to a second maximum and finally decreases as the particle is eroded away. We tentatively attribute the initial drop in the uranium signal to the creation of an SiO2 layer on the silicon after sufficient oxygen has been implanted by the primary ion beam.4 This oxide layer may reduce the ion formation probability of the uranium. The overall efficiency of uranium detection between graphite and silicon substrates cannot be deduced from this example because the particle sizes were not known, but comparisons using monodisperse microspheres have shown that the efficiency with silicon is nearly as high as with graphite.4 After the onset of sputtering the hydride ratio decreases rapidly to a value of about 10−5 before the maximum uranium signal is reached and stays approximately at the same ratio as the particle mass is depleted. The residual vacuum in the sample chamber is clearly not the primary determinant of the hydride ratio because the sample chamber pressure is actually higher for the silicon case. Rather, the type of substrate is what makes a significant difference. The use of a silicon substrate would therefore be expected to have a substantial effect on the 236U detection limit according to Fig. 2, i.e., a reduction by a factor of 3.2 for a factor of 10 reduction in the hydride ratio. A silicon substrate would also be expected to reduce the 236U uncertainty for cases where the hydride ratio term in eqn (3) and (4) is significant. The effects depicted in Fig. 8 and 9 have been reproduced for multiple particles.
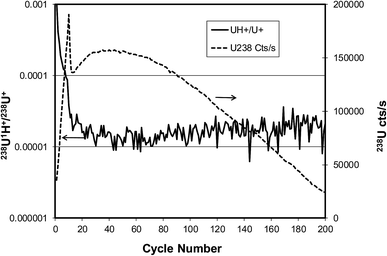 | ||
| Fig. 9 Evolution of 238U+ signal (dashed line) and 238U1H+/238U+ ratio (solid line) for U900 U3O8 particle on silicon substrate sputtered by 23 keV O− ion beam. | ||
Experimental test of uncertainty model
The model calculations described above were tested in several experiments in which particles of U3O8 reference materials were analyzed in an LG-SIMS instrument to measure their isotopic composition and uncertainty. Measurements were made by cycling through the species 234U+, 235U+, 236U+ + 235U1H+, 238U+ and 238U1H+ and recording the counts from a single electron multiplier detector over 20 cycles of data acquisition while the particle was bombarded with 23 keV O− ions in a static defocused beam that was much larger than the particle (Köhler illumination). For each cycle the 236U ratio to the most abundant isotope was calculated according to eqn (1) or (2), the data were adjusted by time interpolation, corrected with instrumental mass fractionation factors that were determined by calibration with U900 particles, and converted from isotopic ratios to atom percents for each data cycle. The final reported atom percents for a run were the unweighted averages over the 20 cycles, and the reported uncertainties were the standard deviations of the means over the 20 cycles. The 236U uncertainty was compared with the model calculation that used as input parameters the known isotopic composition, the fraction of the cycle time over which each species was recorded, the total counts of uranium corrected for duty cycle for that run and the average hydride ratio for that run.Other sources of background signals at the mass position of 236U were also evaluated to determine if they were significant. The background electronic noise of the pulse-counting detection system was monitored periodically at a mass position where no signal was present and was found to be less than 0.003 counts per s, i.e., less than 1 count in 5 minutes, which should be insignificant for reasonable counting times. The other background source that was considered was the scatter tail from the major uranium peak. Signals from a U900 particle were measured at half-mass positions with respect to 234U+, then interpolated to the integral mass positions and converted to ratios with respect to the major isotope in this material, 235U+. In this way it was determined that the tail of the 235U+ peak contributes a signal about 5 × 10⁻⁸ as large as the 235U+ peak at the m/z 236 mass position. By extension of the U900 data, if the major isotope in a particle were 238U the contribution from that peak at the m/z 236 mass position would be about 6 × 10⁻⁸ as large as the 238U+ peak. In either case the tail would contribute a negligible amount to the m/z 236 signal under normal particle analysis conditions. Note that these results apply when the single large electron multiplier detector is used on the LG-SIMS. We have not made similar measurements with the multicollector detector which may have a larger peak tail contribution.
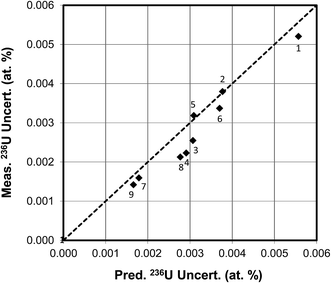
In the first experimental example of 236U measurements the same relatively large CRM U900 particle was analyzed sequentially over 9 runs under varying conditions. For the first 6 runs the primary beam current was 0.75 nA, for the next 2 runs it was 2 nA, and for the final run the current was 5 nA. Over this series of runs the hydride ratio monotonically decreased from 3.0 × 10⁻³ to 1.5 × 10⁻⁴, i.e., by a factor of 20. The total uranium ion counts corrected for duty cycle ranged from 6.1 × 10⁷ to 1.7 × 10⁸. The measured weighted average 236U isotopic abundance with standard deviation of the mean was 0.3320 ± 0.0008 atom percent (certified value 0.3327 ± 0.0005). The comparison of the measured vs. predicted uncertainties for 236U for these 9 measurements is shown in Fig. 10. The measured uncertainties ranged from 0.0052 atom percent in the first run to 0.0014 atom percent in the last run, the decrease largely driven by the decrease in hydride ratio, with the total uranium counts having a secondary effect since they only varied by about a factor of 3. The measured and predicted uncertainties are well correlated, with a correlation coefficient of 0.95. These results are also in good agreement with Fig. 5(c) which was calculated for a fixed value of 108 uranium ion counts for U900. The figure shows that the 236U uncertainty for a single particle measurement cannot be reduced below 0.001 atom percent under the specified conditions.
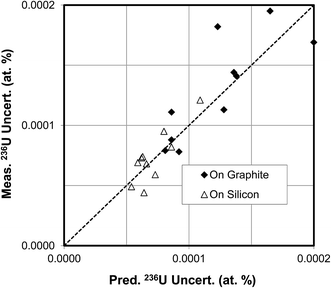
In the second example U3O8 particles of CRM U030a were measured to determine their isotopic compositions on graphite and silicon substrates with an O− primary ion beam under Köhler illumination. This material has a 236U content of 0.000599 atom percent. Each particle was first presputtered for 10 minutes with a 30 nA primary ion beam to stabilize the hydride ratio (see Fig. 8). The isotopic composition was then measured according to the procedure described above. A comparison of the measured vs. predicted uncertainties for particles on the two different substrates is shown in Fig. 11. For the particles on graphite substrates the average total uranium counts were 1.2 × 10⁸, the average hydride ratio was 8.1 × 10⁻⁴, and the average uncertainty was 0.000135 atom percent. For the particles on silicon substrates the average total uranium counts were also 1.2 × 10⁸, the average hydride ratio was 7.5 × 10⁻⁵, a factor of about 11 lower, and the average uncertainty was 0.000073 atom percent, a factor of about 2 lower. The correlation between measured and predicted uncertainties is not as tight as in the CRM U900 case, but this is to be expected because the net counts of 236U+ are quite small for U030a. These results are in good agreement with Fig. 5(b) which also shows that the 236U uncertainty cannot be reduced below 0.00005 atom percent under the specified conditions, no matter how small the hydride ratio. The results are presented in a different way in Fig. 12(a) and (b) where the 236U atom percent values are plotted for each particle measurement and the error bars are two standard deviations. In all cases the error bars overlap the certified value of 0.000599 atom percent. These figures graphically illustrate the factor of two reduction in uncertainty for the silicon substrate as a result of the lower hydride ratio.
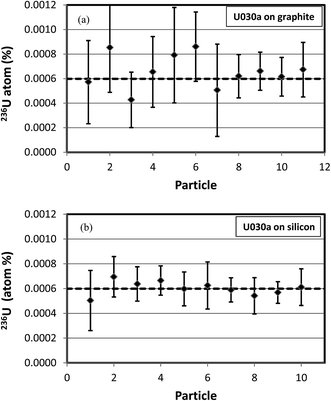 | ||
| Fig. 12 Measured 236U abundances in CRM U030a particles on graphite (a) and silicon (b) substrates. Error bars are 2 standard deviations. Dashed line is certified value of 0.000599 atom percent. | ||
Conclusion
The preceding model calculations are idealized since they assume that the only variability in the measurement of the 236U abundance is produced by the inherent and inevitable statistical fluctuations in ion counting. In reality other contributions, for example instability in the primary ion source, may have an additional measureable effect. In general, these other contributions only become significant when the Poisson contribution to the relative uncertainty is less than 1%. The presence of these additional contributions can be tested in real-world measurements by comparing the Poisson-only prediction based on total ion counts of each species with the cycle-by-cycle variability through the use of the F statistic, for example.The general conclusions of this study are as follows:
• If a 1 μm particle of pure uranium oxide that contains a significant amount of 236U is completely consumed, a large geometry SIMS can measure the abundance of 236U with relatively small uncertainty at any enrichment level. If no 236U is present the SIMS measurement can establish its absence (i.e., less than 0.0001%) under typical experimental conditions with a graphite substrate only if the 235U enrichment level is less than 3%.
• Changing to a substrate that produces lower hydride ratios than does graphite will allow a detection limit of 0.0001% to be achieved for 236U at a higher enrichment level in a 1 μm particle, for example up to 20% enrichment if a hydride ratio of 10−5 can be achieved. For a silicon substrate with an O− primary ion beam the rapid U+ signal changes exhibited in Fig. 9 could be problematic for precise isotopic analysis if peak-switching is used. However, the same signal transients have not been observed under O2+ bombardment,4 which may be a more suitable analytical condition for use with a silicon substrate.
• SIMS, when practiced as described here, cannot establish the absence (detection limit 0.0001%) of 236U in highly enriched uranium in a particle smaller than several micrometers in size. This is a direct consequence of the inevitable presence of an interfering uranium hydride ion peak and the statistics of ion counting. For example, as an extrapolation of Fig. 3, a hydride ratio below about 2 × 10⁻⁷ would be required to achieve this detection limit in a 93% enriched particle with 1010 uranium atoms based on the model presented. This hydride ratio is nearly a factor of 100 lower than the value achieved in Fig. 9 with a silicon substrate.
References
- Y. Ranebo, et al., Improved isotopic SIMS measurements of uranium particles for nuclear safeguard purposes, J. Anal. At. Spectrom., 2009, 24, 277–287 RSC.
- X. Wang, et al., 236U measurement with accelerator mass spectrometry at CIAE, Nucl. Instrum. Methods Phys. Res., Sect. B, 2010, 268, 2295–2299 CrossRef CAS.
- New Brunswick Laboratory, U.S. Department of Energy, Certificates of Analysis available at http://science.energy.gov/nbl/certified-reference-materials/prices-and-certificates/uranium-certified-reference-materials-price-list/, accessed October 2016.
- N. Sharp, J. D. Fassett and D. S. Simons, Uranium ion yields from monodisperse uranium oxide particles, J. Vac. Sci. Technol., B: Nanotechnol. Microelectron.: Mater., Process., Meas., Phenom., 2016, 34, 03H115 Search PubMed.
- D. S. Simons, Propagation of Errors in the Calculation of Atomic Percents from Isotopic Ratios, unpublished report, 2000 Search PubMed.
- F. Schaefer, P. D. P. Taylor, S. Valkiers and P. De Bievre, Computational procedures for the treatment of measured or published isotope abundance data, Int. J. Mass Spectrom. Ion Processes, 1994, 133, 65–71 CrossRef CAS.
- R. Bastasz, Residual hydrogen concentration levels in graphite, J. Vac. Sci. Technol., A, 1988, 6, 2116–2118 CAS.
Footnote |
| † Certain commercial equipment, instruments, or materials are identified in this paper to specify the experimental procedure adequately. Such identification is not intended to imply recommendation or endorsement by the National Institute of Standards and Technology, nor is it intended to imply that the materials or equipment identified are necessarily the best available for the purpose. |
| This journal is © The Royal Society of Chemistry 2017 |

