
Analysis of whole blood by ICP-MS equipped with a high temperature total sample consumption system
Águeda
Cañabate
a,
Esperanza
García-Ruiz
b,
Martín
Resano
 b and
José-Luis
Todolí
*a
b and
José-Luis
Todolí
*a
aDepartment of Analytical Chemistry, Nutrition and Food Sciences, University of Alicante, P. O. Box 99, 03080 Alicante, Spain. E-mail: jose.todoli@ua.es
bDepartment of Analytical Chemistry, Aragón Institute of Engineering Research (I3A), University of Zaragoza, Pedro Cerbuna 12, 50009, Zaragoza, Spain
First published on 21st November 2016
Abstract
In this work, the performance of a high temperature torch Integrated Sample Introduction System (hTISIS) using inductively coupled plasma mass spectrometry (ICP-MS) for the multi-element analysis of whole blood is evaluated. Two different quadrupole-based spectrometers were tested and the optimization studies were performed with a reference whole blood material. Sample dilution factor and hTISIS temperature were taken as the variables. The sample was introduced following two different procedures: continuous aspiration and air-segmentation. The optimum performance of the system in terms of both analytical figures of merit and accuracy was obtained for a hTISIS temperature of 200 °C and for either 1![[thin space (1/6-em)]](https://www.rsc.org/images/entities/char_2009.gif) :10 or 1:25 dilution factors depending on the ICP-MS device used. An improvement in terms of sensitivity and detection limits was obtained with the hTISIS as compared to the conventional cyclonic spray chamber. Thus, for 1:25 diluted blood samples, the hTISIS improved the sensitivity by a factor ranging 2.0–4.5. Moreover, at 200 °C, the limits of detection for hTISIS at 200 °C were 1.1 to 8.4 times lower than those for the cyclonic spray chamber. This analytical parameter was in the ng L−1 range for the detected elements. Matrix effects in turn became less severe as the hTISIS temperature increased (from room temperature to 80 °C). All these results were obtained without a severe degradation of the fundamental plasma parameters. In fact, under optimum conditions BaO+/Ba+ and Ba2+/Ba+ signal ratios were 1.2% and 2.0%, respectively. The developed method was applied for the analysis of low volumes (ca. 2.5 μL) of real blood samples after a minimally invasive collection by volumetric absorptive microsampling. The hTISIS is an easy-to-implement sample introduction system that can be employed for the routine analysis using ICP-MS.
:10 or 1:25 dilution factors depending on the ICP-MS device used. An improvement in terms of sensitivity and detection limits was obtained with the hTISIS as compared to the conventional cyclonic spray chamber. Thus, for 1:25 diluted blood samples, the hTISIS improved the sensitivity by a factor ranging 2.0–4.5. Moreover, at 200 °C, the limits of detection for hTISIS at 200 °C were 1.1 to 8.4 times lower than those for the cyclonic spray chamber. This analytical parameter was in the ng L−1 range for the detected elements. Matrix effects in turn became less severe as the hTISIS temperature increased (from room temperature to 80 °C). All these results were obtained without a severe degradation of the fundamental plasma parameters. In fact, under optimum conditions BaO+/Ba+ and Ba2+/Ba+ signal ratios were 1.2% and 2.0%, respectively. The developed method was applied for the analysis of low volumes (ca. 2.5 μL) of real blood samples after a minimally invasive collection by volumetric absorptive microsampling. The hTISIS is an easy-to-implement sample introduction system that can be employed for the routine analysis using ICP-MS.
1. Introduction
Biochemical reactions in humans depend on the essential elements, such as cobalt, copper, magnesium, manganese, selenium, sodium, and zinc, and are interfered by the toxic elements such as arsenic or lead. Deficiencies in the essential elements must be treated and toxics must be removed.1–3 This kind of information can be obtained through the analysis of blood, as blood is a medium for the transport of essential and toxic trace elements.1Element determination in blood samples has been carried out via techniques such as atomic absorption spectroscopy,4–8 total reflection X-ray fluorescence (TXRF),5,9 and hydride generation atomic fluorescence spectroscopy (HG-AFS).10 However, due to the increasing demand for the determination of a number of elements in blood, alternative analytical methods are required.
Inductively coupled plasma optical emission spectroscopy (ICP-OES),5,11,12 and particularly, mass spectrometry (ICP-MS)5,13–17 offer a multi-element measurement capability, low detection limits,18 a wide dynamic range, and short analysis time.16 However, these techniques suffer from spectral as well as non-spectral interferences that may degrade the accuracy of the blood analyses.19
Interferences arising from the atomic and molecular ions generated in the plasma through the combination of argon and matrix constituents hinder ICP-MS quantification.17 In the case of blood analysis, the most severe specific spectral interferences are due to the presence of chloride, sodium, sulfur or carbon.17,19,20–23 These interferences can be minimized or even removed using a reaction and/or a collision cell.14,17,18,24,25
Non-spectral interferences can also be observed while carrying out the analysis of blood samples. Therefore, high concentrations of inorganic and organic solutes may cause changes in the aerosol generation, transport and/or properties of the plasma. Furthermore, dissolved salts may lead to a partial blockage of the injector torch or the ICP-MS cones.10 To overcome some of these problems, internal standardization or standard addition is classically employed.15
Moreover, matrix effects can also be minimized by lowering the sample consumption rate and using a total sample consumption system. This way, the matrix plasma load is decreased and the interferences associated with the sample introduction system may be removed. The latter assessment is based on the fact that with such system, the analyte transport efficiency is close to 100%, regardless of the sample nature.26,27 The so-called high temperature torch integrated sample introduction system (hTISIS) consists of a micronebulizer connected to a low inner volume single pass spray chamber.26–29 The main advantages of the hTISIS over a conventional spray chamber are as follows: (i) analyte transport efficiencies are virtually 100%; as a result, (ii) very low sample volumes (ca. 2–5 μL) are required to perform the analysis; thus, (iii) the solvent plasma load is also low; (iv) memory effects are practically negligible; and (v) virtually no waste is generated.30 Besides, the extent of the matrix effects caused by both organic and inorganic concomitants is less pronounced as compared to that of the conventional cyclonic spray chamber.28 To date, hTISIS has been applied for the accurate analysis of a few environmental, biological, and clinical reference materials.27,31,32
Thus, the goal of the present work was to test the suitability of the hTISIS, operated at a high temperature, as a system for the analysis of samples of a very complex nature, but of great importance (such as blood) by ICP-MS. Relevant parameters, such as the hTISIS chamber temperature and sample dilution factors, were optimized for the blood reference samples. The analytical figures of the merit were compared against those obtained with a conventional sample introduction system.
2. Experimental
2.1. Chemicals and samples
Ultra-pure water from a Milli-Q system (Merck, Darmstadt, Germany) was employed in all the experiments. All the standards and samples were prepared in 1% aqueous solution of nitric acid (HNO3 65% p.a EMSURE ISO, Merck).Single element stock solutions (CertiPUR, Merck) containing the required element at a 1000 mg L−1 concentration were used to prepare the standards (10 μg L−1 and 1 μg L−1). These standards also contained Ba at 10 μg L−1, whereas Rh at 25 μg L−1 was employed as the internal standard.
The reference materials analyzed were Seronorm Trace Elements Whole Blood L-2 and Seronorm Trace Elements Whole Blood L-3 (Sero, Billingstad, Norway; Reference 210205 and 210305, respectively). These lyophilized human whole blood materials were reconstituted in 5 mL Milli-Q water, according to the instructions provided in the certificate. Then, aliquots of the L-2 solution were diluted to 1:10, 1:25, 1:50, and 1:100 with a 1% HNO3 aqueous solution and L-3 was diluted to 1:10. Real samples were obtained from three different adult individuals.
The sampling procedure was performed via the so-called volumetric absorptive microsampling (VAMS) method. A puncture with a safety lancet was performed on the finger of several individuals and a small volume (10.5 μL) was retained on the absorptive tip of the VAMS microsampler (Mitra™, Neoteryx LLC, Torrance, USA). Afterwards, the samples were dried under ambient conditions for 4 hours followed by the extraction of the absorbed samples with 100 μL of 1% HNO3 aqueous solution using an ultrasonic bath (generator power: 50 W, and frequency: 50 Hz) for 1 hour to promote the extraction of the analytes. Finally, the analysis of the resulting solutions was performed by external calibration with a set of plain water standards. Anonymous samples were provided by the Hospital Universitario Miguel Servet, Zaragoza. The principles outlined in the declaration of Helsinki regarding all the experimental research involving humans or animals were followed. In addition, an informed consent was obtained from the participants involved.
2.2. Instrumentation
A NexION 300X ICP-MS spectrometer (Perkin-Elmer, Waltham, USA) was used. This instrument is equipped with a quadrupole cell that can be used either as a collision cell, in combination with kinetic energy discrimination, or as a dynamic reaction cell. The system contains a triple cone interface with an additional hyper skimmer cone, providing a more gradual pressure reduction within the interface, which results in less dispersion of the ion beam. A quadrupole ion deflector deviates the ion beam over a 90-degree angle, focusing it into the cell. Table 1 summarizes the ICP-MS operating parameters. A pneumatic concentric nebulizer (Type C, Meinhard Glass Products, Santa Ana, USA) was fitted to the hTISIS by means of a Teflon adapter, whereas a cyclonic spray chamber (quartz chamber, inner volume of 50 cm3, Perkin-Elmer) was used as the reference chamber for the comparative studies.| Perkin-Elmer NexION 300X | Agilent 7700x | |
|---|---|---|
| Chamber temperature | RT-200 °C | 200 °C |
| Nebulizer gas flow rate | 1.1 L min−1 | 0.5 L min−1/0.56 L min−1 HMI |
| Sample uptake rate | 33 μL min−1 | |
| RF power | 1600 W | 1600 W |
| Plasma gas flow rate | 18 L min−1 | 15 L min−1 |
| Auxiliary gas flow rate | 1.2 L min−1 | 0.90 L min−1 |
| Cell gas flow rate (He) | 0.8 mL min−1 | 4.3 mL min−1 |
Moreover, an Agilent 7700x ICP-MS (Agilent, Santa Clara, USA) was also used. The instrument is equipped with a High Matrix Introduction (HMI) accessory that increases the tolerance to salty matrices as compared to that of the conventional ICP-MS instruments. The sample introduction system used with this instrument was hTISIS and a High Efficiency Nebulizer (HEN, Meinhard Glass Products).
Samples were supplied to the nebulizer both in continuous and discrete modes with the spectrometer peristaltic pump using flared end PVC-based tubing of 0.19 mm i.d. (Glass Expansion, Melbourne, Australia). For the segmented-flow injection mode, air was continuously aspirated and at a given time, 2.5–10 μL of either samples or standards were injected by adapting the nozzle to the flared end tubing. The solution was thus directed towards the nebulizer while avoiding the sample dispersion, as the carrier stream was simply air.
3. Results and discussion
While working under air-segmentation mode, a transient signal was obtained. Due to the fast data acquisition capability of modern ICP-MS devices (dwell time was set at 20 ms), the transient signal contained a plateau. Under these circumstances, the dispersion of the sample plug was negligible. Obviously, this was due to the absence of liquid carrier stream, which reduced the extent of sample renebulization from the chamber walls and the sample dispersion in liquid phase.3.1. Effect of hTISIS temperature on the sensitivity and comparison with the cyclonic spray chamber
As expected, the higher the chamber temperature, the greater the ICP-MS sensitivity. This trend has been previously observed while working with aqueous and organic standards in the ICP techniques and can be assigned to an increase in the analyte transport rate.26 However, it should be noted that compared to ICP-OES, ICP-MS is more sensitive to operational changes, and somewhat different trends have been observed with different ICP-MS spectrometers. In fact, under a continuous aspiration regime and for a spectrometer equipped with a dynamic reaction cell, the sensitivity for plain water solutions peaked at hTISIS temperatures ranging from 135 to 180 °C.27 Moreover, for a multicollector ICP-MS system, ionic signal was first constant between 55 and 75 °C, and then decreased.33 For organic solutions under air-segmented mode, it was found that the peak height increased with increase in temperature up to 110 °C. Above this value, a drop in the sensitivity was observed.34For the NexION 300X instrument used in the present study, effect of the hTISIS temperature was tested under continuous aspiration for four reference whole blood samples at different dilution factors (1:100, 1:50, 1:25, and 1:10). It was found that the most diluted samples provided a steep increase in signal with temperature. However, for the blood samples diluted at 1:10, the maximum sensitivity was achieved at 80 °C. This was likely due to the loss of nebulizer performance and ion transfer efficiency to the mass spectrometer. In fact, at 200 °C, a solid deposit was found at the nebulizer tip and the sampler cone.
The hTISIS is particularly designed to handle low liquid sample volumes. While working under segmented-flow injection mode, solid deposits observed at the interface were less severe than those in the continuous mode. Fig. 1 shows the effect of the temperature on the sensitivity under segmented-flow injection mode. Peak areas obtained with hTISIS were divided by those obtained with the conventional cyclonic spray chamber. The improvement factor in terms of sensitivity, contributed by the former device, increased with increase in temperature, however, depended on both the analyte atomic mass and the sample dilution factor. For instance, the relative area was higher for light (59Co, 63Cu, 66Zn) isotopes than that for heavy (110Cd and 208Pb) isotopes. This might suggest that the mass discrimination phenomena for light elements over heavy ones were less marked at high chamber temperatures than that at room temperature. It should be noted that for a conventional sample introduction setup, the presence of salty matrices induces space charge effects that decrease the sampling efficiency of light ions.35 Moreover, heavy ions preferentially remain in the center of the ion beam and are more efficiently transferred to the mass spectrometer through the interface. The higher peak area enhancement factor found for light elements when increasing the temperature suggests that they became efficiently focused under these operating conditions.
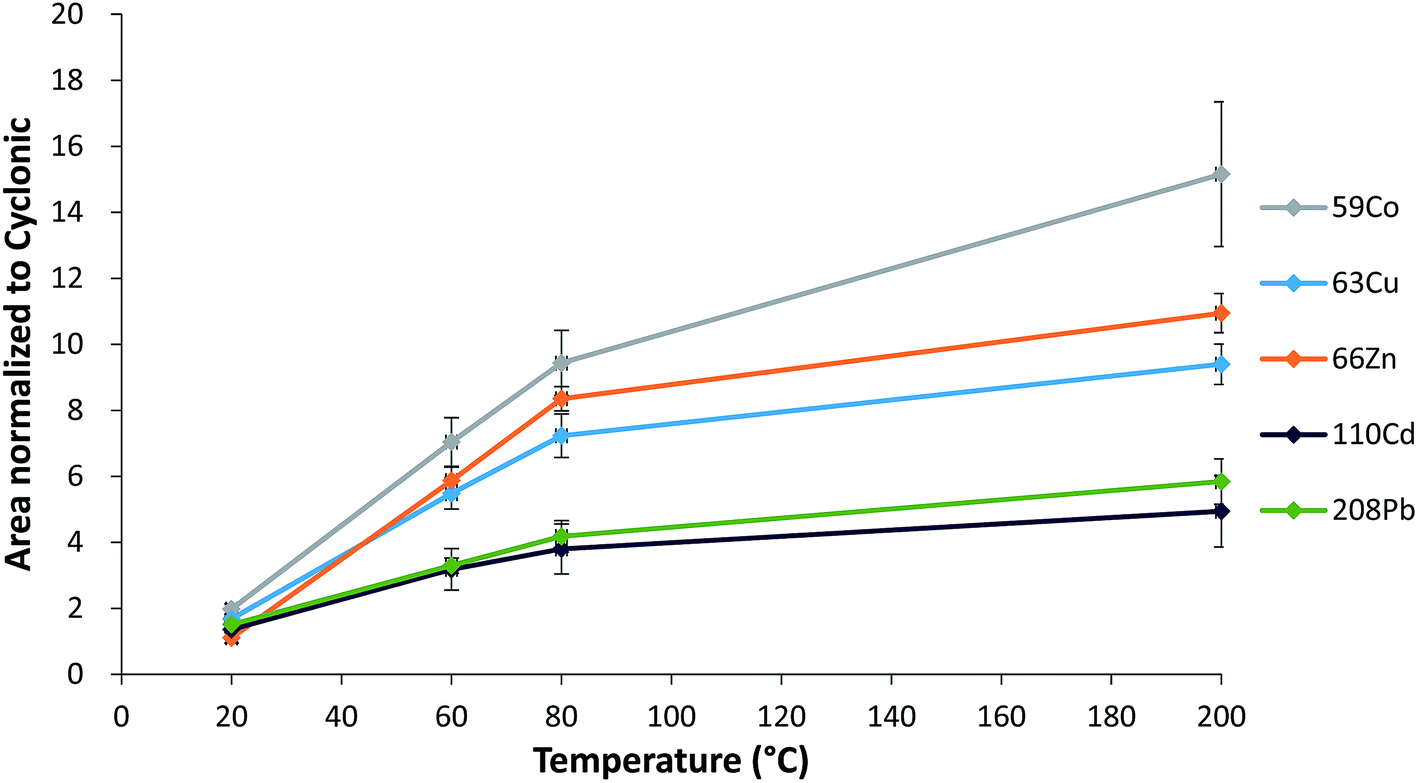 | ||
| Fig. 1 Effect of the hTISIS temperature on the sensitivity (using peak area values) normalized with respect to the cyclonic spray chamber. A dilution factor of 1:50 and air-segmented injection mode (injected volume: 5 μL) were used. Experiments were performed with a NexION 300X ICP-MS. Error bars were calculated according to error propagation (n = 5). | ||
Note that as expected, the dilution factor played an extremely important role in terms of hTISIS performance when compared with that of the reference chamber. Fig. 2 plots the normalized area with respect to the cyclonic spray chamber for five different nuclides at the four evaluated dilution factors. In general terms, it was observed that despite the low injected sample volume (ca. 5 μL), the normalized area was the lowest for 1:10 dilutions. This effect was much more remarkable when the hTISIS was set at 200 °C than when it was set at room temperature. Obviously, the introduction of highly concentrated samples resulted detrimental in terms of hTISIS-ICP-MS signal production because of the abovementioned formation and growth of solid deposits at the interface, thus giving rise to a decrease in the ion transmission efficiency.
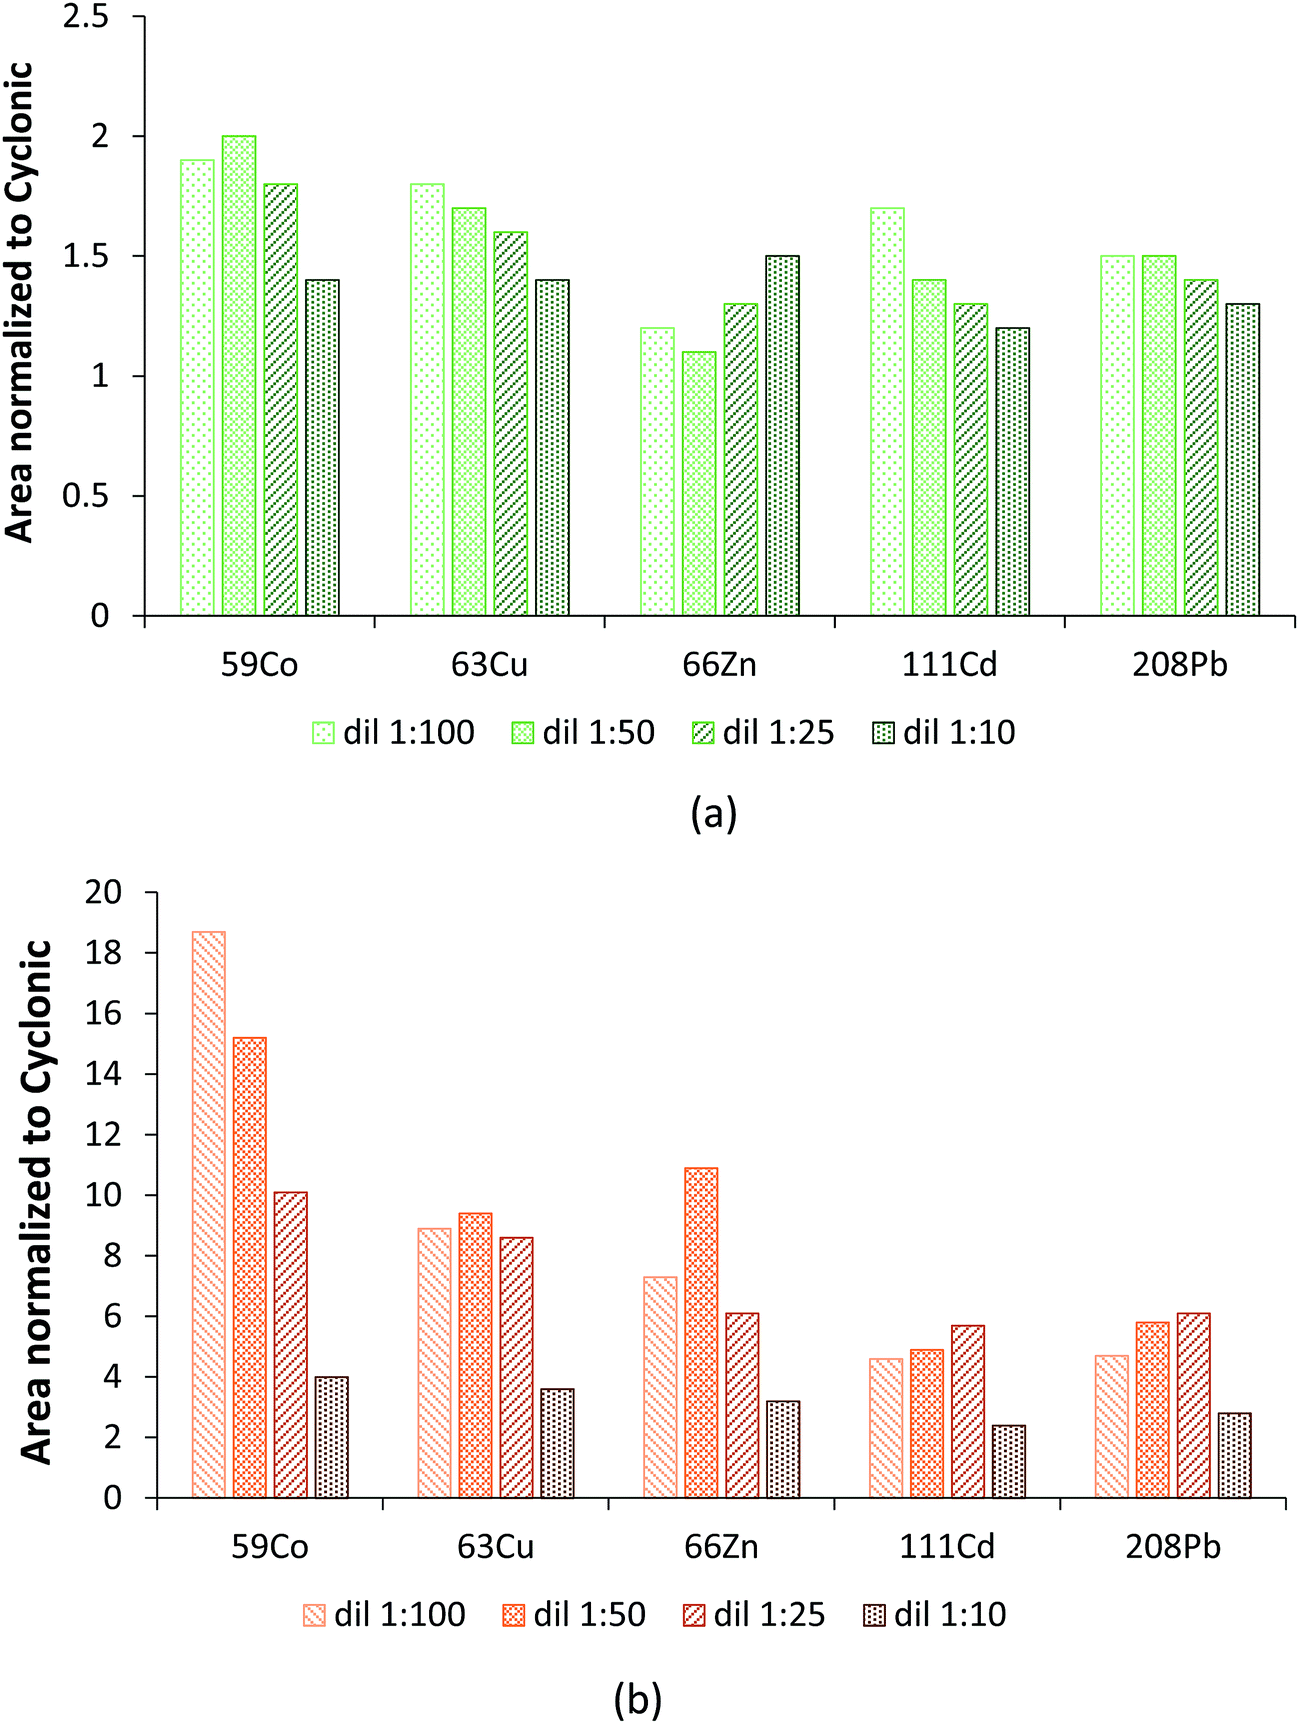 | ||
| Fig. 2 Effect of the dilution factor on the sensitivity (using peak area values) normalized with respect to the cyclonic spray chamber at (a) room temperature and (b) 200 °C hTISIS temperature. Injection was performed under the air-segmented (5 μL) mode. Experiments were performed with a NexION 300X ICP-MS. | ||
Detection limits in the blood reference samples (Table 2) were calculated according to the 3sb criterion (where sb is the standard deviation of a series of five consecutive blank measurements). In the present situation, sensitivity was calculated as the peak area divided by the analytical concentration of a reference material. It was observed that the hTISIS generally provided LODs lower than that provided by the cyclonic spray chamber when the diluted reference blood sample was analyzed. Table 2 also shows that the 7700x ICP-MS instrument provided LODs similar to those obtained with the NexION 300X system. Note that the injected sample volume was two times lower for the former spectrometer. Consequently, the absolute LODs would be lower while working with the 7700x system. These results could be assigned to the fact that, as abovementioned in the Experimental section, a HEN was employed for the 7700x system, whereas analyses with the NexION 300X spectrometer were carried out with a C-type pneumatic concentric nebulizer. As the HEN is a more efficient nebulizer, it was able to provide similar LODs as the C-type with a lower injected sample volume. It was observed that high LODs were obtained for 66Zn and the 7700x system. It was verified that the background signal for this isotope was actually high. This isotope suffers from polyatomic spectral interferences caused by the presence of sulfur and calcium as concomitants (i.e., 34S16O2, 32S34S, 33S2, 48Ca18O).36 Owing to the same reason, a decrease in the dilution factor (two last columns in Table 2) did not improve the limits of detection neither for 66Zn nor for 63Cu (likely interfered by 40Ar or 23Na+). Apparently, the collision cell operating conditions had to be further optimized to accurately determine this element using the abovementioned spectrometer. As this was not the goal of the present work, all the analyses were performed under the conditions summarized in Table 1.
| Cyclonic segmenteda | hTISIS 200 °C segmenteda | hTISIS 200 °C segmentedb | hTISIS 200 °C segmentedc | |
|---|---|---|---|---|
|
a 1:25 diluted sample (NexION 300X ICP-MS instrument). Injected volume: 10 μL.
b 1:25 diluted sample (7700x ICP-MS instrument). Injected volume: 5 μL.
c 1:10 diluted sample (7700x ICP-MS instrument). Injected volume: 5 μL.
|
||||
| 59Co | 59 | 7 | 6 | 29 |
| 63Cu | 699 | 617 | 748 | 945 |
| 66Zn | 4357 | 3300 | 19000 |
21000 |
| 111Cd | 29 | 6 | 4 | 15 |
| 208Pb | 113 | 17 | 102 | 136 |
Interestingly, it was verified that an increase in the sample concentration led to higher LODs (see the two last columns in Table 2). In conclusion, when the NexION 300X ICP-MS was used, a 1:25 dilution was advisable to obtain the lowest LODs, whereas 1:10 was the dilution factor that was recommended while working with the 7700x system.
3.2. Comparison between the continuous and air segmented-flow modes
When considering the benefits of the hTISIS with respect to the cyclonic spray chamber, it was verified that the former improved the analytical figures of merit in both aspiration modes. As shown in Fig. 3, the signal enhancement factor was higher when the sample was introduced according to the segmented mode. These results revealed that the high temperature single pass spray chamber was a more appropriate device for the analysis of low sample volumes than a cyclonic design, especially with a segmented-flow injection mode. This is important for the analysis of blood samples in situations for which the available volume is low and/or when minimally-invasive home-based collection protocols are implemented.37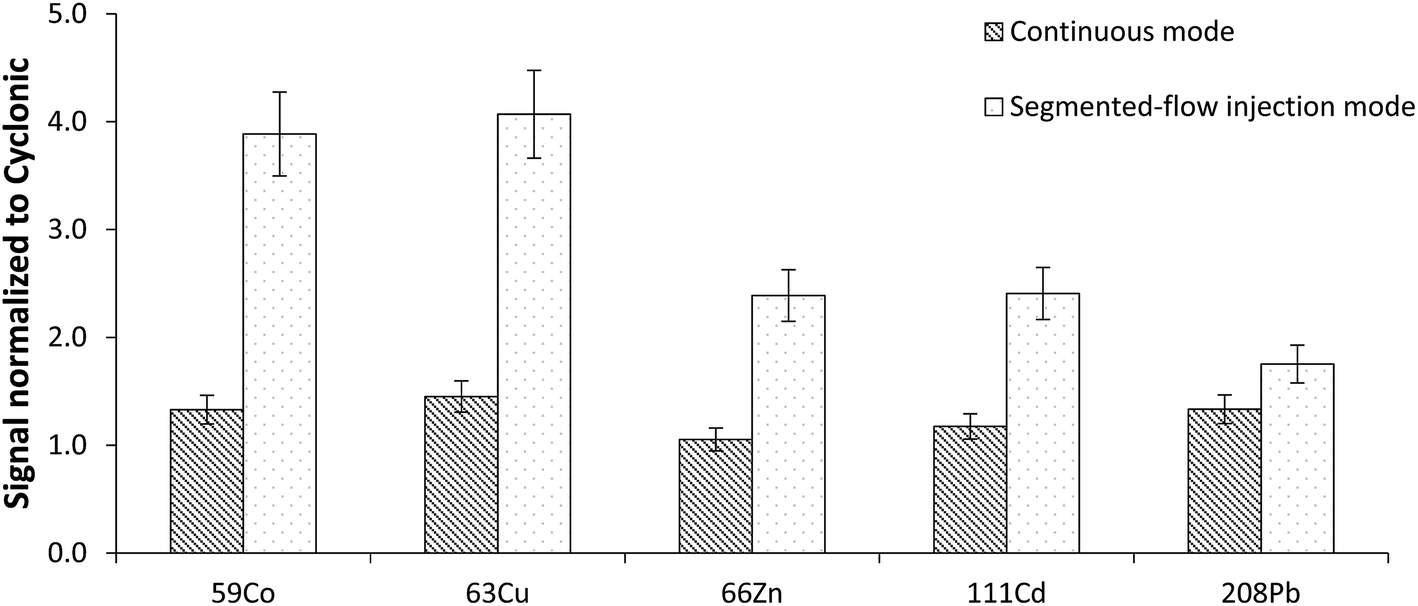 | ||
| Fig. 3 Sensitivities obtained with the hTISIS were normalized to those encountered with the cyclonic spray chamber, both in continuous- and segmented-flow regimes. Blood samples were diluted to 1:25 with deionized water. The hTISIS temperature was set at 200 °C. The dashed bars represent the continuous mode, whereas the dotted bars represent the segmented-flow (10 μL) injection mode. A NexION 300X ICP-MS was used for this experiment. Error bars were calculated according to error propagation (n = 5). | ||
3.3. Effect of the sample introduction system on the signal stability
Table 3 summarizes the RSD values for all elements analyzed in continuous as well as in segmented-flow injection mode. In the first case, the relative standard deviation was calculated from five consecutive independent signal measurements, whereas for segmented injection, RSDs were obtained from the peak areas of five replicates. By comparing both datasets, it may be observed that, as expected, the RSD values were lower when the sample was continuously aspirated than that when working under discrete sample aspiration mode. This trend could be due to small changes in the sample volume injected into the air carrier stream. From Table 3 it is also obvious that, particularly in discrete mode, RSDs for the hTISIS were of the same order as that for the cyclonic spray chamber. An ANOVA was applied and the results revealed that statistically significant differences existed under continuous mode for the two sample introduction systems (P = 0.023, α = 0.05) although both data sets were acceptable. Regarding the discrete mode, the use of the hTISIS did not degrade the signal stability with respect to a conventional sample introduction system.| RSD (%) | Cyclonic | hTISIS | ||
|---|---|---|---|---|
| Continuous | Segmented-flow injection | Continuous | Segmented-flow injection | |
|
a 1:25 diluted blood sample; hTISIS temperature: 200 °C; injected sample volume in segmented-flow injection mode: 10 μL.
|
||||
| 59Co | 4.2 | 16.2 | 6.4 | 5.0 |
| 63Cu | 0.5 | 5.2 | 4.2 | 5.2 |
| 66Zn | 0.6 | 10.1 | 2.7 | 8.0 |
| 111Cd | 1.5 | 9.0 | 3.5 | 8.9 |
| 208Pb | 1.2 | 7.5 | 4.0 | 4.9 |
3.4. Matrix effects
ICP-MS matrix effects may be caused by the sample introduction system as well as by the plasma and the interface. In the former case, the mass of analyte leaving the spray chamber varies as a function of the matrix considered. In the latter situation, the ion transmission is affected by the matrix. Space-charge effects in turn can be considered as the processes occurring in and just after the interface. According to these effects, heavy elements are less affected by the presence of easily ionized elements than the light isotopes.38–42 The NexION 300X ICP-MS instrument used in this study displays a three-aperture interface to cope with space-charge effects. With this interface, the pressure is gradually reduced in smaller steps than that with other instruments equipped with only two apertures (sampler and skimmer). This fact limits the ion beam divergence and prevents the deposition of the sample on the spectrometer inner surfaces by reducing the extent of space-charge effects.43,44To evaluate the magnitude of the matrix effects, signal obtained for the 1:25 diluted sample was divided by that measured for the 1:10 dilution sample. These were the two most concentrated samples and thus the interferences were expected to be more severe than those for the rest. The effect of the hTISIS temperature is considered in Fig. 4 for both continuous (Fig. 4a) and air-segmented (Fig. 4b) modes. In the absence of interferences, the ratios obtained should be equal to the ratio between the dilution factors, irrespective of the element and matrix considered. As calculated from the dilution factors considered and by assuming a 10% deviation as acceptable, the target value was set at 0.40 ± 0.04. To alleviate the solid deposit formation at the ICP-MS interface, an injected volume of 5 μL was used. When the sample was continuously delivered to the nebulizer at room temperature (Fig. 4a), the ratios were generally very close to 0.4. Furthermore, the increase in the chamber temperature to up to 60–80 °C also led to acceptable results. Regarding the results found for the air-segmented injection mode (Fig. 4b), matrix effects were observed (i.e., average ratios higher than 0.4) when the hTISIS was operated at room temperature. However, these effects became less severe as the hTISIS temperature increased. This observation was in agreement with the fact that the aerosol transport interferences were alleviated while working at 80 °C.
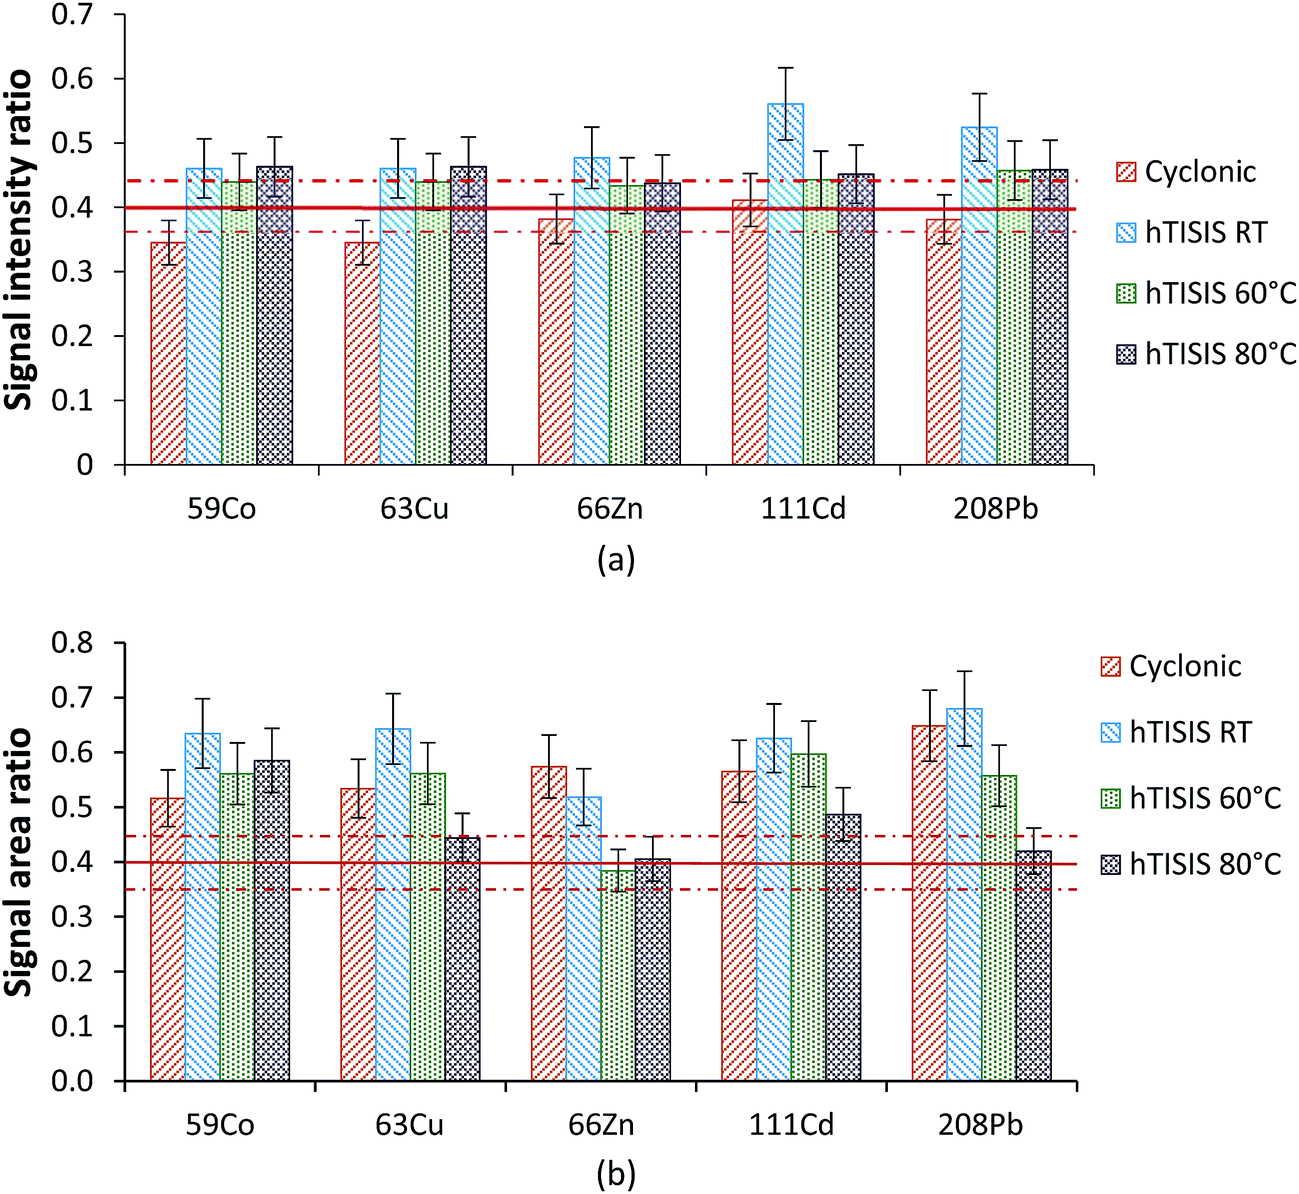 | ||
| Fig. 4 Intensity ratios obtained for two different sample dilution factors (1:25 and 1:10) under different operating conditions (a) continuous injection and (b) 5 μL air-segmented injection. A NexION 300X ICP-MS was used for this experiment. Error bars were calculated according to error propagation (n = 5). | ||
3.5. Oxides and doubly charged ions
When the hTISIS temperature was increased, the amount of solvent delivered to the plasma increased and in turn, the oxide production in the plasma also increased (Fig. 5). When considering the room temperature conditions, it was noticed that the increase factor in terms of oxide ratios was similar to that observed for the analytical signals. Thus, for instance, in the segmented-flow injection mode, the oxide ratios increased by a factor of 1.4 when the hTISIS chamber was used at room temperature with respect to the cyclonic chamber. Moreover, 63Cu and 110Cd signals increased by 1.3 and 1.1, respectively. Therefore, under these conditions, the rise in the oxide ratio was due to an increase in the amount of solution reaching the plasma. However, at 200 °C, BaO+/Ba+ ratio was nine times higher than that encountered at room temperature, whereas there was a 4.2- and 3.0-fold ionic signal intensity improvement for 63Cu and 110Cd, respectively. These discrepancies at high temperatures could be partially attributed to the slight decrease in the doubly charged ion ratios as the hTISIS temperature increased. Surprisingly, the doubly charged ion fraction decreased only by about 30%, which could be assigned to the low sample consumption rates chosen.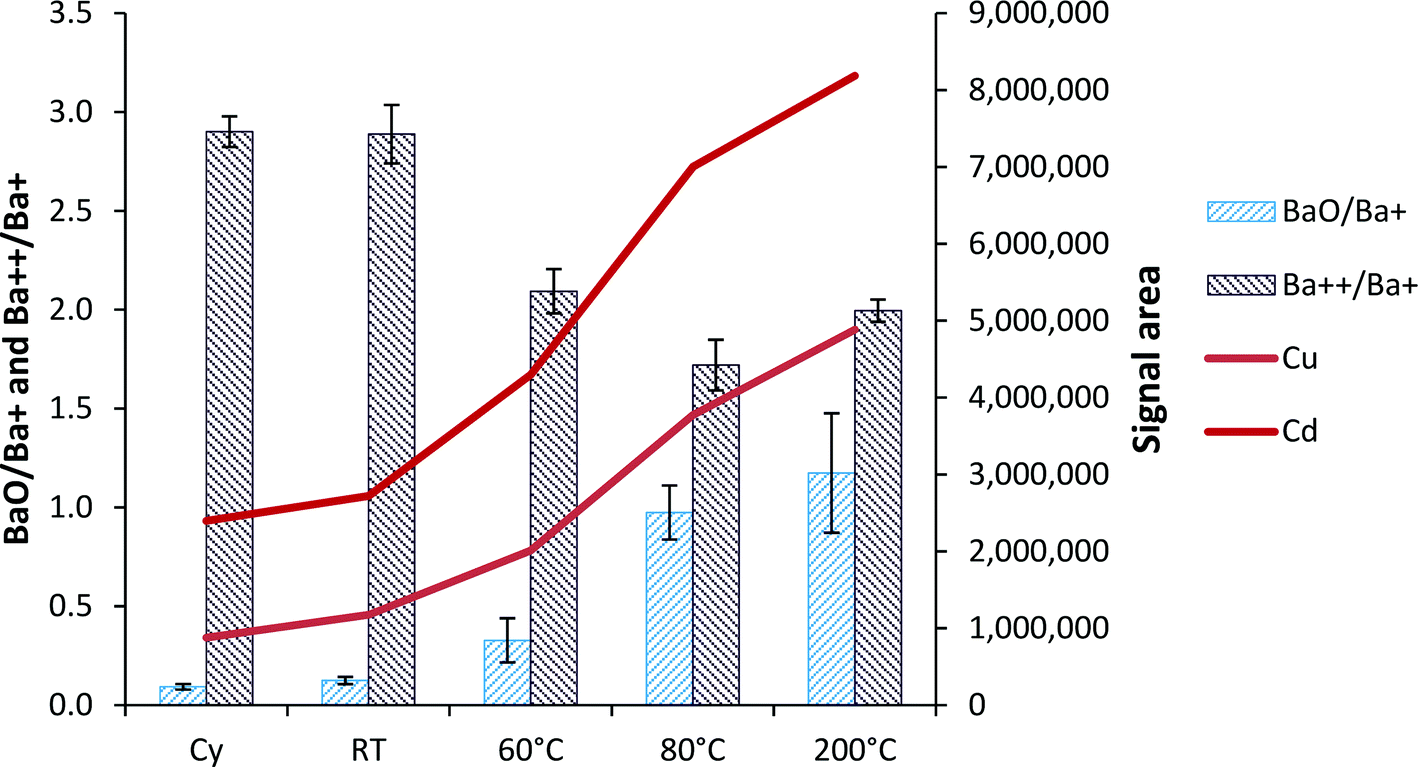 | ||
| Fig. 5 Variation of the 63Cu, 110Cd (values for Cd have been multiplied by a factor of 1000) signal intensities, and barium oxide and doubly charged ions ratios, with the hTISIS temperature and for the cyclonic spray chamber in air-segmented mode (injected volume: 10 μL). A NexION 300X ICP-MS was used for this experiment. Error bars were calculated according to the standard deviation obtained from the absolute standard deviation (n = 5). | ||
3.6. Analysis of the blood reference material (RM)
According to the previously obtained data, the best conditions in terms of sensitivity corresponded to the hTISIS operated at 200 °C. In addition, a 1:25 dilution factor represented a good compromise in terms of sensitivity and matrix effects. Higher sample concentrations caused the formation of solid deposits on both the inner chamber walls and the spectrometer interface. Moreover, higher dilution factors resulted detrimental in terms of sensitivity. Thus, a blood reference material with a 1:25 dilution factor was analyzed.
Table 4 summarizes the concentrations obtained with the cyclonic spray chamber and the hTISIS in both continuous and discrete modes. To quantify these elements, a series of plain water standards were employed. By considering the confidence intervals, it could be observed that with the cyclonic spray chamber, only copper and lead provided acceptable results in continuous mode, whereas in the segmented-flow injection mode, acceptable results were obtained for cobalt, copper, and zinc. With the hTISIS operated in continuous sample aspiration, it was noticed that the concentrations for cadmium, cobalt, and zinc were different with respect to the reference values. The appearance of matrix effects and/or the too high LODs could be the main reasons to account for the eventual deviations from the reference values. Finally, when the hTISIS was operated in a segmented-flow injection mode at 200 °C, concentrations similar to the reference ones were obtained for the five elements under study.
| Element | Reference values | Cyclonic continuous | hTISIS continuous 200 °C | Cyclonic segmented | hTISIS segmented 200 °C |
|---|---|---|---|---|---|
|
a NexION 300X; 1:25 sample dilution factor; confidence intervals were calculated as ±(t s)/(N)1/2 being N = 5.
|
|||||
| Co | 5.8 ± 1.2 | 8.0 ± 0.7 | 1.9 ± 0.7 | 5.3 ± 0.9 | 5.5 ± 1.2 |
| Cu | 1330 ± 270 | 1286 ± 8 | 1695 ± 115 | 1375 ± 74 | 1160 ± 82 |
| Zn | 6500 ± 300 | 8775 ± 63 | 9085 ± 392 | 6137 ± 831 | 6509 ± 863 |
| Cd | 5.8 ± 0.2 | 1.3 ± 0.4 | 8.8 ± 0.5 | 12 ± 3 | 7 ± 2 |
| Pb | 310 ± 62 | 366 ± 3 | 324 ± 23 | 443 ± 19 | 376 ± 30 |
3.7. Analysis of the real samples
Nowadays, a current trend in the analysis of biological fluids, such as blood, by means of clinical laboratories are the so-called home-based collection protocols, giving rise to the so-called dried blood spots.37,45 The involved procedures, which are minimally invasive, are especially interesting for the screening of newborns and for controlling people with limited mobility or living in areas with restricted access to hospitals/clinical labs. Once the blood samples are taken (a few droplets are deposited on a clinical filter paper or a similar device) and dried, they can be sent by ordinary mail to the laboratory, as they are stable and easy to transport and store.Among the different devices used for such protocols, volumetric absorptive microsampling (VAMS) is a new one that is particularly promising as it permits to collect a constant and known amount of blood in a very simple way.46,47 Furthermore, the collected sample volume is independent of the hematocrit level.48 It has been very recently demonstrated that when aiming at multi-element analysis, this methodology allows the recovery of the sample in a simple way by applying a single extraction step with 1% HNO3 without any further manipulation.49 However, the use of a conventional spray chamber and nebulizer requires a 100-fold dilution to be able to obtain the sample that is sufficient for the analysis. Using the hTISIS, in principle, a much lower value could be used with the subsequent improvement in the LODs, even for labs in which an ICP-MS/MS device (used in ref. 49) is not available.
As abovementioned, hTISIS was also coupled to a spectrometer containing an accessory for aerosol phase dilution (i.e., High Matrix Introduction, HMI, system). Compared with NexION, with 7700x spectrometer, it was possible to perform the quantification of the 1:10 diluted whole blood samples by lowering the injected sample volume down to 2.5 μL. This was also possible because in this case, a high efficiency micronebulizer (HEN) having a narrow capillary (80–100 mm id) and hence, a low dead volume was employed. Up to 11 elements were analyzed with this device. Again, aqueous standards were employed for calibration. It could be positively concluded that for all the evaluated elements, the obtained concentrations were in agreement with the reference ones (Table 5).
:10 whole blood diluted reference sample. Injected volume: 2.5 μL
| Isotope | Seronorm L-3. Reference values | Seronorm L-3. This work | Recovery (%) |
|---|---|---|---|
| 9Be | 12.5 ± 2.5 | 13.6 ± 2.2 | 109 |
| 51V | 5.7 ± 1.1 | 5.9 ± 0.6 | 104 |
| 53Cr | 23.2 ± 4.7 | 31.0 ± 4.0 | 134 |
| 55Mn | 47.3 ± 9.5 | 40.0 ± 7.0 | 86 |
| 63Cu | 2470 ± 250 | 2890 ± 170 | 117 |
| 65Cu | 2470 ± 250 | 2930 ± 220 | 119 |
| 75As | 30.4 ± 7.3 | 28.9 ± 2.2 | 95 |
| 78Se | 272 ± 55 | 265 ± 28 | 97 |
| 111Cd | 12.1 ± 1.3 | 12.2 ± 2.5 | 100 |
| 121Sb | 22.4 ± 4.5 | 24.3 ± 1.0 | 109 |
| 205Tl | 34.1 ± 6.9 | 36.1 ± 1.8 | 106 |
| 206Pb | 447 ± 46 | 452 ± 17 | 101 |
| 208Pb | 447 ± 46 | 410 ± 17 | 92 |
According to the data in Table 5, it was observed that the method developed could be applied for the analysis of blood samples with a 1:10 dilution factor. Furthermore, quantitative data corresponding to 11 elements were acquired with a single 2.5 μL injection volume. This made the hTISIS especially suitable for the analysis of blood microsamples and fully compatible with the home-based collection protocols.
The developed method was finally applied for the analysis of three real blood samples (Table 6). The element quantification was performed in two different ways: (i) using aqueous standards and (ii) single standard calibration, where the reference sample acted as a matrix-matched standard. The results revealed an acceptable concordance between the concentrations obtained with both methods for 51V, 75As, 78Se, 121Sb, and 205Tl. Only for copper, the results significantly differed depending on the calibration method employed. This could be due to the differences between the matrices of a real blood sample and the reference one. In a different experiment, real samples were spiked and the recoveries were obtained by applying external calibration with plain water standards. According to the results, this parameter ranged from 96% (55Mn) to 109% (121Sb), thus giving an additional proof for the accuracy of the employed procedure.
| Isotope | Real sample 1 | Real sample 2 | Real sample 3 | |||
|---|---|---|---|---|---|---|
| Calibration standards | Reference material | Aqueous | Reference material | Aqueous | Reference material | Aqueous |
| a Injected volume: 2.5 μL. | ||||||
| 9Be | <2 | <2 | <2 | <2 | <2 | <2 |
| 51V | 1.5 ± 0.4 | 2.1 ± 0.5 | 1.5 ± 0.5 | 2.4 ± 0.8 | 1.6 ± 0.6 | 2.5 ± 0.8 |
| 53Cr | <5 | <5 | <5 | <5 | <5 | <5 |
| 55Mn | <31 | <31 | <31 | <31 | <31 | <31 |
| 63Cu | 1522 ± 93 | 2029 ± 116 | 1242 ± 54 | 1863 ± 150 | 713 ± 80 | 865 ± 134 |
| 65Cu | 1552 ± 95 | 2028 ± 112 | 1294 ± 94 | 1905 ± 198 | 714 ± 83 | 973 ± 163 |
| 75As | 2.3 ± 0.3 | 3.1 ± 0.3 | 8.4 ± 0.5 | 12.2 ± 1.2 | 3.1 ± 0.7 | 4.3 ± 0.8 |
| 78Se | 145 ± 20 | 195 ± 22 | 124 ± 18 | 188 ± 29 | 119 ± 22 | 155 ± 23 |
| 111Cd | <2 | <2 | <2 | <2 | <2 | <2 |
| 121Sb | 1.3 ± 0.3 | 1.7 ± 0.4 | 2.2 ± 0.3 | 3.1 ± 0.4 | 1.7 ± 0.5 | 2.1 ± 0.5 |
| 205Tl | 18.0 ± 3.8 | 23.5 ± 4.3 | 23.5 ± 3.5 | 33.1 ± 5.8 | 27.3 ± 4.2 | 35.2 ± 4.1 |
| 206Pb | <36 | <36 | <36 | <36 | <36 | <36 |
| 208Pb | <26 | <26 | <26 | <26 | <26 | <26 |
Finally, by comparing the element concentrations determined in the real blood samples with those of the reference samples (i.e., containing pathological levels of elements), it was concluded that all three individuals had metal levels below the pathological levels.
As a final step, potential contaminations from the VAMS tip were evaluated. In this case, the hydrophilic polyolefin tips were washed with 100 μL of the nitric acid solution and the element concentrations in the resulting extracts were determined by ICP-MS. The corresponding results are shown in Table 7. As previously stated in ref. 49, elements, such as vanadium, chromium, and aluminum, were present in the solid sorbent. Based on the data obtained in the present study it can be stated that although significant concentrations of seven elements were detected in the obtained solutions, it was possible to quantify all of them in the samples with an acceptable accuracy (see Table 5).
| Isotope | Concentration |
|---|---|
| a Concentration after taking into account the 10-fold dilution. Confidence intervals were calculated as ±(t s)/(N)1/2 being N = 5. | |
| 51V | 5.9 ± 0.7 |
| 53Cr | 24.4 ± 1.6 |
| 55Mn | 89 ± 18 |
| 63Cu | 714 ± 349 |
| 65Cu | 759 ± 359 |
| 111Cd | 3.4 |
| 205Tl | 7.4 |
| 206Pb | 100 ± 12 |
| 208Pb | 98 ± 9 |
4. Conclusions
The present work has demonstrated the applicability of the hTISIS for the analysis of low volumes of whole blood under two different working modes: continuous and air-segmented. The results reveal that with a discrete sample introduction mode of 2.5–10 μL volumes, hTISIS displayed an improved performance over a conventional sample introduction system in terms of sensitivity and detection limits. Besides, using the hTISIS does not degrade the signal stability and the matrix effects are alleviated, thus making it possible to perform a calibration with a set of plain water standards. Moreover, the methodology requires minimal sample preparation involving only the sample evaporation, extraction, and dilution. Although a single sample preparation requires more than 1 hour, many assays could be easily done in parallel, hence increasing the actual sample throughput. Regarding the quantification of the whole blood reference material, best results are achieved while working under the segmented-flow injection mode. By using this total sample consumption system, it is possible to perform microsample analyses following a home-based collection protocol.Acknowledgements
The authors acknowledge the funding from CTQ2015-64684-P (MINECO/FEDER) and the Aragón Government (Fondo Europeo de Desarrollo Regional). The authors would also like to thank Geoff Coleman for the loan of the two glass pneumatic concentric nebulizers and to the Hospital Universitario Miguel Servet for their cooperation. Águeda C. would like to thank the Vice-Presidency for Research of the University of Alicante (ref. UAFPU2015-5990), and the Generalitat Valenciana, Spain (ref. ACIF/2016/042) for the predoctoral grants.References
- M. Krachler and K. J. Irgolic, J. Trace Elem. Med. Biol., 1999, 13, 157–169 CAS.
- A. Bazzi, J. O. Nriagu and A. M. Linder, J. Environ. Monit., 2008, 10, 1226–1232 RSC.
- A. N. Rao, J. Health Allied Sci., 2005, 4, 1–9 Search PubMed.
- C. Bonnefoy, A. Menudier, C. Moesch, G. Lachatre and J. M. Mermet, J. Anal. At. Spectrom., 2002, 17, 1161–1165 RSC.
- K. Klotz, W. Weistenhöfer and H. Drexler, Cadmium: From Toxicity to Essentiality, vol. 11, pp. 85–98, Springer Science + Business Media Dordrecht, London, 2013 Search PubMed.
- T. Martinez, J. Lartigue, P. Avila-Perez, G. Zarazua, M. Navarrete, S. Tejeda and A. Ramirez, J. Radioanal. Nucl. Chem., 2004, 259, 511–514 CrossRef CAS.
- O. S. Ertas and H. Tezel, J. Pharm. Biomed. Anal., 2004, 36, 893–897 CrossRef CAS PubMed.
- P. J. Parsons and F. Barbosa Jr, Spectrochim. Acta, Part B, 2007, 62, 992–1003 CrossRef.
- A. Khuder, M. A. Bakir, J. Karjou and K. M. Sawan, J. Radioanal. Nucl. Chem., 2007, 273, 435–442 CrossRef CAS.
- J. H. Wang, Y. L. Yu, Z. Du and Z. L. Fang, J. Anal. At. Spectrom., 2004, 19, 1559–1563 RSC.
- E. J. Daftsis and G. A. Zachariadis, Microchim. Acta, 2008, 160, 405–411 CrossRef CAS.
- B. Kollander, M. Andersson and J. Pettersson, Talanta, 2010, 80, 2068–2075 CrossRef CAS PubMed.
- J. P. Goullé, L. Mahieu, J. Castermant, N. Neveu, L. Bonneau, G. Lainé, D. Bouige and C. Lacroix, Forensic Sci. Int., 2005, 153, 39–44 CrossRef PubMed.
- W. Cieslak, K. Pap, D. R. Bunch, E. Reineks, R. Jackson, R. Steinle and S. Wang, Clin. Biochem., 2013, 46, 266–270 CrossRef CAS PubMed.
- J. Vrijens, P. Couck, C. Schroijen, W. Baeyens and M. Leermakers, J. Anal. At. Spectrom., 2011, 26, 2819–2826 RSC.
- K. Kobayashi, Y. Katsuya, R. Abdulah and H. Koyama, Biol. Trace Elem. Res., 2007, 115, 87–93 CrossRef CAS PubMed.
- C. Bonnefoy, A. Menudier, C. Moesch, G. Lachatre and J. M. Mermet, Anal. Bioanal. Chem., 2005, 383, 167–173 CrossRef CAS PubMed.
- B. L. Batista, D. Grotto, J. L. Rodrigues, V. C. Souza and F. Barbosa Jr, Anal. Chim. Acta, 2009, 646, 23–29 CrossRef CAS PubMed.
- A. Alimonti, F. Petrucci, B. Santucci, A. Cristaudo and S. Caroli, Anal. Chim. Acta, 1995, 306, 35–41 CrossRef CAS.
- J. Szpunar, J. Bettmer, M. Robert, H. Chassaigna, K. Cammann, R. Lobinski and O. F. X. Donard, Talanta, 1997, 44, 1389–1396 CrossRef CAS PubMed.
- R. Gajek, F. Barley and J. She, Anal. Methods, 2013, 5, 2193–2202 RSC.
- S. D'Ilio, N. Violante, M. Di Gregorio, O. Senofonte and F. Petrucci, Anal. Chim. Acta, 2006, 579, 202–208 CrossRef PubMed.
- B. L. Batista, J. L. Rodrigues, J. A. Nunes, V. C. Souza and F. Barbosa Jr, Anal. Chim. Acta, 2009, 639, 13–18 CrossRef CAS PubMed.
- S. D'Ilio, N. Violante, C. Majorani and F. Petrucci, Anal. Chim. Acta, 2011, 698, 6–13 CrossRef PubMed.
- E. Bolea-Fernandez, L. Balcaen, M. Resano and F. Vanhaecke, Anal. Chem., 2014, 86, 7969–7977 CrossRef CAS PubMed.
- E. Paredes, M. Grotti, J. M. Mermet and J. L. Todolí, J. Anal. At. Spectrom., 2009, 24, 903–910 RSC.
- M. Grotti, F. Ardini and J. L. Todolí, Anal. Chim. Acta, 2013, 767, 14–20 CrossRef CAS PubMed.
- J. L. Todolí and J. M. Mermet, J. Anal. At. Spectrom., 2002, 17, 345–351 RSC.
- J. L. Todoli and J. M. Mermet, J. Anal. At. Spectrom., 2004, 19, 1347–1353 RSC.
- J. L. Todolí and J. M. Mermet, Trends Anal. Chem., 2005, 24, 107–116 CrossRef.
- F. Ardini, M. Grotti, R. Sanchez and J. L. Todolí, J. Anal. At. Spectrom., 2012, 27, 1400–1404 RSC.
- A. Bazzano, K. Latruwe, M. Grotti and F. Vanhaecke, J. Anal. At. Spectrom., 2015, 30, 1322–1328 RSC.
- E. Paredes, D. G. Asfaha, E. Ponzevera, C. Brach-Papa, M. Van Bocxstaele, J. L. Todolí and C. R. Quétel, J. Anal. At. Spectrom., 2011, 26, 1372–1379 RSC.
- R. Sanchez, C. Sanchez, C. P. Lienemann and J. L. Todolí, J. Anal. At. Spectrom., 2015, 30, 64–101 RSC.
- B. S. Duersch, Y. Chen, A. Ciocan and P. B. Farnsworth, Spectrochim. Acta, Part B, 1998, 53, 569–579 CrossRef.
- Agilent library applications, https://www.agilent.com/cs/library/applications/5989-4905EN.pdf, accessed October 2016.
- L. Rello, M. Armendía, M. A. Belarra and M. Resano, Bioanalysis, 2015, 7, 2057–2070 CrossRef CAS PubMed.
- M. M. Fraser and D. Beauchemin, Spectrochim. Acta, Part B, 2000, 55, 1705–1731 CrossRef.
- G. R. Gillson, D. J. Douglas, J. E. Fulford, K. W. Halligan and S. D. Tanner, Anal. Chem., 1988, 60, 1472–1474 CrossRef CAS.
- K. G. Heumann, S. M. Gallus, G. Rädlinger and J. Vogl, J. Anal. At. Spectrom., 1998, 13, 1001–1008 RSC.
- L. A. Allen, J. J. Leach and R. S. Houk, Anal. Chem., 1997, 69, 2384–2391 CrossRef CAS PubMed.
- I. I. Stewart and J. W. Olesik, J. Am. Soc. Mass Spectrom., 1999, 10, 159–174 CrossRef CAS.
- N. Praphairaksit and R. S. Houk, Anal. Chem., 2000, 72, 2356–2361 CrossRef CAS PubMed.
- S. D. Tanner, L. M. Cousins and D. J. Douglas, Appl. Spectrosc., 1994, 48, 1367–1372 CrossRef CAS.
- P. A. Demirev, Anal. Chem., 2013, 85, 779–789 CrossRef CAS PubMed.
- P. Denniff and N. Spooner, Anal. Chem., 2014, 86, 8489–8495 CrossRef CAS PubMed.
- N. Spooner, P. Denniff and L. Michielsen, et al. , Bioanalysis, 2015, 7, 653–659 CrossRef CAS PubMed.
- P. M. M. De Kesel, et al. , Anal. Chim. Acta, 2015, 881, 65–73 CrossRef CAS PubMed.
- E. Bolea-Fernández, K. Phan, L. Balcaen, M. Resano and F. Vanhaecke, Anal. Chim. Acta, 2016, 941, 1–9 CrossRef PubMed.
| This journal is © The Royal Society of Chemistry 2017 |