 Open Access Article
Exploring DNA–protein interactions on the single DNA molecule level using nanofluidic tools
Karolin
Frykholm
,
Lena K.
Nyberg
and
Fredrik
Westerlund
 *
*
Department of Biology and Biological Engineering, Chalmers University of Technology, Gothenburg, Sweden. E-mail: fredrik.westerlund@chalmers.se; Fax: +46-31-772 3858; Tel: +46-31-772 3049
First published on 22nd June 2017
Abstract
DNA–protein interactions are at the core of the cellular machinery and single molecule methods have revolutionized the possibilities to study, and our understanding of these interactions on the molecular level. Nanofluidic channels have been extensively used for studying single DNA molecules during the last twelve years and in this review, we discuss how this experimental platform has been extended to studies of DNA–protein interactions. We first present how the design of the device can be tailored for the specific DNA–protein system studied and how the channels can be passivated to avoid non-specific binding of proteins. We then focus on describing the different kinds of DNA-interacting proteins that have been studied in nanofluidic devices, including proteins that compact DNA and proteins that form filaments on DNA. Our main objective is to highlight the diverse functionalities of DNA–protein systems that have been characterized using nanofluidic structures and hence demonstrate the versatility of these experimental tools. We finally discuss potential future directions studies of DNA–protein complexes in nanochannels might take, including specific DNA–protein systems that are difficult to analyze with traditional techniques, devices with increased complexity, and fully integrated lab-on-a-chip devices for analysis of material extracted from (single) cells.
Insight, innovation, integrationSingle molecule methods have revolutionized our understanding of DNA–protein interactions during the last two decades. In this review, we present several examples of how nanofluidic channels have been used to study a diversity of such interactions and discuss the benefits of this novel platform compared to existing techniques. In particular, we address the fact that nanofluidic channels allow visualization and manipulation of single DNA molecules without attaching any handles to the DNA ends. This opens up for use in fully integrated lab-on-a-chip devices for direct analysis of material extracted from cells. |
1. Introduction
Single DNA molecule methods have revolutionized the understanding of how DNA interacts with proteins in important biomolecular processes.1–4 Single molecule techniques have the advantage, in contrast to traditional averaging bulk measurements, of revealing heterogeneous behaviors and/or rare events, as well as enabling studies of dynamics in real time. This is particularly important since many processes in the cell, such as DNA replication, transcription and recombination, are carried out by one or a few proteins and hence the bulk picture of these reactions is less important.Optical4 and magnetic5 tweezers are among the pioneering methods for single molecule studies of DNA and DNA–protein complexes. In such experiments, DNA is tethered in one or both ends to a bead that is held on to by the tweezers. The DNA–protein complex is then stretched and/or twisted and the response of the complex is recorded. In recent years the combination of fluorescence microscopy and tweezers experiments has increased the amount of detail that can be obtained from a single DNA molecule experiment.3,6 Other examples of single molecule studies of DNA–protein interactions are based on attaching DNA to surfaces and visualizing the DNA–protein complexes with fluorescence microscopy, in particular TIRF microscopy.7 One prominent example of such studies is DNA curtains. Pioneered by Eric Greene a decade ago, this method is based on stretching many single DNA molecules, anchored to a lipid bilayer, in parallel and imaging them using TIRF microscopy.8 The available single DNA molecule methods have vastly improved our understanding of DNA–protein interactions and are likely to be used even more in the coming years along with new techniques with improved or complementary capabilities.
In 2004 Tegenfeldt et al. demonstrated that single DNA molecules can be stretched out in nanofluidic channels (∼100 × 100 nm2) and that the extension of the DNA in the channels scales linearly with the contour length (number of basepairs).9 Since then many studies of nanoconfined DNA have been presented, utilizing different types of nanofluidic structures, such as the ones illustrated in Fig. 1A. The polymer physics of nanoconfined DNA has been thoroughly investigated and we refer the interested reader to recent reviews for details.10,11 In short, two main regimes have been extensively characterized on a theoretical basis (Fig. 1B). In the deGennes regime,12 valid for channel dimensions much larger than the persistence length of DNA (∼50–100 nm), the DNA is divided into a series of blobs where the DNA in each blob behaves as free DNA in solution. In the Odijk regime,13 valid in channels that are smaller than the persistence length of DNA, the DNA deflects off the channel walls. In practice, most of the experiments on DNA in nanochannels are performed in channels with dimensions in between these two extremes, where theoretical descriptions of the DNA behavior are less accurate. Recent theoretical developments have however also been made for DNA under experimentally relevant confinement where the most important regime is called the extended deGennes regime and occurs when the channel is too small to make the traditional deGennes regime valid.14–16 Recently a one-parameter theory for DNA extension throughout the relevant regimes was proposed.17
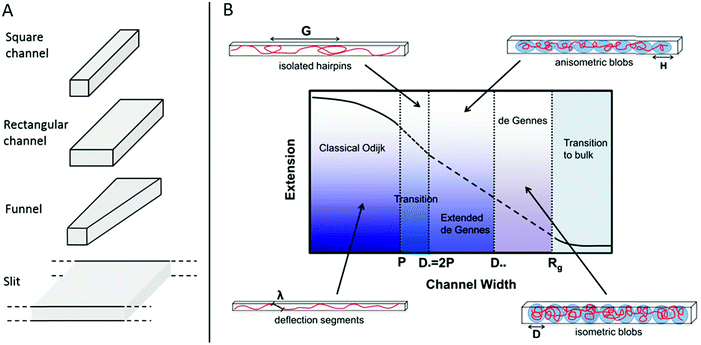 | ||
| Fig. 1 (A) Schematic of four potential geometries of nanostructures used for studies of single DNA molecules. (B) An overview of the physical regimes described for nanoconfined polymers. The two main regimes are the deGennes regime (channel width, D, much larger than the polymer persistence length, P) where the polymer conformation consists of a series of blobs, and the classical Odijk regime (D < P) where the polymer deflects off the channel walls. For many experimental conditions in DNA and DNA–protein interaction studies, the valid regimes are somewhere in between these two. G is the global persistence length of isolated hairpin backbends, H is the physical extension of a blob along the channel, λ is the Odijk deflection length and Rg is the polymer radius of gyration. Republished with permission of IOP Publishing, from ref. 10; permission conveyed through Copyright Clearance Center, Inc. All rights reserved. | ||
Already a year after the first paper on DNA in nanochannels, two papers on using nanochannels for studying DNA–protein interactions were presented. In the first, Riehn et al. demonstrated restriction mapping in nanochannels.18 Restriction mapping is a common method to, for example, identify bacterial strains and species and is traditionally performed by digesting DNA with a restriction enzyme in solution and running a gel to separate the DNA pieces and obtain a pattern of fragments unique to that DNA. By performing the restriction digestion inside the nanochannels, Riehn et al. obtained both the size and the order of the fragments, information that is not accessible in bulk experiments. In the second paper, Wang et al. studied sequence specific binding of the LacI repressor to DNA.19 The DNA used was tailored to have a long repeat of the LacI target sequence and Wang et al. demonstrated that LacI binds only to the predicted sites. The ability to identify sequences on DNA in nanochannels has been important in recent DNA–protein interaction studies, but also founded the whole field of optical DNA mapping in nanochannels.20
This review aims to give an overview of advances in the use of nanochannels and other nanofluidic techniques for studying DNA–protein interactions after the first two seminal papers discussed briefly above. We start by describing the devices used and how the design can be tailored for the project of interest. We have then divided the proteins into different groups, such as proteins that change the extension of DNA via crowding, proteins that compact DNA and proteins that form filaments on DNA. Our goal is to demonstrate that nanofluidic structures are well suited for studies of a wide range of proteins interacting with DNA. Finally, we discuss potential future directions for this growing field of research.
2. Nanofluidic devices
At the heart of studying DNA–protein interactions in nanofluidic devices is the device itself. The first version of device used, for example in the pioneering study by Tegenfeldt et al.,9 simply consisted of straight channels with fixed dimensions. The DNA was introduced into the channels using electrophoresis and imaged under static conditions.In studies of DNA–protein interactions, it is often desirable to follow the response of the DNA, or the DNA–protein complex, to the addition or removal of proteins or other reagents. It is thus important to be able to exchange reaction liquids while the DNA, or the DNA–protein complex, is positioned in the device. To do that, the molecule under study needs to be trapped in order not to be flushed away during buffer exchange. This is challenging, since the nanoconfined DNA is free in solution and not tethered to any handles. In studies of non-modified, non-tethered DNA under nanoconfinement, experimental designs that facilitate control of reaction conditions have been reported. In the restriction mapping study by Riehn et al. discussed in the introduction, it was desired that the restriction would only occur inside the nanochannels.18 Mixing all ingredients outside of the channels would result in the restriction reaction occurring before the DNA was imaged in the channels. To overcome this problem, the Mg2+ ions required for the restriction were excluded from the mixture of restriction enzyme and DNA. This mixture was then added to one end of the nanochannels and Mg2+ ions to the other end. By subsequently applying an electric field across the nanochannels the Mg2+ ions and the DNA with enzyme bound met inside the nanochannels only and the reaction occurred only where desired (Fig. 2A).
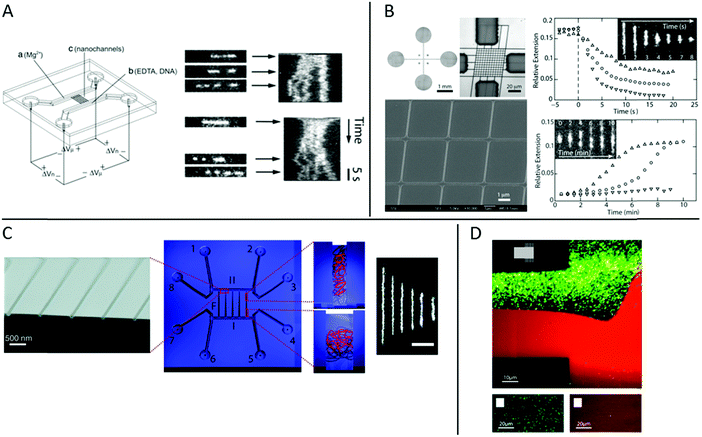 | ||
| Fig. 2 (A) Left: Schematic illustration of the chip and experimental setup for restriction mapping in nanochannels. All reagents are added to the right-hand side of the chip, except the Mg2+. When an electric field is applied the DNA with enzyme bound and Mg2+ move in opposite directions and meet in the nanochannels where the restriction reaction occurs. Right: Two experimental time traces of restriction mapping of λ-DNA using the SmaI restriction enzyme in 120 × 120 nm2 channels. Reproduced from ref. 18. Copyright (2005) National Academy of Sciences, USA. (B) Left: Bright-field optical image of cross-channel device (top left), optical image of master stamp for chip fabrication (top right) and scanning electron micrograph of central HSQ master (bottom). Right: Condensation of DNA by protamine (top) and decondensation of DNA–protamine complex by high salt buffer (bottom). Protein concentrations are 1 (△), 3 (○) and 5 (▽) μM for both graphs. Insets show time lapse series for condensation (5 μM) and decondensation (1 μM), respectively. Reproduced from ref. 21 with permission from The Royal Society of Chemistry. (C) Center: Schematic layout illustration of a nanofunnel device with fixed depth (60 nm) but increasing width (100 to 1000 nm) over a distance of 450 μm. The nanofunnel array (F) is connected in both ends by two nanoslits (I + II) of same depth that are in turn connected two and two to eight reservoirs (1—8). Right: Illustrations and real experiments of DNA trapped at different nanochannel widths. The scale bar corresponds to 5 μm. Left: Scanning electron micrograph of narrow end of nanofunnels. Reprinted with permission from ref. 23. Copyright (2009) American Chemical Society. (D) Top: Fluorescence micrograph of a nanoslit (150 nm deep) in the center and arrays of nanochannels (150 × 120 nm2) in the upper and lower right-hand side corners (see the schematic in the inset) partially coated with a lipid bilayer (red). Streptavidin-coated quantum dots (green) bind nonspecifically to uncoated areas. Bottom left: Fluorescence micrograph of streptavidin-coated quantum dots (green) in an array of BSA-coated nanochannels (100 × 150 nm2). Bottom right: Fluorescence micrograph of streptavidin-coated quantum dots (green) in an array of nanochannels (100 × 150 nm2) coated with a lipid bilayer (red). All images were recorded after a substantial flow has been applied across the channels to remove weakly bound quantum dots. Reprinted from ref. 32. Copyright (2012) American Chemical Society. | ||
A more sophisticated chip design was demonstrated by Zhang et al.21 The device used was fabricated in polydimethylsiloxane (PDMS) and features two arrays of parallel nanochannels in a perpendicular configuration (Fig. 2B). The dimensions of the rectangular channels were 250 × 200 nm2 and 150 × 200 nm2 in the two perpendicular directions, respectively. DNA, or other biomolecules, can be introduced, via electrophoresis, into the device through the array of wider nanochannels in one direction, whereas buffer can be exchanged through the intersecting array of nanochannels in the other direction via diffusion.22 In the proof of principle study, the exchange of buffer was demonstrated by monitoring the current in the wider channels upon addition of salt solution through the narrow channels, as well as monitoring the increase in fluorescence upon addition of FITC-labelled protamine. The exchange times were found to be less than one second for NaCl and about three seconds for the protein, in agreement with a diffusion driven process. In addition, experiments of compaction of T4-DNA upon addition of protamine, and unpacking of pre-compacted T4-DNA by increasing salt concentration, demonstrated the functionality of the device (Fig. 2B).
In tweezers experiments the DNA is stretched between two beads and the interaction between DNA and protein is investigated at different degrees of stretching, to for example reveal how the physical properties of the DNA is affected by the protein binding.4 These experiments are typically performed in what is often referred to as the elastic regime, i.e. above 1 pN, where the DNA is fully stretched out in its B-form. The nanofluidic analogy of that principle was coined by Persson et al. who designed a nanofunnel, i.e. a channel where the confinement gradually decreases from the wide to the narrow end (Fig. 2C).23,24 This design allows the same DNA molecule to be investigated at different degrees of confinement. Compared to tweezers, these experiments are performed on DNA that is less stretched out, in what is referred to as the entropic regime. It was demonstrated that the scaling for how the extension of circular and linear DNA varies with confinement is different and also that the scaling differs with varying amounts of intercalated dye bound.23 Nanofluidic funnels have later been used to study proteins like RecA,25 Rad5126 and Cox27 interacting with DNA, as discussed below.
An alternative way of stretching DNA in nanofluidic channels was presented by Matsuoka et al.28 They used PDMS to make nanochannels where DNA and chromatin can be fully stretched. Since PDMS is a soft material it is possible to vary the size of the channels by varying the strain of the material. At a high strain, the channels are open and the biopolymer of interest can be loaded into the channels. By releasing the strain, the channel dimensions decrease and the biopolymer is stretched; for DNA, the stretching is up to 97% of the contour length. The same device was used to visualize epigenetic marks on chromatin extracted from HeLa cells as will be discussed below.
A general challenge when studying DNA–protein complexes under nanoconfinement is avoiding non-specific binding to the channel walls. The extreme surface to volume ratio in a nanofluidic device means that all molecules present in solution will always be close to a surface. Thus, even small tendencies for non-specific binding to the channel walls might cause very large problems in terms of sticking or clogging. To overcome these problems, several different approaches to passivate the nanochannels for DNA–protein interaction studies have been presented. Coating of surfaces with BSA is one of the main techniques for passivation of microfluidic channels and has also been used in nanochannels,18,19,29 sometimes in combination with Nonidet P-40.30,31 An alternative approach was used in a study by Persson et al. who demonstrated that lipid bilayers are perfectly suited for passivating nanofluidic structures.32 Lipid bilayers are smooth 2D liquids that have very few defects which makes them very well suited for passivation. The lipids are introduced into the nanochannels as lipid vesicles that stick to the surface of the microchannels, where they break and fuse to form an intact lipid bilayer. For lipid passivation of nanochannels, the vesicles can either be flushed also through the nanochannels or the lipid bilayer can spread through the nanochannels via capillary forces. That the passivation is superior to standard passivation protocols was demonstrated using streptavidin-coated quantum dots (Fig. 2D) and fluorescently labeled RecA protein.
3. DNA–protein interactions
In this chapter, we will describe several different examples of DNA–protein interaction studies performed using nanofluidic devices and fluorescence microscopy. We have divided the studies into different groups according to the function of the protein and/or how it interacts with DNA and each group will be presented separately.3.1 Crowding
The relevant biological context of biomolecular processes, including those involving DNA and DNA–protein interactions, is the interior of the cell, or even the cell nucleus. This is a highly crowded environment and to study DNA, and its interactions with proteins or other biomolecules, under molecular crowding conditions is thus of importance. In single molecule experiments it has been shown that the crowding effects on DNA structure do not only depend on the crowding agent, but also on the confinement.33–35Zhang et al. studied single DNA molecules in nanochannels in presence of dextran nanoparticles.33 They observed a progressive elongation of the DNA molecules with increasing volume fractions of crowding agent, concluding that addition of the crowding agent effectively reduced the channel diameter (Fig. 3A). At over threshold volume fractions of dextran, proportional to the size of the nanoparticles, the DNA in the nanochannels condensed into a compact structure, in a process similar to polymer and salt induced compaction of DNA in bulk phase, but occurring at much lower ionic strength.
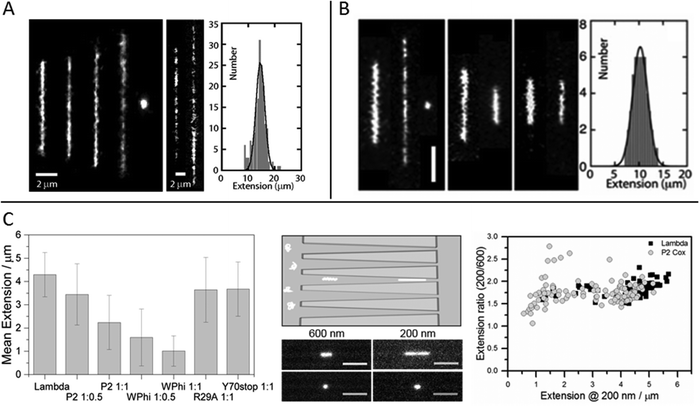 | ||
Fig. 3 (A) Left: Montage of fluorescence images of T4-DNA in 300 × 300 nm2 channels and 1× T buffer (2.9 mM TrisCl, 7.1 mM Tris, pH 8.5). The molecules are crowded by increasing concentrations of dextran (Rg 6.9 nm) of volume fraction 0 to 6.3 × 10⁻² from left to right. Center: As in left panel, but in 150 × 300 nm2 channels, 1/10× T buffer, and dextran volume fractions 4.2 × 10⁻⁴ and 4.2 × 10⁻². Right: Extension distribution of 170 T4-DNA molecules in 300 × 300 nm2 channels, 1× T buffer, and dextran volume fraction of 4.2 × 10⁻². The Gaussian fit gives an average extension of 15 ± 2 μm. Reproduced from ref. 33. (B) Left: Fluorescence images of T4-DNA in 200 × 300 nm2 channels with increasing H-NS concentration of 0, 0.3, and 0.6 mM from left to right in T-buffer (2.9 mM TrisCl, 7.1 mM Tris, pH 8.5) with 3 mM NaCl. The scale bar denotes 3 μm. Center left: As in left panel but in T-buffer with 30 mM NaCl. The H-NS concentrations are 0 and 0.3 mM from left to right. Center right: As in left panel, but in T-buffer with 3 mM NaCl and 0.2 mM MgCl2. The H-NS concentrations are 0 and 0.1 mM from left to right. Right: Extension distribution of 50 T4-DNA molecules in T-buffer with 3 mM NaCl and 0.3 mM H-NS, inside 200 × 300 nm2 channels. The Gaussian fit gives an average extension of 10 ± 2 μm. Reproduced from ref. 37 with permission from The Royal Society of Chemistry. (C) DNA compaction by bacteriophage protein Cox. Left: Measured extensions for DNA alone and when adding increasing concentrations of protein Cox from phages P2 and WΦ, respectively. Included are also data for two mutants of P2 Cox. Center: Schematic illustration of the nanofunnels used in the study (top) and microscopy images (bottom) of two single YOYO-1-stained DNA molecules in presence of P2 Cox, mixed at a molar ratio of 1![[thin space (1/6-em)]](https://www.rsc.org/images/entities/char_2009.gif) : :![[thin space (1/6-em)]](https://www.rsc.org/images/entities/char_2009.gif) 1 (DNA basepairs 1 (DNA basepairs![[thin space (1/6-em)]](https://www.rsc.org/images/entities/char_2009.gif) : :![[thin space (1/6-em)]](https://www.rsc.org/images/entities/char_2009.gif) protein), confined to a nanofunnel and positioned at a width of 600 nm (left) and 200 nm (right). Scale bars correspond to 5 μm. Right: Extension ratio (200 nm/600 nm) for naked DNA (black) and DNA with P2 Cox bound (gray). Reproduced with permission from ref. 27. Published by Oxford University Press on behalf of Nucleic Acids Research online at: http://https://academic.oup.com/nar/article/44/15/7219/2457669/DNA-compaction-by-the-bacteriophage-protein-Cox?searchresult=1. protein), confined to a nanofunnel and positioned at a width of 600 nm (left) and 200 nm (right). Scale bars correspond to 5 μm. Right: Extension ratio (200 nm/600 nm) for naked DNA (black) and DNA with P2 Cox bound (gray). Reproduced with permission from ref. 27. Published by Oxford University Press on behalf of Nucleic Acids Research online at: http://https://academic.oup.com/nar/article/44/15/7219/2457669/DNA-compaction-by-the-bacteriophage-protein-Cox?searchresult=1. | ||
The effect of the confinement geometry on DNA structure and dynamics in presence of a molecular crowding agent was later investigated by Jones et al.34 They studied the response of DNA upon the addition of dextran, in bulk and confined to nanochannels or nanoslits. The extent of swelling was found to be greater in nanochannels, than in nanoslits. Furthermore, there was an abrupt transition from coil to compact globular form in nanochannels, whereas no such collapse was observed in nanoslits. Supported by coarse grained Brownian dynamics simulations it was proposed that the swelling of the DNA coil occurs due to occupancy of free volume next to the channel wall by crowders, a phenomenon that is more pronounced in biaxial confinements (channels) than uniaxial confinements (slits) and that causes an effective reduction in confining dimensions of the channel.
Zhang et al. investigated the conformation and compaction of DNA in nanochannels induced by the negatively charged proteins bovine serum albumin and hemoglobin.35 At sub threshold concentrations of protein, a slight contraction of the DNA molecules in the channels was observed, as opposed to the elongation observed when neutral dextran nanoparticles were used as crowding agent,33 whereas complete compaction occurred at over threshold concentrations. The critical concentrations of protein for compaction were similar to those obtained for dextran and were found to depend on the cross-sectional diameter of the channel and of the ionic strength of the buffer. The threshold concentration of crowding agent for compaction of DNA in nanochannels was an order of magnitude lower than that needed for compaction in the bulk phase, indicating that confinement has a significant effect on DNA compaction.
3.2 DNA compacting proteins
In all domains of life, DNA compaction is a way to fit large amounts of DNA in tiny environments and to protect DNA from degradation. This subchapter describes experiments in nanochannels on several different proteins that bind to and compact DNA. In eukaryotic cells, the DNA is stored in a structure called chromatin that is Discussed in chapter 3.3.The compaction of DNA by protamine, as well as the unpacking of pre-mixed DNA–protamine complexes, was reported as a proof of principle in a study by Zhang et al.21 of in situ exposure to DNA-binding agents, as discussed in chapter 2. Protamines are arginine-rich proteins that replace histones during spermatogenesis, thereby compacting DNA into a highly condensed structure. Using the cross-channel device, a time-lapse series of fluorescence images showing the compaction of DNA upon the exposure to FITC-labelled protamine was obtained. The extent of compaction, and the time scale of the process, was found to depend on the concentration of protamine. The compaction times observed are consistent with those reported in the literature based on the compaction of DNA tethered to optical tweezers in a flow cell.36 In the case of tethered DNA, the nucleation of compaction was exclusively found to occur at the dangling end,36 whereas in nanochannels, Zhang et al. observed that compaction often started at the ends but that nucleation in the middle of the DNA molecules also occurred. They did not exclude, however, that this could be due to a local higher concentration of protamine at the central parts of the DNA molecule when these are exposed to the intersecting feeding channels. A similar time-lapse experiment, illustrating the unpacking of protamine-compacted DNA by increasing the ionic strength was also performed. In analogy with the compaction, unpacking rates were found to depend on protamine concentration. However, the timescale observed for unpacking DNA in the nanochannels was two orders of magnitude slower than that observed for compaction and for unpacking of tethered DNA in a flow cell.36 The authors attribute this difference in unpacking rates between the two techniques to the prolonged incubation time with protamine, resulting in a significantly more compact globule of higher segment density.
The effect on DNA conformation and compaction by the bacterial heat-stable nucleoid-structuring protein (H-NS) was investigated using both single arrays of nanochannels for steady-state experiments and the cross-channel device for monitoring time dependent responses.37 H-NS functions in the bacterial genome organization, by forming a semi-rigid nucleoprotein filament on double-stranded DNA and thereby increasing the thermal stability of the duplex and inhibiting transcription. It is also known to mediate bridging of distal DNA segments. By monitoring the extension of nanoconfined single DNA molecules, pre-incubated with H-NS at different concentration ratios and different ionic strengths, it was found that at sub threshold protein concentrations the DNA is either elongated or contracted, relative to the extension in absence of protein, depending on the ionic strength and presence of divalent ions (Mg2+) (Fig. 3B). The results obtained were supported by Monte Carlo simulations and could be related to the binding properties of H-NS. The elongation of DNA upon addition of H-NS, observed in monovalent buffer of moderate ionic strength with a sigmoidal time dependency over a time span of about 90 minutes, was interpreted as filamentation of H-NS onto the DNA. The resulting nucleoprotein filament is significantly stiffer than naked DNA, explaining the elongation. At higher ionic strength, or in presence of Mg2+ ions, contraction of DNA with increasing concentrations of H-NS, relative to the extension in absence of protein, was observed. The authors attribute this behavior to H-NS mediated side-by-side binding of distal segments of the DNA molecule. Bridging of DNA by H-NS has previously been observed to be induced by divalent ions.38 Under nanoconfinement the interaction is facilitated also by screening of electrostatic repulsion between like-charged DNA segments at higher monovalent salt concentrations. The confinement also explains the compaction of DNA into a condensed form at over threshold concentrations of H-NS. As the nanochannel dimensions are comparable to those typical of the bacterial nucleoid, these findings might have implications for chromosome organization and gene silencing.
Similar contraction and compaction of DNA was observed in presence of the protein Hfq, a phylogenetically conserved and abundant bacterial protein with multiple regulatory functions related to nucleic acids metabolism.39 A decreased stretch of DNA molecules confined to nanochannels was observed with increasing concentrations of Hfq, with a more pronounced effect at higher ionic strength or in presence of Mg2+. Furthermore, compaction into a condensed form was observed at over threshold concentrations. In contrast to H-NS, Hfq does not form rigid filaments on DNA but it readily promotes bridging of DNA segments, resulting in less extended nanoconfined molecules that eventually compact into a condensed form.
A paper by Frykholm et al., in which DNA compaction by the bacteriophage protein Cox was studied, highlights how stretching DNA in nanofluidic channels can be used to confirm structural predictions from X-ray crystallography and the benefits of single molecule techniques in revealing heterogeneous populations.27 The Cox protein, which is a multi-functional transcriptional regulator in P2-like bacteriophages, forms oligomeric filaments and it has been proposed from the X-ray structure that DNA can be wrapped around these filaments, in a manner similar to how histones condense DNA in eukaryotic cells. By stretching pre-formed DNA–Cox complexes in nanochannels it was confirmed that Cox compacts DNA and that the binding is highly cooperative, in agreement with the postulated model. Two Cox homologs, from phage P2 and phage WΦ, were compared and found to have similar effects on the physical properties of DNA, although slight differences in DNA binding affinity were observed, as judged by a more efficient compaction of DNA by WΦ Cox (Fig. 3C). The nanochannels used in this study were tapered, which enabled the same individual DNA–protein complexes to be exposed to different degrees of confinement. By comparing the extensions at different channel widths, it was illustrated how the physical properties of the complex at low protein loads resemble those of naked DNA, whereas they are governed by the stiffer Cox-filament at higher protein concentrations. The results presented in this study highlights the benefits of using a single molecule approach, in illustrating the heterogeneity in the samples. A wide distribution of extensions was observed for a specific DNA![[thin space (1/6-em)]](https://www.rsc.org/images/entities/char_2009.gif) :
:![[thin space (1/6-em)]](https://www.rsc.org/images/entities/char_2009.gif) protein mixing ratio, reflecting the cooperativity in DNA binding by Cox. Moreover, the local distribution of protein along individual DNA molecules could be monitored and regions of densely packed DNA could be identified. By investigating this feature in complexes with wild-type protein and two mutant proteins with reduced DNA binding affinity and abolished filament formation properties, respectively, is was possible to discriminate between compaction due to wrapping of the DNA around a Cox filament and compaction due to monomeric protein binding.
protein mixing ratio, reflecting the cooperativity in DNA binding by Cox. Moreover, the local distribution of protein along individual DNA molecules could be monitored and regions of densely packed DNA could be identified. By investigating this feature in complexes with wild-type protein and two mutant proteins with reduced DNA binding affinity and abolished filament formation properties, respectively, is was possible to discriminate between compaction due to wrapping of the DNA around a Cox filament and compaction due to monomeric protein binding.
3.3 Chromatin
In eukaryotic cells the DNA is generally wrapped up on so called histone proteins, forming a structure called chromatin. This is essential in order to fit the 2 m DNA in each cell into the small cell nucleus. The structure of the DNA in the chromatin is heavily regulated, which is crucial to allow the correct genes to be either expressed or silenced in each specific cell type. This regulation is to a large extent governed by epigenetic modifications on the histone tails.Streng et al. have performed a study on stretching chromatin in nanochannels.30 Chromatin was reconstituted from a commercially available, unfractionated whole histone mixture and the DNA was labeled using YOYO-1. The stretching of chromatin (in 80 × 80 nm2 nanochannels) was compared to bare DNA and it was concluded that their chromatin is ∼2.5 times more compact (Fig. 4A). Streng et al. discuss that the way the chromatin was assembled, the compact 30 nm chromatin fiber was probably not formed. The chromatin studied was rather a disordered 10 nm chromatin fiber with heterogeneous linker lengths. It is almost impossible to estimate parameters like effective width and persistence length for such heterogeneous chromatin. However, a rough estimate of the ratio of the extension for this chromatin and bare DNA, based on deGennes theory, is in agreement with the 2.5 times shorter extension of the chromatin.
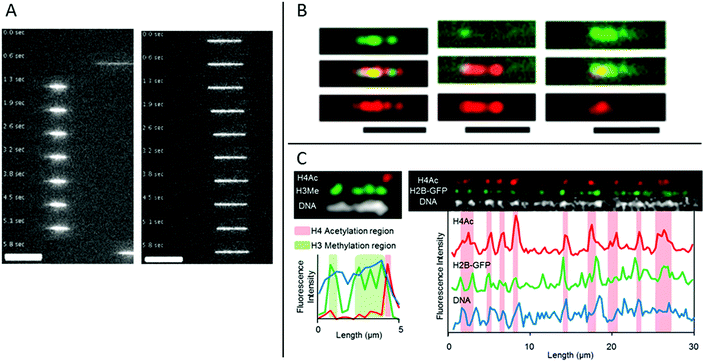 | ||
| Fig. 4 (A) Time lapse movies of DNA–histone complexes (left) and naked DNA (right) stained with YOYO-1 recorded in nanochannels with a cross section of 80 nm. Scale bars are 10 μm. Reproduced from ref. 30 with permission from The Royal Society of Chemistry. (B) Chromatin stained with antibodies targeting H3K4me3 (green channel and top panel) and H3K9ac (red channel and bottom panel), respectively. Chromatin reconstituted with histones extracted from calf thymus (left), HeLa cells (center) and chicken erythrocytes (right). Scale bars correspond to 5 μm. Reprinted from ref. 31, with the permission of AIP Publishing. (C) Left: Chromatin isolated from HeLa cells aligned in nanochannels. The DNA is stained with DAPI (white). H4Ac (red) and H3Me (green) are stained with antibodies. Right: Chromatin isolated from HeLa cells expressing H2B-GFP (green). The DNA is stained with DAPI (white). H4Ac (red) is stained with an antibody. Reprinted with permission from ref. 28. Copyright 2012 American Chemical Society. | ||
A next step of using nanochannels for chromatin analysis is to map histone tail modifications. As a proof of principle, Lim et al. demonstrated that histone tail modifications can be identified with fluorescent antibodies on chromatin stretched in nanochannels.31 Calf thymus, HeLa core and chicken erythrocyte histones where used, together with antibodies detecting trimethylation of lysine 4 and acetylation of lysine 9 on histone 3 (H3), respectively. Chromatin was reconstituted from the three histone samples and antibodies of complementary colors were used for detecting the two different histone tail modifications. The ratio between the two modifications varies among chromatin origins and discrimination between the three histone samples was demonstrated (Fig. 4B). In the study, Lim et al. used larger channels (200 × 200 nm2) than for traditional DNA analysis to avoid stripping of histones from the DNA and binding of antibodies to the channel walls.
Matsuoka et al. overcame the risk of stripping the histones off the DNA by using the elastomeric nanochannels presented in chapter 2, where the channel dimensions can be adjusted after the introduction of the chromatin.28 They used chromatin isolated from HeLa cells and by co-staining with antibodies against methylated histone H3 and acetylated histone H4, localization of epigenetic marks and chromatin condensation could be visualized on linearized chromatin (Fig. 4C). Several advantages of using nanochannels for analysis of chromatin are illustrated in this study: no extra chemistry is required to stretch the chromatin, facilitating studies of chromatin extracted from cells. Moreover, multicolor staining enables analysis of several epigenetic markers simultaneously, which, together with the single chromatin approach, is beneficial for rare samples.
3.4 Filamentous DNA–protein complexes
Homologous recombination is a DNA repair pathway that is conserved in all domains of life. In this process, a DNA recombinase forms a filament on single stranded DNA in order to facilitate homology search within an intact double stranded DNA and subsequent strand exchange. Two papers by Frykholm et al.25 and Fornander et al.26 present studies of filaments formed by the proteins involved in homologous recombination in bacteria (RecA) and eukaryotes (Rad51), respectively. Both proteins form stiff helical filaments both on single stranded and double stranded DNA that have vastly different physical properties compared to DNA alone.RecA forms homogeneous filaments along DNA and Frykholm et al. demonstrated that by studying the RecA nucleoprotein filaments at different degrees of confinement, it was possible to determine the persistence length of the filaments (Fig. 5A).25 Since the filaments are so stiff, the Odijk theory, that is valid if the persistence length is larger than the channel dimensions, applies. The value obtained using the nanochannels (1.15 μm) corresponds nicely to the value obtained using optical tweezers (0.96 μm)40 with the important difference that the nucleoprotein filaments studied in nanochannels were in solution without any tethering of the DNA.
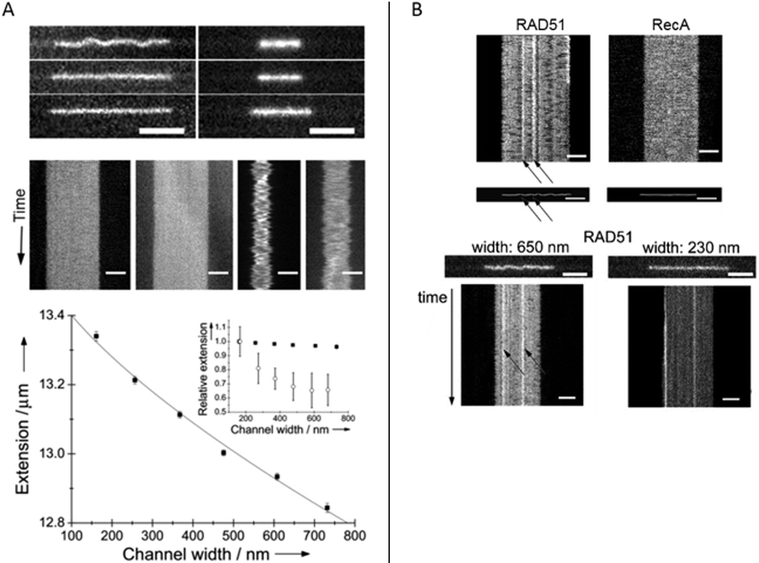 | ||
| Fig. 5 (A) Top: RecA filaments (left) and naked DNA stained with YOYO-1 (right) in 150 nm deep nanofunnels of widths 730 nm (top), 370 nm (center) and 160 nm (bottom). Center: Kymographs in 730 nm (left) and 160 nm (right) wide nanofunnels. Each kymograph is 28 s long. All scale bars correspond to 5 μm. Bottom: Extension of a RecA filament at different degrees of confinement in 150 nm deep nanofunnels (solid squares). The solid line is the fit to the Odijk theory. The inset shows the corresponding data for naked DNA (open circles). Reprinted with permission from ref. 25. Copyright 2014, Wiley-VCH. (B) Top: Kymographs and heat maps comparing Rad51- and RecA filaments in ∼700 nm wide and 150 nm deep nanochannels. Bottom: Snapshots of Rad51 filaments in 150 nm deep nanofunnels with a width of 650 nm (left) and 230 nm (right), respectively, and the corresponding kymographs. Scale bars are 5 μm. Reprinted with permission from ref. 26. Copyright (2016) American Chemical Society. | ||
Rad51 nucleoprotein filaments were later analyzed in a similar fashion by Fornander et al. but they turned out to be much more difficult to analyze, since they are heterogeneous.26 In contrast to the homogenous nucleoprotein filaments formed by RecA, Rad51 forms patches on the DNA that are separated by naked DNA. This means that they cannot be analyzed using the Odijk theory as was done for RecA. However, by visualizing the Rad51 nucleoprotein filaments in tapered channels it was possible to characterize how the patches of naked DNA affects the physical properties of the filaments (Fig. 5B). At relatively weak confinement (∼650 × 150 nm2) the filaments form static kinks, suggested to arise when two patches meet. At stronger confinement (∼230 × 150 nm2), the protein coverage on the DNA could be determined in more detail and the presence of regions of naked DNA could be confirmed. In the paper, differences between the cation used (Mg2+ or Ca2+), the DNA substrate (single stranded or double stranded DNA), and the nucleation concentration was investigated in terms of number and size of filament patches as well as the formation of rigid kinks. The authors speculate on the biological importance of the kinks and discuss whether they might promote or hinder the strand exchange reaction. It is also plausible that some of the many additional proteins involved in homologous recombination in eukaryotes have as specific roles to control the formation of kinks.
3.5 Sequence specific DNA–protein interactions
Since the extension of the DNA in nanochannels scales with the contour length of the DNA, it is possible to reveal sequence information from DNA stretched in nanochannels. This has been utilized in for example optical DNA mapping,20 where sequence information on very large DNA molecules is obtained. Similarly, it is possible to obtain sequence specific information for DNA–protein interactions by stretching DNA in nanochannels.The two first examples of sequence selective protein interaction studies in nanochannels are the papers by Riehn et al.18 and Wang et al.19 presented in the introduction of this review, where either a restriction enzyme (Fig. 2A) or a transcription factor (Fig. 6A), respectively, are demonstrated to bind to DNA at positions that correspond well to the underlying sequence.
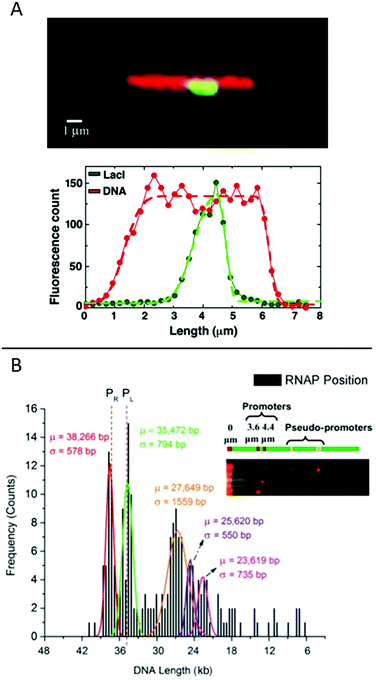 | ||
Fig. 6 (A) Top: LacI labelled with GFP (green) bound to λ-DNA (stained in red), engineered to have a repetitive region of LacI binding sites in the center. Bottom: Corresponding intensity profiles. Dashed lines are fits to the extensions. Reproduced from ref. 19. Copyright (2005) National Academy of Sciences, USA. (B) Histogram for ∼200 DNA molecules, showing the localization of the binding of E. coli RNAP holoenzyme to λ-DNA stretched in a nanoslit. Known promoter sites are at 38![[thin space (1/6-em)]](https://www.rsc.org/images/entities/char_2009.gif) 266 and 35 266 and 35![[thin space (1/6-em)]](https://www.rsc.org/images/entities/char_2009.gif) 472 bp and pseudo-promoter sites at 27 472 bp and pseudo-promoter sites at 27![[thin space (1/6-em)]](https://www.rsc.org/images/entities/char_2009.gif) 649, 25 649, 25![[thin space (1/6-em)]](https://www.rsc.org/images/entities/char_2009.gif) 620 and 23 620 and 23![[thin space (1/6-em)]](https://www.rsc.org/images/entities/char_2009.gif) 619 bp. The dotted lines represent actual promoter regions. Inset shows assorted images of DNA–RNAP complexes with all five binding sites. Reproduced with permission from ref. 41. Published by Oxford University Press on behalf of Nucleic Acids Research online at: http://https://academic.oup.com/nar/article/42/10/e85/2434823/Direct-optical-mapping-of-transcription-factor?searchresult=1. 619 bp. The dotted lines represent actual promoter regions. Inset shows assorted images of DNA–RNAP complexes with all five binding sites. Reproduced with permission from ref. 41. Published by Oxford University Press on behalf of Nucleic Acids Research online at: http://https://academic.oup.com/nar/article/42/10/e85/2434823/Direct-optical-mapping-of-transcription-factor?searchresult=1. | ||
Another study of transcription factor binding to DNA was presented by Sriram KK et al.,41 who studied an RNA polymerase (RNAP) holoenzyme from E. coli for which the promoter binding sites on λ-DNA are known. Two strong promoters and various pseudo-promoters with sequences closely matching the strong promoters are present. The transcription factors were covalently attached to DNA using formaldehyde cross-linking and visualized by binding quantum dots to the DNA-bound proteins via antibodies. The DNA, with bound transcription factors, was stretched in a nanoslit of tens of nanometers depth. By using a biotin end-label on the DNA and binding a streptavidin-coated fluorosphere larger than the depth of the slit to it, the DNA was trapped at the micro-nano junction of the device and stretched into the nanoslit upon application of an electric field. This principle allowed many (20–30) DNA-molecules to be stretched in parallel, increasing throughput. The results reveal that the two promotor sites are the two sites that are mostly occupied (around 45%) and with similar probability (Fig. 6B). The pseudo promotor sites are less occupied (30%), but can also be clearly distinguished from background noise.
3.6 Other DNA–protein interactions
In this chapter, we discuss some final examples of peptides and proteins whose interactions with DNA have been studied in nanochannels, but that do not fall under any of the categories presented above.For several applications, not the least optical DNA mapping,20 it is of interest to increase the stretching of the DNA as much as possible. The stretching increases with decreasing size of the channel, but there is always a tradeoff between the degree of stretching and how easy it is to insert the DNA into the channels. It is therefore of interest to increase the stretching of the DNA already in much wider channels. Zhang et al. demonstrated that by coating the DNA duplex with a cationic–neutral diblock polypeptide, they achieved a uniform stretching of T4-DNA to 85% of its contour length in rectangular channels with a cross-section of 200 nm (Fig. 7A).42 The amplified stretch is due to an increase in bending rigidity and thickness of the bottlebrush-coated DNA, as deduced form Monte Carlo simulations. The enhanced stretching allows the use of wider channels and devices fabricated in elastomeric materials, such as polydimethylsiloxane (PDMS), using soft lithography techniques. The study demonstrates large-scale optical mapping of site-specific nick-labelled λ-DNA, coated with the diblock polypeptide and confined to channels with cross-section dimensions of ∼250 nm, with a resolution comparable to that obtained for DNA confined to 45 nm wide channels.43
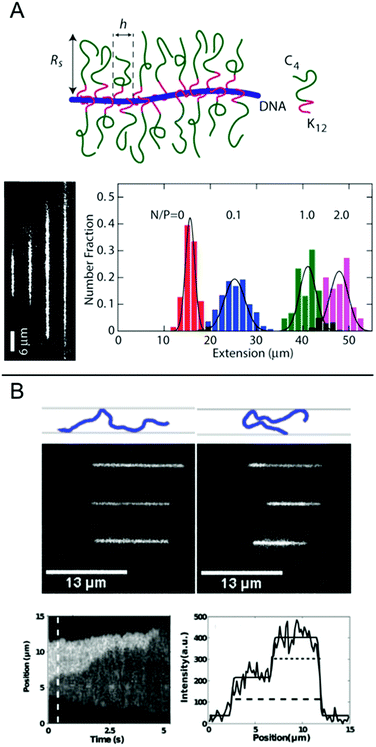 | ||
| Fig. 7 (A) Top: Schematic of the bottlebrush copolymer bound to DNA. Bottom left: DNA molecules coated with bottlebrush polymer in 250 × 250 nm2 nanochannels at increasing peptide to DNA ratios ranging from 0 to 2 polypeptides/DNA charge. Bottom right: corresponding extension histograms. Reproduced with permission from ref. 42. Published by Oxford University Press on behalf of Nucleic Acids Research online at: http://https://academic.oup.com/nar/article/41/20/e189/2414866/Amplified-stretch-of-bottlebrush-coated-DNA-in?searchresult=1. (B) Top: Schematic illustration of observed DNA conformations, extended (left) and folded (right), respectively. Center: Three experimental examples of extended (left) and folded (right) DNA molecules. Top row is without T4 ligase, center row is with T4 ligase and bottom row is with T4 ligase and ATP. Measurements done in 50 × 100 nm2 channels. Bottom left: Kymograph showing unfolding of a DNA molecule folded in presence of T4 ligase. Bottom right: Emission intensity along the nanochannel at 0.5 s. End-to-end extension of DNA is shown with dashed line and length of folded region with dotted line. Reprinted from ref. 29, with the permission of AIP Publishing. | ||
Nanochannels are well suited for observing the binding of proteins that mediate formation of large DNA loops, since no tethering of the DNA is needed. In nanochannels, a loop is directly visualized as a segment of DNA that has approximately double emission intensity, similar to the appearance of circular DNA.44 Roushan et al. demonstrated this principle for T4 DNA ligase, a versatile enzyme with many functionalities, one being bridging DNA.29 As predicted, DNA-regions with double intensity were observed in the protein-incubated samples and these were much more long-lived than such regions in samples without the protein, suggesting that loops had formed via protein-mediated bridging (Fig. 7B). Loops were observed also in AFM images and the presence of proteins at the DNA crossing points was confirmed. An important part of these experiments was to discriminate the double-folded configurations formed by T4 ligase looping from DNA that is double-folded just due to the insertion in the channels, as reported by Levy et al.45 Notably, the loops formed on naked DNA not only unfolded faster but they were also almost exclusively present when the injection pressure into the nanochannels was high and were always formed on the leading end of the DNA molecule. Loops formed by T4 ligase were present in nanochannels also at much lower injection pressures and were then almost exclusively present on the trailing end.
4. Conclusion & Outlook
In this review, we have highlighted the use of nanofluidic structures for detailed studies of DNA–protein interactions on the single DNA molecule level. We have discussed how the design of the device can be tailored in order to maximize the amount of information that can be obtained from each experiment. The versatility of the devices has been demonstrated by showing examples of the many different kinds of proteins that have been studied using this methodology.We foresee several different future directions for the use of nanofluidic channels for studies of DNA–protein interactions, in particular for studies where traditional methods are limited or completely fail. A main characteristic of using nanochannels for studying DNA–protein interactions is that the studies are performed on molecules in solution and that no handles have to be attached to the DNA to stretch it and keep it in the focal plane of the microscope. This is in stark contrast to for example tweezers experiments where at least one end of the DNA needs to be attached to a bead, or TIRF experiments where the DNA is anchored to a surface. There are two main applications where we expect that this can be of particular importance. The first is for studies on DNA–protein complexes extracted from cells. Such complexes can be directly introduced into the nanofluidic device without end modifications. This is in this review exemplified by the identification of histone marks on chromatin extracted from cells. Related to this is the possibility of creating an integrated lab-on-a-chip where all steps of the sample preparation is integrated and genetic material from a single cell can potentially be characterized. Secondly, there are many important biological processes that occur on DNA ends or when two DNA ends meet. These would be very difficult to study with traditional single molecule techniques, but in nanochannels all DNA ends are free. In addition to these benefits we also want to emphasize that studies using nanochannels allow fairly high throughput analysis since many complexes can be imaged at the same time. Furthermore, the nanochannels keep the DNA–protein complex in focus meaning that experiments are easily performed on a standard epi-fluorescence microscope with wide-field illumination. This is important for a broad use of the technique and opens up possibilities for use in lower income countries. In line with this we want to point out that nanofluidic devices can be made in cost efficient plastic materials.46,47
Acknowledgements
The EU Horizon 2020 program BeyondSeq (no. 634890), the Swedish Research Council (no. 2015-5062) and the Chalmers University of Technology Area of Advance in Nanoscience and Nanotechnology are acknowledged for financial support.References
- D. Dulin, J. Lipfert, M. C. Moolman and N. H. Dekker, Nat. Rev. Genet., 2012, 14, 9 CrossRef PubMed.
- I. Heller, T. P. Hoekstra, G. A. King, E. J. G. Peterman and G. J. L. Wuite, Chem. Rev., 2014, 140121074240004 Search PubMed.
- A. Candelli, G. J. L. Wuite and E. J. G. Peterman, Phys. Chem. Chem. Phys., 2011, 13, 7263 RSC.
- K. R. Chaurasiya, T. Paramanathan, M. J. McCauley and M. C. Williams, Physics of Life Reviews, 2010, 7, 299 CrossRef PubMed.
- I. De Vlaminck and C. Dekker, Annu. Rev. Biophys., 2012, 41, 453 CrossRef CAS PubMed.
- J. van Mameren, E. J. G. peterman and G. J. L. Wuite, Nucleic Acids Res., 2008, 36, 4381 CrossRef CAS PubMed.
- R. Roy, S. Hohng and T. Ha, Nat. Methods, 2008, 5, 507 CrossRef CAS PubMed.
- B. E. Collins, F. Y. Ling, D. Duzdevich and E. C. Greene, Methods Cell Biol., 2014, 123, 217 Search PubMed.
- J. O. Tegenfeldt, C. Prinz, H. Cao, S. Chou, W. W. Reisner, R. Riehn, Y. M. Wang, E. C. Cox, J. C. Sturm, P. Silberzan and R. H. Austin, Proc. Natl. Acad. Sci. U. S. A., 2004, 101, 10979 CrossRef CAS PubMed.
- W. Reisner, J. N. Pedersen and R. H. Austin, Rep. Prog. Phys., 2012, 75, 106601 CrossRef PubMed.
- L. Dai, C. B. Renner and P. S. Doyle, Adv. Colloid Interface Sci., 2016, 232, 80 CrossRef CAS PubMed.
- P. G. de Gennes, Scaling Concepts in Polymer Physics, Cornell University Press, Ithaca, 1979 Search PubMed.
- T. Odijk, Macromolecules, 1983, 16, 1340 CrossRef CAS.
- V. Iarko, E. Werner, L. K. Nyberg, V. Müller, J. Fritzsche, T. Ambjornsson, J. P. Beech, J. O. Tegenfeldt, K. Mehlig, F. Westerlund and B. Mehlig, Phys. Rev. E: Stat., Nonlinear, Soft Matter Phys., 2015, 92, 062701 CrossRef CAS PubMed.
- E. Werner and B. Mehlig, Phys. Rev. E: Stat., Nonlinear, Soft Matter Phys., 2014, 90, 062602 CrossRef CAS PubMed.
- D. Gupta, J. Sheats, A. Muralidhar, J. J. Miller, D. E. Huang, S. Mahshid, K. D. Dorfman and W. Reisner, J. Chem. Phys., 2014, 140, 214901 CrossRef PubMed.
- E. Werner, G. K. Cheong, D. Gupta, K. D. Dorfman and B. Mehlig, 2017, arXiv.org.
- R. Riehn, M. Lu, Y. M. Wang, S. F. Lim, E. C. Cox and R. H. Austin, Proc. Natl. Acad. Sci. U. S. A., 2005, 102, 10012 CrossRef CAS PubMed.
- Y. M. Wang, J. O. Tegenfeldt, W. Reisner, R. Riehn, X. J. Guan, L. Guo, I. Golding, E. C. Cox, J. Sturm and R. H. Austin, Proc. Natl. Acad. Sci. U. S. A., 2005, 102, 9796 CrossRef CAS PubMed.
- V. Müller and F. Westerlund, Lab Chip, 2017, 17, 579 RSC.
- C. Zhang, K. Jiang, F. Liu, P. S. Doyle, J. A. van Kan and J. R. C. van der Maarel, Lab Chip, 2013, 13, 2821 RSC.
- R. Riehn, R. H. Austin and J. C. Sturm, Nano Lett., 2006, 6, 1973 CrossRef CAS PubMed.
- F. Persson, P. Utko, W. Reisner, N. B. Larsen and A. Kristensen, Nano Lett., 2009, 9, 1382 CrossRef CAS PubMed.
- F. Westerlund, F. Persson, A. Kristensen and J. O. Tegenfeldt, Lab Chip, 2010, 10, 2049 RSC.
- K. Frykholm, M. Alizadehheidari, J. Fritzsche, J. Wigenius, M. Modesti, F. Persson and F. Westerlund, Small, 2014, 10, 884 CrossRef CAS PubMed.
- L. H. Fornander, K. Frykholm, J. Fritzsche, J. Araya, P. Nevin, E. Werner, A. Çakır, F. Persson, E. B. Garcin, P. J. Beuning, B. Mehlig, M. Modesti and F. Westerlund, Langmuir, 2016, 32, 8403 CrossRef CAS PubMed.
- K. Frykholm, R. Berntsson, M. Claesson, L. de Battice, R. Odegrip, P. Stenmark and F. Westerlund, Nucleic Acids Res., 2016, 44, 7219 CAS.
- T. Matsuoka, B. C. Kim, J. Huang, N. J. Douville, M. D. Thouless and S. Takayama, Nano Lett., 2012, 12, 6480 CrossRef CAS PubMed.
- M. Roushan, P. Kaur, A. Karpusenko, P. J. Countryman, C. P. Ortiz, S. F. Lim, H. Wang and R. Riehn, Biomicrofluidics, 2014, 8, 034113 CrossRef PubMed.
- D. E. Streng, S. F. Lim, J. Pan, A. Karpusenka and R. Riehn, Lab Chip, 2009, 9, 2772 RSC.
- S. F. Lim, A. Karpusenko, A. L. Blumers, D. E. Streng and R. Riehn, Biomicrofluidics, 2013, 7, 064105 CrossRef PubMed.
- F. Persson, J. Fritzsche, K. U. Mir, M. Modesti, F. Westerlund and J. O. Tegenfeldt, Nano Lett., 2012, 12, 2260 CrossRef CAS PubMed.
- C. Zhang, P. G. Shao, J. A. Van Kan and J. R. C. Van Der Maarel, Proc. Natl. Acad. Sci. U. S. A., 2009, 106, 16651 CrossRef CAS PubMed.
- J. J. Jones, J. R. C. van der Maarel and P. S. Doyle, Nano Lett., 2011, 11, 5047 CrossRef CAS PubMed.
- C. Zhang, Z. Gong, D. Guttula, P. P. Malar, J. A. van Kan, P. S. Doyle and J. R. C. van der Maarel, J. Phys. Chem. B, 2012, 116, 3031 CrossRef CAS PubMed.
- L. R. Brewer, Science, 1999, 286, 120 CrossRef CAS PubMed.
- C. Zhang, D. Guttula, F. Liu, P. P. Malar, S. Y. Ng, L. Dai, P. S. Doyle, J. A. van Kan and J. R. C. van der Maarel, Soft Matter, 2013, 9, 9593 RSC.
- Y. Liu, H. Chen, L. J. Kenney and J. Yan, Genes Dev., 2010, 24, 339 CrossRef CAS PubMed.
- K. Jiang, C. Zhang, D. Guttula, F. Liu, J. A. Van Kan, C. Lavelle, K. Kubiak, A. Malabirade, A. Lapp, V. Arluison and J. R. C. Van Der Maarel, Nucleic Acids Res., 2015, 43, 4332 CrossRef CAS PubMed.
- M. Hegner, S. B. Smith and C. Bustamante, Proc. Natl. Acad. Sci. U. S. A., 1999, 96, 10109 CrossRef CAS.
- K. K. Sriram, J. W. Yeh, Y. L. Lin, Y. R. Chang and C. F. Chou, Nucleic Acids Res., 2014, 42, e85 CrossRef CAS PubMed.
- C. Zhang, A. Hernandez-Garcia, K. Jiang, Z. Gong, D. Guttula, S. Y. Ng, P. P. Malar, J. A. Van Kan, L. Dai, P. S. Doyle, R. D. Vries and J. R. C. Van Der Maarel, Nucleic Acids Res., 2013, 41, e189 CrossRef CAS PubMed.
- E. T. Lam, A. Hastie, C. Lin, D. Ehrlich, S. K. Das, M. D. Austin, P. Deshpande, H. Cao, N. Nagarajan, M. Xiao and P.-Y. Kwok, Nat. Biotechnol., 2012, 30, 771 CrossRef CAS PubMed.
- M. Alizadehheidari, E. Werner, C. Noble, M. Reiter-Schad, L. K. Nyberg, J. Fritzsche, B. Mehlig, J. O. Tegenfeldt, T. Ambjörnsson, F. Persson and F. Westerlund, Macromolecules, 2015, 48, 871 CrossRef CAS.
- S. L. Levy, J. T. Mannion, J. Cheng, C. H. Reccius and H. G. Craighead, Nano Lett., 2008, 8, 3839 CrossRef CAS PubMed.
- I. Fernandez-Cuesta, A. L. Palmarelli, X. Liang, J. Zhang, S. Dhuey, D. Olynick and S. Cabrini, J. Vac. Sci. Technol., B: Nanotechnol. Microelectron.: Mater., Process., Meas., Phenom., 2011, 29, 06F801 Search PubMed.
- P. Utko, F. Persson, A. Kristensen and N. B. Larsen, Lab Chip, 2011, 11, 303 RSC.
| This journal is © The Royal Society of Chemistry 2017 |

