
 Open Access Article
 This Open Access Article is licensed under a
 Creative Commons Attribution 3.0 Unported Licence
Lmna knockout mouse embryonic fibroblasts are less contractile than their wild-type counterparts
I. A. E. W.
van Loosdregt
 ab,
M. A. F.
Kamps
c,
C. W. J.
Oomens
ab,
S.
Loerakker
ab,
J. L. V.
Broers
c and
C. V. C.
Bouten
*ab
ab,
M. A. F.
Kamps
c,
C. W. J.
Oomens
ab,
S.
Loerakker
ab,
J. L. V.
Broers
c and
C. V. C.
Bouten
*ab
aDepartment of Biomedical Engineering, Eindhoven University of Technology, Eindhoven, The Netherlands. E-mail: c.v.c.bouten@tue.nl
bInstitute for Complex Molecular Systems, Eindhoven University of Technology, Eindhoven, The Netherlands
cDepartment of Molecular Cell Biology, CARIM School Cardiovascular Diseases, Maastricht University, Maastricht, The Netherlands
First published on 7th July 2017
Abstract
In order to maintain tissue homeostasis and functionality, adherent cells need to sense and respond to environmental mechanical stimuli. An important ability that adherent cells need in order to properly sense and respond to mechanical stimuli is the ability to exert contractile stress onto the environment via actin stress fibers. The actin stress fibers form a structural chain between the cells’ environment via focal adhesions and the nucleus via the nuclear lamina. In case one of the links in this chain is missing or aberrant, contractile stress generation will be affected. This is especially the case in laminopathic cells, which have a missing or mutated form of the LMNA gene encoding for part of the nuclear lamina. Using the thin film method combined with sample specific finite element modeling, we quantitatively showed a fivefold lower contractile stress generation of Lmna knockout mouse embryonic fibroblasts (MEFs) as compared to wild-type MEFs. Via fluorescence microscopy it was demonstrated that the lower contractile stress generation was associated with an impaired actin stress fiber organization with thinner actin fibers and smaller focal adhesions. Similar experiments with wild-type MEFs with chemically disrupted actin stress fibers verified these findings. These data illustrate the importance of an organized actin stress fiber network for contractile stress generation and demonstrate the devastating effect of an impaired stress fiber organization in laminopathic fibroblasts. Next to this, the thin film method is expected to be a promising tool in unraveling contractility differences between fibroblasts with different types of laminopathic mutations.
Insight, innovation, integrationThe ability to exert contractile stress is of vital importance for proper mechanical functioning of adherent cells. This ability is disturbed in laminopathic cells, which have a missing or mutated form of the LMNA gene encoding for A-type lamins. Using the thin film method we quantitatively showed a fivefold lower contractile stress generation in Lmna knockout mouse embryonic fibroblasts (MEFs) compared to wild-type MEFs. This could be explained by their impaired actin stress fiber organization, which was verified by chemical disruption of the actin stress fibers in wild-type MEFs. These data illustrate the importance of an organized actin stress fiber network for contractile stress generation and demonstrate the devastating effect of a disturbed stress fiber organization in Lmna−/− fibroblasts. |
Introduction
In vivo, adherent cells experience a wide variety of environmental stimuli, including biochemical and mechanical stimuli. These stimuli need to be translated into proper cellular responses in order to maintain tissue homeostasis and functionality.1 Cells can sense and respond to environmental stimuli via their cytoskeleton, which forms a structural chain between the cells’ environment and the nucleus.2,3 Mechanical stimuli, for example, can be propagated to the nucleus via focal adhesion complexes, actin stress fibers, LInkers of the Nucleoskeleton and Cytoskeleton (LINC) complexes, and the nuclear lamina that is directly connected to chromatin.4,5 As a response to mechanical stimuli, cells adapt to their environment1 by e.g. reorienting,6 producing matrix7 or exerting stresses onto their surroundings.8 In order to sense and respond to environmental stimuli, all structural elements connecting the nucleus to the cell's environment need to work together in a coordinated fashion. In case one of the links in this chain is missing or aberrant, this can alter not only the way cells sense their environment, but also how they respond to it.An example in which the structural connection between the nucleus and the cell's environment is disturbed is the knockout of the Lmna gene (in mice; LMNA in humans), causing a disturbed organization of the nuclear lamina. This lamina disorganization in turn causes an impaired organization of the actin network due to the impaired connection between actin and the lamina via LINC proteins.9–12 Mutations in the LMNA gene can cause a variety of diseases, collectively called laminopathies, which can range from muscle dystrophies and cardiomyopathy to progeroid (early aging) syndromes.13–15 The commonality between all laminopathies is an impaired mechanical functioning of the cell,10,12,16 which is mainly noticeable in tissues that are prone to high levels of mechanical stress under physiological conditions, such as muscle or cardiovascular tissue. Leading studies investigating Lmna knockout mouse embryonic fibroblasts (Lmna−/− MEFs or shorter MEF−/−) have shown these cells to be more compliant,9,10,17 to have a defective force transduction between the cytoskeleton and the nucleus18 and to have a disturbed migratory behavior.9,12,19 To complement these studies on mechanical functioning of Lmna knockout MEFs, we recently reported that Lmna−/− MEFs did not show the typical strain avoidance response seen in adherent cells when subjected to cyclic mechanical strain (reorientation towards the direction perpendicular to the strain).16 Interestingly, however, the cells showed intact anisotropy sensing, as they aligned along the major axis of the elliptical microposts on which they were seeded. Quantitative analysis of actin indicated that Lmna−/− and wild-type MEFs contained similar amounts of actin, however, with different organizations. While wild-type MEFs showed abundant actin cap (actin stress fibers running on top of the nucleus, bridging between the nucleus and environment20) and basal actin fibers (actin fibers running underneath the nucleus), Lmna−/− MEFs had an intact basal layer, but a defective actin cap, likely causing the disturbed strain avoidance behavior.
Actin stress fibers provide cells the ability to exert contractile stress onto their environment in order to, e.g., migrate or (re)orient in response to cyclic mechanical strain. As such, the presence of the stress fibers’ contractile elements (actin and phosphorylated myosin light chain II) is an important prerequisite for proper mechanical functioning of the cell; although presence of contractile elements does not necessarily ensure proper functionality. In order to efficiently apply contractile stress onto their surroundings, cells need a well-organized actin stress fiber network, as well as thick actin bundles with myosin II and α-actinin.21 Several studies investigating contractile cells, like (cardio)myocytes,22–24 have indeed shown that laminopathies affect the contractile potential of these cells and thus the contractility of the complete muscular tissue. However, in fibroblasts, possessing structurally different contractile elements, no solid proof for this has been provided. Therefore, in this study, we investigated the difference in contractile stress generation and actin stress fiber organization (i.a. situated in the actin cap) between Lmna−/− MEFs and their wild-type counterparts using a quantitative approach. To test this, Lmna−/− MEFs and wild-type MEFs (Lmna+/+ MEFs or shorter MEF+/+) were cultured on thin PDMS (polydimethylsiloxane) films that were functionalized with parallel fibronectin lines to attain cellular alignment.8 Next to this, thin films were functionalized with perpendicular fibronectin lines, leading to a random cell orientation. Thereafter, cellular contractile stress development was assessed using the thin film method described previously25–27 and quantified by sample specific finite element modeling.8 The influence of Lmna knockout on the structural organization of the actin stress fibers was examined both (semi-)quantitatively and qualitatively by means of immunofluorescence. The experiments were repeated in the presence of latrunculin B, an inhibitor of actin polymerization, to confirm the influence of stress fiber organization on contractile stress generation in fibroblasts.
Materials and methods
Construct fabrication and functionalization
Thin film constructs, consisting of a 25 mm diameter glass cover slip coated with poly-N-isopropylacrylamide (pIPAAm; Sigma, Zwijndrecht, The Netherlands) and subsequently PDMS (Sylgard 184; Dow Corning, Aubum, MI), were fabricated as described previously.8 Constructs were created with different PDMS thicknesses to account for the difference in contractile stress generation between the different cell types and monolayer organizations (17–20 samples per group).8The thin film constructs were functionalized by micro-contact printing 50 mg mL−1 rhodamine fibronectin (Cytoskeleton, Denver, CO),8 promoting fibroblast adhesion and growth.28,29 The rhodamine fibronectin was micro-contact printed as either 10 μm wide parallel lines with 10 μm spacing in the direction of the 0°-axis (parallel substrate) or as a fishnet pattern of 5 μm wide lines with 10 μm spacing at an angle of ±45° with respect to the 0°-axis (perpendicular substrate).8 The 0°-axis was positioned such that it coincided with the long axis of the to-be-cut films.
Cell seeding and culture
Lmna +/+ and Lmna−/− MEFs were seeded onto the thin film constructs at a seeding density of 15![[thin space (1/6-em)]](https://www.rsc.org/images/entities/char_2009.gif) 600 cells per cm2 and 21000 cells per cm2, respectively, to correct for differences in cell size, cell growth and adherence. As a result, both cell types reached confluency at the start of the experiments. The MEFs were cultured in growth medium at 37 °C and 5% CO2 for two days. The growth medium consisted of DMEM (Invitrogen, Breda, The Netherlands) supplemented with 10% Fetal Bovine Serum (Greiner Bio-One, Frickenhausen, Germany) and 1% penicillin/streptomycin (Lonza, Basel, Switzerland).
600 cells per cm2 and 21000 cells per cm2, respectively, to correct for differences in cell size, cell growth and adherence. As a result, both cell types reached confluency at the start of the experiments. The MEFs were cultured in growth medium at 37 °C and 5% CO2 for two days. The growth medium consisted of DMEM (Invitrogen, Breda, The Netherlands) supplemented with 10% Fetal Bovine Serum (Greiner Bio-One, Frickenhausen, Germany) and 1% penicillin/streptomycin (Lonza, Basel, Switzerland).
Contractile stress measurement assay
For 5–8 samples per group, the contractile stress exerted by the monolayer was measured as described previously (Fig. 1).8 In brief, samples were stained with Hoechst (Invitrogen) for 15 minutes in order to determine cell density, nuclear orientation, and aspect ratio of the nuclei on each film. Subsequently, the samples were transferred to a petri dish with preheated (37 °C) growth medium and the long edges of eight rectangular films were cut. The construct was thereafter imaged with confocal microscopy (TCS SP5X; Leica) in a temperature- and CO2-controlled environment. Finally, the ends of the rectangular films were cut and the PDMS films released from their glass substrate due to contractile stress generation (n = 35–58 films per group). A custom Matlab script was used to determine the initial curvature (0 h) and the equilibrium curvature (1 h) of the films from pictures taken with a stereomicroscope (Discovery.V8; Zeiss). In-between the time points, the samples were maintained at 37 °C and 5% CO2.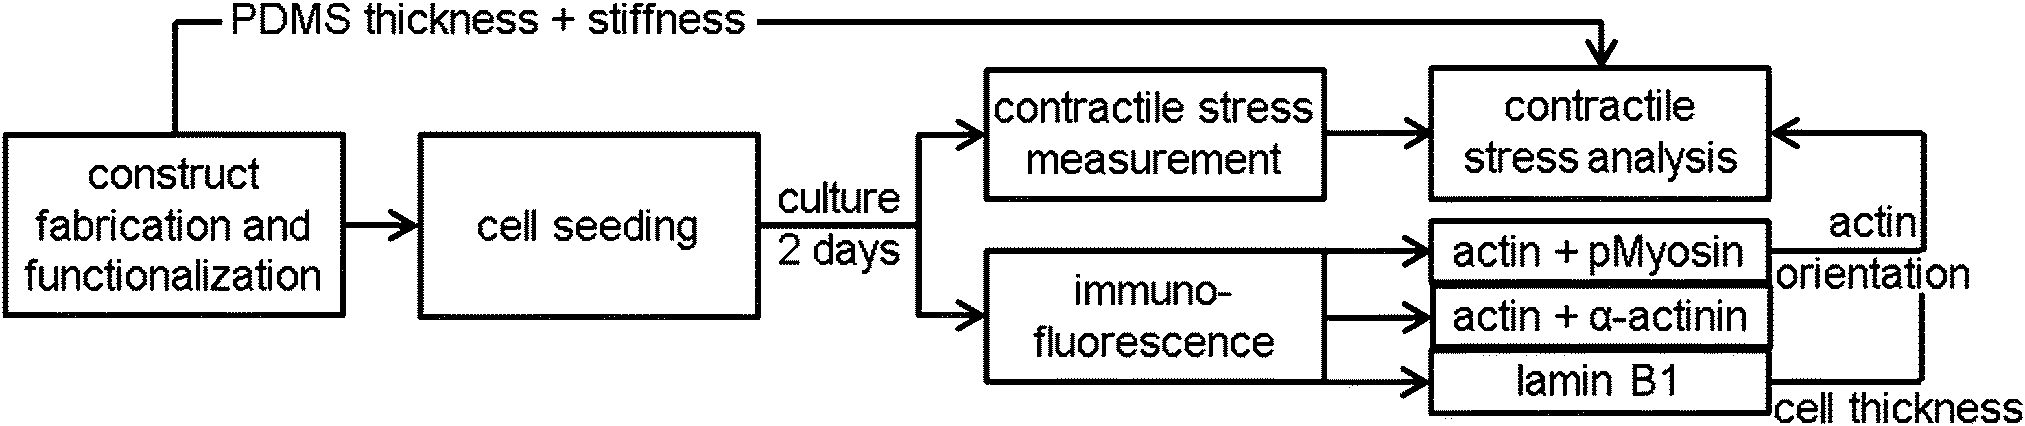 | ||
| Fig. 1 Graphical representation of the experiments and the finite element model. | ||
Contractile stress analysis
In correspondence with our previous work,8 a sample-specific, double-layered finite element mesh (200 quadratic brick elements per layer) was created in Abaqus (Dassault Systèmes Simulia Corp., Providence, RI) using the parameters in Table 1. The bottom layer represented the PDMS layer of the thin films and was assigned with compressible Neo–Hookean material properties: | (1) |
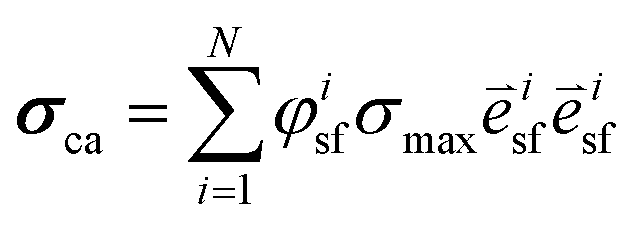 | (2) |
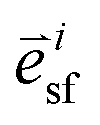 is the stress fiber direction in the deformed configuration, and φisf the actin fiber volume fraction for angle i as obtained from the fluorescent images (see below). σmax was iteratively increased until the curvature of the finite element models matched the experimentally obtained curvature. The curvature of the finite element model could not always match the experimentally obtained curvature due to convergence issues caused by high deformations of the model. We hypothesized that the samples with a high curvature obtained this curvature due to their high cell density. Therefore, the cell density was statistically compared between the samples that could and could not be analyzed. Since it is not clear what exact type of relationship exists between σmax and cell density, and the aim of this study is to compare the stress generation between cell types, we treated the data as being linearly related. Therefore, in order to compare the intrinsic contractile stress between cell types and substrate organizations, σmax was normalized (σnorm) by dividing it by the cell density.
| Chosen parameters | Measured parameters | Fitted parameters | |||||||||
|---|---|---|---|---|---|---|---|---|---|---|---|
| All groups | MEF+/+ perp.a | MEF+/+ par.a | MEF−/− perp. | MEF−/− par. | MEF+/+ perp. | MEF+/+ par. | MEF−/− perp. | MEF−/− par. | |||
| a perp.: perpendicular, par.: parallel. | |||||||||||
| E cell [kPa] | 0.7 | E PDMS [MPa] | 1.5 | 1.5 | 1.6 | 1.6 | μ [°] | 0 | 8 | 0 | 0 |
| ν cell [—] | 0.3 | t PDMS [μm] | 9.4 | 10.7 | 7.1 | 7.7 | σ [°] | 180.0 | 14.9 | 180.0 | 12.7 |
| ν PDMS [—] | 0.496 | t cell [μm] | 3.3 | 3.3 | 4.1 | 4.1 | |||||
Immunofluorescence
After culture, four samples per staining per group (Fig. 1) were fixed with 3.7% formaldehyde (Merck, Schiphol-Rijk, The Netherlands) in PBS for 15 minutes at room temperature. The cells were subsequently permeabilized, blocked against non-specific binding, and stained for either phosphorylated myosin light chain II and actin, α-actinin 4 and actin, or lamin B1. Actin was stained with phalloidin-Atto 488 (Sigma). The other proteins were stained using the following antibodies: mouse-anti-phosphorylated myosin light chain II (#3675, Cell Signaling, Danvers, MA), streptavidin-Alexa 647 (Invitrogen), biotin labeled horse-anti-mouse (Vector, Burlingame, CA), rabbit-anti-α-actinin 4 (ab108198, Abcam, Cambridge, United Kingdom), goat-anti-rabbit Alexa 647 (Molecular Probes, Leiden, the Netherlands), rabbit anti-lamin B1 (ab16048, Abcam), and swine-anti-rabbit FITC (DAKO, Glostrup, Denmark). After staining with DAPI and mounting with mowiol (Sigma), the samples were visualized using fluorescence microscopy (Axiovert 200M; Zeiss, Sliedrecht, The Netherlands). The lamin B1 stained cells were visualized with confocal microscopy (SPE; Leica, Mannheim, Germany). Cell thickness was determined from sagittal optical slices (XZ scan) of the lamin B1 stained cells combined with a custom Matlab (MathWorks, Natick, MA) script.Quantification of actin fiber and nuclear organization
Fluorescence microscopy images at 20 times magnification were analyzed using custom Matlab scripts to determine the actin fiber and nuclear orientation as described previously.8,30,31 In brief, the local Hessian matrix was determined on multiple scales and the probability of a pixel containing (part of an) actin fiber was calculated by means of the Frangi Vesselness.32 The direction of the largest eigenvector of the Hessian matrix of each pixel with a high Frangi Vesselness (>0.9995) was calculated to identify the local actin fiber orientation. This resulted in an actin fiber distribution for each image (40 images per group), which was subsequently characterized by fitting the following curve: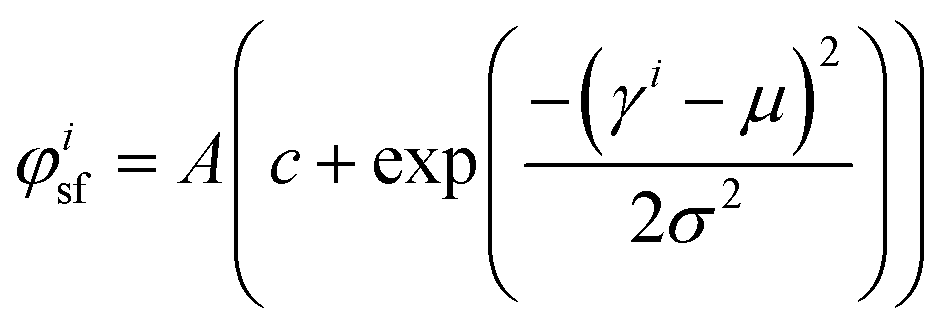 | (3) |
Furthermore, the percentage of pixels with a high Frangi Vesselness was calculated compared to the total number of pixels that were positive for actin staining, which is indicative of the relative amount of actin fibers in the monolayer.
Since the fiber orientation analysis script can only analyze actin fiber orientation and not content, and the amount of actin fibers varied considerably between the MEFs used in this study, the characteristics of the intracellular actin fiber organization were qualitatively scored by six independent researchers. A minimum of 50 cells per group were blindly scored according to the following criteria: abundant aligned actin fibers, aligned actin fibers, little/no actin fibers, cortical actin fibers, disrupted actin fiber organization, and ungradable cells. Examples of these cells are shown in Fig. 2b–f.
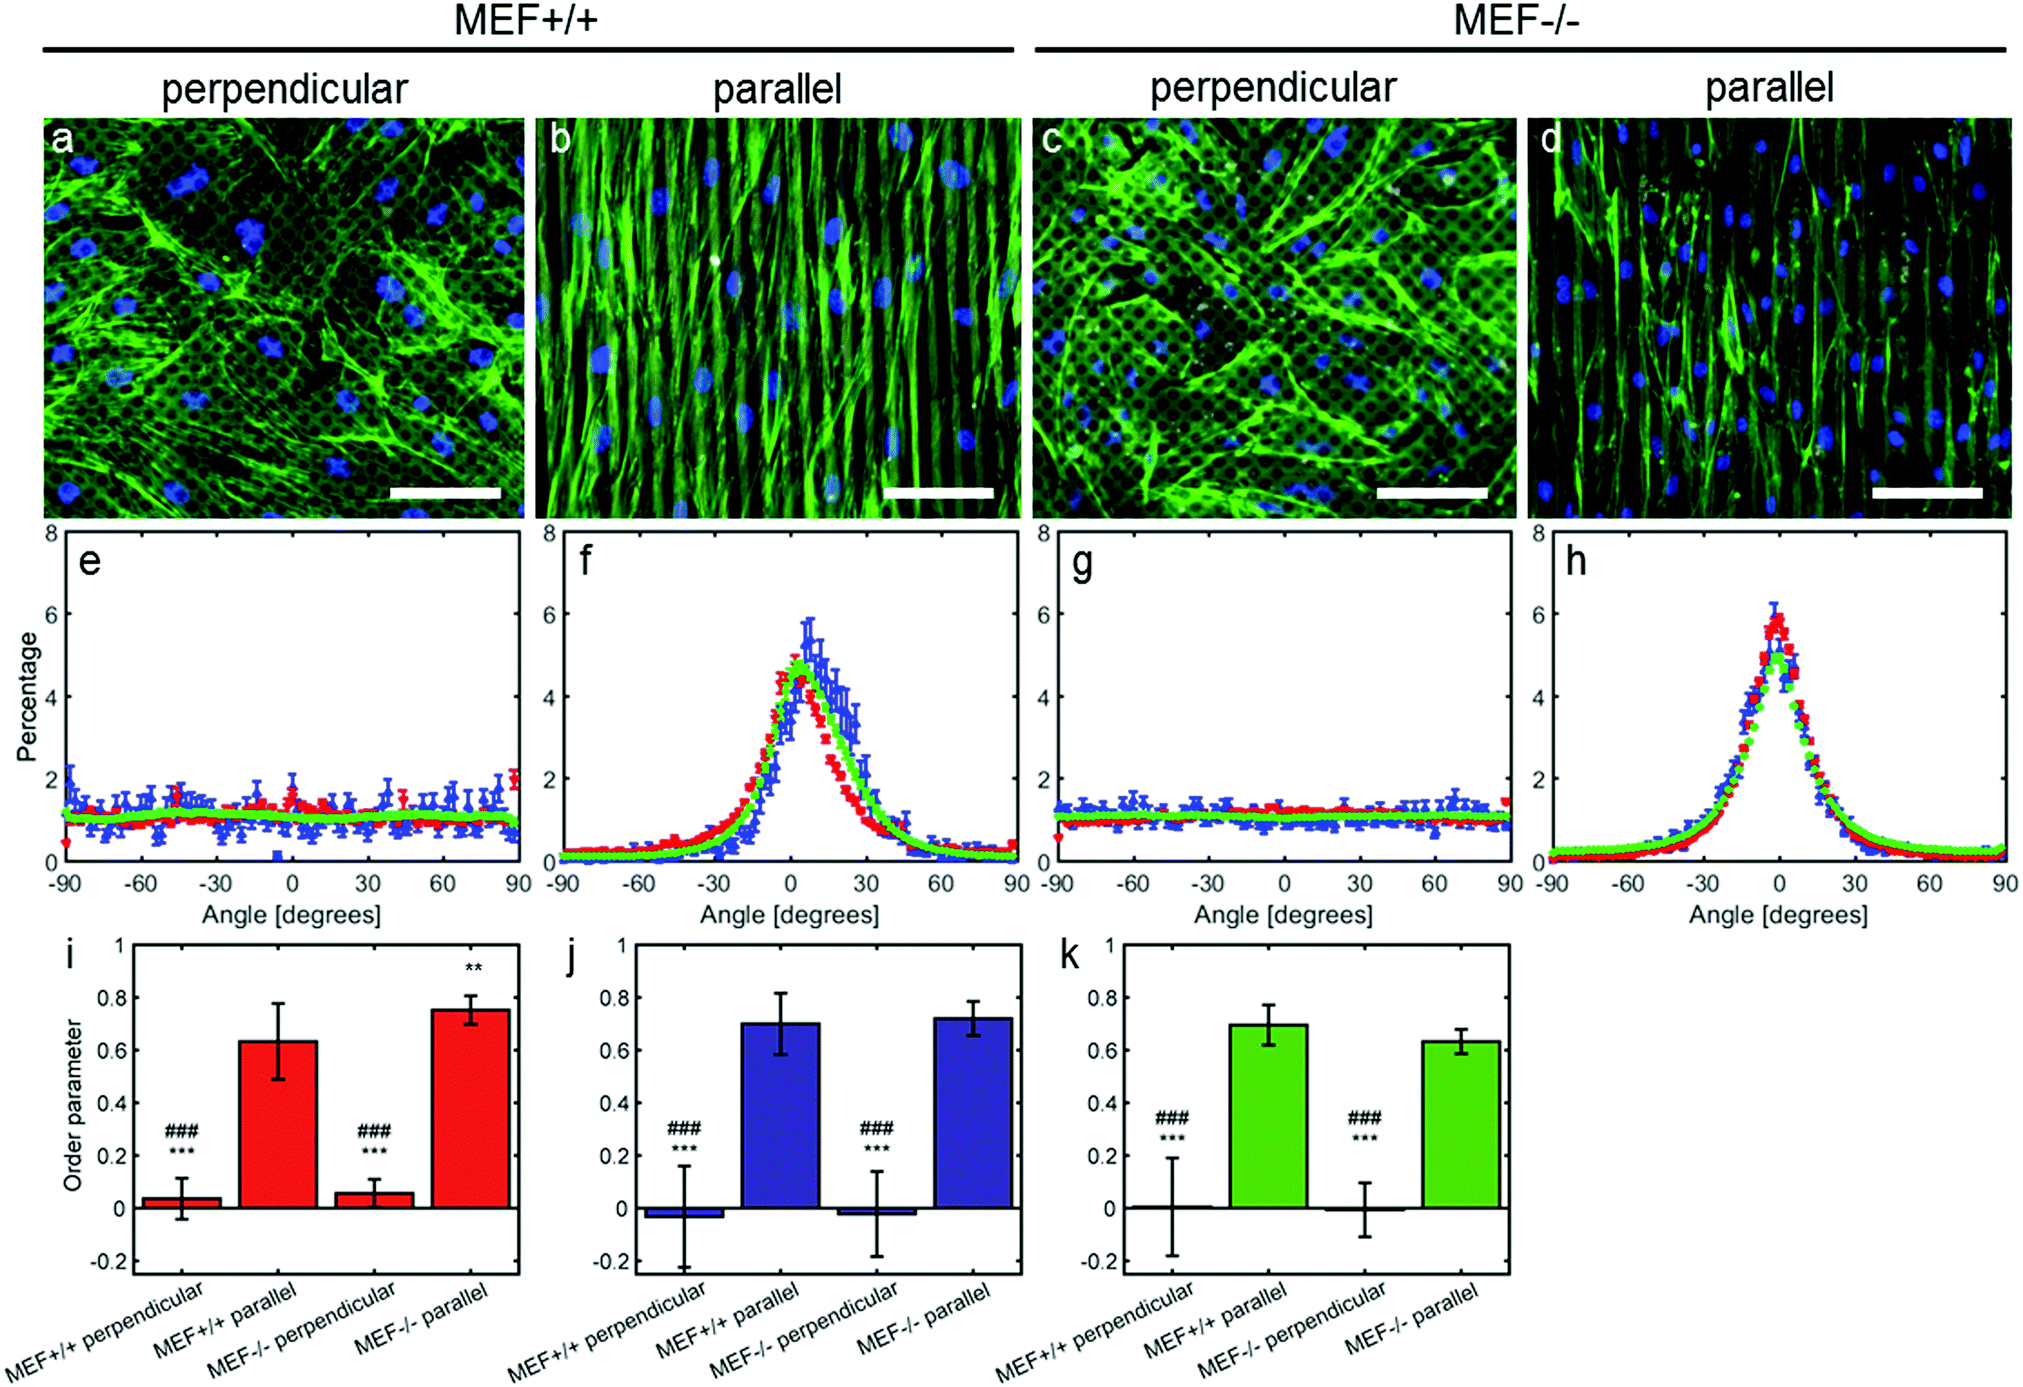 | ||
| Fig. 2 Representative fluorescence microscopy images of actin (green) and nuclei (blue) of MEFs cultured on perpendicular and parallel substrates (fibronectin in grey); scale bar is 100 μm (a–d). Corresponding histograms of the actin and nuclear orientation (e–h; mean ± standard error of mean). Red markers represent the nuclear orientation of the samples used for contractile stress measurements, blue markers represent nuclear orientation of the stained samples, and the green markers represent actin fiber orientation. Corresponding order parameter (i–k; mean ± standard deviation) of the nuclei of the samples used for contractile stress measurements (i; red), of the nuclei of the stained samples (j; blue) and of the actin fibers (k; green). *: significantly different from MEF+/+ parallel, and #: significantly different from MEF−/− parallel. Double symbols represent p < 0.01, and triple symbols represent p < 0.001. | ||
After thresholding the DAPI images (40 per group), an ellipse was fit through each nucleus and the aspect ratio (major axis/minor axis) and orientation of the major axis of the ellipse were determined. As for the actin fibers, an orientation distribution was determined (eqn (3)) containing the percentage of nuclei orientated at each angle. To compare the actin fiber and nuclear distributions between groups, an order parameter was calculated for both distributions. The order parameter S was calculated using:33
 | (4) |
Disruption of actin stress fibers
In order to investigate to what extent differences in actin stress fiber organization could be responsible for differences in contractile stress generation, actin stress fiber formation was inhibited using the actin polymerization inhibitor latrunculin B (LatB; Abcam). First, both Lmna+/+ and Lmna−/− MEFs were cultured on thin film constructs functionalized with parallel fibronectin lines according to the specifications described above. After two days of culture, samples were treated with 0.25 μM of LatB, and contractile stress measurement assays were performed. Pictures of the curvature were taken before the addition of LatB (0 min) and 5, 10 and 15 minutes after the addition of LatB. In-between time points, the samples were maintained at 37 °C and 5% CO2. Finally, the contractile stress was estimated as described above using the parameters described in Table 2. As for the previous experiment, the actin fiber orientation of the monolayer, intracellular actin fiber organization, and nuclear thickness were determined.| Chosen parameters | Measured | Fitted parameters | |||||
|---|---|---|---|---|---|---|---|
| All groups | MEF+/+ LatB | MEF−/− LatB | MEF+/+ LatB | MEF−/− LatB | |||
| E cell [kPa] | 0.7 | E PDMS [MPa] | 1.6 | 1.6 | μ [°] | 0 | 0 |
| ν cell [—] | 0.3 | t PDMS [μm] | 7.2 | 6.4 | σ [°] | 12.2 | 14.6 |
| ν PDMS [—] | 0.496 | t cell [μm] | 3.3 | 4.1 | |||
Statistical analysis
SPSS Statistics (IBM, Amsterdam, The Netherlands) was used to identify differences, which were considered significant at p < 0.05. Non-parametric tests were used to analyze the data to account for the non-normal distribution of the data. Differences in cell density between thin films that fall within and outside the measurement limits were analyzed using a student t-test. Differences in nuclear aspect ratio, percentages of pixels that are part of actin stress fibers, order parameter S, actin stress fiber organization, and σnorm between the four different groups were analyzed with a Kruskal–Wallis test followed by a pairwise Wilcoxon rank sum test with Bonferroni corrected levels as post hoc test. Spearman's correlation coefficient (ρ) was determined to investigate correlations between cell density and σmax for each experimental condition. Data described in the text are indicated as mean ± standard deviation.Results
Anisotropy sensing is intact in both Lmna−/− and Lmna+/+ MEFs
In order to test the anisotropy sensing capabilities of Lmna−/− MEFs, they were seeded on parallel and perpendicular substrates. In case the MEFs were cultured on parallel substrates, both cell types aligned along the fibronectin lines (Fig. 2). While both cell types showed a similar orientation, the peak of the orientation distribution of the Lmna+/+ MEFs was slightly shifted from 0° (8°) and was wider (σ in Table 1) than that of the Lmna−/− MEFs. This could be caused by the fact that Lmna+/+ MEFs are larger in size and can therefore spread on top of more fibronectin lines at a small angle (Fig. 2f and h). However, this did not lead to differences in the order parameter (S ≥ 0.63) of the actin and nuclear orientation of both cell-types (Fig. 2i–k), indicating that both cell types align in the direction of the fibronectin lines. When cultured on the perpendicular substrates, both wild-type and knockout MEFs adopted a random orientation (Fig. 2e and g; S ranging from −0.03 to 0.06). These data showed that there were no differences in the anisotropy sensing capabilities of both cell types.On both the parallel and perpendicular substrates, both cell types showed to be elongated as indicated by their elongated nuclei (nuclear aspect ratio: 1.6 ± 0.1 and 1.5 ± 0.1 for Lmna+/+ MEFs and 1.6 ± 0.1 and 1.7 ± 0.1 for Lmna−/− MEFs on the parallel and perpendicular substrates respectively).
Lmna knockout MEFs are less contractile compared to their wild-type counterparts
Stress generation was measured immediately after release of the thin film and one hour later when the contractile equilibrium was reached. In case the contractile stress was too low to be measured due to lack of curvature, the stress of these samples was assumed to be 0 kPa (Fig. 3a, top). The samples for which the finite element model could not reach the high curvature found in the experiments (Fig. 3a, bottom) were omitted from further stress analysis. Fig. 3b shows the percentages of samples within and above the measurement limit for each group and time point. Of each experimental group, the cell density of the thin films that fell above the measurement limit was significantly higher compared to the films that fell within the measurement limits, with an average difference of 93 cells per mm2 for the Lmna+/+ MEFs (p < 0.01) and 151 cells per mm2 for the Lmna−/− MEFs (p < 0.001). Of the samples that fell within the measurement limit, at both time points, the stress in the monolayer was generally highest for wild-type MEFs on parallel substrates and increased with increasing cell density (Fig. 3c and d). For Lmna−/− MEFs on parallel substrates, σmax also increased with increasing cell density. No strong relationship between σmax and the cell density was found for both cell types on the perpendicular substrates. In case the monolayer stress was normalized for cell density (Fig. 4), σnorm of Lmna knockout MEFs was significantly lower compared to wild-type MEFs on parallel substrates (0 h/1 h: 2.9/4.5 Pa versus 27.1/28.8 Pa (medians)). On the perpendicular substrates, σnorm of the Lmna knockout MEFs was also lower compared to wild-type MEFs, however only significant at 1 h (0 h/1 h: 2.1/2.0 Pa versus 6.3/7.7 Pa (medians)). For both cell types, σnorm was lower on perpendicular substrates compared to the parallel substrates indicating a trend in increasing σnorm for increasing cell alignment. However this difference was only significant for the Lmna+/+ MEFs. In summary, on both substrate types Lmna−/− MEFs had a five times lower contractile stress generation at equilibrium compared to Lmna+/+ MEFs.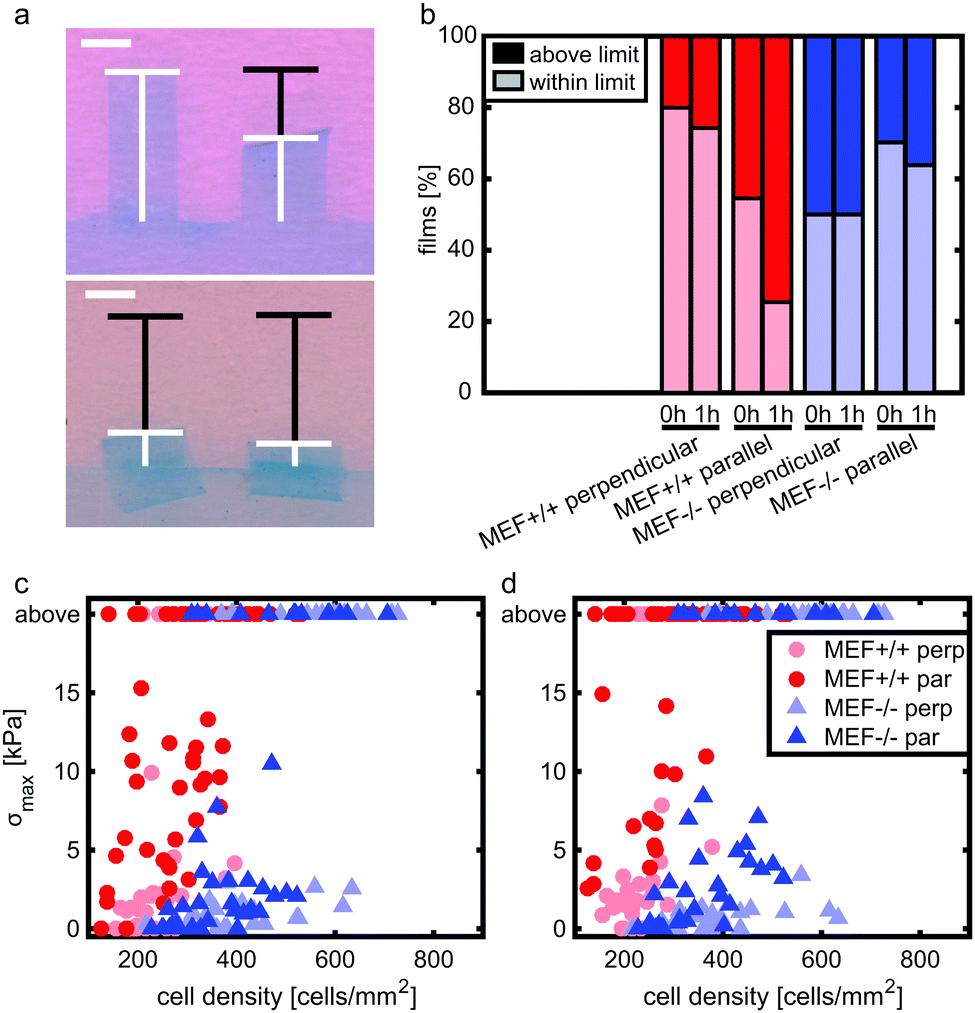 | ||
| Fig. 3 Examples of films with wildtype MEFs on parallel substrates that fall within (a; top) and above (a; bottom) the measurement limit, including graphical representations of their projection length (white) and original length (black); scale bar is 1 mm. The top left film shows no curvature; therefore the stress is assumed to be zero. The top right film falls within the measurement range. The bottom two films fall above the measurement limit since they have too much curvature to reach convergence of the finite element model. Percentages of films that fall within and above the measurement limit (b). σmax depicted against the cell density at 0 h (c) and 1 h (d), including the cell density of the films that fall above the measurement limit. Of the films that fall within the measurement range, n = 20–33 at 0 h (c) and n = 14–30 at 1 h (d). | ||
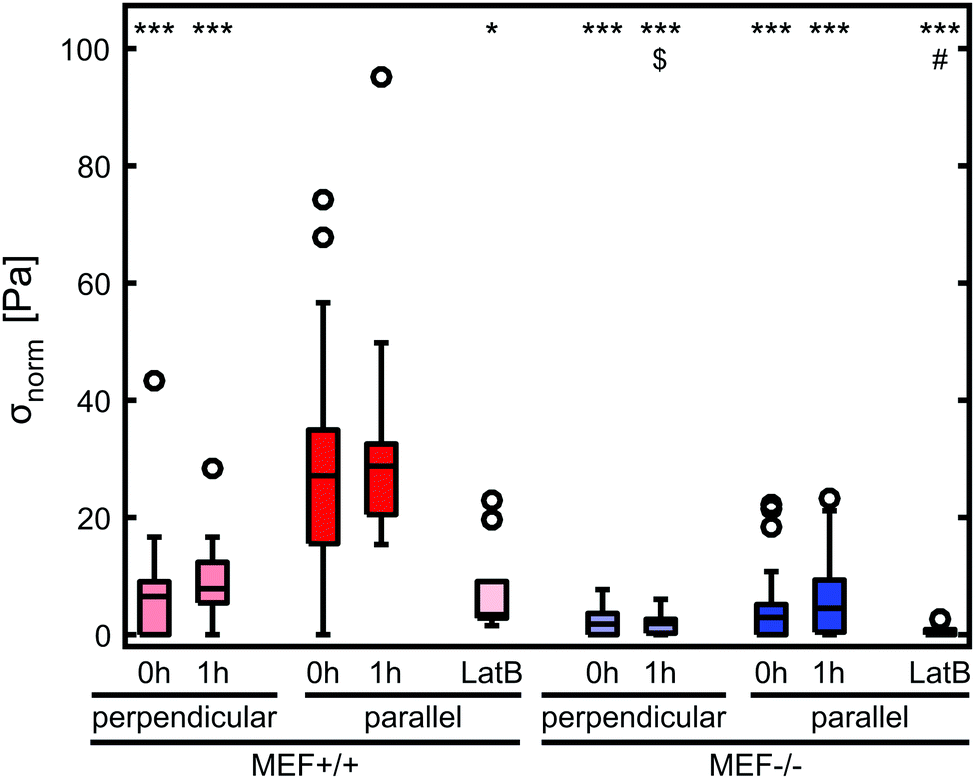 | ||
| Fig. 4 σ max normalized for cell density (σnorm) at both time points and at 15 min after the addition of LatB. Lmna+/+ MEF boxes are depicted in red and Lmna−/− MEF boxes are depicted in blue. *: significantly lower than MEF+/+ parallel at the same time point, $: significantly lower than MEF+/+ perpendicular at the same time point, and #: significantly lower than MEF+/+ parallel after 15 min of incubation with LatB. A single symbol represents p < 0.05, and triple symbols represent p < 0.001. n = 12–33 per group. | ||
Lmna knockout leads to an impaired actin fiber organization
To examine how the lower contractile stress generation of the Lmna knockout MEFs could be related to the actin stress fiber organization, the actin fiber organization of (individual) wild-type and knockout MEFs was investigated. The amount of actin fibers present in the monolayers (e.g. percentage of pixels with a high Frangi Vesselness) was highest in case of Lmna+/+ MEFs on parallel substrates (8.9 ± 0.8%) while it was marginally, though significantly, lower in Lmna−/− MEFs on parallel substrates (6.7 ± 0.4%). Likewise, on the perpendicular substrates, more pixels were detected as being part of a fiber for wild-type MEFs (6.6 ± 0.8%) compared to knockout MEFs (5.7 ± 0.3%). As only marginal differences were found in the amount of actin fibers in the monolayer and because the fiber orientation analysis script cannot discriminate the actin fiber content of individual cells, the intracellular actin stress fiber organization was blindly scored by six independent researchers. On both perpendicular and parallel substrates, respectively, 34 ± 14% and 56 ± 9% of the Lmna+/+ MEFs had abundant aligned actin stress fibers, while in Lmna−/− MEFs this was only 5 ± 8% (perpendicular) and 1 ± 2% (parallel) (Fig. 5). In Lmna+/+ MEFs 13 ± 8% (perpendicular) and 9 ± 8% (parallel) of the cells had little/no actin fibers, compared to 54 ± 16% (perpendicular) and 61 ± 11% (parallel) in Lmna−/− MEFs (Fig. 5). For both Lmna−/− and Lmna+/+ MEFs, the differences in actin stress fiber organization were similar when the cells were cultured on the two different substrates. Thus, Lmna−/− MEFs had a significantly less organized actin stress fiber organization compared to Lmna+/+ MEFs. | ||
| Fig. 5 Manual scoring of intracellular actin fiber organization (a). Typical examples of cells with abundant aligned actin fibers (b), aligned actin fibers (c), little/no actin fibers (d), cortical actin fibers (e), and a disrupted actin fiber organization (f). Actin is stained in green and nuclei in blue. Horizontal lines in (a) denote significant differences between two groups in percentage of cells with (1) abundant aligned actin fibers, (2) aligned actin fibers, (3) little/no actin fibers, and (4) cortical actin fibers. | ||
Lmna knockout MEFs have less cytoskeletal components that are necessary for contractile stress generation
As stress fibers containing actin and phosphorylated myosin light chain II (hereafter referred to as pMyosin) are necessary for contractile stress generation, we qualitatively investigated these contractile components via immunofluorescent staining (Fig. 6). In all groups, pMyosin was observed to co-localize with the actin fibers, indicating that Lmna−/− MEFs, like Lmna+/+ MEFs, have the tools for generating contractile stress. However, in Lmna knockout MEFs the actin fibers were usually observed to be thinner and less prominent (Fig. 6g and h) than in the wild-type MEFs (Fig. 6e and f) and the pMyosin staining followed this pattern (Fig. 6i–l). Next to that, pMyosin was found to be deposited in the perinuclear region in Lmna−/− MEFs, while actin was not observed there. Summarizing, Lmna knockout MEFs were observed to contain co-localizing actin and pMyosin, although in a lesser extent compared to wild-type MEFs.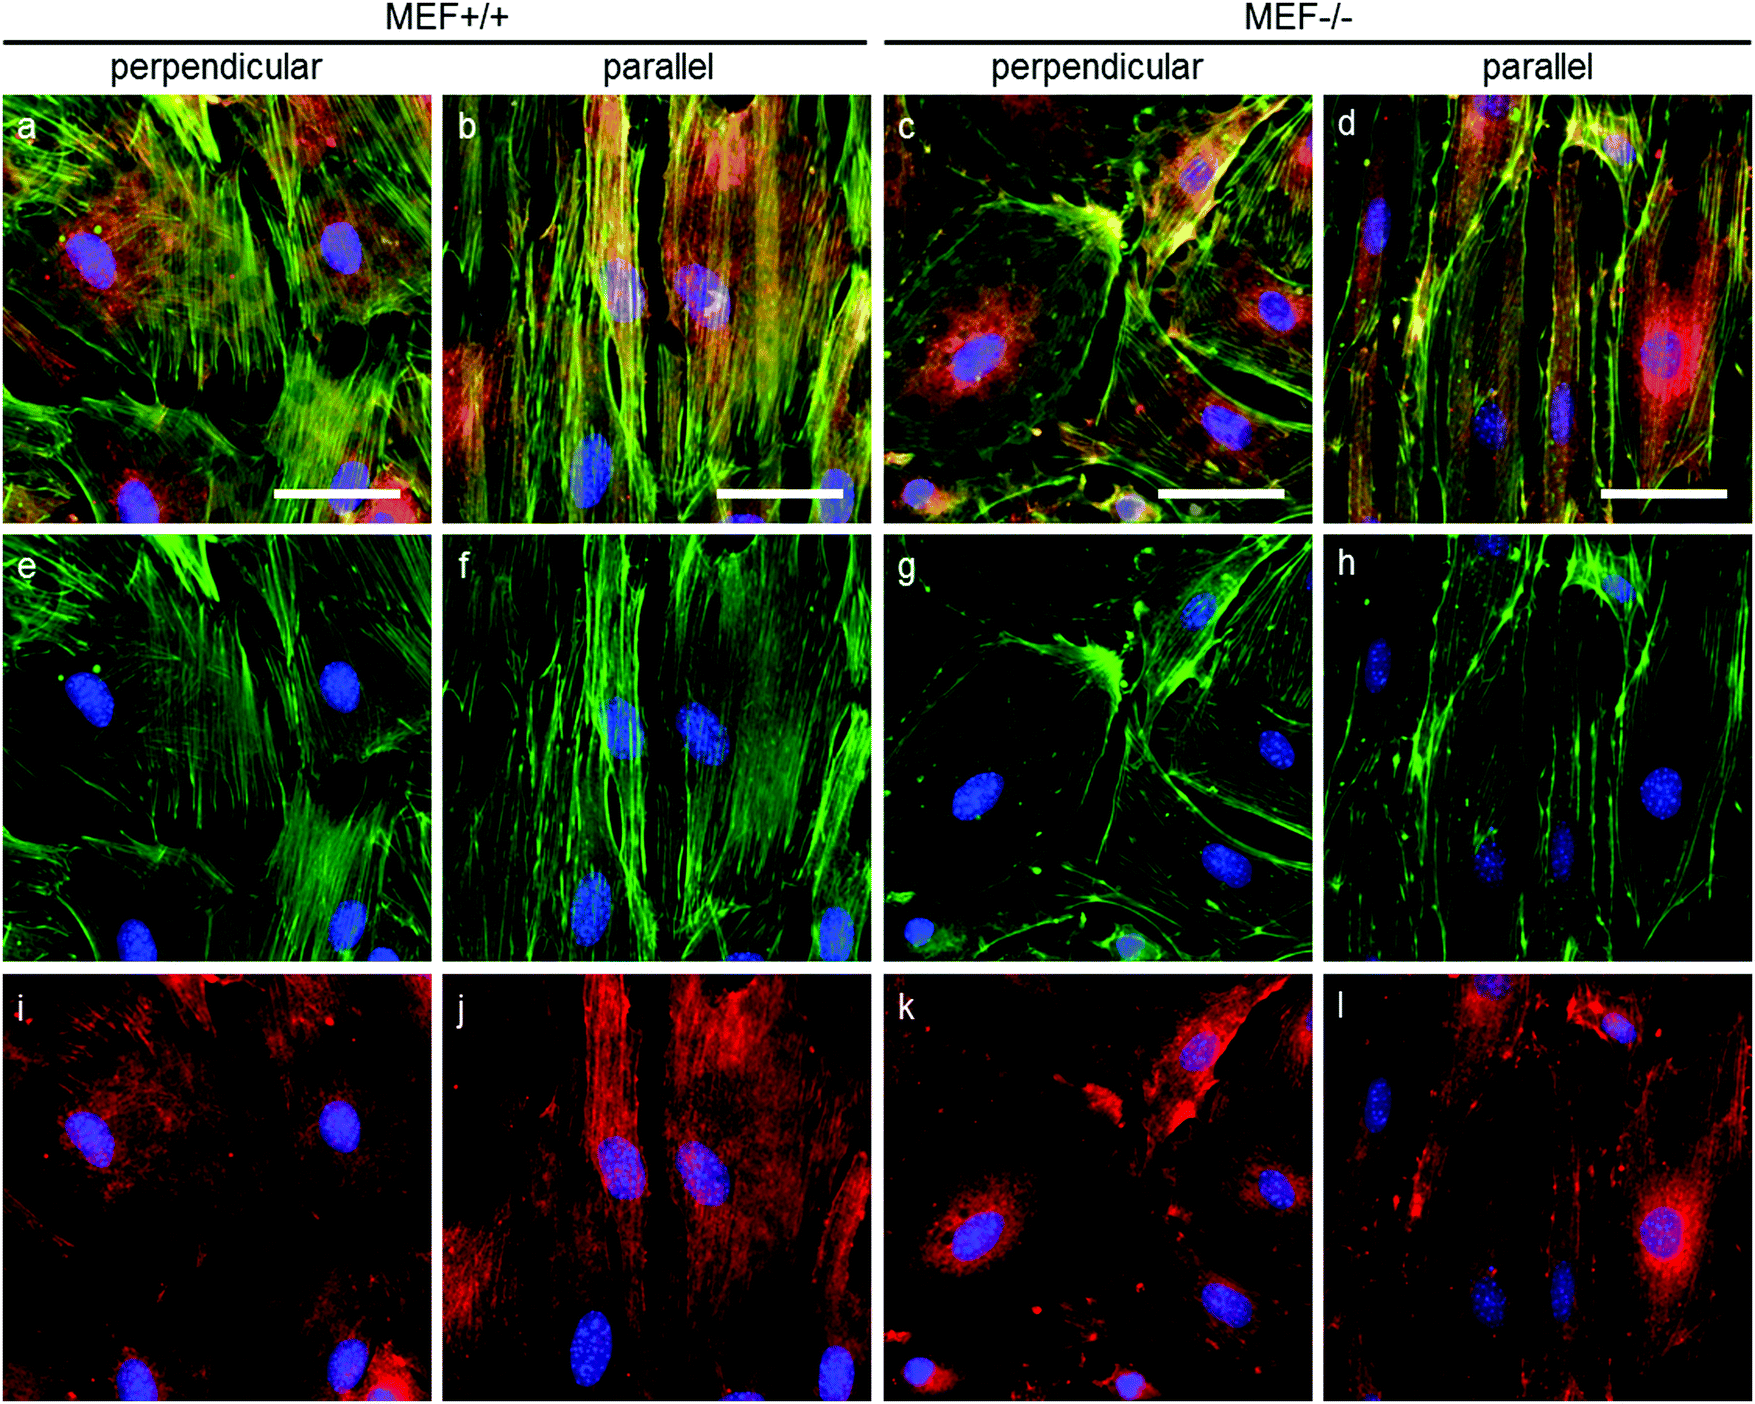 | ||
| Fig. 6 Representative fluorescence microscopy images of actin (green), pMyosin (red) and nuclei (blue) of MEFs cultured on perpendicular and parallel substrates (fibronectin in grey). Merged images are shown on the top row (a–d), actin and nuclei are shown on the middle row (e–h) and pMyosin and nuclei are shown on the bottom row (i–l); scale bar is 50 μm. The images shown here are representative of four independent samples. | ||
In order to apply stress onto their surroundings, the stress fibers need to be coupled to the substrate via focal adhesions. α-Actinin 4 was used as a focal adhesion marker as it is found in mature focal adhesions34 and acts as actin fiber cross linker.35 In both Lmna+/+ and Lmna−/− MEFS, α-actinin 4 was observed to localize mainly at the end of the actin fibers, an indication of the presence of mature focal adhesions in both cell types (Fig. 7). In general, cells with less prominent actin fibers (Fig. 7e–h) showed less prominent α-actinin 4 staining (Fig. 7i–l) at the focal adhesion sites. Since the Lmna−/− MEFs did not show many prominent actin fibers, this led to small focal adhesions as show by the α-actinin 4 staining (Fig. 7k and l). Next to this, α-actinin 4 was observed to extend from the focal adhesion sites into the direction of the actin fibers in Lmna+/+ MEFs (arrows in Fig. 7i and j). In correspondence with the complete cell, the focal adhesions were observed to orient mainly in the direction of the parallel fibronectin lines, while they adopted a more random organization on the perpendicular substrate for both cell types. Taken together, Lmna−/− MEFs do form the focal adhesions that are necessary to be able to apply stress onto the surroundings. These focal adhesions, however, were less prominent compared to Lmna+/+ MEFs.
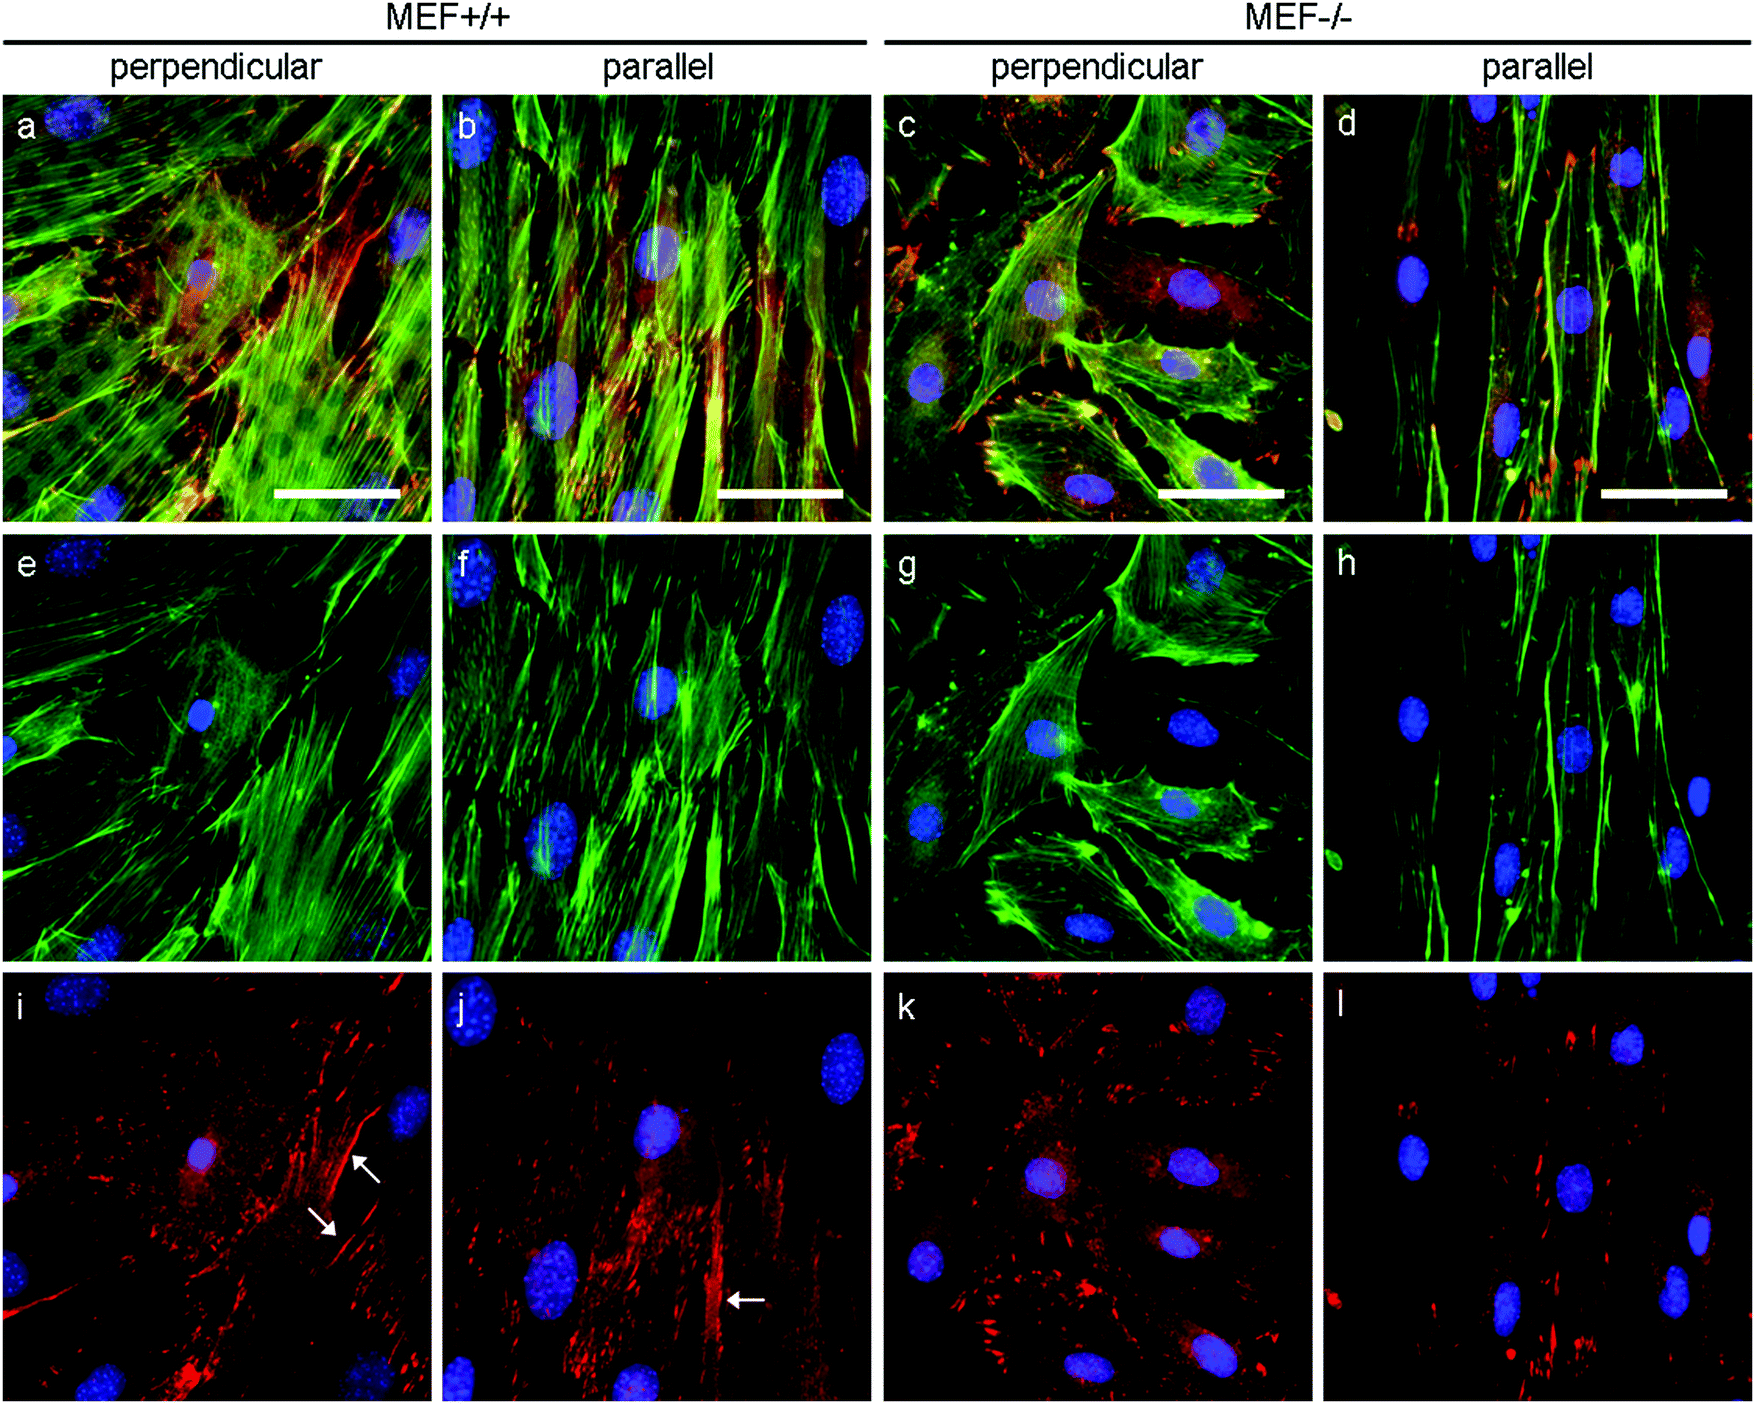 | ||
| Fig. 7 Representative fluorescence microscopy images of actin (green), α-actinin 4 (red) and nuclei (blue) of MEFs cultured on perpendicular and parallel substrates (fibronectin in grey). Merged images are shown on the top row (a–d), actin and nuclei are shown on the middle row (e–h) and α-actinin 4 and nuclei are shown on the bottom row (i–l). Arrows point to examples of elongated focal adhesions that extend into the direction of the actin fibers; scale bar is 50 μm. The images shown here are representative of four independent samples. | ||
Disruption of the actin fiber organization of wild-type MEFs leads to a comparable stress generation as by Lmna−/− MEFs
In order to verify that the lower contractile stress generation of Lmna−/− MEFs is caused by their impaired actin fiber organization, LatB was added to the medium of both wild-type and knockout MEFs. Since LatB depletes the monomeric actin pool, a decrease in σnorm over time was expected. Indeed, after the addition of LatB, a rapid decrease in σnorm was found within 15 minutes for the Lmna+/+ MEFs, while the σnorm of Lmna−/− MEFs stopped decreasing after 10 minutes (Fig. 8). After 15 minutes of LatB treatment the σnorm of Lmna+/+ MEFs (median: 3.4 Pa) was significantly lower than σnorm on parallel substrates without the addition of LatB (median: 27.1 Pa) and was comparable to the σnorm of untreated Lmna−/− MEFs on parallel substrates (median: 2.9 Pa; Fig. 4). The LatB treated Lmna−/− MEFs (median σnorm: 0.5 Pa) were less contractile than both the untreated and LatB treated Lmna+/+ MEFs.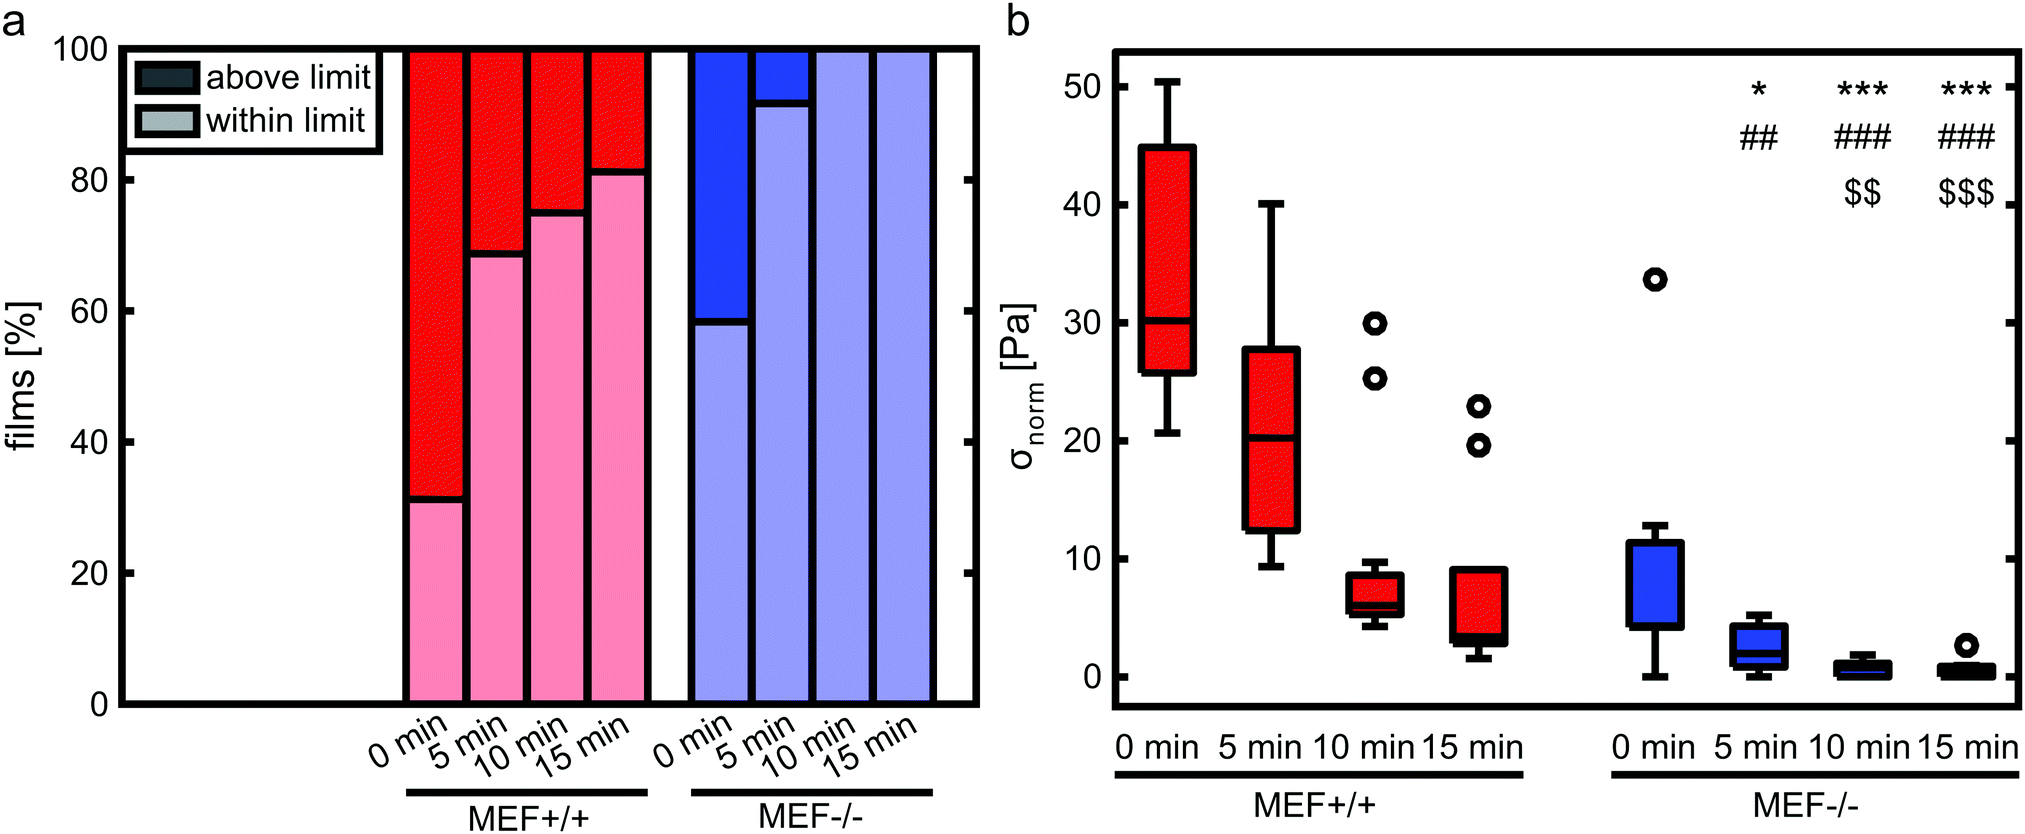 | ||
| Fig. 8 Percentage of films treated with LatB that fall within and above the measurement limit (a). Of the films within the measurement limits, σnorm was determined before the addition of LatB (0 min) and at 5, 10 and 15 min after addition of LatB (b; n = 7–13 per group). Symbols denote significant differences between the two cell types. *: significantly lower than MEF+/+ at 0 min, #: significantly lower than MEF+/+ at 5 min, and $: significantly lower than MEF+/+ at 10 min. A single symbol represents p < 0.05, double symbols represent p < 0.01, and triple symbols represent p < 0.001. | ||
The actin fiber organization of control cells and of cells treated with 0.25 μM LatB for 15 minutes was scored by six independent researchers. Using this method, the amount of abundant aligned actin fibers of Lmna+/+ MEFs was shown to be more than 10-fold lower compared to non-treated cells (2 ± 1% vs. 31 ± 18%; Fig. 9) Next to this, 36 ± 24% of the cells had little/no actin fibers, similar to the Lmna−/− MEFs (34 ± 15% with little/no fibers; Fig. 9). For Lmna−/− MEFs the percentage of cells with abundant aligned actin fibers was also lower (9 ± 15% to 0%) after the addition of LatB, while the percentage of cells with little/no actin fibers was higher (from 34 ± 15% to 69 ± 24%). The similarities found in both actin fiber organization and contractile stress generation between the LatB treated Lmna+/+ MEFs and the untreated Lmna−/− MEFs support the hypothesis that the decreased contractile stress generation of Lmna−/− MEFs was indeed caused by their impaired actin stress fiber organization.
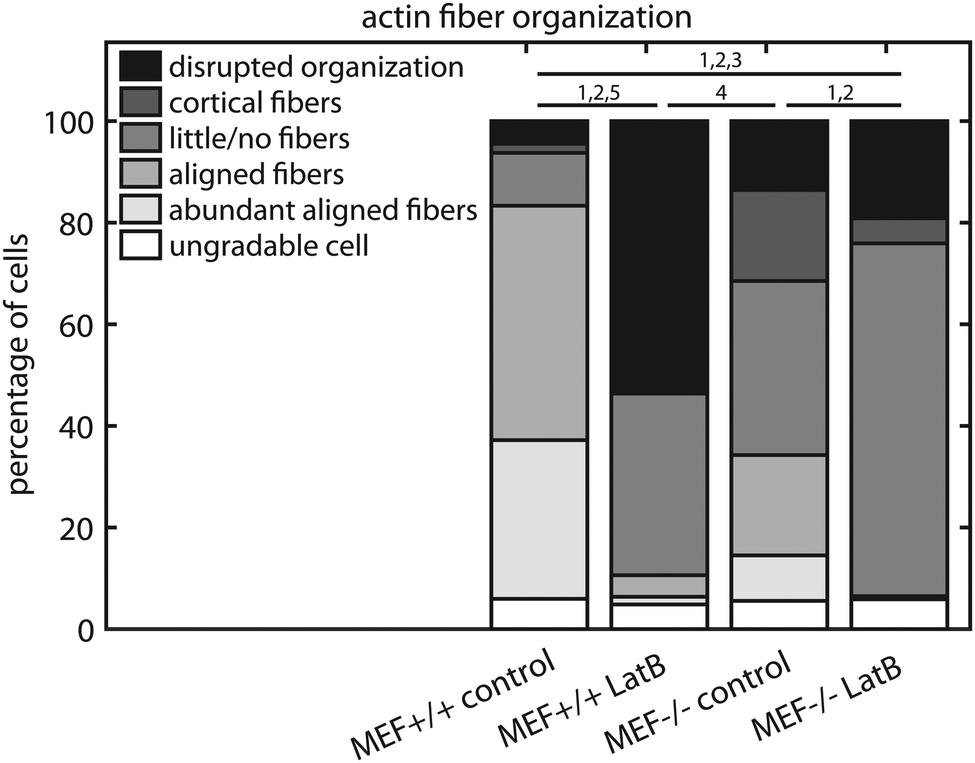 | ||
| Fig. 9 Manual scoring of intracellular actin fiber organization of cells treated with LatB for 15 minutes. Horizontal lines in denote significant differences between two groups in percentage of cells with (1) abundant aligned actin fibers, (2) aligned actin fibers, (3) little/no actin fibers, (4) cortical actin fibers, and (5) disrupted actin fiber organization. | ||
Discussion
In this work, using the thin film method, we quantitatively demonstrated a five times lower contractile stress generation in Lmna knockout fibroblasts as compared to their wild-type counterparts on both parallel and perpendicular substrates. This reduction was strongly associated with an impaired actin stress fiber organization. More specifically, we showed that Lmna−/− MEFs contained less well-organized actin stress fibers with less pMyosin co-localizing with the actin fibers and smaller focal adhesions compared to their wild-type counterparts. Even though the impaired actin stress fiber organization led to a decrease in contractility, the anisotropy sensing apparatus of Lmna−/− MEFs was not affected by the Lmna knockout as the cells were able to align along micro-contact printed fibronectin lines, which is in correspondence with previous studies.16,36 The fivefold lower contractile stress generation of Lmna−/− MEFs could be explained by their impaired actin stress fiber organization since a comparable reduction in contractile stress generation was found in experiments in which latrunculin B was used to disrupt the actin stress fiber organization of wild-type MEFs. These findings indicate that the impaired actin stress fiber organization of Lmna knockout MEFs can be directly responsible for their fivefold lower contractile stress generating capabilities compared to their wild-type counterparts.In our previous study, no difference in the amount of actin was found between Lmna−/− and Lmna+/+ MEFs.16 In our present study, however, when actin stress fiber organization was taken into account, clear differences were found between the knockout and wild-type MEFs. The Lmna+/+ MEF monolayers consisted mainly of cells with aligned actin stress fibers, while the cells in the Lmna−/− MEF monolayers mainly had a poor actin stress fiber organization. This impaired actin stress fiber organization can directly explain the significantly lower contractile stress generation of the Lmna−/− MEFs. These results suggest that the organization of the contractile elements, rather than their presence is of importance for proper contractile functioning of the cell.
Similar to the studies by Hale et al.9 and Corne et al.,37 we observed smaller focal adhesions in Lmna knockout MEFs. In contrast, our recent publication by Tamiello et al.16 did not observe a difference in focal adhesion size between the two cell types. In the latter study, however, the focal adhesion size was limited to the surface of the microposts on which the cells were cultured. This restricted the maximum focal adhesion size to the size of one micropost, which was the same for both cell types.16 In the case of the present study and the studies by Hale et al.9 and Corne et al.,37 the focal adhesions could grow in size unrestrictedly. Remarkably, the LMNA knockdown human dermal fibroblasts (hDFs) used in the study by Corne and colleagues,37 demonstrated to be more contractile compared to their counterparts treated with non-targeting control siRNA when measured using traction force microscopy (TFM). This difference in contractility between this study and the study by Corne et al. could be caused by the impaired stiffness sensing apparatus of the LMNA knockdown hDFs. Previously, it has been shown that laminopathic myoblasts plated on soft substrates (12 kPa) were highly spread with a similar actin fiber organization as on rigid (glass) substrates.38 While the control myoblasts, like any other adherent cell,39 did not spread on soft substrates.38 Hence, we speculate that instead of examining the effect of LMNA knockdown on hDF contractility, the difference Corne and colleagues37 found is actually a reduction of traction force of their control hDFs due to the low substrate stiffness (15 kPa) they used. Contrarily, a recent study by Booth-Gauthier et al.40 did find similar impaired mechanical functioning of fibroblasts from a Hutchinson-Gilford progeria syndrome (HGPS) patient compared to our results. In that study, cellular traction stress was measured using TFM of HGPS fibroblasts and control parental fibroblasts. Average traction stress of control cells was 1.6 times higher than that of HGPS cells, and maximum traction stress was even 2.5 times higher.40 This difference is smaller than the 5 times higher contractile stress of the Lmna+/+ MEFs compared to the Lmna−/− MEFs found in the present study, likely due to the fact that in the HGPS cells lamin A is altered and not completely missing.
Previously, we found that the orientation of Human Vena Saphena Cells (HVSCs; characterized as myofibroblasts41) did not have any effect on σnorm,8 while in this study significant differences in σnorm were found between the lmna+/+ MEFs on parallel and perpendicular substrates. This indicates that in case of Lmna+/+ MEFs there is probably a synergistic effect of cell alignment on the stress generation while in HVSCs there is not. We speculate that this difference could be caused by the difference in cell differentiation and shape between the HVSCs and wild-type MEFs. As the MEFs are still a quite plastic embryonic cell type,42 they can adopt a more rounded morphology on the perpendicular substrates compared to the HVSCs, which are expected to be equally elongated on both substrate types since the HVSCs are fully differentiated adult cells.41
To confirm the relationship between the impaired actin fiber organization of the Lmna knockout MEFs and their lower contractile stress generation, the stress measurement experiments were repeated with wild-type and Lmna knockout MEFs of which the actin stress fiber network was disrupted by LatB. Both the LatB treated Lmna+/+ MEFs and the untreated Lmna−/− MEFs mainly contained cells with little/no or disrupted actin fibers. Next to this, the amount of contractile stress generation of the Lmna+/+ MEFs treated with LatB resembled that of the Lmna−/− MEFs, suggesting that the alterations seen in the stress fiber organization of Lmna−/− MEFs could explain the reduced stress generation of these cells. In Lmna−/− MEFs, no significant difference was found in the amount of contractile stress generation after addition of LatB, likely because disruption of the already impaired actin stress fiber organization of the Lmna−/− MEFs had little effect on their defective contractile stress generation. In fact, the residual contractility that was found in Lmna−/− MEFs could be attributed to other cytoskeletal components such as vimentin.43 Lanzicher et al.44 recently found a similar disruption of the actin cytoskeleton of wild-type neonatal rat ventricular myocytes when treated with cytochalasin D, compared to cells with a mutated form of lamin A (D192G). Both the chemical treatment and the Lmna mutation led to comparable alterations of the mechanical properties of the myocytes. These results are supported by a study by Lee et al.45 that found similar alterations in cellular mechanical properties using Lmna−/− MEFs and chemically treated Lmna+/+ MEFs. The results of the present study show that not only the mechanical properties of Lmna−/− MEFs were altered44,45 due to impaired stress fiber organization but also the ability to exert contractile stress is affected by Lmna knockout.
Next to disrupting the actin stress fiber organization, we also attempted to enhance the actin stress fiber contractility with the Rho activator LPA, in order to try to rescue the contractile stress generation capabilities of Lmna−/− MEFs. No increase in contractile stress generation was found after the addition of LPA (data not shown), likely due to the presence of serum in the culture medium. LPA is found in serum in an albumin-bound form46 which can activate actin stress fiber formation before the addition of LPA itself. Most studies that investigated the effect of LPA on actin stress fiber formation therefore first serum starve the cells before addition of LPA.47,48 However, serum starvation also causes the existing actin stress fiber network to deplete which leads to a loss of the initial actin stress fiber organization that was intended to be enhanced. Therefore, this method was not suitable for enhancement of the actin stress fiber network in our experiments.
Preferably, the actin fiber organization of individual cells would have been analyzed quantitatively. However, since most quantitative analysis tools can only analyze actin fiber orientation and not content, and the amount of actin fibers varied considerably between the MEFs used in this study, it was not possible to analyze the actin fiber organization quantitatively. Even though the qualitative scoring method certainly has its limitations, we considered this method to be superior to using a quantitative order parameter that only considers the orientation of actin fibers, to identify differences between the wild-type and Lmna knockout MEFs. In order to obtain the most reliable scoring of the data as possible, six researchers from within and outside the field blindly scored the actin fiber organization.
A limitation of the current study is that not all thin films that were created could be used for contractile stress analysis. On the parallel substrates, for example, 45% (0 h) and 75% (1 h) of the films with Lmna+/+ MEF monolayers fell above the measurement limit, while this was only 30% (0 h) and 36% (1 h) for the Lmna−/− MEFs. This limitation is due to the large deformations that the experimental films undergo that cannot be reached in the finite element model due to convergence issues. This is a limitation of the finite element model that we have used, as opposed to the analytical model that has been used previously.49 However, the latter approach was not suitable in this study as active stress fiber contractility and stress fiber organization cannot be incorporated in an analytical model. Even though the use of the finite element model caused a loss of samples in the high stress range, we expect that this has no major consequences for the conclusions of this study. Specifically, we hypothesize that the excessive stress generation by a large part of the Lmna+/+ MEF monolayers was likely to be due to the presence of a higher cell density compared to the films that could be analyzed (Fig. 3c and d). This assumption is supported by the significant difference in cell density between the samples that fall within and above the measurement limits together with the observation that the cell densities of the analyzed Lmna+/+ samples were generally lower than those of the analyzed Lmna−/− samples. Consequently, the analyzed set of Lmna+/+ samples is still likely to represent the relationship between monolayer contractility and cell density within the analyzed range of cell densities since the samples that could not be analyzed fall mostly out of that range. Even though we accounted for the differences in contractile stress generation between the different groups by adjusting the PDMS thickness used for each group, future studies should optimize the PDMS thickness even further or use a range of PDMS thicknesses for each group to create a wider range of contractile stress measurements.
Lmna knockout not only affects actin stress fiber organization but also the organization of other cytoskeletal components like microtubules and vimentin.11,12 Even though actin stress fibers are one of the key players in contractile stress generation, vimentin50–52 and microtubules53,54 are involved in stress generation as well. Future studies should point out whether changes in these cytoskeletal components affect contractile stress generation and to what extent.
Even though the effect of laminopathies on cell functioning is increasingly better understood, there is still a long way to go in grasping the diversity in pathology of laminopathic patients. The thin film method used in this study could be a useful tool in aiding to understand this diversity in pathology. As more and more different laminopathies are diagnosed through the aid of gene sequencing, also more and more different pathological effects on cell functionality emerge. By seeding patient fibroblasts (an easily obtained cell source) on the thin film constructs the effect of the divers LMNA mutations on mechanical functioning, in the form of contractile stress generation, could quantitatively be assessed.
Conclusion
In summary, we have shown that differences in contractile stress generation between Lmna−/− and wild-type fibroblasts can be readily quantified using the thin film method. Using this method we found a fivefold lower contractile stress generation by Lmna−/− MEFs compared to Lmna+/+ MEFs. The findings of this study further suggest that not the presence of actin stress fibers but rather their organization is of importance for proper mechanical functioning of fibroblasts. The impaired actin stress fiber organization of Lmna−/− MEFs can be directly responsible for their fivefold lower contractile stress generation. This was verified by the comparable contractile stress generation between Lmna knockout MEFs and wild-type MEFs of which the actin stress fiber organization was disrupted with the actin polymerization inhibitor latrunculin B. These data demonstrated the devastating effect of a disturbed stress fiber organization on the contractile stress generation of Lmna−/− fibroblasts and show that the thin film method could be a promising tool in quantitatively examining the effect of different LMNA mutations on cell contractility.Conflict of interest
There are no conflicts of interest to declare.Acknowledgements
The authors would like to thank Marloes Janssen, Marina van Doeselaar and Maurice Halder for their assistance with the immunofluorescence staining and Marc van Maris for his help with the PDMS thickness measurements. We would also like to thank Patrick Alford and his group at the University of Minnesota for their assistance with the thin film method. This work was supported by a grant from the Dutch Government to the Netherlands Institute for Regenerative Medicine (NIRM Grant No. FES0908).References
- J. D. Humphrey, E. R. Dufresne and M. A. Schwartz, Nat. Rev. Mol. Cell Biol., 2014, 15, 802–812 CrossRef CAS PubMed.
- J. Eyckmans, T. Boudou, X. Yu and C. S. Chen, Dev. Cell, 2011, 21, 35–47 CrossRef CAS PubMed.
- C. S. Chen, J. Cell Sci., 2008, 121, 3285–3292 CrossRef CAS PubMed.
- N. Wang, J. D. Tytell and D. E. Ingber, Nat. Rev. Mol. Cell Biol., 2009, 10, 75–82 CrossRef CAS PubMed.
- C. Tamiello, A. B. Buskermolen, F. P. Baaijens, J. L. Broers and C. V. Bouten, Cell Mol. Bioeng., 2016, 9, 12–37 CrossRef CAS PubMed.
- C. Tamiello, C. V. Bouten and F. P. Baaijens, Sci. Rep., 2015, 5, 8752 CrossRef PubMed.
- G. D. van, A. Driessen-Mol, F. P. Baaijens and C. V. Bouten, Cell Tissue Res., 2013, 352, 727–737 CrossRef PubMed.
- I. A. van Loosdregt, S. Dekker, P. W. Alford, C. W. Oomens, S. Loerakker and C. V. Bouten, Cardiovasc. Eng. Technol., 2016 DOI:10.1007/s13239-016-0283-9.
- C. M. Hale, A. L. Shrestha, S. B. Khatau, P. J. Stewart-Hutchinson, L. Hernandez, C. L. Stewart, D. Hodzic and D. Wirtz, Biophys. J., 2008, 95, 5462–5475 CrossRef CAS PubMed.
- J. L. Broers, E. A. Peeters, H. J. Kuijpers, J. Endert, C. V. Bouten, C. W. Oomens, F. P. Baaijens and F. C. Ramaekers, Hum. Mol. Genet., 2004, 13, 2567–2580 CrossRef CAS PubMed.
- F. Houben, F. C. Ramaekers, L. H. Snoeckx and J. L. Broers, Biochim. Biophys. Acta, 2007, 1773, 675–686 CrossRef CAS PubMed.
- F. Houben, C. H. Willems, I. L. Declercq, K. Hochstenbach, M. A. Kamps, L. H. Snoeckx, F. C. Ramaekers and J. L. Broers, Biochim. Biophys. Acta, 2009, 1793, 312–324 CrossRef CAS PubMed.
- Y. Gruenbaum and R. Foisner, Annu. Rev. Biochem., 2015, 84, 131–164 CrossRef CAS PubMed.
- J. L. Broers, F. C. Ramaekers, G. Bonne, R. B. Yaou and C. J. Hutchison, Physiol. Rev., 2006, 86, 967–1008 CrossRef CAS PubMed.
- P. Isermann and J. Lammerding, Curr. Biol., 2013, 23, R1113–R1121 CrossRef CAS PubMed.
- C. Tamiello, M. Halder, M. A. Kamps, F. P. Baaijens, J. L. Broers and C. V. Bouten, J. Cell Sci., 2017, 130, 779–790 CrossRef PubMed.
- J. Lammerding, P. C. Schulze, T. Takahashi, S. Kozlov, T. Sullivan, R. D. Kamm, C. L. Stewart and R. T. Lee, J. Clin. Invest., 2004, 113, 370–378 CrossRef CAS PubMed.
- M. Zwerger, D. E. Jaalouk, M. L. Lombardi, P. Isermann, M. Mauermann, G. Dialynas, H. Herrmann, L. L. Wallrath and J. Lammerding, Hum. Mol. Genet., 2013, 22, 2335–2349 CrossRef CAS PubMed.
- L. J. Emerson, M. R. Holt, M. A. Wheeler, M. Wehnert, M. Parsons and J. A. Ellis, Biochim. Biophys. Acta, 2009, 1792, 810–821 CrossRef CAS PubMed.
- D. H. Kim, A. B. Chambliss and D. Wirtz, Soft Matter, 2013, 9, 5516–5523 RSC.
- P. Naumanen, P. Lappalainen and P. Hotulainen, J. Microsc., 2008, 231, 446–454 CrossRef CAS PubMed.
- V. Nikolova, C. Leimena, A. C. McMahon, J. C. Tan, S. Chandar, D. Jogia, S. H. Kesteven, J. Michalicek, R. Otway, F. Verheyen, S. Rainer, C. L. Stewart, D. Martin, M. P. Feneley and D. Fatkin, J. Clin. Invest., 2004, 113, 357–369 CrossRef CAS PubMed.
- M. E. Cattin, A. Ferry, A. Vignaud, N. Mougenot, A. Jacquet, K. Wahbi, A. T. Bertrand and G. Bonne, Neuromuscular Disord., 2016, 26, 490–499 CrossRef PubMed.
- V. F. Gnocchi, J. Scharner, Z. Huang, K. Brady, J. S. Lee, R. B. White, J. E. Morgan, Y. B. Sun, J. A. Ellis and P. S. Zammit, PLoS One, 2011, 6, e16651 CAS.
- P. W. Alford, A. W. Feinberg, S. P. Sheehy and K. K. Parker, Biomaterials, 2010, 31, 3613–3621 CrossRef CAS PubMed.
- A. W. Feinberg, A. Feigel, S. S. Shevkoplyas, S. Sheehy, G. M. Whitesides and K. K. Parker, Science, 2007, 317, 1366–1370 CrossRef CAS PubMed.
- A. Grosberg, P. W. Alford, M. L. McCain and K. K. Parker, Lab. Chip., 2011, 11, 4165–4173 RSC.
- C. A. Sevilla, D. Dalecki and D. C. Hocking, Tissue Eng., Part A, 2010, 16, 3805–3819 CrossRef CAS PubMed.
- V. P. Terranova, M. Aumailley, L. H. Sultan, G. R. Martin and H. K. Kleinman, J. Cell Physiol., 1986, 127, 473–479 CrossRef CAS PubMed.
- J. Foolen, V. S. Deshpande, F. M. Kanters and F. P. Baaijens, Biomaterials, 2012, 33, 7508–7518 CrossRef CAS PubMed.
- J. Foolen, M. W. Janssen-van den Broek and F. P. Baaijens, Acta Biomater., 2014, 10, 1876–1885 CrossRef CAS PubMed.
- A. Frangi, W. Niessen, K. Vincken and M. Viergever, Med. Image. Comput. Comput. Assist. Intervent., 1998, vol. 1496, pp. 130–137 Search PubMed.
- H. J. Hsu, C. F. Lee, A. Locke, S. Q. Vanderzyl and R. Kaunas, PLoS One, 2010, 5, e12470 Search PubMed.
- C. K. Choi, M. Vicente-Manzanares, J. Zareno, L. A. Whitmore, A. Mogilner and A. R. Horwitz, Nat. Cell Biol., 2008, 10, 1039–1050 CrossRef CAS PubMed.
- B. M. Jockusch and G. Isenberg, Proc. Natl. Acad. Sci. U. S. A., 1981, 78, 3005–3009 CrossRef CAS.
- S. B. Khatau, C. M. Hale, P. J. Stewart-Hutchinson, M. S. Patel, C. L. Stewart, P. C. Searson, D. Hodzic and D. Wirtz, Proc. Natl. Acad. Sci. U. S. A., 2009, 106, 19017–19022 CrossRef CAS PubMed.
- T. D. Corne, T. Sieprath, J. Vandenbussche, D. Mohammed, L. M. Te, K. Gevaert, S. Gabriele, K. Wolf and W. H. De Vos, Cell Adh. Migr., 2016, 1–17 Search PubMed.
- A. T. Bertrand, S. Ziaei, C. Ehret, H. Duchemin, K. Mamchaoui, A. Bigot, M. Mayer, S. Quijano-Roy, I. Desguerre, J. Laine, Y. R. Ben, G. Bonne and C. Coirault, J. Cell Sci., 2014, 127, 2873–2884 CrossRef CAS PubMed.
- D. E. Discher, P. Janmey and Y. L. Wang, Science, 2005, 310, 1139–1143 CrossRef CAS PubMed.
- E. A. Booth-Gauthier, V. Du, M. Ghibaudo, A. D. Rape, K. N. Dahl and B. Ladoux, Integr. Biol., 2013, 5, 569–577 RSC.
- A. Mol, M. C. Rutten, N. J. Driessen, C. V. Bouten, G. Zund, F. P. Baaijens and S. P. Hoerstrup, Circulation, 2006, 114, I152–I158 CrossRef PubMed.
- B. Yusuf, R. Gopurappilly, N. Dadheech, S. Gupta, R. Bhonde and R. Pal, Dev., Growth Differ., 2013, 55, 330–340 CAS.
- B. Eckes, D. Dogic, E. Colucci-Guyon, N. Wang, A. Maniotis, D. Ingber, A. Merckling, F. Langa, M. Aumailley, A. Delouvee, V. Koteliansky, C. Babinet and T. Krieg, J. Cell Sci., 1998, 111(Pt 13), 1897–1907 CAS.
- T. Lanzicher, V. Martinelli, L. Puzzi, F. G. Del, B. Codan, C. S. Long, L. Mestroni, M. R. Taylor and O. Sbaizero, Sci. Rep., 2015, 5, 13388 CrossRef PubMed.
- J. S. Lee, C. M. Hale, P. Panorchan, S. B. Khatau, J. P. George, Y. Tseng, C. L. Stewart, D. Hodzic and D. Wirtz, Biophys. J., 2007, 93, 2542–2552 CrossRef CAS PubMed.
- W. H. Moolenaar, J. Biol. Chem., 1995, 270, 12949–12952 CrossRef CAS PubMed.
- M. Amano, K. Chihara, K. Kimura, Y. Fukata, N. Nakamura, Y. Matsuura and K. Kaibuchi, Science, 1997, 275, 1308–1311 CrossRef CAS PubMed.
- M. Chrzanowska-Wodnicka and K. Burridge, J. Cell Biol., 1996, 133, 1403–1415 CrossRef CAS PubMed.
- P. W. Alford, A. W. Feinberg, S. P. Sheehy and K. K. Parker, Biomaterials, 2010, 31, 3613–3621 CrossRef CAS PubMed.
- M. G. Mendez, D. Restle and P. A. Janmey, Biophys. J., 2014, 107, 314–323 CrossRef CAS PubMed.
- B. Eckes, D. Dogic, E. Colucci-Guyon, N. Wang, A. Maniotis, D. Ingber, A. Merckling, F. Langa, M. Aumailley, A. Delouvee, V. Koteliansky, C. Babinet and T. Krieg, J. Cell Sci., 1998, 111(Pt 13), 1897–1907 CAS.
- M. Gregor, S. Osmanagic-Myers, G. Burgstaller, M. Wolfram, I. Fischer, G. Walko, G. P. Resch, A. Jorgl, H. Herrmann and G. Wiche, FASEB J., 2014, 28, 715–729 CrossRef CAS PubMed.
- Y. C. Chang, P. Nalbant, J. Birkenfeld, Z. F. Chang and G. M. Bokoch, Mol. Biol. Cell, 2008, 19, 2147–2153 CrossRef CAS PubMed.
- R. A. Brown, G. Talas, R. A. Porter, D. A. McGrouther and M. Eastwood, J. Cell Physiol., 1996, 169, 439–447 CrossRef CAS PubMed.
| This journal is © The Royal Society of Chemistry 2017 |