 Open Access Article
Creative Commons Attribution 3.0 Unported Licence
Valorisation of agricultural waste with an adsorption/nanofiltration hybrid process: from materials to sustainable process design†
Christos
Didaskalou
 a,
Sibel
Buyuktiryaki
 b,
Rustem
Kecili
 b,
Claudio P.
Fonte
 a and
Gyorgy
Szekely
 *a
*a
aSchool of Chemical Engineering & Analytical Science, The University of Manchester, The Mill, Sackville Street, Manchester, M13 9PL, UK. E-mail: gyorgy.szekely@manchester.ac.uk; Tel: +44 (0)161 306-4366
bYunus Emre Vocational School, Anadolu University, Eskisehir, 26470, Turkey
First published on 12th May 2017
Abstract
Downstream processing is considered to be the bottleneck in pharmaceutical manufacturing because its development has not kept pace with upstream production. In some cases, the lack of efficient downstream processing capacity can seriously affect both the sustainability and profitability of a pharmaceutical product and even result in its failure. Minimising solvent and raw material consumption, as well as utilising waste, can make a significant difference towards environmentally benign and economically viable chemical production. In this work, the authors present the development and modelling of a continuous adsorption process with in situ solvent recovery for the isolation of oleuropein from olive leaves, an agricultural waste. Waste utilisation in agriculture has gained increasing attention because this economic sector is ranked as the 2nd highest global greenhouse gas emission contributor. Imprinted polymers were developed for the selective scavenging of oleuropein from olive leaf extracts using green solvents. The mild temperature-swing (25–43 °C) process allows the continuous isolation of oleuropein at 1.75 g product per kg of adsorbent per hour with an unprecedented 99.7% purity. In situ solvent recovery was realized with a solvent-resistant nanofiltration membrane allowing 97.5% solvent recycle and 44.5% total carbon footprint reduction, while concentrating both the product stream for crystallisation and the waste stream for disposal.
1. Introduction
Sustainable manufacturing is one of the grand challenges of the 21st century. The breakdown of the global greenhouse gas emissions by the economic sector indicates that industry (21%) and agriculture (24%) are responsible for almost half of the climate change.1 The importance of green chemistry and engineering has been recognised by governmental agencies, academics and many industries. In particular, pharmaceutical manufacturing is considered to be the leading sector in industrial sustainability achieved through the development of economically sound processes that minimize negative environmental impacts whilst improving safety and economic viability.2–6 Green solvents and reagents, solvent recovery, process optimisation and integration, energy conservation, waste minimisation, and utilisation of natural resources are becoming part of the engineers’ toolbox as a consequence of the sustainability paradigm shift.7 Utilisation of agricultural waste is an emerging field with great potential to drive sustainable production with diversified examples from renewable energy,8 wastewater treatment,9,10 polymer synthesis,11 and extraction of chemicals.12,13 Bioactive compounds or their precursors are extracted from both plants and animals by the pharmaceutical, personal care, food and nutritional industries with an estimated market size of over $250 billion.14 One of the most important classes of these bioactive compounds is biophenols.The olive and argan plants (Olea europeaea, Argania spinosa) have been historically providing invaluable economic and dietetic benefits to the Mediterranean and Middle East regions and beyond. The excellent properties of biophenols are a consequence of their pathogenic function in the tree. In particular, oleuropein is the most prominent biophenol with concentrations of about 60–140 mg g−1 of dry matter.15 It causes a bitter, pungent taste in olive oil; however it occurs in relatively large quantities in the olive leaf as well. The leaves are considered to be agricultural waste from the beating of olive trees for fruit harvest, and used as a livestock feed. Its pharmacological properties – such as antioxidant, anti-cancer, anti-inflammatory, anti-atherogenic, antimicrobial and antiviral activities, hypolipidemic and hypoglycemic effects – have been widely studied in recent years.16 Besides its direct pharmacological use, oleuropein can be converted into various high-value compounds,17 and thus it has been chosen as the model bioactive compound for the present study. There is wide interest in developing extraction and isolation methodologies for olive biophenols including column chromatography,18 superheated liquid extraction,19 instant controlled pressure drop texturing,20 reduced-pressure boiling extraction,21 and ultrasound- and microwave-assisted extraction.22,23
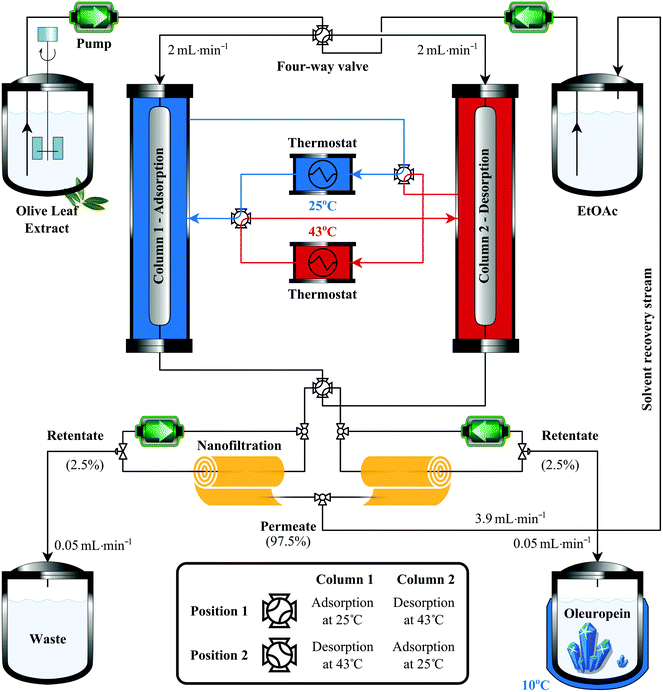
It has recently been realized that conventional downstream separation processes are unsustainable because they can account for as much as 80% of the total manufacturing costs and eventually contribute 50% of the industrial energy usage.24,25 With profit margins growing thin, there is an imperative drive for minimising both the cost and environmental impact via process intensification (PI). PI refers to a set of innovative principles in equipment and process design with the aim to achieve considerable benefits in process efficiency, operating expenses, product quality, reusability and waste.26 As effective PI tools, adsorption and membrane separations have been recognized as core technologies that provide more efficient process engineering.25,27 The present study demonstrates the development of molecularly imprinted polymers and the optimisation of a continuous isolation process coupled with nanofiltration-based solvent recovery for obtaining high-purity oleuropein from olive leaves (Fig. 1).
The field of organic solvent nanofiltration has significantly evolved in the past decade, and effective membrane materials are now available that can withstand severe conditions while completely retaining solutes as small as 100–300 g mol−1.28,29 These membranes facilitate the design of innovative process configurations that are capable of drastically reducing solvent consumption and enhancing the sustainability of the chemical industry.24,30 In parallel to membrane science, adsorbents have also markedly advanced in recent years. In particular, molecularly imprinted polymers have become more selective, robust and applicable in chemical engineering processes.31,32 In this work, the synergistic combination of imprinting and nanofiltration technologies is explored.
2. Results and discussion
2.1 Materials design for scavenging oleuropein
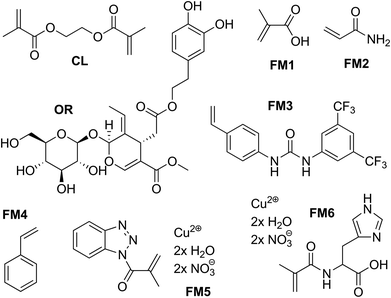
Molecular imprinting is a technique to design robust molecular recognition materials able to mimic natural recognition entities, such as antibodies and biological receptors. The preparation and application of molecularly imprinted polymers (IPs) have been thoroughly reviewed.33 Briefly, a specific compound is present during the polymerisation process which acts as a molecular template (Fig. 2). Building blocks are allowed to self-assemble with the template, and the functional groups are held in position via crosslinking polymerisation. Subsequent removal of the template by solvent extraction or chemical cleavage leaves binding sites that are complementary to the template in terms of both topography and chemical functionality.Fig. 3 shows the structures of the template, functional monomers and crosslinkers employed in the present study. Oleuropein has a multifaceted chemical nature having hydrogen donor and acceptor sites as well as an aromatic moiety capable of π–π interactions. Having such a versatile template in hand allowed the investigation of a range of functional monomers, such as carboxylic acid, urea, amide, amine and metal-chelate derivatives. A range of extraction solvents for initial screening were selected based on two criteria: (i) successfully used for biophenol extraction, and (ii) recommended by industrial solvent selection guides.2,34 Undesirable dipolar aprotic solvents were substituted with the environmentally benign alternative sulfolane.35
The solvents and adsorbents were screened through the comparison of the adsorption capacity and imprinting factor (Fig. 4). The adsorption capacity is defined as μmol oleuropein adsorbed per gram of polymer, while the imprinting factor is the ratio of the adsorption capacities of the imprinted and the corresponding control polymers. The development of an efficient continuous isolation process requires the adsorbent to have both high capacity and high selectivity. The imprinting factor indirectly describes the fidelity of the binding sites in the imprinted polymers, which is ultimately responsible for the selective scavenging of the target compound, oleuropein. The contour plots in Fig. 4 allow rapid identification of the most favourable conditions shown in red.
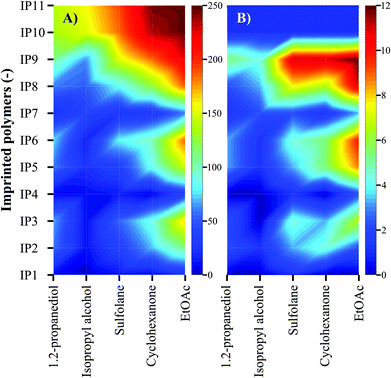 | ||
| Fig. 4 Solvent and adsorbent screening through evaluation of (A) adsorption capacity (μmol g−1) and (B) imprinting factor. The adsorbent mass to system volume ratio was fixed at 5 g L−1. Refer to the ESI† for the full screening results and reproducibility through adsorption–regeneration cycles. | ||
It can be deduced that for the extraction of oleuropein, ethyl acetate and cyclohexanone are the most superior solvents, followed by sulfolane. Ethyl acetate was chosen for the process development as it is ranked the highest among the tested solvents in the GSK solvent recommendation list.2 IP10 and IP11 prepared from metal-chelate monomers (FM5 and FM6, respectively) show the highest adsorption capacity of 250 ± 6 μmol g−1 but, on the other hand, the lowest imprinting factor of 2.3 ± 0.1. However, IP9 featuring a urea moiety (FM3) has a high binding capacity of 228 ± 4 μmol g−1 and the highest imprinting factor of 12.2 ± 0.3 outperforming IP10 and IP11. Consequently, IP9 was chosen for the development of the continuous isolation process. For engineering applications the reusability of the IPs through adsorption–desorption cycles is of utmost importance. Carefully selected IP regeneration conditions allow the reuse of these materials over 100 adsorption–regeneration cycles.31 Refer to the ESI† for the list of polymers and their stoichiometry (Table S1†).
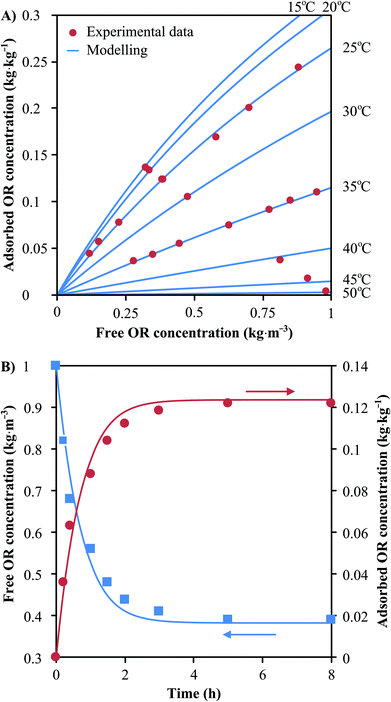
A mathematical model has been developed in order to describe the dynamics of adsorption and expedite the development of a continuous process for the separation of oleuropein (see section 4 of the ESI†). This model requires an expression for the equilibrium isotherm that is both a function of the concentration of oleuropein and the temperature. In this sense, the best adsorbent was further characterized for its full adsorption isotherm and kinetic behaviours. Fig. 5A shows the experimental data obtained for the equilibrium isotherm and the fitting curves at different temperatures. The fitting expression has been obtained from the nonlinear regression analysis of the experimental data of qeqvs. C in equilibrium at different temperatures ranging from 15 °C to 50 °C. Refer to section 5 of the ESI† for full isotherm analysis.
Additionally, the simulation of the transport of oleuropein molecules inside the polymer microbeads requires an estimation of the effective intra-particular mass diffusivity. In this work, this value has been obtained from adsorption kinetics experiments. Fig. 5B shows the evolution in time of the concentration of oleuropein in a liquid solution and the amount adsorbed in the polymer microbeads until thermodynamic equilibrium is achieved. A value of Deff = 1.07 × 10⁻¹⁴ m2 s−1 for a coefficient of determination R2 = 0.983 has been obtained from non-linear regression. Further information on the development of the mathematical framework of the adsorption column dynamical model and the estimation of the effective intra-particular diffusivity from experimental data can be found in the ESI, in sections 4 and 6,† respectively.
2.2 Process design for continuous isolation of oleuropein & in situ solvent recovery
Two preparative chromatography columns with 250 × 10 mm dimensions were wet-loaded with about 8 g of IP9. A mathematical model based on mass and heat balances to the flowing liquid (olive leaf extract) and stationary solid phase (IP9) in the adsorption column was used to describe the dynamics of the adsorption process. Refer to section 4 of the ESI† for the mathematical framework and assumptions. The effect of feed flow on the column outlet concentration, the exploitation rate of the column capacity, and the loss of oleuropein was investigated (Fig. 6). The aim of the parametric study was to define a suitable threshold concentration measured at the outlet of the column that, when reached, determines the end of the adsorption step (see Fig. S11 in the ESI†). The optimisation of the threshold concentration is not straightforward as it should be minimised in order to avoid wasting oleuropein and solvent, but on the contrary it should be maximized for better exploitation of the column adsorption capacity.A breakthrough curve of the adsorption process has been obtained experimentally to assess the validity of the developed numerical model. Fig. 6A shows the comparison between the experimental and numerical results for a flow rate of 2 mL min−1 at a constant temperature of 25 °C and a feed concentration of 0.966 g L−1. A good agreement has been obtained between the simulation and the experimental results, allowing validation of all the physical assumptions for building the numerical model. The validated model for the adsorption dynamics was used to perform a parametric study to evaluate the effect of the flow rate on the process. As the flow rate in the adsorption column is increased, a lower residence time is allowed to the oleuropein molecules for adsorption until equilibrium is reached (Fig. 6A). As expected, this results in breakthrough curves with higher variance. At a fixed value of threshold concentration, an increase in the flow rate reduces the fraction of the adsorption column capacity that can be used to avoid the dispersive front of oleuropein reaching the outlet of the column (Fig. 6B). Increasing the threshold concentration allows the utilisation of more column adsorption capacity but leads to increasing oleuropein waste. A compromise must be reached which can be seen in Fig. 6C that shows the variation of the ratio between the loss and processed oleuropein mass versus the threshold concentration for different flow rates. Consequently, for the subsequent studies in this work, a flow rate of 2 mL min−1 corresponding to 2.55 cm min−1 superficial velocity has been chosen. Due to its high cost (£8000 g−1)36 a threshold concentration of 0.05 g L−1 has been chosen to ensure that more than 99% of the total processed mass of oleuropein is being recovered. This means, however, that only 55% of the column's total adsorption capacity is being used, which could be further optimised by allowing changes in the column dimensions.
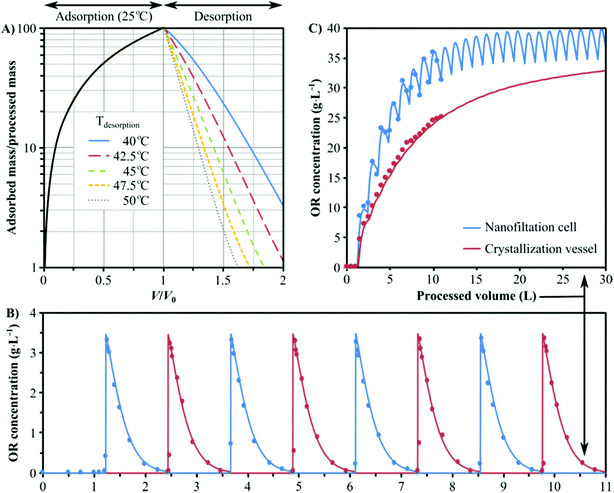
In order to minimise energy consumption and to simplify the process control and operation, the developed numerical model for the column dynamics has been used to determine the appropriate desorption temperature that would allow for equal times for the adsorption and desorption steps. The effect of the desorption temperature on the column's dynamics is shown in Fig. 7A, which revealed that 43 °C is the minimum temperature that ensures 99% recovery of oleuropein from the column as well as equal adsorption and desorption time. The latter warrants easy control and swapping between the columns by simultaneously turning the four-way valves to the other position after each cycle (see Fig. 1). The hybrid process comprising two columns coupled with in situ solvent recovery has been operated in a continuous mode up to eight cycles and compared with the numerical predictions (Fig. 7B). As per our expectations,31 the column outlet concentration shows a fully periodic evolution with no noticeable decline in the separation performance. At the termination of the continuous process (4 adsorption–desorption cycles on each column), 9.3 g of oleuropein was isolated at a rate of 1.75 g product per kg of adsorbent per hour.
As the speed of time-to-market is an important factor, solvent recycling is not usually considered in the early stages of process development; however, once a process is well-established, solvent recovery is one of the key upgrades considered to improve profit margins.29 The recent development of membrane technology enables the recovery of organic solvents under mild conditions.28–30 A series of commercial and in-house fabricated solvent-resistant nanofiltration membranes were tested at 10–40 bar using either crude oleuropein solution obtained from the olive leaf digestion process or purified oleuropein solution collected from the adsorbent column. The polybenzimidazole-based membrane was chosen for the solvent recovery unit since it has shown quasi 100% rejection of oleuropein (i.e. not detected in the permeate stream; LOD = 0.3 mg L−1) and other dissolved matter in the olive leaf extract. Refer to section 7 of the ESI† for the full membrane screening analysis. The nanofiltration unit was operated at 38–42 bar allowing the recovery of 97.5% of ethyl acetate (3.9 mL min−1) in the permeate, while the retentate streams contained the concentrated product and waste at a flow rate of 50 μL min−1 each (see Fig. 1). Fig. 7C shows the oleuropein concentration profile in the nanofiltration cell and the crystallisation flask (both experimental and numerical) using the set-up shown in Fig. 1. Note that up to this stage, the crystallisation vessel is being used only for retentate stream storage and that no crystallisation occurs. The concentration of oleuropein in the nanofiltration cell, due to the periodic nature of the process, evolves to a state where it continuously fluctuates at 35 ± 5 g L−1 after about 20 cycles. However, these concentration oscillations are completely dampened in the crystallisation vessel as higher volumes of retentate are being accumulated. This provides the possibility for coupling the continuous oleuropein isolation process with continuous crystallisation.
2.3 Sustainability assessment of the hybrid process
The global CO2 emission from the chemical industry is estimated to be 1.52 × 10¹⁸ tonnes per annum.37 Apart from being economically viable, new processes need to be environmentally benign. The major contributor to the environmental burden of the process is the solvent consumption (Fig. 8), which is common in the pharmaceutical sector where solvents can account for 80–90% of the total mass in manufacturing processes.38 Consequently, solvent management is of particular interest within the field of process intensification.39 The continuous process consumes 1834 kg ethyl acetate per kg isolated oleuropein which results in about 3631 kg of CO2 emission whether incinerated onsite or through outsourced services (Fig. 8). Instead, the preferred choice for the industrial sector is in situ solvent recovery as it reduces the cost of fresh solvent purchase, fresh and waste solvent storage, and disposal costs. The coupling of the nanofiltration-based solvent recovery unit with the continuous adsorption process resulted in 97.5% reduction in solvent consumption. Consequently, the E-factor of the process dropped to 66 kg kg−1, corresponding to 96.4% reduction. Furthermore, the carbon footprint of the process was reduced to 4411 kg kg−1, corresponding to 44.5% reduction. Nanofiltration is considered to be a benign technology, and an excellent choice for solvent recovery as it poses a low carbon footprint.29,30 The E-factor and carbon footprint of the nanofiltration-based solvent recovery were 0.00125 and 1.31 kg kg−1, respectively. These contributions are less than 0.1% of the respective metric's total value for the process.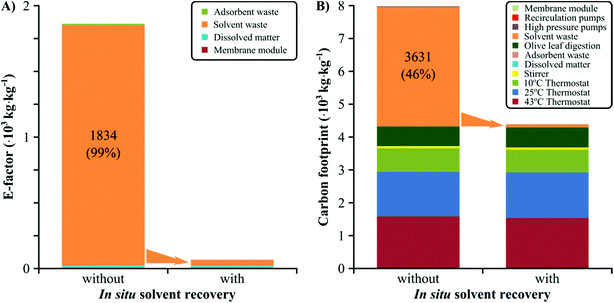 | ||
| Fig. 8 E-Factor and carbon footprint of the continuous oleuropein isolation process with and without in situ solvent recovery using nanofiltration. The E-factor and carbon footprint are expressed in kilogram waste and total equivalent kilogram of CO2 per kilogram of isolated oleuropein, respectively. Notice that the solvent recovery unit required two recirculation pumps and the disposal of membrane modules which have an additional environmental burden, albeit negligible. Refer to the ESI† for the calculations. | ||
In contrast to the proposed imprinting-based technology, olive leaf extraction reported in the literature results in a mixture of biophenols instead of the isolation of a single species. Reports on the isolation of oleuropein are scarce, and may include the use of (i) undesired solvents such as benzene, methylene chloride and diethyl ether, (ii) three-component solvent mixtures, (iii) the need for basic conditions (pH = 8–10), and (iv) process steps at as low temperature as 0 °C.18,40 Although green extraction procedures for oleuropein using supercritical CO2 have been reported,41,42 green metrics analysis and product purities were not included preventing direct process comparison.
3. Conclusions
Imprinted polymers were developed for the continuous isolation of oleuropein from olive tree leaves. In the search for a green process solvent, the adsorption capacities and imprinting factors of a series of imprinted polymers were compared, and ethyl acetate was found to be the most preferable solvent. In situ solvent recovery was realised through solvent resistant nanofiltration membranes that allowed the concentration of both the waste and product streams whilst recycling 97.5% of the ethyl acetate solvent as well as reducing the carbon footprint by 44.5%. The high selectivity of the imprinting technology allowed the recovery of oleuropein with 99.7% purity at a rate of 1.75 g product per kg of adsorbent per hour. A mathematical model for the adsorption dynamics was developed and demonstrated to be an advantageous tool for the in silico design and optimisation of the process, reducing the need for excessive experimentation. The mild temperature-swing process allowed the use of a single solvent for all the unit operations including olive leaf digestion (40 °C), adsorption (25 °C), desorption (43 °C) and crystallisation (10 °C). The process was designed for easy and simple operation; the swap between the adsorption and desorption is achieved through the switching of four-way valves, ensuring both continuous product isolation and continuous solvent recovery. The presented methodology opens up new ways for agricultural waste utilisation, and could be further exploited for the fractionation of various natural compounds.4. Experimental
4.1. General
Reagents (reagent grade) and solvents (analytical grade) were purchased from Sigma–Aldrich and Fisher Scientific, respectively. Oleuropein standard was sourced from Sigma–Aldrich and Biopurify Phytochemicals. Acetonitrile porogen was dried over baked 4 Å molecular sieves. Millipore Type II water was used for the coagulation bath. 26 wt% PBI (MW = 27![[thin space (1/6-em)]](https://www.rsc.org/images/entities/char_2009.gif) 000 g mol−1) containing 1.5 wt% lithium chloride (stabiliser) dissolved in N,N-dimethylacetamide (DMAc) solution was purchased from PBI Performance Products Inc., (USA). Non-woven polypropylene fabric (Novatexx 2471) was sourced from Freudenberg Filtration Technologies (Germany). Solvent-resistant nanofiltration membranes were purchased from Borsig GmbH and SolSep BV, respectively. 1H and 13C NMR spectra were recorded on a Bruker AV-400 spectrometer. A VWR-Hitachi Chromaster DAD-HPLC system equipped with an ACE 5 μm, C18, 100 Å, 150 × 4.6 mm column with a flow rate of 1 mL min−1 was used for the quality analysis of crude olive leaf extract and isolated oleuropein (250 nm) with a gradient elution. Eluent A was acetonitrile and eluent B was water containing 0.1% trifluoroacetic acid. The gradient was linear from 10 to 90% A in 60 min, followed by 90% A held for further 5 min and a re-equilibration period of 15 min. The column temperature was 25 °C and the injection volume was 15 μL. LCMS measurements were carried out on an Agilent 1100 HPLC equipped with a gradient pump, autosampler and PDA detector. A triple quadrupole mass spectrometer with a positive electrospray ionisation source was employed as the MS detector. The energy consumption of the equipment was measured with a Fluke 1736 power logger with resolution 10 mA and accuracy ±0.1%. Infrared spectra were recorded on a Bruker Alpha-T FT-IR spectrometer.
000 g mol−1) containing 1.5 wt% lithium chloride (stabiliser) dissolved in N,N-dimethylacetamide (DMAc) solution was purchased from PBI Performance Products Inc., (USA). Non-woven polypropylene fabric (Novatexx 2471) was sourced from Freudenberg Filtration Technologies (Germany). Solvent-resistant nanofiltration membranes were purchased from Borsig GmbH and SolSep BV, respectively. 1H and 13C NMR spectra were recorded on a Bruker AV-400 spectrometer. A VWR-Hitachi Chromaster DAD-HPLC system equipped with an ACE 5 μm, C18, 100 Å, 150 × 4.6 mm column with a flow rate of 1 mL min−1 was used for the quality analysis of crude olive leaf extract and isolated oleuropein (250 nm) with a gradient elution. Eluent A was acetonitrile and eluent B was water containing 0.1% trifluoroacetic acid. The gradient was linear from 10 to 90% A in 60 min, followed by 90% A held for further 5 min and a re-equilibration period of 15 min. The column temperature was 25 °C and the injection volume was 15 μL. LCMS measurements were carried out on an Agilent 1100 HPLC equipped with a gradient pump, autosampler and PDA detector. A triple quadrupole mass spectrometer with a positive electrospray ionisation source was employed as the MS detector. The energy consumption of the equipment was measured with a Fluke 1736 power logger with resolution 10 mA and accuracy ±0.1%. Infrared spectra were recorded on a Bruker Alpha-T FT-IR spectrometer.
4.2. Preparation of imprinted polymers
IP microspheres were prepared by a suspension polymerisation method according to our reported procedure.43 Briefly, in a typical IP fabrication procedure the methacrylic acid functional monomer (1 mmol), oleuropein template (1 mmol), EDMA cross-linker (15 mmol), AIBN initiator (0.1 wt%), perfluoro polymeric surfactant (PFPS) emulsifier (75 mg), perfluoro methylcyclohexane (PMC) dispersing phase (60 mL) and acetonitrile porogen (15 mL) were stirred at 300 rpm. The imprinted polymers were obtained by polymerisation involving irradiation of the stirred mixture with UV light for 6 hours at a wavelength of 365 nm at room temperature under an inert nitrogen atmosphere. The resulting beads were filtered and the remaining template and unreacted molecules were extracted by sequential washing with methanol. The IPs were dried under reduced pressure for 24 h at room temperature. Please refer to section 2 of the ESI† for detailed synthesis and characterisation of the imprinted polymers.4.3. Kinetic and adsorption isotherms
In a typical procedure 10 mL of 1 g L−1 oleuropein in ethyl acetate was loaded on 5, 15, 25, 50, 100, 150 and 200 mg adsorbents; the container was sealed, and placed in an incubator shaker at 25 °C and 300 rpm for 24 hours. Samples from the supernatants were taken in order to quantify oleuropein using an LCMS system. Samples were taken at 0.2, 0.4, 1, 1.5, 2, 3, 5, 8, 12 and 24 hours to obtain kinetic data.4.4. Nanofiltration performance evaluation
All nanofiltration experiments employed a 1 g L−1 oleuropein solution in ethyl acetate. The filtrations were carried out at 40 bar using a cross-flow filtration system with an effective membrane area of 52 cm2. The permeance of each membrane was calculated by dividing the ethyl acetate flux by the applied pressure. The rejection (R) of oleuropein was obtained by measuring its concentration in the permeate and the feed, and calculating the ratio of the molecules retained by the membrane.4.5. Digestion of olive leaves
Extraction of biophenols from olive leaves was carried out according to a previously reported procedure.22 In a typical procedure 1 kg of fresh olive leaves was milled and dried, followed by the loading of the obtained dry matter (620 ± 16 g) into the extraction chamber of an ultrasonic bath, which was assembled and filled with 6 litres of ethyl acetate leaching carrier. The digestion of the olive leaves was carried out for 60 min at 40 °C under ultrasonic irradiation using a Guyson KS300 tank resulting in 119 ± 9 g of dissolved matter.4.6. Continuous isolation of oleuropein & in situ solvent recovery
Schematic representation of the continuous adsorption system is shown in Fig. 1. The system consists of (i) two high pressure pumps (Gilson 305) for simultaneously transferring the olive leaf extract (adsorption) and ethyl acetate (desorption) onto the columns; (ii) a feed tank containing the olive leaf extract; (iii) an elution tank containing ethyl acetate for column regeneration and oleuropein desorption; (iv) a cooled vessel for the isolated oleuropein to be crystallized; (v) a vessel for the concentrated waste solution; (vi) two thermostats (Lauda RA12); (vii) two adsorption columns wet-packed with 8 g of IP; (viii) two nanofiltration rigs with recirculation pumps for concentrating the waste and the product and simultaneously recovering the solvent. The olive leaf extract and the washing solution were loaded onto the columns at a speed of 2 mL min−1 in an alternating manner: the adsorption was carried out at 25 °C on one column, while the desorption occurred at 43 °C on the other column. After the collection of 11 litres of processed volume the jacketed crystallisation vessel was cooled to 10 °C resulting in the precipitation of oleuropein. Please refer to section 9 of the ESI† for detailed optimisation of the experimental conditions.Acknowledgements
The authors are grateful to Dr Thanos Didaskalou and Gazi Buyuktiryaki for the leaves from their olive groves in Thessaloniki (Greece) and Mugla (Turkey), respectively. Useful discussions and analytical insights provided by Dr Jozsef Kupai from the Technical University of Budapest are greatly acknowledged. This work was supported by the Engineering and Physical Sciences Research Council [BioProNET BIV Nov15 Szekely]; the Biotechnology and Biological Sciences Research Council [BioProNET BIV Nov15 Szekely, BB/L013770/1]; and the Royal Academy of Engineering's Newton Research Collaboration Programme [NRCP1516/1/41].References
- O. Edenhofer, R. Pichs-Madruga, Y. Sokona, E. Farahani, S. Kadner, K. Seyboth, A. Adler, I. Baum, S. Brunner and P. Eickemeier, Contribution of Working Group III to the Fifth Assessment Report of the Intergovernmental Panel on Climate Change, 2014, 511–597.
- R. K. Henderson, C. Jiménez-González, D. J. Constable, S. R. Alston, G. G. Inglis, G. Fisher, J. Sherwood, S. P. Binks and A. D. Curzons, Green Chem., 2011, 13, 854–862 RSC.
- C. M. Alder, J. D. Hayler, R. K. Henderson, A. M. Redman, L. Shukla, L. E. Shuster and H. F. Sneddon, Green Chem., 2016, 18, 3879–3890 RSC.
- D. Prat, O. Pardigon, H.-W. Flemming, S. Letestu, V. r. Ducandas, P. Isnard, E. Guntrum, T. Senac, S. p. Ruisseau and P. Cruciani, Org. Process Res. Dev., 2013, 17, 1517–1525 CrossRef CAS.
- J. Markarian, Pharm. Technol., 2016, 40, 36–38 Search PubMed.
- J. Sarkis, J. L. Schneider, A. Wilson and J. M. Rosenbeck, Benchmarking Int. J., 2010, 17, 421–434 CrossRef.
- T. Letcher, J. Scott and D. A. Patterson, Chemical Processes for a Sustainable Future, Royal Society of Chemistry, 2014, ISBN: 978-1-84973-975-7 Search PubMed.
- S. Yusoff, J. Cleaner. Prod., 2006, 14, 87–93 CrossRef.
- D. Sud, G. Mahajan and M. Kaur, Bioresour. Technol., 2008, 99, 6017–6027 CrossRef CAS PubMed.
- A. Bhatnagar and M. Sillanpää, Chem. Eng. J., 2010, 157, 277–296 CrossRef CAS.
- M. Koller, R. Bona, G. Braunegg, C. Hermann, P. Horvat, M. Kroutil, J. Martinz, J. Neto, L. Pereira and P. Varila, Biomacromolecules, 2005, 6, 561–565 CrossRef CAS PubMed.
- P. S. Kulkarni, C. Brazinha, C. A. Afonso and J. G. Crespo, Green Chem., 2010, 12, 1990–1994 RSC.
- M. W. Nam, J. Zhao, M. S. Lee, J. H. Jeong and J. Lee, Green Chem., 2015, 17, 1718–1727 RSC.
- RADIENT(R), Radient Technologies Inc., 2014, http://www.radientinc.com/public/download/documents/9102 (accessed on 25/2/2017) Search PubMed.
- S. H. Omar, Sci. Pharm., 2010, 78, 133–154 CrossRef CAS PubMed.
- F. Visioli, A. Poli and C. Gall, Med. Res. Rev., 2002, 22, 65–75 CrossRef CAS PubMed.
- U. Göransson, S. Gunasekera, S. Malik, S. Park, B. Slazak, E. Jacobsson, C. Eriksson, H. Andersson and A. Strömstedt, Planta Med., 2016, 82, S1–S381 CrossRef PubMed.
- P. Kefalas, Isolation of oleuropein from the leaves of olive tree, EP1795201A1, 2007 Search PubMed.
- R. Japón-Luján and M. L. Luque de Castro, J. Chromatogr., A, 2006, 1136, 185–191 CrossRef PubMed.
- S. Mkaouara, A. Gelicus, N. Bahloul, K. Allaf and N. Kechaou, Sep. Purif. Technol., 2016, 161, 165–171 CrossRef.
- P. Xie, L. Huang, C. Zhang, F. You, C. Wang and H. Zhou, Adv. Mater. Sci. Eng., 2015, 719485 Search PubMed.
- R. Japón-Luján, J. Luque-Rodríguez and M. L. De Castro, J. Chromatogr., A, 2006, 1108, 76–82 CrossRef PubMed.
- R. Japón-Luján, J. Luque-Rodríguez and M. L. De Castro, Anal. Bioanal. Chem., 2006, 385, 753–759 CrossRef PubMed.
- J. F. Kim, G. Szekely, I. B. Valtcheva and A. G. Livingston, Green Chem., 2014, 16, 133–145 RSC.
- D. S. Sholl and R. P. Lively, Nature, 2016, 532, 435–437 CrossRef PubMed.
- E. Drioli, A. I. Stankiewicz and F. Macedonio, J. Membr. Sci., 2011, 380, 1–8 CrossRef CAS.
- E. Drioli, A. Brunetti, G. Di Profio and G. Barbieri, Green Chem., 2012, 14, 1561–1572 RSC.
- M. Schaepertoens, C. Didaskalou, J. F. Kim, A. G. Livingston and G. Szekely, J. Membr. Sci., 2016, 514, 646–658 CrossRef CAS.
- J. F. Kim, G. Szekely, M. Schaepertoens, I. B. Valtcheva, M. F. Jimenez-Solomon and A. G. Livingston, ACS Sustainable Chem. Eng., 2014, 2, 2371–2379 CrossRef CAS.
- G. Szekely, M. F. Jimenez-Solomon, P. Marchetti, J. F. Kim and A. G. Livingston, Green Chem., 2014, 16, 4440–4473 RSC.
- J. Kupai, M. Razali, S. Buyuktiryaki, R. Kecili and G. Szekely, Polym. Chem., 2017, 8, 666–673 RSC.
- M. Razali, J. F. Kim, M. Attfield, P. M. Budd, E. Drioli, Y. M. Lee and G. Szekely, Green Chem., 2015, 17, 5196–5205 RSC.
- W. J. Cheong, S. H. Yang and F. Ali, J. Sep. Sci., 2013, 36, 609–628 CrossRef CAS PubMed.
- D. Prat, A. Wells, J. Hayler, H. Sneddon, C. R. McElroy, S. Abou-Shehada and P. J. Dunn, Green Chem., 2016, 18, 288–296 RSC.
- U. Tilstam, Org. Process Res. Dev., 2012, 16, 1273–1278 CrossRef CAS.
- Sigma–Aldrich Corporation, Oleuropein, #12247 having ≥98.0% purity (accessed on 25/2/2017).
- OECD Environmental Outlook for the Chemical Industry, http://www.oecd.org/env/ehs/2375538.pdf.
- C. S. Slater, M. J. Savelski, W. A. CarSole and D. J. C. Constable, Green Chemistry in the Pharmaceutical Industry, in ed. P. J. Dunn, A. S. Wells and M. T. Williams, Wiley-VCH Verlag GmBH & Co., Weinheim, Germany, 2010, ch. 3, pp. 49–82 Search PubMed.
- C. Jiménez-González, P. Poechlauer, Q. B. Broxterman, B.-S. Yang, D. Am Ende, J. Baird, C. Bertsch, R. E. Hannah, P. Dell'Orco and H. Noorman, Org. Process Res. Dev., 2011, 15, 900–911 CrossRef.
- Z. Lu, C. Lu, D. Xie, D. Zhong and M. Lu, CN102702287A, 2012 Search PubMed.
- N. Xynos, G. Papaefstathiou, M. Psychis, A. Argyropoulou, N. Aligiannis and A. L. Skaltsounis, J. Supercrit. Fluids, 2012, 67, 89–93 CrossRef CAS.
- S. Sahin and M. Bilgin, Sep. Sci. Technol., 2012, 47, 2391–2398 CAS.
- J. Kupai, E. Rojik, P. Huszthy and G. Szekely, ACS Appl. Mater. Interfaces, 2015, 7, 9516–9525 CAS.
Footnote |
| † Electronic supplementary information (ESI) available. See DOI: 10.1039/c7gc00912g |
| This journal is © The Royal Society of Chemistry 2017 |

