
 Open Access Article
 This Open Access Article is licensed under a
 Creative Commons Attribution 3.0 Unported Licence
Photobiocatalytic alcohol oxidation using LED light sources†
M.
Rauch
a,
S.
Schmidt
a,
I. W. C. E.
Arends
a,
K.
Oppelt
b,
S.
Kara
 c and
F.
Hollmann
*a
c and
F.
Hollmann
*a
aDepartment of Biotechnology, Delft University of Technology, van der Maasweg 9, 2629HZ Delft, The Netherlands. E-mail: f.hollmann@tudelft.nl
bInstitute of Inorganic Chemistry, Johannes Kepler University Linz, Altenberger Strasse 69, 4040 Linz, Austria
cInstitute of Technical Biocatalysis, Hamburg University of Technology, Denickestrasse 15, 21073 Hamburg, Germany
First published on 12th October 2016
Abstract
The photocatalytic oxidation of NADH using a flavin photocatalyst and a simple blue LED light source is reported. This in situ NAD+ regeneration system can be used to promote biocatalytic, enantioselective oxidation reactions. Compared to the traditional use of white light bulbs this method enables very significant reductions in energy consumption and CO2 emission.
Oxidation reactions employing alcohol dehydrogenases are experiencing an increased interest in the field of biocatalysis.1–4 While the toolbox of selective enzymes is growing constantly, the choice of efficient in situ regeneration systems of the oxidized nicotinamide cofactors to sustain the catalytic cycle is still comparably limited.5 This is particularly true for regeneration systems employing molecular oxygen as a terminal oxidant, which is attractive from the high thermodynamic driving force and the innoxious nature of the by-products.6–12 As early as 1973, Jones and coworkers proposed using simple flavins to catalyse the aerobic oxidation of reduced nicotinamide cofactors.13 The slow reaction kinetics of the hydride transfer from NAD(P)H to the oxidized isoalloxazine moiety rendered the system impractical as significant molar surpluses of the flavin ‘catalyst’ were necessary to attain full conversion within a reasonable time frame. More recently, we have reported that this limitation (low reaction rates) can be overcome simply by applying visible light to the reaction system.11 The overall rate-limiting hydride transfer step from NAD(P)H to the oxidised flavin could be accelerated by photoexcitation of the flavin catalyst. The oxidised flavin catalyst is regenerated spontaneously through aerobic reoxidation yielding hydrogen peroxide (Scheme 1).14,15
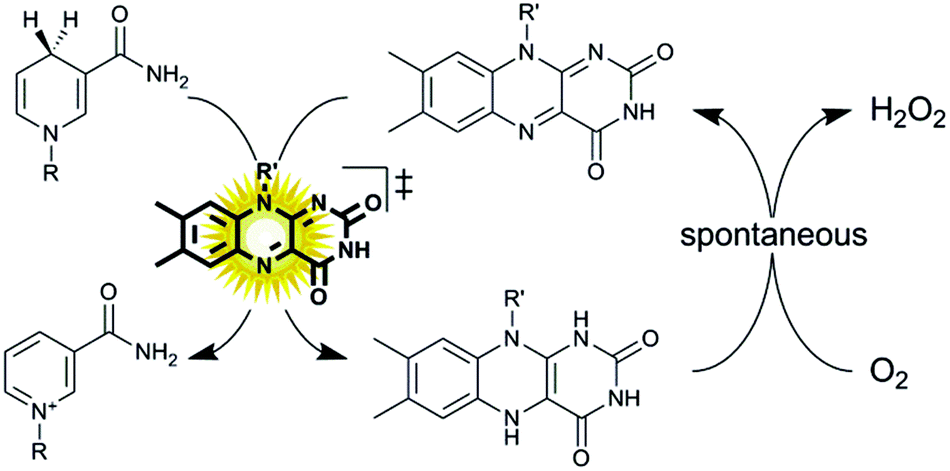 | ||
| Scheme 1 Aerobic oxidation of reduced nicotinamide cofactors (NAD(P)H) to the corresponding cofactors (NAD(P)+) using photoexcited flavin catalysts. Upon photoexcitation (λ = 450 nm) the redox potential of the oxidised flavin catalyst increases dramatically16 enabling fast hydride transfer from NAD(P)H to the flavin. The reduced flavin reacts spontaneously in a dark reaction with molecular oxygen.14 | ||
During these proof-of-concept experiments we have utilised a simple, commercially available light-white bulb. Despite its simplicity, this setup severely suffered from heat generated by the bulb. As a consequence not only a significant amount of electrical power used was deviated into heat generations but also additional cooling of the reaction mixture was necessary to maintain optimal reaction conditions for the enzyme reaction.
With the advent of cheap light emitting diode (LED) light sources we became interested in using those to promote photobiocatalytic oxidation reactions. Compared to the use of traditional light sources LEDs bear the promise of double energy efficiency: first, LEDs enable a more efficient conversion of electrical power into light energy (only a narrow range of wavelengths is emitted instead or an entire spectrum containing ‘useless’ wavelengths) and, second, due to the absence of thermal effects, also less thermostatting is needed.
As commercial LEDs come with three individual colours (blue, green and red exhibiting wavelength maxima at 465, 519, and 631 nm respectively, Fig. 1A) we investigated each wavelength to promote the photochemical oxidation of NADH.
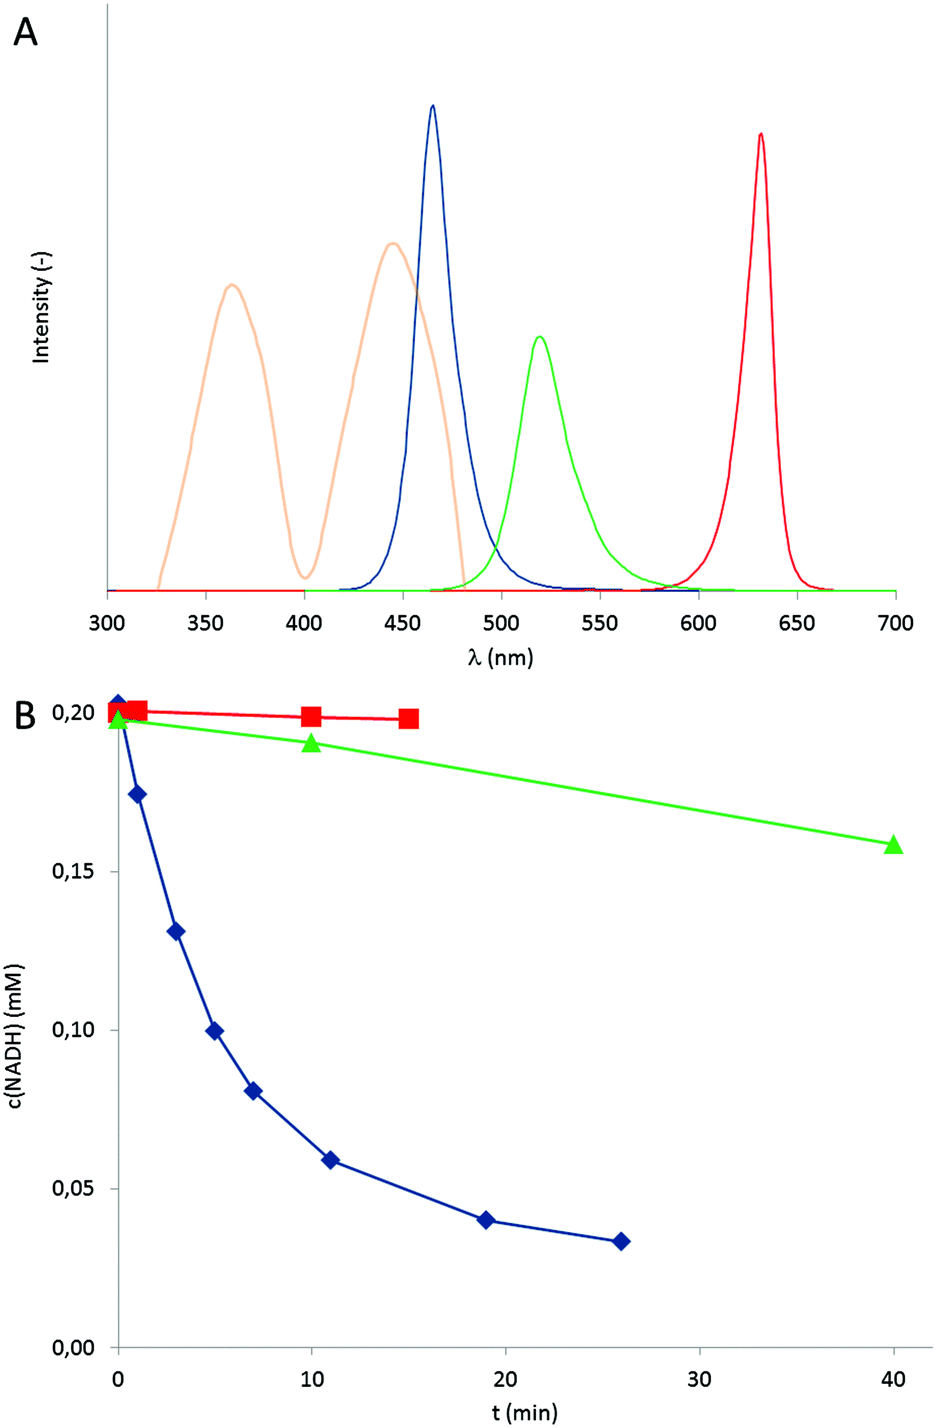 | ||
Fig. 1 Emission wavelengths of the LEDs used (A) and the influence of the LED wavelength on the rate of the photocatalytic aerobic NADH oxidation (B). A: The emission spectra of the blue, green and red LED are shown (in arbitrary units) together with the absorption spectrum of the FMN photocatalyst, yellow. B: Time course of the aerobic oxidation of NADH catalysed by FMN and red ( ), green ( ), green ( ) or blue ( ) or blue ( ) light. Conditions: 50 mM KPi buffer (pH 7), [NADH]0 = 0.2 mM, [FMN] = 2 μM, T = 30 °C. ) light. Conditions: 50 mM KPi buffer (pH 7), [NADH]0 = 0.2 mM, [FMN] = 2 μM, T = 30 °C. | ||
It should be mentioned here that in accordance with the mechanism proposed in Scheme 1, no conversion of NADH was observed the absence of either, the photocatalyst, a light source or under anaerobic reaction conditions. As shown in Fig. 1B only blue light ( λmax of 465 nm) significantly accelerated the overall reaction while green light (λmax of 519 nm) yielded significantly lower rates and red light (λmax of 631 nm) had almost no accelerating influence as compared to ‘dark’ conditions. In terms of turnover frequencies the flavin catalysts performed <5, 30 and 680 catalytic cycles per hour under red, green and blue light irradiation, respectively. This trend is in agreement with the relative overlap of the LED emission spectra and the FMN absorption spectrum (Fig. 1A). Interestingly, using blue LEDs enabled slightly higher NADH oxidation rates as compared to bright white light bulbs under otherwise identical conditions (Fig. S8†). This observation, however, should not be over-interpreted as a quantitative comparison of the light intensities is yet missing.
In terms of light intensity, the LED-based photocatalytic system was well-behaved (Fig. 2) and the overall rate of the system correlated directly with the intensity of the LED light source.
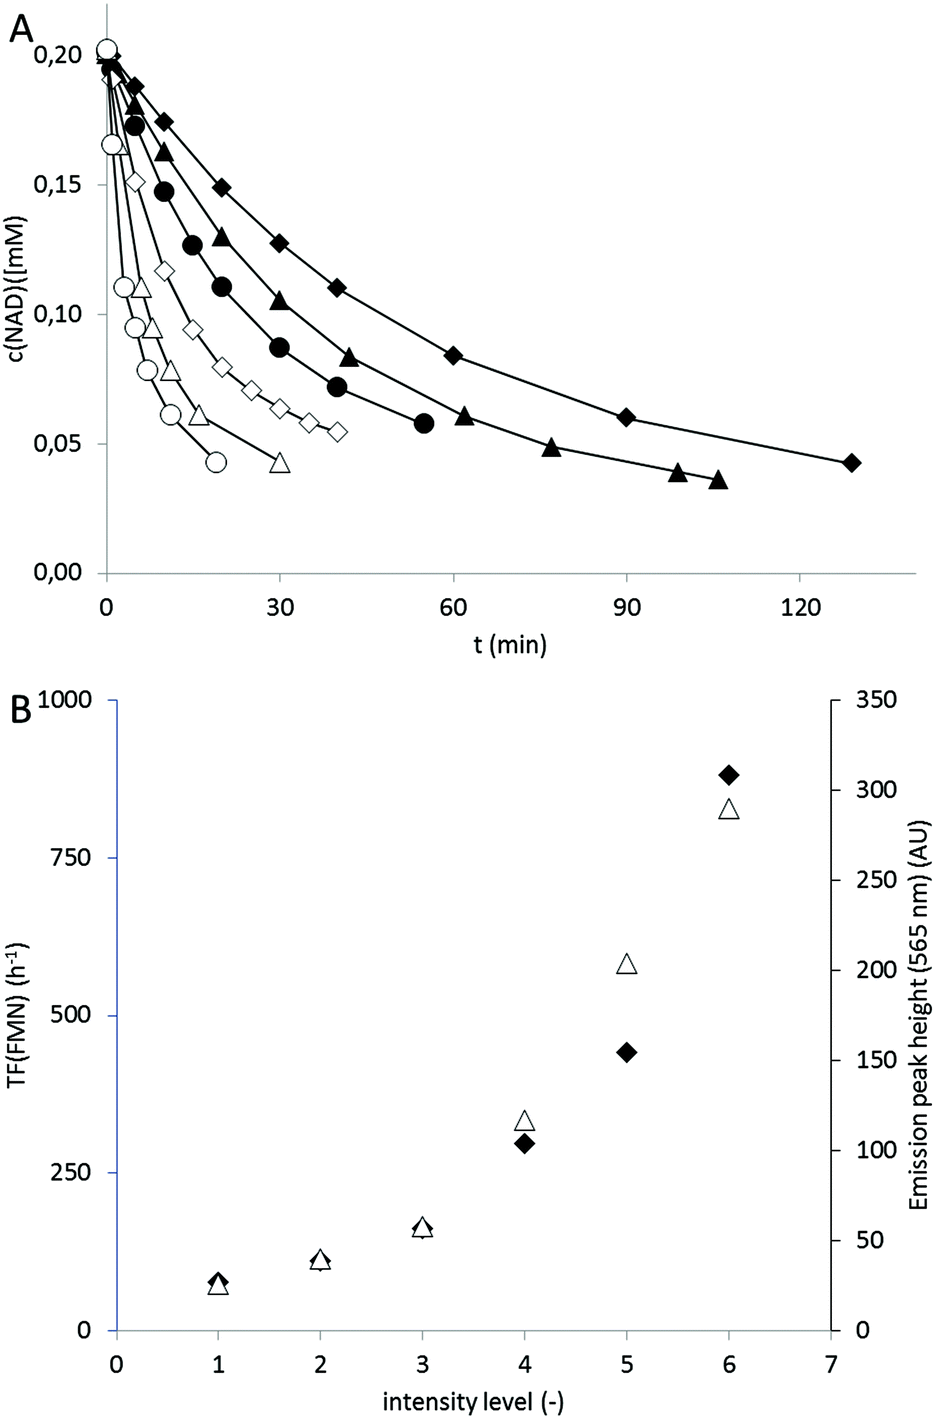 | ||
| Fig. 2 A: Influence of the intensity of the blue LED in the oxidation of NADH in presence of FMN. Conditions: 50 mM KPi buffer (pH 7), T = 30 °C, [NADH]0 = 0.2 mM, [FMN] = 2 μM; relative blue light intensity :1: ◆, 2: ▲, 3: ●, 4: ◊, 5: △, 6: ○; B: dependence of the rate of the FMN-catalysed NADH oxidation (expressed as TF of the FMN catalyst, ◆) on the intensity of the blue LED (△). Conditions: KPi buffer (pH 7, 50 mM), T = 30 °C, [NADH]0 = 0.2 mM, [FMN]0 = 2 μM. | ||
Another advantage of the LED system is the missing thermal effect on the reaction system as compared to the white light bulb. While with the first no significant temperature change was observed (in the absence of external cooling), the latter lead to a temperature increase of more than 30 °C within one hour under the same conditions (Fig. S9†).
Encouraged by these results we decided to apply the LED-based photocatalytic NADH oxidation system to the horse liver alcohol dehydrogenase (HLADH) catalysed oxidative lactonisation of α,ω-diols such as meso-3-methyl-1,5-pentanediol (Scheme 2).17 In this system, HLADH catalyses the enantioselective two-step oxidation of the diol starting material yielding enantiopure (ee > 98%) (S)-4-methyltetrahydro-2H-pyran-2-one using the oxidised nicotinamide cofactor (NAD+) as primary hydride acceptor. In situ regeneration of NAD+ from NADH is achieved using the photocatalytic system outlined in Scheme 1.
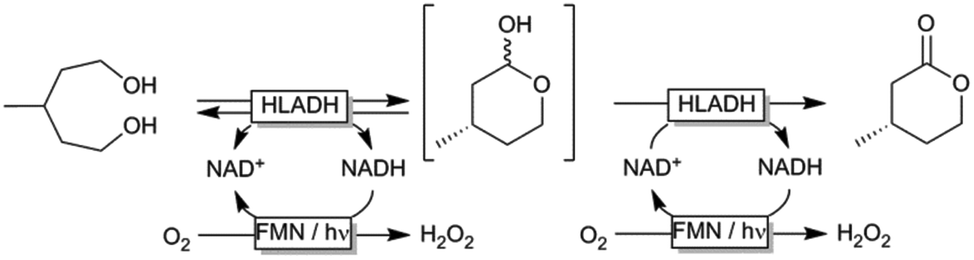 | ||
| Scheme 2 Oxidative lactonization of meso-3-methyl-1,5-pentanediol to (S)-4-methyltetrahydro-2H-pyran-2-one using horse liver alcohol dehydrogenase (HLADH) and photocatalytic, aerobic regeneration of NAD+. | ||
Pleasingly, smooth conversion of the starting material into the enantiopure lactone product was observed (Fig. 3).
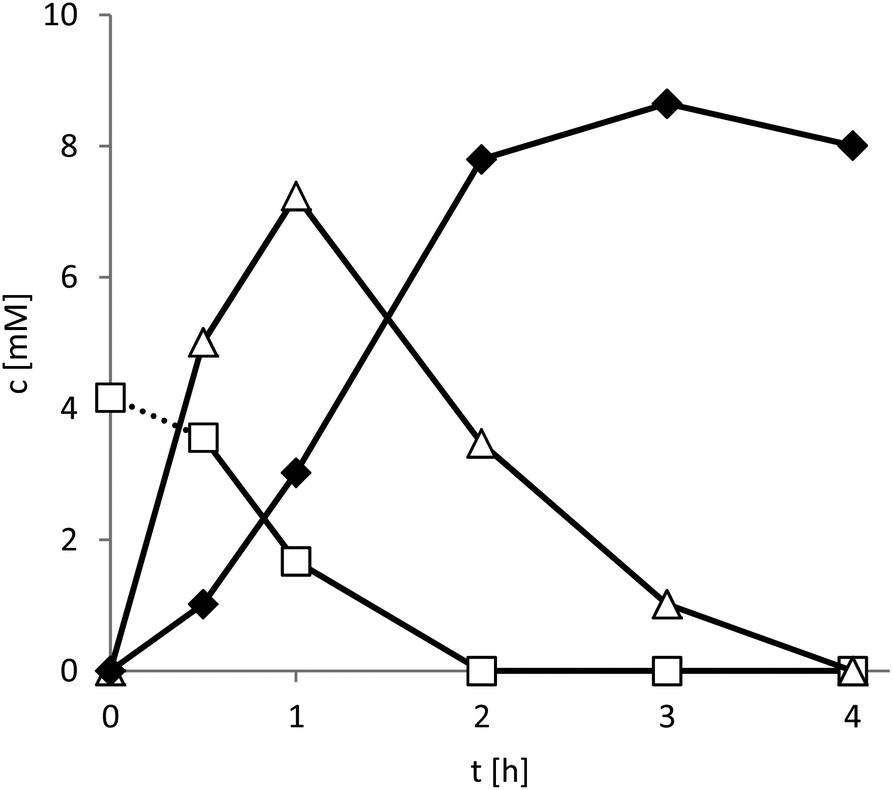 | ||
| Fig. 3 Time course of the photoenzymatic oxidation of meso-3-methyl-1,5-pentanediol (□) to (S)-4-methyltetrahydro-2H-pyran-2-one (◆) via the intermediate lactol (△). General conditions: 100 mM glycine-NaOH buffer (pH 9), 100 mM. [diol]0 = 10 mM, [NADH]0 = 1 mM, [FMN] = 100 μM, [HLADH] = 7.4 μM, 5 drops of catalase, T = 30 °C. | ||
Within the first 2 hours of the reaction the mass balance of the reaction was closed (sum of all reagents 10 ± 0.2 mM) and decreased to 8 mM after 4 hours. This observation is most likely explained by the slow, spontaneous hydrolysis of the lactone product to the corresponding hydroxy acid.17 This finding is also supported by the significant acidification of the reaction mixture especially at higher substrate loadings (Fig. S10†). Further optimisation of the reaction conditions to minimise or prevent this undesired side reaction are currently underway. For example, a tighter pH control and in situ extraction of the lactone product are promising approaches to circumvent the undesired hydrolysis.
The catalytic activity of the photocatalyst was 122 h−1 and thereby significantly lower than determined before (Fig. 2). Partially this can be attributed to the higher pH value of the reaction medium.11
To assess the environmental impact of the presented photobiocatalytic oxidative lactonisation we performed an E-factor analysis (Table 1).18,19
| Contribution | White light bulb | LED |
|---|---|---|
| a Used as extraction solvent for GC analysis. b To estimate the CO2 emissions due to electricity consumption, we used the average European CO2 emission intensity (see ESI for further details). | ||
| Water | 877 | |
| Buffer (glycine) | 6.6 | |
| NAD | 0.6 | |
| FMN | 0.04 | |
| HLADH | 0.25 | |
| Ethyl acetatea | 1973 | |
| CO2 from coolingb | 40.4 | 0 |
| CO2 from light sourceb | 40![[thin space (1/6-em)]](https://www.rsc.org/images/entities/char_2009.gif) 780 780 |
3920 |
Though shocking at first sight, these numbers also guide us to optimise the proposed photobiocatalytic reaction system en route to higher sustainability. First of all, the overall substrate loading (and the resulting product titers, respectively) must be increased significantly. In these experiments, 10 mM product accumulated resulting in an enormous amount of waste water. This is obviously inacceptable, both from an environmental and an economical point-of-view. Raising the product titers to industrially demanded 50–200 g L−1 will reduce the E-factor to approx. 5–20. Similarly, also the contributions of buffers and catalysts will be reduced. The very high E-factor contribution of the extraction solvent should not be taken too serious, the aim of the extraction procedure was to adequately determine the reagent concentrations and not to establish an environmentally friendly downstream processing method. Nevertheless, the high solvent consumption again exemplifies the importance of DSP to the overall environmental impact.20 Finally, we made an attempt to quantify the ‘hidden E-factor’ contributions caused by the electrical power consumed. The calculation of the CO2 emissions was straightforward using the power consumptions provided by the manufacturers. Again, the exorbitant values shown in Table 1 should not be taken too serious as relatively large light sources were used for a rather small reaction volume. Raising the product concentration together with increasing the reaction volume can easily reduce the E-factor by several orders of magnitude to acceptable values. These experiments are currently underway. Nevertheless, Table 1 also visualises the significant positive contribution that LED technology can have on the sustainability of photo(bio)catalytic reactions!
The energy consumption caused by heating (or cooling) of the reaction mixture is usually not included in E-factor calculations. Table 1, however, demonstrates that this ‘hidden contribution’ by no means is to be neglected as it easily exceeds the contributions of the reagents.
Overall, the use of simple LEDs represents a simple, more user-friendly alternative compared to bright white light bulbs. More excitingly, LEDs also offer significant advantages in terms of energy efficiency as futile wavelengths and heat generation are omitted. Taking together the lower power consumption with the increased catalytic activity of the LED system a more than 90% decrease of energy consumption (and corresponding CO2 emissions) can be achieved. Furthermore, the significant thermal effect of the white light bulb also necessitates additional cooling of the reaction mixture, which can be reduced or even omitted in case of the LEDs.
Conclusions
Today, photocatalysis is in focus of catalysis research.21–23 Comparably few studies deal with photocatalysis to promote biocatalytic reactions, a ‘combination of two intrinsically green technologies’.24However, neither biocatalysis nor photocatalysis are environmentally sustainable per se. A (self-)critical evaluation of the possible environmental impact is necessary to substantiate ‘green claims’ and to identify bottlenecks as a basis for improved reaction setups en route to truly sustainable procedures.
In this study, we have demonstrated that simple LEDs are well-suited to substitute conventional light sources in flavin-based NAD+ regeneration systems to promote dehydrogenase-catalysed oxidation reactions. Particularly, the significantly deceased energy demand of LED systems make it attractive envisioning environmentally acceptable syntheses.
Acknowledgements
Financial support by the European Research Council (ERC Consolidator Grant No. 648026) is gratefully acknowledged. We thank Dr D. Rother for the kind provision with the plasmid encoding HLADH.Notes and references
- Enzyme Catalysis in Organic Synthesis, ed. K. Drauz, H. Groeger and O. May, Wiley-VCH, Weinheim, 2012 Search PubMed.
- K. Faber, Biotransformations in Organic Chemistry, Springer, Berlin, 6th edn, 2011 Search PubMed.
- F. Hollmann, I. W. C. E. Arends, K. Buehler, A. Schallmey and B. Buhler, Green Chem., 2011, 13, 226–265 RSC.
- W. Kroutil, H. Mang, K. Edegger and K. Faber, Curr. Opin. Chem. Biol., 2004, 8, 120–126 CrossRef CAS PubMed.
- S. Kara, J. H. Schrittwieser, F. Hollmann and M. B. Ansorge-Schumacher, Appl. Microbiol. Biotechnol., 2014, 98, 1517–1529 CrossRef CAS PubMed.
- C. Holec, K. Neufeld and J. Pietruszka, Adv. Synth. Catal., 2016, 358, 1810–1819 CrossRef CAS.
- B. R. Riebel, P. R. Gibbs, W. B. Wellborn and A. S. Bommarius, Adv. Synth. Catal., 2002, 344, 1156–1168 CrossRef CAS.
- R. Jiang and A. S. Bommarius, Tetrahedron: Asymmetry, 2004, 15, 2939–2944 CrossRef CAS.
- J. T. Park, J.-I. Hirano, V. Thangavel, B. R. Riebel and A. S. Bommarius, J. Mol. Catal. B: Enzym., 2011, 71, 159–165 CrossRef CAS.
- S. Aksu, I. W. C. E. Arends and F. Hollmann, Adv. Synth. Catal., 2009, 351, 1211–1216 CrossRef CAS.
- S. Gargiulo, I. W. C. E. Arends and F. Hollmann, ChemCatChem, 2011, 3, 338–342 CrossRef CAS.
- S. Kochius, Y. Ni, S. Kara, S. Gargiulo, J. Schrader, D. Holtmann and F. Hollmann, ChemPlusChem, 2014, 79, 1554–1557 CrossRef CAS.
- J. B. Jones and K. E. Taylor, J. Chem. Soc., Chem. Commun., 1973, 205–206 RSC.
- V. Massey, J. Biol. Chem., 1994, 269, 22459–22462 CAS.
- D. Holtmann and F. Hollmann, ChemBioChem, 2016, 17, 1391–1398 CrossRef CAS PubMed.
- M. De La Rosa, J. Navarro and M. Roncel, Appl. Biochem. Biotechnol., 1991, 30, 61–81 CrossRef CAS.
- S. Kara, D. Spickermann, J. H. Schrittwieser, A. Weckbecker, C. Leggewie, I. W. C. E. Arends and F. Hollmann, ACS Catal., 2013, 3, 2436–2439 CrossRef CAS.
- R. A. Sheldon, Chem. Commun, 2008, 3352–3365 RSC.
- Y. Ni, D. Holtmann and F. Hollmann, ChemCatChem, 2014, 6, 930–943 CrossRef CAS.
- J. Schrittwieser, F. Coccia, S. Kara, B. Grischek, W. Kroutil, N. d'Alessandro and F. Hollmann, Green Chem., 2013, 15, 3318–3331 RSC.
- R. Brimioulle, D. Lenhart, M. M. Maturi and T. Bach, Angew. Chem., Int. Ed., 2015, 54, 3872–3890 CrossRef CAS PubMed.
- K. L. Skubi, T. R. Blum and T. P. Yoon, Chem. Rev., 2016, 116, 10035–10074 CrossRef CAS PubMed.
- R. N. Perutz and B. Procacci, Chem. Rev., 2016, 116, 8506–8544 CrossRef CAS PubMed.
- J. A. Maciá-Agulló, A. Corma and H. Garcia, Chem. – Eur. J., 2015, 21, 10940–10959 CrossRef PubMed.
Footnote |
| † Electronic supplementary information (ESI) available: Detailed experimental procedures and supporting experimental results. See DOI: 10.1039/c6gc02008a |
| This journal is © The Royal Society of Chemistry 2017 |