 Open Access Article
 This Open Access Article is licensed under a
 Creative Commons Attribution 3.0 Unported Licence
Effects of halogens on European air-quality†
T.
Sherwen
 *a,
M. J.
Evans
ab,
R.
Sommariva
c,
L. D. J.
Hollis
c,
S. M.
Ball
c,
P. S.
Monks
c,
C.
Reed‡
a,
L. J.
Carpenter
a,
J. D.
Lee
ab,
G.
Forster
de,
B.
Bandy
e,
C. E.
Reeves
e and
W. J.
Bloss
f
*a,
M. J.
Evans
ab,
R.
Sommariva
c,
L. D. J.
Hollis
c,
S. M.
Ball
c,
P. S.
Monks
c,
C.
Reed‡
a,
L. J.
Carpenter
a,
J. D.
Lee
ab,
G.
Forster
de,
B.
Bandy
e,
C. E.
Reeves
e and
W. J.
Bloss
f
aWolfson Atmospheric Chemistry Laboratory, University of York, York, UK. E-mail: tomas.sherwen@york.ac.uk
bNational Centre for Atmospheric Science (NCAS), University of York, York, UK
cDepartment of Chemistry, University of Leicester, Leicester, UK
dNCAS, School of Environmental Sciences, University of East Anglia, Norwich, UK
eSchool of Environmental Sciences, University of East Anglia, Norwich, UK
fSchool of Geography, Earth and Environmental Science, University of Birmingham, Birmingham, UK
First published on 6th February 2017
Abstract
Halogens (Cl, Br) have a profound influence on stratospheric ozone (O3). They (Cl, Br and I) have recently also been shown to impact the troposphere, notably by reducing the mixing ratios of O3 and OH. Their potential for impacting regional air-quality is less well understood. We explore the impact of halogens on regional pollutants (focussing on O3) with the European grid of the GEOS-Chem model (0.25° × 0.3125°). It has recently been updated to include a representation of halogen chemistry. We focus on the summer of 2015 during the ICOZA campaign at the Weybourne Atmospheric Observatory on the North Sea coast of the UK. Comparisons between these observations together with those from the UK air-quality network show that the model has some skill in representing the mixing ratios/concentration of pollutants during this period. Although the model has some success in simulating the Weybourne ClNO2 observations, it significantly underestimates ClNO2 observations reported at inland locations. It also underestimates mixing ratios of IO, OIO, I2 and BrO, but this may reflect the coastal nature of these observations. Model simulations, with and without halogens, highlight the processes by which halogens can impact O3. Throughout the domain O3 mixing ratios are reduced by halogens. In northern Europe this is due to a change in the background O3 advected into the region, whereas in southern Europe this is due to local chemistry driven by Mediterranean emissions. The proportion of hourly O3 above 50 nmol mol−1 in Europe is reduced from 46% to 18% by halogens. ClNO2 from N2O5 uptake onto sea-salt leads to increases in O3 mixing ratio, but these are smaller than the decreases caused by the bromine and iodine. 12% of ethane and 16% of acetone within the boundary layer is oxidised by Cl. Aerosol response to halogens is complex with small (∼10%) reductions in PM2.5 in most locations. A lack of observational constraints coupled to large uncertainties in emissions and chemical processing of halogens make these conclusions tentative at best. However, the results here point to the potential for halogen chemistry to influence air quality policy in Europe and other parts of the world.
1 Introduction
Over the last decade, there has been increasing evidence, from both an observational and modelling perspective, that halogens (Cl, Br and I) play a role in determining the composition of the troposphere.1 Different studies have emphasised either the regional impact of these species,2–5 or their global impact.6–13 They have also tended to focus on the chemistry of chlorine,3,14 iodine10,15 or bromine,6,8,11 with few studies investigating the coupled chemistry of all three.7,12The tropospheric chemistry of halogens is complex (see the recent review by Simpson et al.1 and references within) with significant uncertainties remaining, particularly in some aspects of the gas-phase chemistry of iodine and in the heterogenous processing of all halogens. Interactions between the halogens and HOx, NOx, and volatile organic compounds (VOC) species leads to halogens having a pervasive influence throughout the tropospheric chemistry system.11,12 The chemistry of Br and I is thought to lead to reductions in O3 and OH mixing ratios globally8,10–12 whereas the chemistry of Cl is thought to lead to both increases in O3 due to more rapid oxidation of VOCs2,16 and decreases due to halogen nitrate hydrolysis reducing O3 production (via decreasing NOx).11 However, the calculated magnitude of these impacts will be critically dependent on the emissions and chemistry of halogens used.
Both biogenic and anthropogenic sources of gas-phase halogen precursors exist, from a mix of oceanic, terrestrial, and anthropogenic sources.1 The oceanic source of halocarbons can be spatially variable reflecting different ecosystems and driving processes. For example, areas of tidal sea-weed can have significant emissions of iodine precursor gases which vary with the tide state.17–23 For iodine, chemistry involving atmospheric ozone and ocean iodide within the surface micro-layer of the ocean leads to the emission of inorganic species (HOI, I2).24,25 Other sources of halogens into the troposphere can also occur, such as direct emissions (e.g. HCl/Cl2 (ref. 26 and 27)) or transport from the stratosphere.
The largest emission of bromine and chlorine into the atmosphere comes from sea-salt aerosol. However this aerosol phase chloride and bromide must be liberated by heterogenous chemistry to become a gas-phase source. Different mechanisms allow for activation to the gas phase: acid displacement (e.g. HNO3); uptake of N2O5 to sea-salt to liberate ClNO2;28 and uptake of other halogen species (HOBr, HOI, BrNO3, HOBr, etc.) to liberate di-halogen species (ICl, IBr, Br2, BrCl, Cl2).1,29,30
Measuring the concentration of reactive halogen species in the atmosphere is difficult due to their low mixing ratio and reactivity. Although there remains some debate, recent observations have demonstrated the pervasive existence of bromine and iodine species throughout the troposphere over oceanic regions by a range of techniques. The highest mixing ratios of these species have been found close to tidal sources17–23 but measurable mixing ratios have been found above the remote ocean31 and in the upper troposphere.32
Observations of reactive chlorine species are particularly sparse. However, a relatively large dataset of ClNO2 observations have now been made28,33–38 which show a build up at night and then a rapid decrease (due to photolysis) at sunrise. The observations in polluted coastal regions are explicable through the uptake of N2O5 onto sea-salt.28 However, high mixing ratios of ClNO2 in continental regions have proved harder to explain due to the short lifetime of sea-salt in the atmosphere. Various explanations have been postulated ranging from non-oceanic sources of both natural and anthropogenic chlorine species,35 to the movement of chlorine from sea-salt to fine mode sulfate aerosol via gas phase chemistry.28
Previous model studies of Br and I chemistry have focussed predominantly on their global scale impacts.6,8,9,11,12 Whereas, studies of the impact of Cl have typically focussed on a smaller hemispheric or regional (air-quality) scale.2–4 The combined impact of all halogens on the regional scale is less well explored. Here, we use a new version of the GEOS-Chem model, which includes a representation of halogen chemistry,12 run in its regional grid configuration39–42 for Europe43 to explore the roles that halogens may play in controlling European air quality with a focus on O3. We focus on the summer of 2015 as this allows us access to an observational dataset made on the North Sea coast of the UK. We explore the model fidelity against this data and that offered from the UK air quality network. We explore the differing role of halogens in determining both O3 concentrations through changes to regional scale chemistry and the hemisphere background. We then consider impacts of halogens on oxidation and contribution of atomic chlorine. The relative contribution of the halogen families on O3 are then considered, and the impacts on aerosol concentrations. Finally we suggest future areas of research to allow better representation of the halogen chemistry of the atmosphere on a regional scale.
2 Experimental
2.1 Observations
The Integrated Chemistry of Ozone in the Atmosphere (ICOZA) campaign44 at the Weybourne Atmospheric Observatory (52.95°N, 1.12°E,45) was designed to examine the composition of the atmosphere and local chemical processes at a coastal site in the UK during the summer of 2015 (29th June to 1st August). Weybourne is a World Meteorological Organisation (WMO) Global Atmospheric Watch (GAW) programme site. In addition to the standard observations (CO, and O3), additional NOx (NO, NO2), total reactive nitrogen (NOy), nitryl chloride (ClNO2) and molecular chlorine (Cl2) measurements were made during this period.The NO, NO2 and NOy observations were made ∼4 m above ground level. The NO and NO2 measurements were made using a dual channel Air Quality Design Inc. (Golden, Colorado, USA) chemiluminescent instrument equipped with a UV-LED photolytic NO2 converter as described by Reed et al.44,46 NOy was measured using a Thermo Environmental 42i TL NOx analyser equipped with a molybdenum catalytic converter. A second high temperature (375 °C) molybdenum converter was placed upstream directly at the gas inlet. Heated molybdenum catalysts have been shown to convert NOy species such as PAN, HNO3 and particulate nitrate into NO2.47–50 Limits of detection were 1.5 pmol mol−1 and 1.9 pmol mol−1 averaged over 1 minute for NO and NO2, and 50 pmol mol−1 averaged over 1 minute for NOy.
Carbon monoxide (CO) observations are part of the National Centre for Atmospheric Sciences (NCAS) long-term measurement programme and O3 observations are part of the Department for Environment, Food and Rural Affairs (DEFRA) Automatic Urban and Rural Network (AURN). CO was measured by a Reduction Gas Analyser (RGA3, Trace Analytical, Inc., California, USA) to the WMO CO X2004 scale and O3 was measured using UV absorption (TE49i, Thermo Fisher Scientific Inc.).
The observations of ClNO2 and Cl2 were made with the University of Leicester Chemical Ionization Mass Spectrometer (CIMS). The instrument, manufactured by THS Instruments (Georgia, USA), is based on the CIMS technique described by Slusher et al.,51 and is similar in configuration to the instrument used by Liao et al.52 The Leicester CIMS was calibrated for Cl2, using a certified standard by BOC (5 μmol mol−1 in nitrogen), and for ClNO2, using the methodology described by Thaler et al.53 The detection limit was 8.5 pmol mol−1 for Cl2 and 5.1 pmol mol−1 for ClNO2. The instrument and the measurements are discussed in more detail in Sommariva et al. (in preparation).
Wider UK air-quality observation data (O3, NO2, PM2.5) from the DEFRA’s AURN54 was extracted for the period of observations using the OpenAir R package.55
2.2 Modelling
We used the GEOS-Chem model (version 10-01, http://www.geos-chem.org), which includes Ox, HOx, NOx, and VOC chemistry56 and a mass based aerosol scheme.57,58 The model also has a representation of bromine and chlorine chemistry,8,59 which has been updated further to include (Cl, Br, I) chemistry11,15 as described by Sherwen et al.12 The chlorine scheme is described by Schmidt et al.,11 with additions described in Sherwen et al.15 including further reactions of chlorine and bromine with organics, ClNO2 emission following N2O5 uptake on sea-salt,60 and heterogenous iodine cycling to produce IX (X = Cl, Br).29 The model is run without sea-salt de-bromination following Schmidt et al.,11 and does not contain acid displacement of chlorine or anthropogenic chloride sources. The halogen cross-sections and rates have been updated to the latest NASA-JPL (15-10) recommendations.16The model includes biogenic emissions (MEGAN61), biomass burning (GFED4 (ref. 62)), biofuel emissions,63 and aerosols emissions (including dust,57 sea-salt,58 and black and organic carbon64) as well as NOx from lightning,65 soils,66 and aircraft.67 For anthropogenic emissions, the model uses the Co-operative Programme for Monitoring and Evaluation of the Long-range Transmission of Air Pollutants in Europe (EMEP) emissions (http://www.emep.int) for NOx,68 SOx,69 CO, and NH3 for the latest available year (2013). EMEP anthropogenic VOC emissions are also used here, but for 2012. Emissions for formaldehyde and acetone were scaled from the EMEP acetaldehyde emissions, ethane emissions were scaled from the EMEP propane emission, and a scaling factor was applied to the acetaldehyde emission following the approach taken previously in Dunmore et al.70 and described in Table SI1 in the ESI.†
The halogen emissions used are as described in Sherwen et al.12 Emissions of organic iodine species are taken from the monthly values of Ordóñez et al.71 at 1 × 1°. Emissions of inorganic iodine (HOI, I2) use the parameterisation of Carpenter et al.,24 which describes a dependancy on model parameters of surface O3 mixing ratio, wind speed, and ocean surface iodide concentration. Ocean surface iodide concentrations are parameterised based on sea-surface temperatures following MacDonald et al.25 Coastal and tidal processes are not considered here, and the 1 × 1° resolution of the organic emissions cannot be expected to capture very localised halogen sources.
The GEOS-Chem model is run at two resolutions. A global simulation (4 × 5°) generates boundary conditions to allow “nesting” of a domain at a ∼25 km (0.25 × 0.3125°) resolution covering a domain (32.75–61.25°N, −15–40°E) over Europe. The global model is run for two years (1st January 2004 to 1st January 2006) with the first year discarded as “spin up”. Using the March 1st 2005 concentrations fields for March 1st 2015, the global model is run for three further months of “spin up” and to cover the observational period in order to generate boundary conditions. The regional model is then run from two weeks prior to the observational period (as “spin up”), before running for the campaign period (29th June to 1st August 2015) using the boundary conditions generated by the global model.
PM2.5 is calculated from the model based on the mass of sulfate, nitrate, ammonia, hydrophilic and hydrophobic carbon, sea-salt and dust, assuming relative humidity of 50%. Using the assumed value of 50% relative humidity allows for comparison with DEFRA observations which follows the method prescribed by European Committee for Standardisation (EN 14907). The coarse mode sea-salt and the two largest dust size bins are ignored for the calculation. We have not used the model’s secondary organic aerosol scheme in these model simulations. A full description of the PM2.5 calculation is given in ESI Table SI2.†
Model runs performed are described in Table 1. Simulations were performed with halogen chemistry switched on (“HAL”) and off (“NOHAL”) in both the global (to generate the boundary conditions) and regional model. A simulation was also performed using the boundary conditions calculated with the halogens switched off but with the halogen chemistry in the European domain switched on (“HAL-LOCAL”). A final simulation (“NOClNO2”) was performed with halogen chemistry in both the regional and local version of the model but with the uptake of N2O5 uptake on sea-salt aerosol leading to the production of 2HNO3 rather than HNO3 + ClNO2.
| Abbreviation | Regional model chemistry | Boundary condition |
|---|---|---|
| HAL | Halogens on | Halogens on |
| NOHAL | Halogens off | Halogens off |
| HAL-LOCAL | Halogens on | Halogens off |
| NOClNO2 | Halogens on. No ClNO2 production | Halogens on |
3 Model performance
Fig. 1 shows the averaged modelled (“HAL”) surface distribution of O3, NO2, CO and PM2.5 for the period from 29th July to 1st August 2015. Highest O3 mixing ratios are evident in southern Europe and over the Mediterranean, with evidence for a reduction in O3 mixing ratios over the northern cities compared to the rural values due to reaction of O3 with NO. NO2 mixing ratios are spatially variable reflecting its short lifetime, with cities and ship tracks evident. CO mixing ratios are similar to those from NO2 but are more diffusive and don’t show the ship tracks. The distribution of PM2.5 shows similarities to the CO and NO2, reflecting common sources.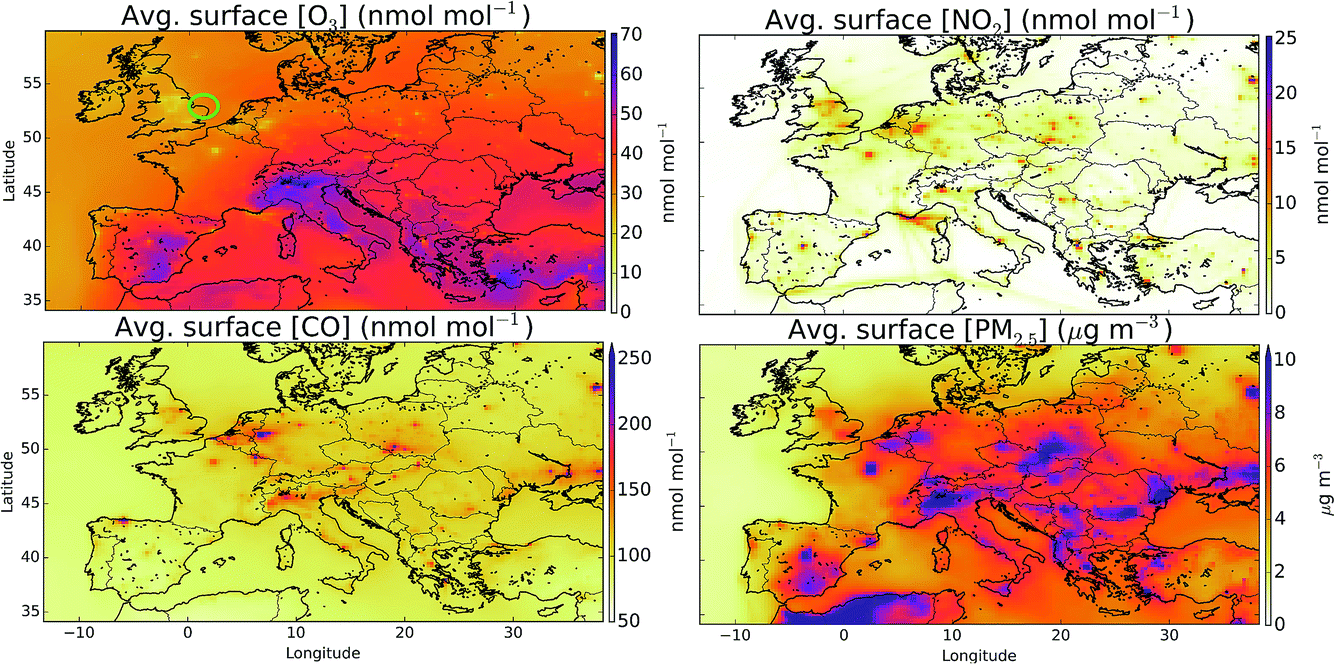 | ||
| Fig. 1 Mean modelled surface O3, NO2, CO, and PM2.5 mixing ratios/concentrations for the observational period (29th June to 1st August 2015). The green circle on the first plot gives the location of the Weybourne Atmospheric Observatory. Maximum values in plots of CO and PM2.5 are 431 nmol mol−1 and 35 μg m−3, respectively. | ||
There are fewer studies assessing the performance of the European grid version of the GEOS-Chem model against observations43 than for the model’s other regional variants (e.g. North America,41,42 China39,40). Future studies are required to evaluate the model against observations more comprehensively. The AirBase dataset72 is well suited for this task but this data is not currently available for 2015. Instead here we make some provisional assessment of the model against two observations datasets of standard air-quality pollutants. First, against a sub-set of observations made at Weybourne as part of the Integrated Chemistry of Ozone in the Atmosphere (ICOZA) campaign and secondly against the observations made as part of the UK AURN network. Once we have evaluated the model against these compounds we turn our attention to its simulation of halogen compounds.
3.1 General model performance
A comparison between a sub-set of the observations (O3, CO, NOx and NOy) made as part of the ICOZA campaign and the model (“HAL”) are shown as a time-series in Fig. 2 and as an average diel cycle in Fig. 3. The model captures much of the observed synoptic timescale variability in these species. Notable exceptions include the failure to simulate the very high O3 mixing ratios occurring at the start of the campaign and the high CO mixing ratios in the middle of the campaign. The diel average shows a reasonable ability to reproduce the daily signal in these compounds other than for CO where the model shows a significantly larger cycle than is observed. The model has an average low bias ((“HAL”-Obs.)/Obs.) of 9.2, 0.7, 2.5, and 11%, for O3, NOx, NOy and CO respectively.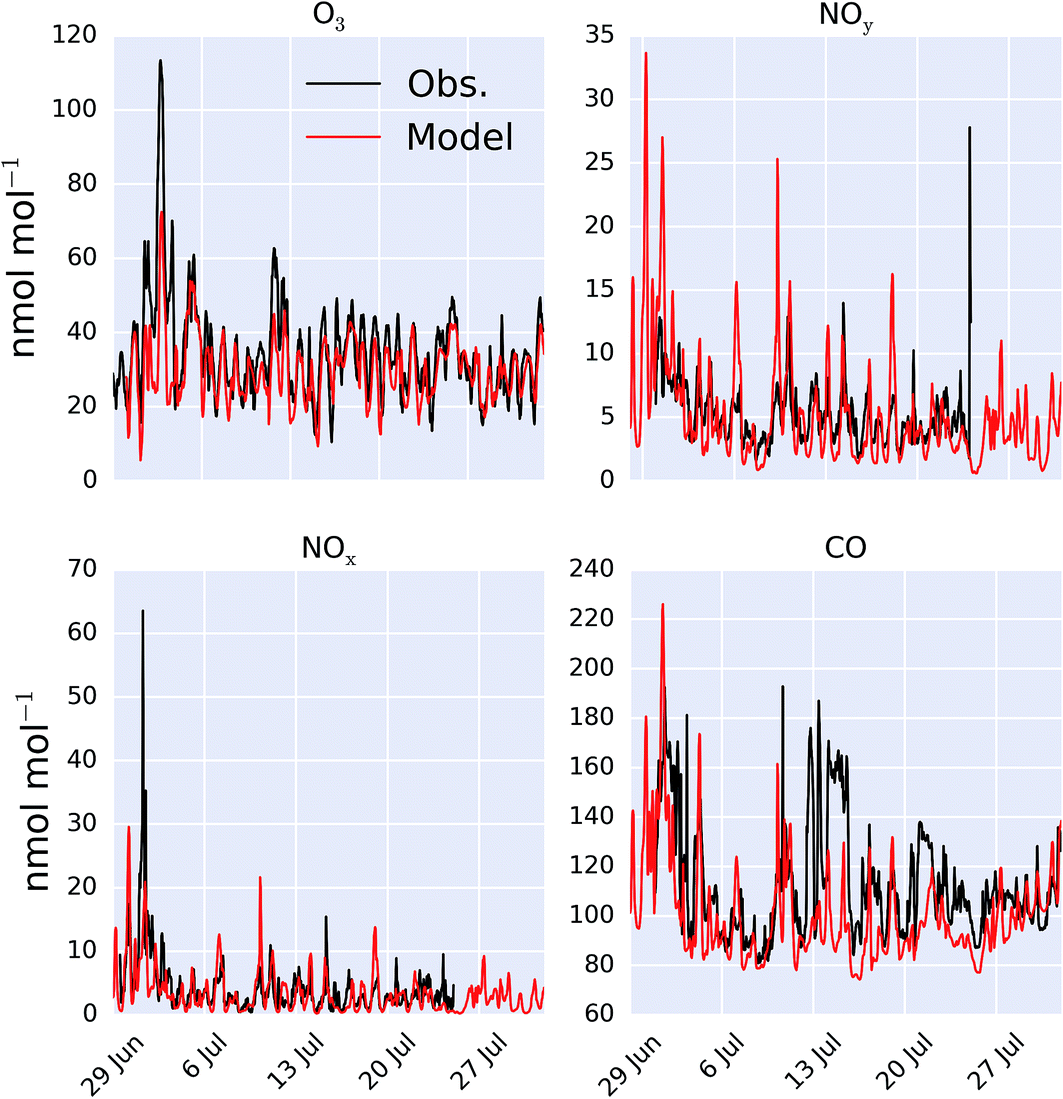 | ||
| Fig. 2 Modelled (“HAL”) and observed mixing ratio at Weybourne of O3, NOy, NOx and CO during the observational period. | ||
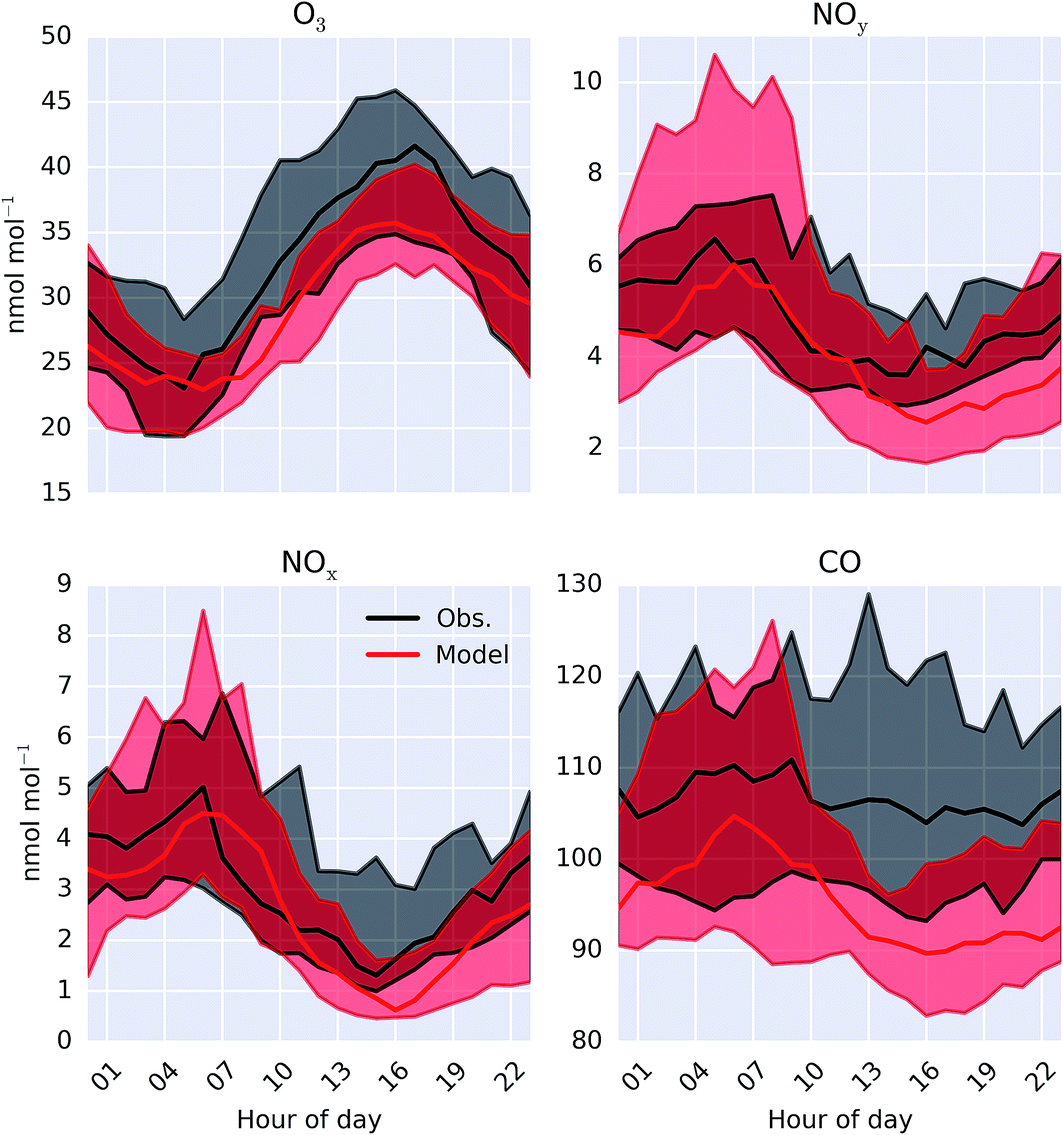 | ||
| Fig. 3 Modelled (“HAL”) and observed median diel mixing ratio at Weybourne of O3, NOy, NOx and CO during the observational period. Shaded regions give 25th and 75th percentiles. | ||
To give a wider geographical comparison, the model (“HAL”) was compared against hourly O3, PM2.5, and NO2 observations from the UK AURN air quality network.54 Sites reporting data and classed as “rural”, “rural background” or “urban background” by DEFRA are used for the comparison. Sites influenced by localised emissions (e.g. roadside sites) are excluded as they are unlikely to provide an appropriate comparison for a model run at 0.25° resolution. A point-by-point comparison between the hourly measured and the spatially and temporally equivalent model values for O3 is given in the ESI Fig. SI3.† The model fails to capture peak O3 mixing ratios, which could be expected considering the limited reactive organics present in the model and could also contribute towards the slight underestimate in average O3 mixing ratios between observation and the “HAL” simulation shown in Fig. 3.
The probability distribution of the O3 observations, and the model simulation for the AURN sites for the “HAL”, “NOHAL”,“HAL-LOCAL” simulations are shown in Fig. 4 (with equivalent log plots shown for PM2.5 and NO2 in ESI Fig. SI4 and SI5†). The model without halogen chemistry in either the boundary conditions or in the region (“NOHAL”) shows substantially higher mixing ratios of O3 (mean of 34.5 nmol mol−1, 25th percentile = 28.5 nmol mol−1 and 75th percentile = 41.1 nmol mol−1) than observed (mean = 27.0 nmol mol−1, 25th percentile = 19.0 nmol mol−1 and 75th percentile = 32.8 nmol mol−1). The model without the halogen chemistry in the boundary conditions (“HAL-LOCAL”) calculates similarly higher O3 mixing ratios. However, including halogen chemistry in both the boundary conditions and in the domain leads to a substantial decrease in the modelled O3 mixing ratios (mean reduction of 26.1%) improving the simulation (mean = 25.5 nmol mol−1, 25th percentile = 19.5 nmol mol−1 and 75th percentile = 31.1 nmol mol−1).
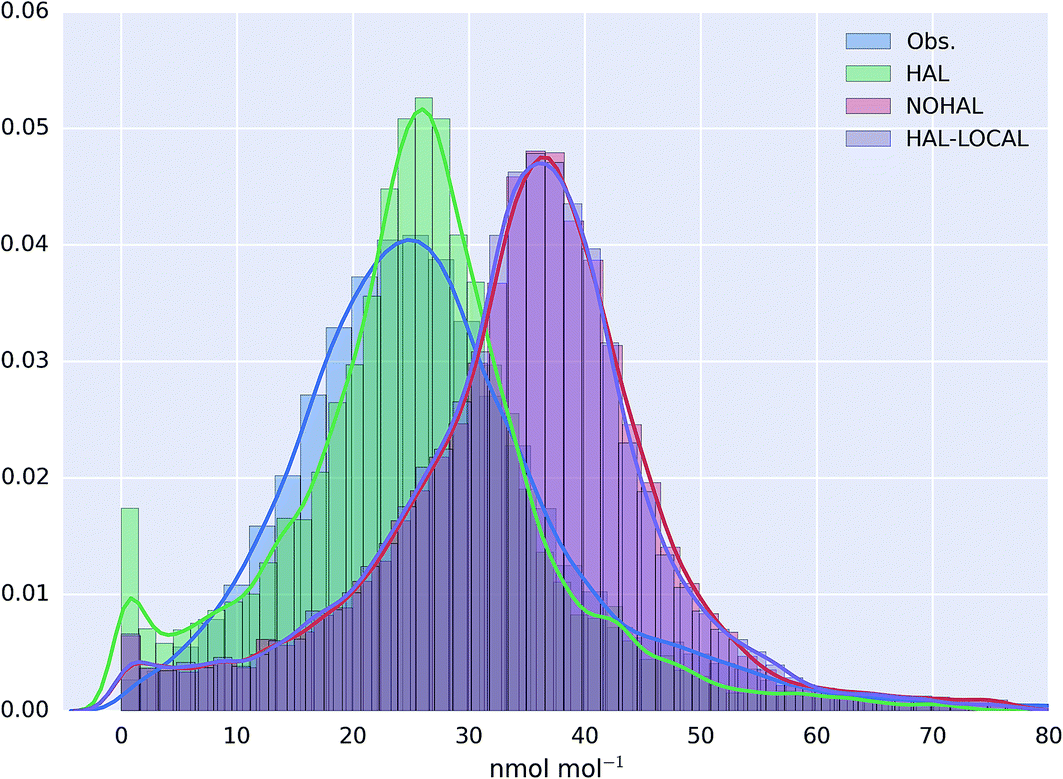 | ||
| Fig. 4 Probability distribution function of observed and modelled O3 mixing ratios at selected UK AURN background sites (N = 63) for the observation period (29th June to 1st August 2015). Modelled values are shown for the simulation with halogens (“HAL”), without halogens (“NOHAL”), and with halogens only within the European domain (“HAL-LOCAL”). | ||
Unlike for O3, where large changes are seen on inclusion of halogens, modest changes are seen for NO2 and PM2.5 (ESI plots SI7 and SI8†). For NO2 the mean hourly modelled mixing ratio for the “HAL” simulation is 6.7 (25th percentile = 1.4 and 75th percentile = 9.5) nmol mol−1 whereas the mean in the “NOHAL” simulation is 7.1 nmol mol−1. Both can be compared to the observational mean of 7.7 (25th percentile = 2.6 and 75th percentile = 10.4) nmol mol−1. For PM2.5 the modelled “HAL” mixing ratio was 8.2 (25th percentile = 4.2 and 75th percentile = 9.7) μg m−3 with a “NOHAL” mean of 8.6 (25th percentile = 4.3 and 75th percentile = 10.0) and an observed concentration of 8.0 (25th percentile = 4.6 and 75th percentile = 10.0) μg m−3.
We now turn our attention to the model’s ability to simulate inorganic halogen compounds over Europe.
3.2 Model simulations of reactive halogens in Europe
The simulation of halogens in the global version of GEOS-Chem and its comparison with observations has been discussed previously.11,12 This provided a first broad-brush assessment of the mixing ratio of halogens (mainly IO and BrO). It concluded that the model appears to have some skill in simulating IO and BrO mixing ratios, but appears to underestimate Cl species.Mean surface mixing ratios of key reactive halogens (BrO, IO and Cl) over Europe are shown in Fig. 5 with mixing ratios of total inorganic halogens (Xy, X = Cl, Br, I) given in the ESI (SI1†). We model the highest halogen mixing ratios over the Mediterranean where emissions are greatest. These emissions are notably high for iodine species where the elevated O3 together with high sea-surface temperature (which determines the ocean iodide mixing ratio in our simulations24,25) leads to a large inorganic iodine flux. A notable difference exists for Cly (Fig. SI1†) where a peak can be also be seen in the North Sea/English channel where high mixing ratios of sea-salt and NOx lead to high ClNO2 production.
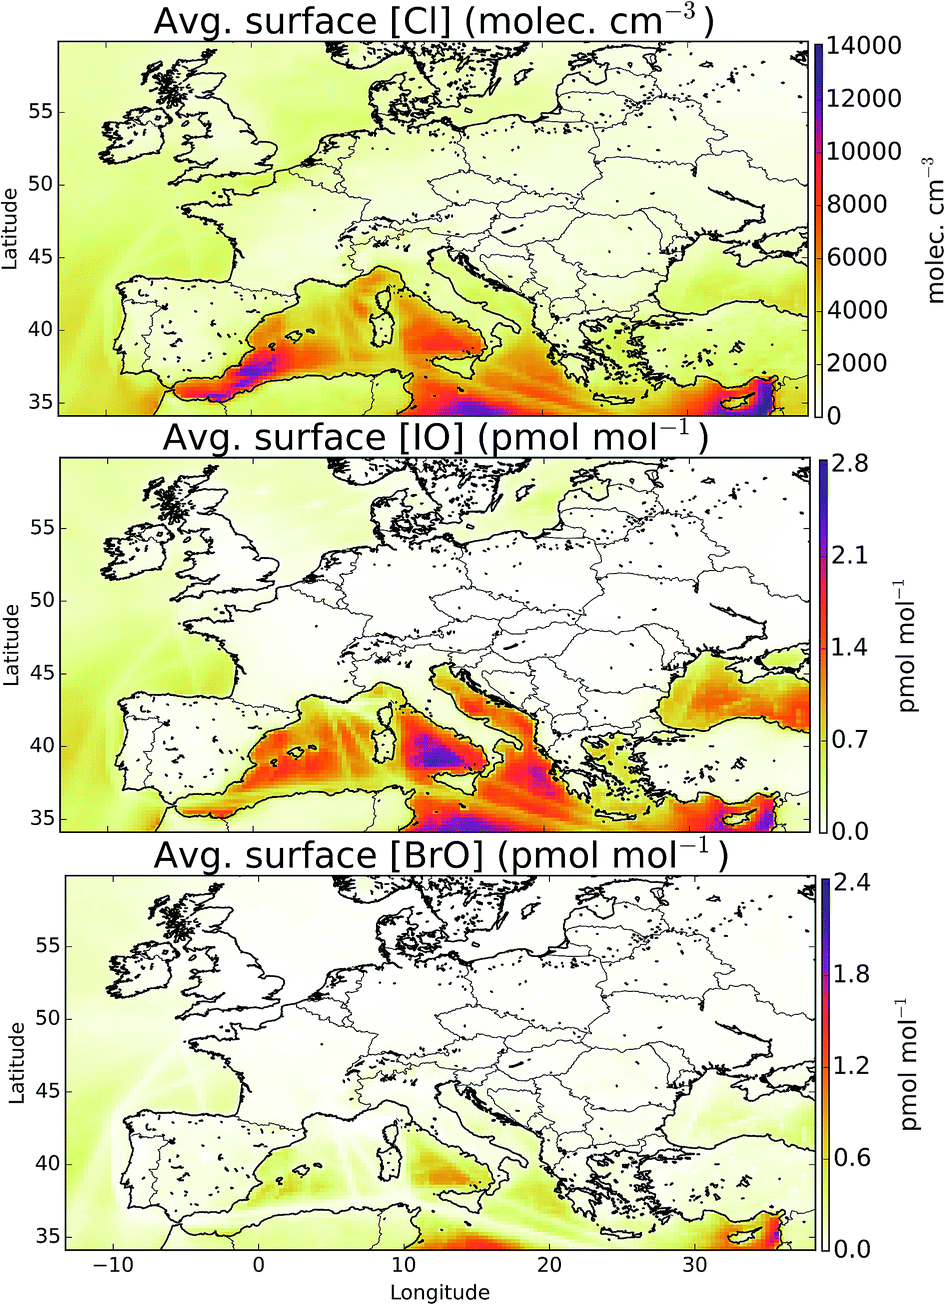 | ||
| Fig. 5 Mean modelled surface mixing ratios of Cl, IO, and BrO during the observational period. | ||
Observations of bromine and iodine inorganic species have previously been reported for a few boundary layer locations in Europe, for example Ireland,17,18 France,19–22,73 and Spain.23 We now compare values reported in the literature to the values calculated in our model for the period of the simulation (for 29th June to 1st August 2015). There are undoubtedly, large seasonal and inter-annual variability in these observations, but this comparison allows a rough assessment of the order of magnitude performance of the model.
A number of field campaigns have occurred over or near tidal coastal zones. IO has been observed at coastal Ireland (Mace Head, 53.3°N, −9.9°E) with peak mixing ratios of between 4 and 50 pmol mol−1.74,75 The model predicts a maximum mixing ratio of 0.6 pmol mol−1 here, substantially lower than the observations. IO has also been reported for Brittany (France, 48.7°N, −4.0°E) of between 7.7 (±0.5)76 and 30 (±7)73 pmol mol−1 and we again calculate lower values with a maximum of 0.07 pmol mol−1. Observations 3.5 km inland in Greece (Heraklion, 35.3°N, 25.1°E) report values less than 1.9 (±0.8) pmol mol−1.77 The model predicts a maximum mixing ratio of 1.8 pmol mol−1 with an average below the stated limit of detection of the observations (1.3 pmol mol−1). Peters et al.18 report peak IO observations in Germany (Dagebüll, 54.7°N, 8.7°E) of 2.0 (±0.7) pmol mol−1 and Oetjen77 for nearby Sylt reports a maximum of 1.4 pmol mol−1. For Sylt and Dagebüll we model peak mixing ratios of 1.8 and 0.7 pmol mol−1, respectively.
Mixing ratios of IO have been measured by a ship cruise in the marine boundary layer of between 0.4 and 1 pmol mol−1 (30% uncertainty).31 This cruise did not extend into the Mediterranean region (where we predict highest IO mixing ratios see Fig. 5), but it did finish in the Mediterranean at Cartagena (Spain) in July 2011 with the last daytime average value reported of ∼0.5 pmol mol−1 (35°N, −8.4°E). For the same location we calculate an average daytime mixing ratio of 0.7 pmol mol−1.
Observations of iodine dioxide (OIO) have also been reported. At Mace Head, peak OIO mixing ratios have been reported (at night) of between 3.0 (±0.4)78 and 13 (±4) pmol mol−1.76 The model predicts substantially lower peak values of 0.09 pmol mol−1. OIO mixing ratios have also been reported in Coastal France (Brittany, 48.7°N, −4.0°E) of around 9 pmol mol−1,19 and with the model calculating significantly lower mixing ratios, peaking at 0.007 pmol mol−1.
Molecular I2 has also been observed in Europe in coastal locations including Ireland, Spain and France. In Spain, (42.5°N, −8.9°E) mixing ratios were reported of 300 (±100) pmol mol−1. At Mace Head, peak nighttime mixing ratios of between 61 (±20)18 and 94 (±20)76 pmol mol−1 have been reported and even higher values at nearby Mweenish Bay (53.3°N, −9.8°E)79 have been found. In France (18.7°N, −8.87°E) mixing ratios of around 50 pmol mol−1 were observed.19,21 For these locations we calculate far lower maximum mixing ratios of 0.06, 0.04, 0.06, and 0.07 pmol mol−1, respectively.
In summary, the model significantly under-predicts reported reactive iodine mixing ratios (IO, OIO, I2) at coastal regions. The most active chemistry in the model occurs in the non-coastal Mediterranean (Fig. 5), a region where we are unaware of published inorganic iodine observations.
Similarly to iodine, only a few bromine observations have been reported for Europe. At Mace Head and Brittany, maximum mixing ratios were reported of 6.5 (ref. 80) and 7.5 (ref. 20) pmol mol−1. For these locations we predict maximum mixing ratios of 0.8 and 0.5 pmol mol−1, respectively. Leser et al.81 reported measurements for a ship cruise from Germany to Capetown in October 2000, which included passing through the English Channel and to the west of Spain. Maximum values were reported of 2.4 pmol mol−1 north of the Canary Islands and a similar value where the English Channel meets the Bay of Biscay. However the rest of the campaign did not report values above the detection limit. For the period the model was run, we predict an average daytime mixing ratio below ∼0.3 pmol mol−1 in regions of this campaign and even lower mixing ratios in areas with shipping emissions.
Fig. 6 shows the observed and modelled time-series and median diel cycle of ClNO2 mixing ratios at Weybourne in Summer 2015. The observations show a large variability throughout the observational period (Fig. 6) and comparison with the median diel cycle shows a high bias in the model of a factor of ∼2. The observed hourly-averaged mean daily maximum is 91 pmol mol−1, with a peak observed of 946 pmol mol−1. The model compares well in the mean maximum (95 pmol mol−1). However modelled peak magnitude is around half the maximum observed value (458 pmol mol−1). The reactive uptake parameter used in the model for N2O5 on sea-salt aerosol is 0.005 for dry sea-salt (relative humidity less that 62%) and 0.03 for wet sea-salt.82 However, if these values are reduced by half then we find a median peak mixing ratio of 37 pmol mol−1, closer to the observations.
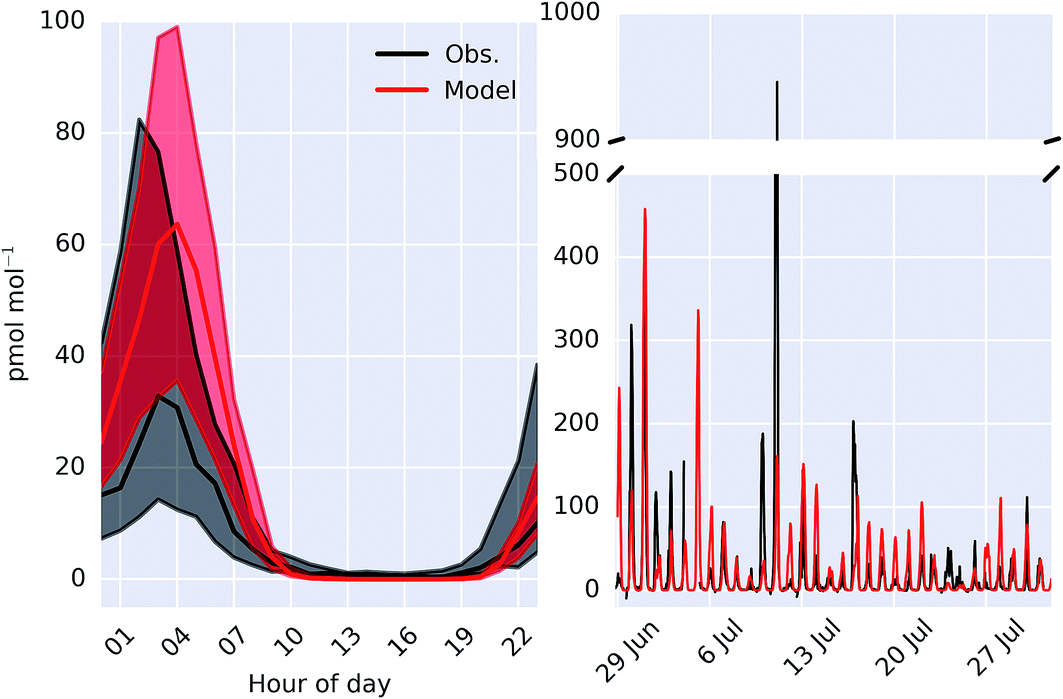 | ||
| Fig. 6 Comparison of observed and modelled (“HAL”) ClNO2 as a median diel cycle (left) and timeseries (right) measured at Weybourne. Shaded regions on the diel plot give 25th and 75th percentiles. | ||
Molecular chlorine (Cl2) was also measured at the site during the ICOZA campaign, but was found to be below the limit of detection (8.5 pmol mol−1). The model also does not predict mixing ratios above the limit of detection.
Observations of ClNO2 have been made in London (51.5°N, −0.13°E)33 and on a mountaintop near Frankfurt (50.22°N, 8.45°E),83 with reported maximum nighttime values of 724 and 800 pmol mol−1, respectively. The model calculates maximum nighttime mixing ratios of ∼140 and ∼110 pmol mol−1for London and Frankfurt, respectively, and average nighttime maxima of ∼40 and ∼30 pmol mol−1. The model therefore has a significant negative bias to these inland ClNO2 observations.
The published continental HCl observations show mixing ratios in the range of tens of pmol mol−1 to a few nmol mol−1 in Italy,84 Netherlands,85,86 France,87 Germany,88 England,89–91 and Switzerland.92 The modelled mixing ratios peak at 12 pmol mol−1. The model therefore significantly underestimates the HCl mixing ratios. Some of this bias is likely due to a lack of chlorine sources from anthropogenic activities, both organic and inorganic and from aerosol processing of chloride. However, it may also reflect excessive loss processes for HCl.
In summary the observational constraints on the modelled halogen concentrations are weak. Much of the observational activity has focussed on process level understanding of halogens at coastal hot spots. For these locations the model appears to systematically underestimate IO, OIO, I2 and BrO mixing ratios. ClNO2 mixing ratios inland appear to be underestimated. The model identifies the region with the most significant halogen chemistry as the Mediterranean, a region with a very low number of observations.
4 European ozone (O3)
Fig. 7 shows the difference in the mean surface O3 mixing ratio between simulations with halogens (“HAL”) and without (“NOHAL”). Fig. 8 (top) shows this in percentage terms. O3 reduces in all locations, and in some locations by a significant fraction (45% or 28.9 nmol mol−1). On average the surface O3 within the domain drops by 13.5 nmol mol−1 (25%), consistent with previous studies.5,12,15,93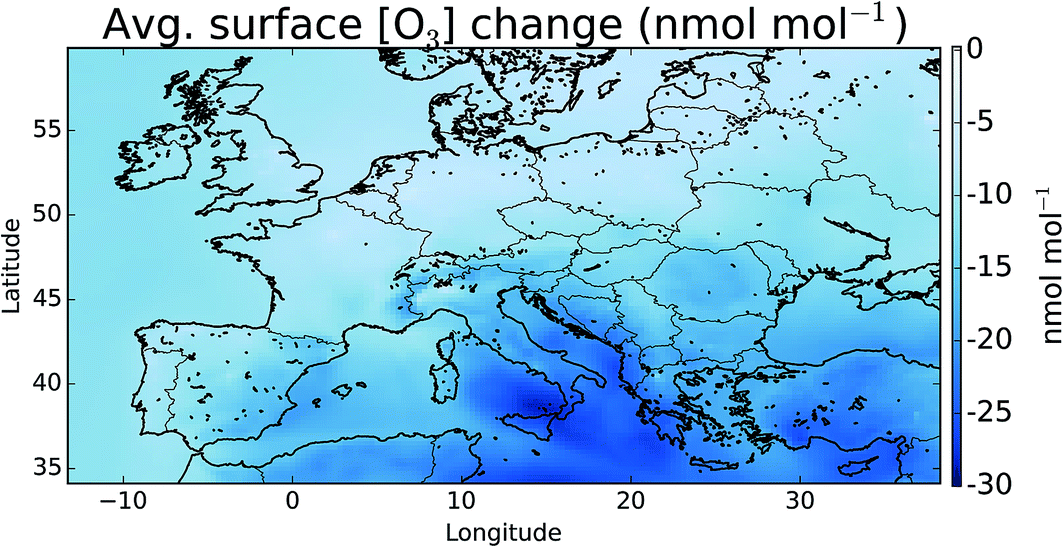 | ||
| Fig. 7 Difference in surface mean O3 mixing ratio between “HAL” and “NOHAL” in nmol mol−1 over the simulation period. Changes in percentage terms are shown in Fig. 8. | ||
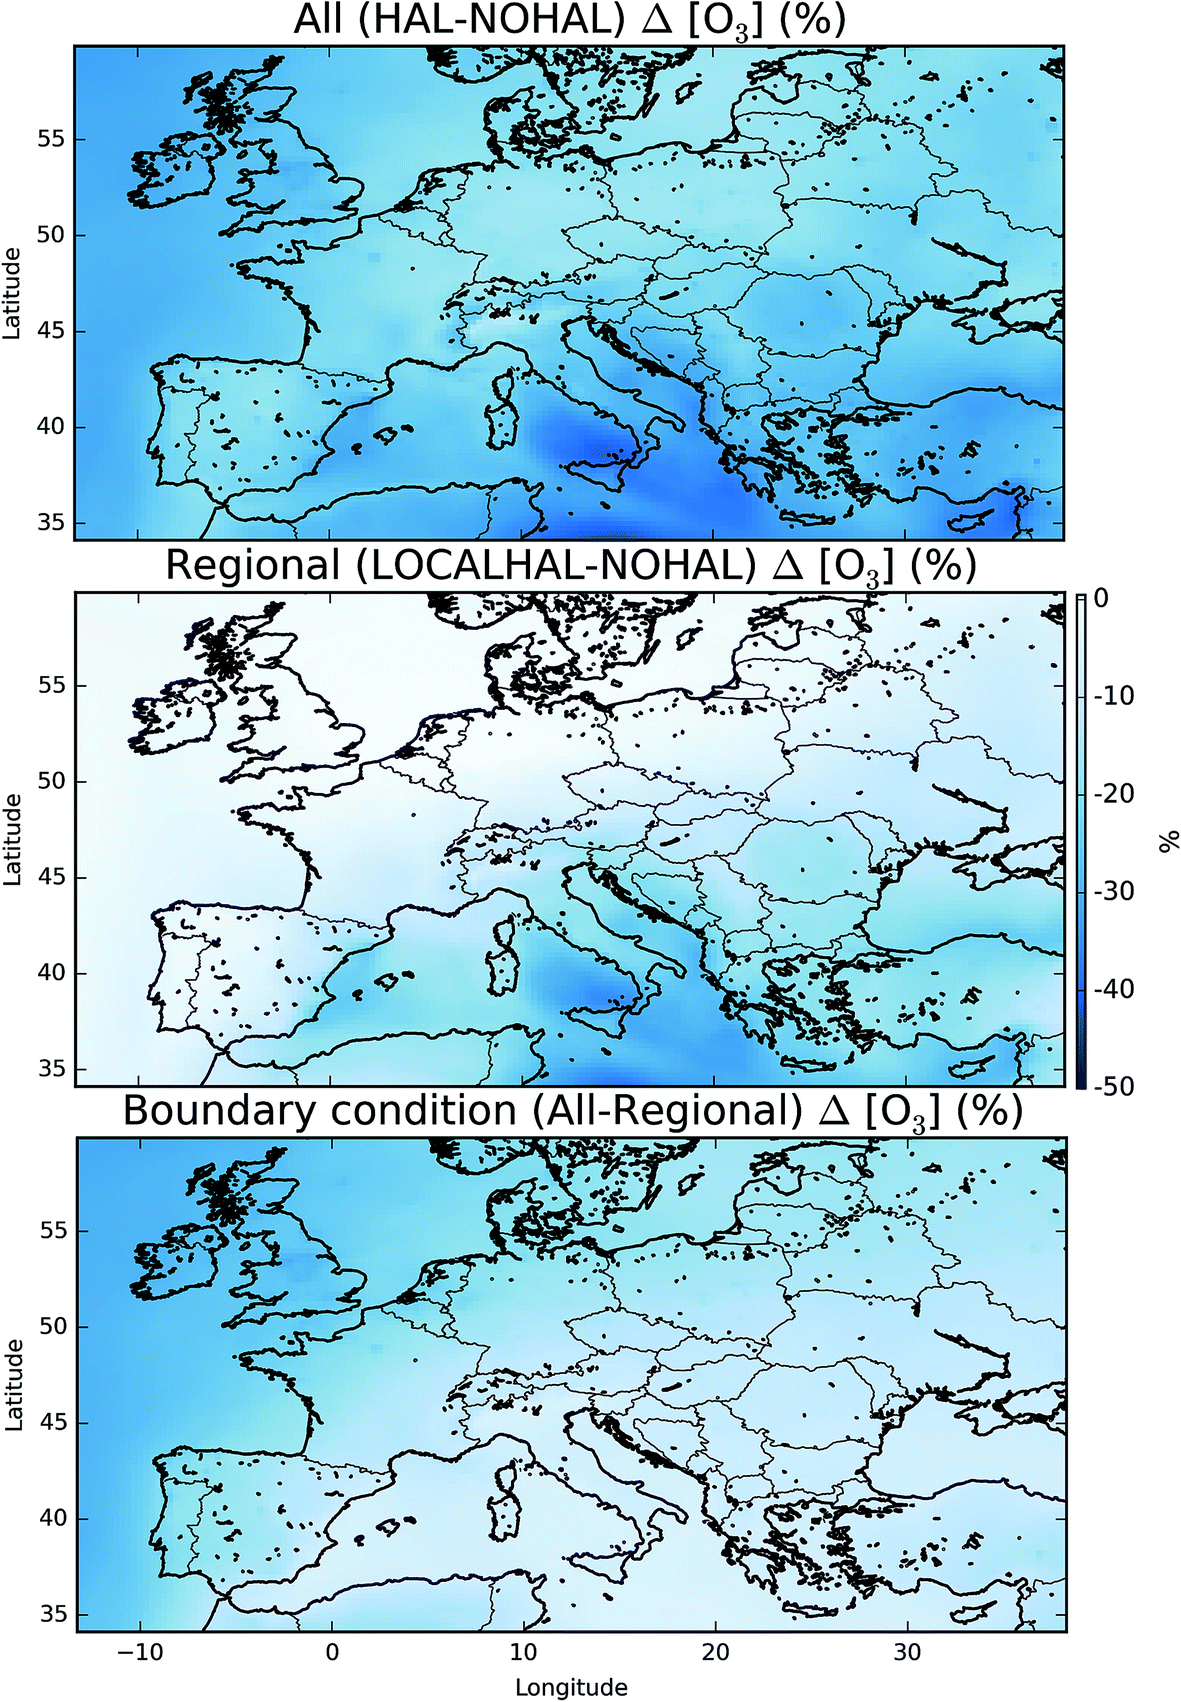 | ||
| Fig. 8 Mean percentage difference in surface O3 mixing ratio when halogens are included in all domains (“HAL” vs. “NOHAL”, top), just within the European domain (“HAL-LOCAL” vs. “NOHAL”, middle), and the global contribution from the difference between these two (top − middle, at the bottom) plots. | ||
To assess changes to O3 within the domain’s boundary layer further, we consider the budget of the rapidly interchanging odd oxygen species (Ox, defined previously12). Table 2 gives an Ox budget for the boundary layer over Europe for the period of the observations (June 29th to August 1st 2015) for the simulations with (“HAL”) and without halogens (“NOHAL”). Inclusion of halogens leads to a slight decrease in the magnitude of the Ox sources of 4%. This is predominantly due to a reduction in the mixing ratio of NOx due to the hydrolysis of halogen nitrates (XNO3 → aq.HOX + HNO3, X = Cl, Br) as discussed on a global scale.11,12 The Ox sink term also decreases (7%) reflecting lower O3 concentrations in the domain. The Ox chemical lifetime decreases from 8 days without halogens to 6.5 days with, a 20% reduction.
| “Cl + Br + I” | “NOHAL” | |
|---|---|---|
| O3 burden (Tg) | 0.9 | 1.2 |
| NO + HO2 | 69.3 | 73.6 |
| NO + RO2 | 40.8 | 41.3 |
| Total chemical Ox sources | 110.1 | 114.9 |
| O3 + H2O + hν | 20.4 | 25.0 |
| O3 + HO2 | 10.2 | 13.3 |
| O3 + OH + O2 | 6.2 | 9.3 |
| Bromine Ox sinks | 1.1 | 0.0 |
| Iodine Ox sinks | 8.0 | 0.0 |
| Chlorine Ox sinks | 0.3 | 0.0 |
| Total chemical Ox sinks | 50.6 | 54.4 |
| O3 dry deposition | 69 | 90 |
This reduction in the surface O3 burden consists of two components: a reduction in the background O3 entering the domain, predominantly from the West (the boundary conditions), and a change to the chemistry occurring within the domain. By running a simulation with the boundary conditions from the global simulation without halogen chemistry, but with halogen chemistry occurring inside the domain (“HAL-LOCAL”) we can separate these two factors. Fig. 8 (top) shows the percentage decrease in the O3 mixing ratio on inclusion of halogens ((“HAL” − “NOHAL”)/“NOHAL”). The middle panel then shows the decrease which is attributable to the local chemistry ((“HAL-LOCAL” − “NOHAL”)/“NOHAL”), with the bottom panel showing the difference between the two panels which we attribute to the global role of halogens in determining the boundary conditions.
Over the northern and western part of the domain, the influence of halogens on the global mixing ratios (as manifested in the boundary conditions) dominates (Fig. 8 (bottom)). Mace Head (53.3°N, −9.9°E) on the west coast of Ireland is often used as the default background air quality site for North West Europe. O3 at Mace Head drops by an average of 12 nmol mol−1 (31%) on the inclusion of halogen chemistry in both the boundary conditions and in the regional model (“HAL”), consistent with previous global studies.11,12,31 However, this reduction is only 0.51 nmol mol−1 (1.3%) in the simulation where the boundary condition doesn’t reflect global halogen chemistry (“HAL-LOCAL”). This influence of the reduced O3 due to the a reduction in the global background, extends over the European Atlantic regions and into the North Sea. However, its magnitude decreases over continental regions especially in the south of the domain. This is due to the local production of O3 in these regions and the shorter lifetime of O3 in continental regions reducing the influence of boundary conditions compared to marine regions.
Over the southern and eastern part of the domain the global background influence of halogens plays a less significant role and it is local halogen chemistry that dominates the reduction simulated in O3. For example over Sicily (18.6°N, 14.2°E), O3 mixing ratios are reduced 28.4 nmol mol−1 (41%) on the inclusion of halogen chemistry in both the boundary conditions and in the regional model (“HAL”) and by 24.3 nmol mol−1 (35%) in the simulation with only halogen chemistry occurring within the domain (“HAL-LOCAL”). Thus in this location the impact of halogens on the global background is much less important than the local halogen chemistry. Fig. 5 shows much higher mixing ratios of halogens over the Mediterranean than any other region of the domain, however, there are no obvious observational constraints for halogen species here and so their regional influence is un-assessed.
The cumulative distribution functions of surface hourly O3 mixing ratios over Europe for the differing simulations are shown in Fig. 9. The inclusion of halogens reduces the probability of high O3 occurring in the model but the difference between the north (>47°N) and the south (<47°N) of Europe is evident. For the north of Europe, only small changes are seen between simulations with only local halogens (“HAL-LOCAL”) compared to no halogens at all (“NOHAL”). The median O3 mixing ratios in the north of Europe (>47°N) are 31.1, 40.0, and 40.5 nmol mol−1 for the “HAL”, “HAL-LOCAL”, and “NOHAL” simulations, respectively. Local chemistry thus plays little role in determining the median concentrations. However the role of local chemistry becomes more pronounced at the upper end of the O3 distribution, with the 95th percentile mixing ratios for these simulations being 54.0, 59.4, and 65.6 nmol mol−1.
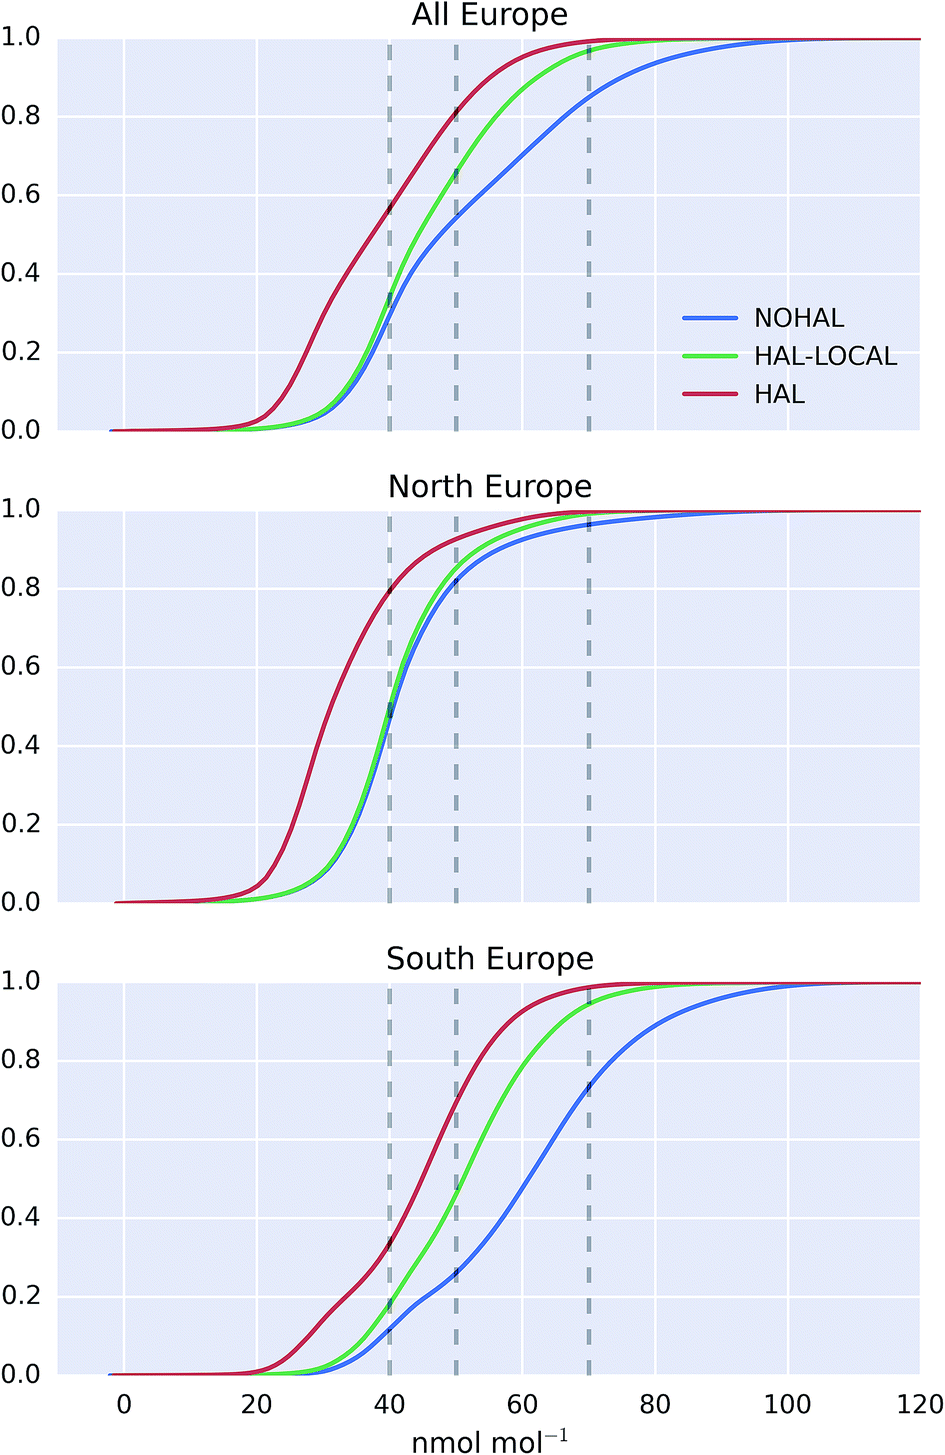 | ||
| Fig. 9 Cumulative probability distribution plot of surface modelled O3 for the observation period, for the entire domain (top), northern Europe (>47°N, middle), and southern Europe (<47°N, bottom). Modelled values are shown for the simulation with halogens (“HAL”), without halogens (“NOHAL”), and with halogens only with the European domain (“HAL-LOCAL”). Vertical dashed black lines give 40, 50 and 70 nmol mol−1. The x axis is limited to 120 nmol mol−1. | ||
For the south of Europe (<47°N) a larger proportion of change between the simulation with halogens (“HAL”) and without (“NOHAL”) can be explained by local chemistry (“HAL-LOCAL”) and this influence is felt throughout the O3 distribution. Fig. 9 shows a reduction in the median O3 mixing ratio from “HAL” to “HAL-LOCAL” to “NOHAL” of 44.9, 51.1, and 61.0 nmol mol−1, respectively. Similar reductions can be seen in the 95th percentile mixing ratios with values of 62.4, 70.7, and 88.1 nmol mol−1.
The upper end of the O3 distribution is most important from an air quality perspective. The model shows a decrease in average surface maximum mixing ratios of 19.9 nmol mol−1 on inclusion of halogens. This is greater than the decrease seen in average surface mean mixing ratios (13.5 nmol mol−1). For UK legislation, 50 nmol mol−1 (100 μg m−3) is important for human health reasons as above this value exceedances are considered. 45.7% of modelled surface O3 values are above this value when halogens are not included (“NOHAL”), 34.1% when halogens are just considered locally (“HAL-LOCAL”) and 18.9% when halogens are considered in all domains (“HAL”). The O3 mixing ratio of 40 nmol mol−1 is considered an important threshold for ecosystems.94 We see a decrease in the percentage of hourly surface values above 40 nmol mol−1 from 70.5% in ‘NOHAL′′ and 65.9% in “HAL-LOCAL”, to 43.3% in “HAL”. Halogens reduce the percent of modelled values above 70 nmol mol−1 too, with the values dropping from 15.1% in “NOHAL” to 3.2% in “HAL-LOCAL” and 0.9% in “HAL”.
Within our model, with our current representation of halogen chemistry, and for the period we have investigated, halogens have a significant impact on the mixing ratio of modelled O3. There are significant reductions in the mixing ratio of O3 both in the north and south of Europe but for differing reasons (global background versus local chemistry) with influences both for the median and higher percentiles of the distribution. There is a need for significant and further evaluation of the model against an increased observation dataset to develop evidence to support these conclusions but this work suggest that halogens may play a significant role in determining the distribution of European surface O3.
5 European oxidation
The oxidation of VOCs, CO, and CH4 in the presence of NOx drives the chemistry of the troposphere. This oxidation is dominated by the OH radical. Within our domain we calculate average boundary layer OH concentrations of 3.53 × 10⁶, 3.08 × 10⁶, and 2.89 × 10⁶ molecules cm−3 for the simulations without halogens (“NOHAL”), with local halogens (“HAL-LOCAL”) and with global halogens (“HAL”), respectively.The halogens tend to reduce OH mixing ratios (Fig. 10) as they decrease O3 and thus the production of OH via the primary sources (photolysis of ozone and the subsequent reactions of the photo products with water), and decrease the NOx mixing ratio thus leading to smaller conversion of HO2 to OH via this route (NO + HO2). The conversion of HO2 to OH via XO is not large enough to compensate for this. This leads to an average reduction in surface OH mixing ratios of 16%. The largest reductions are simulated where O3 mixing ratios are reduced and where there is active halogen chemistry which leads to lower NOx mixing ratios due to rapid hydrolysis of halogen nitrates on aerosol.
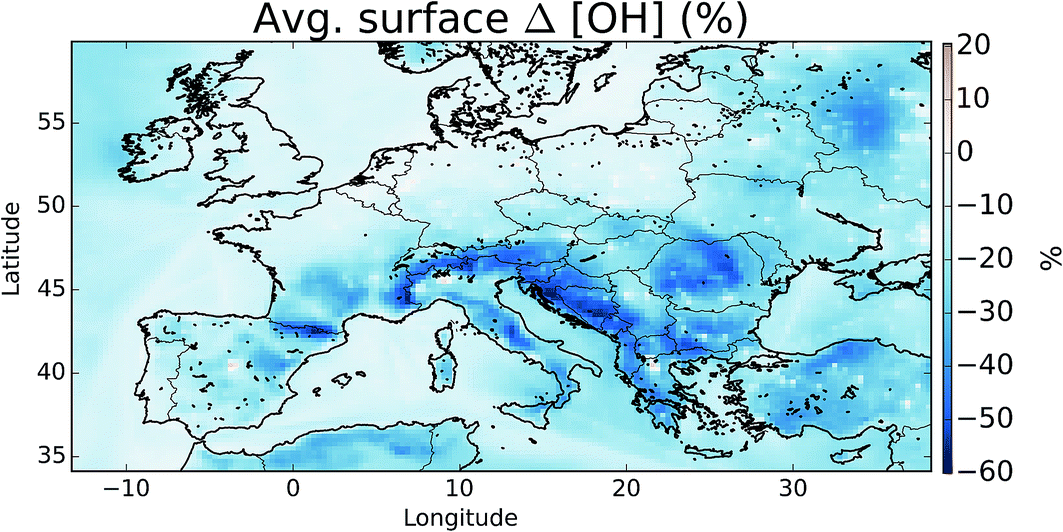 | ||
| Fig. 10 Percentage difference in surface OH between simulations including halogens (“HAL”) and not (“NOHAL”). | ||
The inclusion of halogen chemistry brings with it a new oxidant, atomic chlorine (Fig. 5). The average European boundary layer atomic chlorine mixing ratio is 2.1 × 10³ atoms cm−3. This compares with an annual averaged global tropospheric value of 1.3 × 10³ atoms cm−3 found by recent global modelling.7 Daytime modelled Cl mixing ratios at the surface range from 1.5 × 10² to 2.3 × 10⁴ atoms cm−3, with a maximum hourly value of 2.7 × 10⁵ atoms cm−3. Within the boundary layer atomic chlorine provides 12, 16 and 9.1% of the sink for ethane, acetone and propane, respectively. It contributes 1.7% of the CH4 loss. As discussed earlier, a lack of observational constraint results in significant uncertainties in our simulation of Cl species but these simulations suggest that Cl may play a moderately important role in determining the oxidation of some VOCs within the European domain.
6 Chlorine versus bromine and iodine
Overall, we find that the combined impact of halogens (Cl, Br, I) leads to a reduction in O3 mixing ratio over Europe. Previous studies investigating the impact of halogen species with comparable halogen schemes have come to similar conclusions.5 However, studies of chlorine, notably from ClNO2, have found increases in O3.2–4 In sections 2.2 and 3.2 we show that the model likely provides a lower estimate for chlorine chemistry in the atmosphere, however it is instructive to examine the impact of ClNO2 on the composition of the air over Europe.The modelled mean-daily maximum mixing ratio of ClNO2 is shown in Fig. 11. Peak magnitudes are comparable to those reported in recent modelling work for Northern hemispheric summer of up to 400 pmol mol−1,4 and annual values over Europe from global models of 100–140 pmol mol−1.12,95 The highest regions for ClNO2 mixing ratios are seen where shipping emissions are greatest (Fig. 11). By running a simulation without ClNO2 production (“NOClNO2”) the impact of ClNO2 on O3 can be assessed.
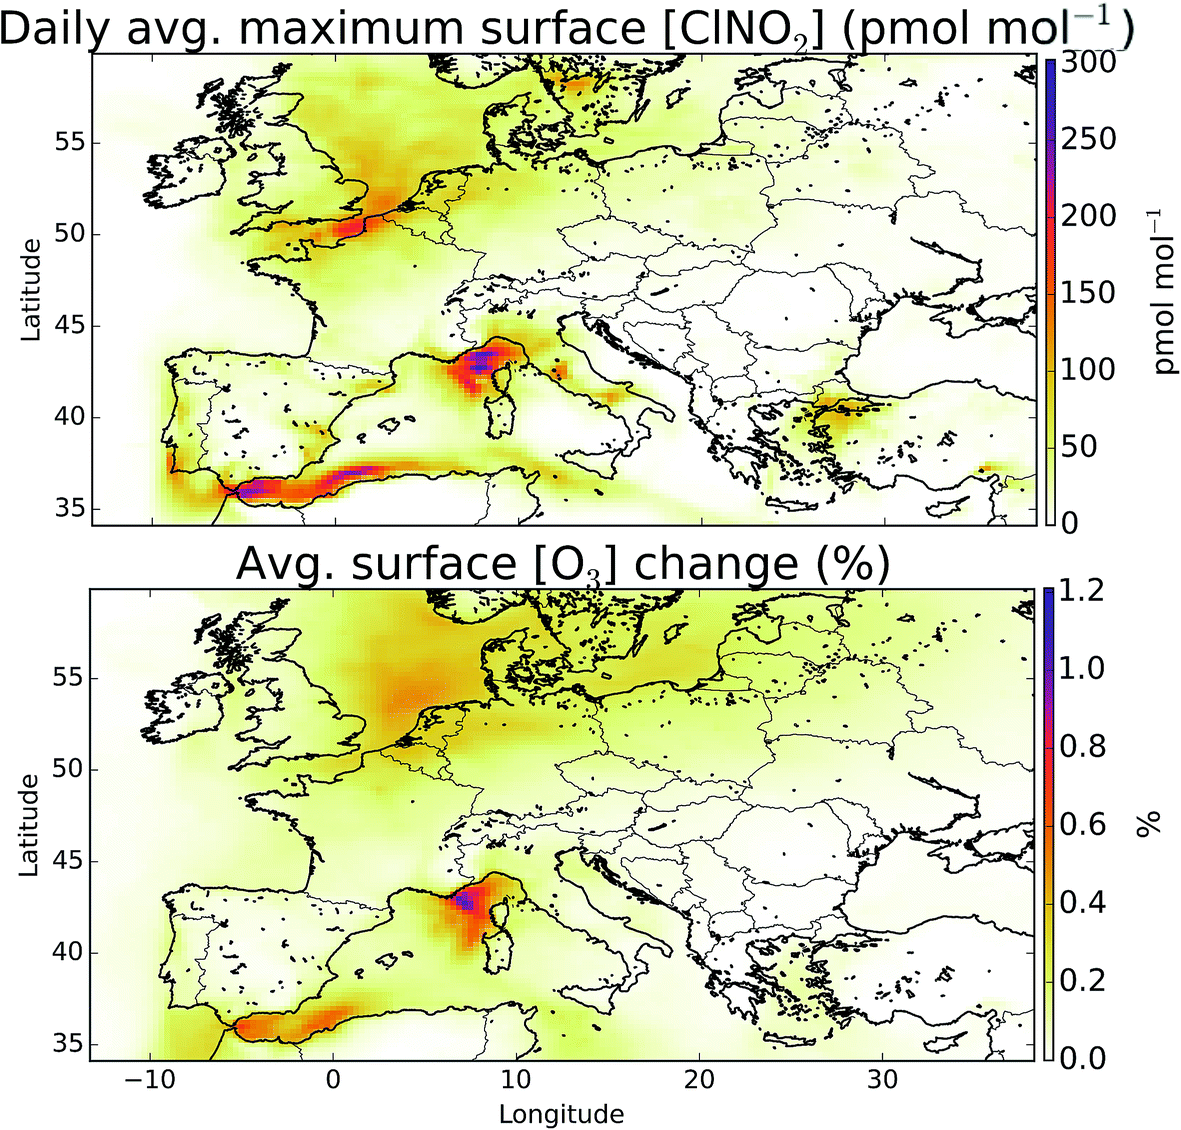 | ||
| Fig. 11 Mean daily maximum surface ClNO2 mixing ratios (top) and impact of ClNO2 production on O3 (bottom). Inclusion of ClNO2 leads to small increases in the O3 mixing ratio predominantly over coastal regions with heavy ship traffic. | ||
We find that increases in O3 surface mixing ratios on inclusion of ClNO2 during summertime are modest, as reported previously.2,4 The maximum increase seen in the average surface O3 mixing ratio is up to 0.41 (1.2%) nmol mol−1, which is within the range of summer enhancement reported previously for the northern hemisphere (0.2–1.6 nmol mol−1).4 Larger changes have been reported in winter time4 and would be expected if processes increasing chloride concentrations inland were included in the model.
In our model, the dominant source of reactive chlorine in the European boundary layer is the production of BrCl from heterogenous routes,11 rather than the production of ClNO2. This source is both more diffuse than the ClNO2 source which requires high NOx mixing ratios and does not decrease NOx mixing ratios, in contrast to halogen nitrate hydrolysis. It seems likely therefore that when all chlorine sources are considered together they lead to a reduction in O3 mixing ratios consistent with previous global studies.12 Significant uncertainties remain in our fundamental understanding of this heterogenous chlorine chemistry96 and further laboratory and field studies are needed to clarify the mechanisms by which chlorine is released from sea-salt.
7 Aerosols
Fig. 12 shows the change in boundary layer fine particulate matter (PM2.5), for all aerosol types and just for the sulfate (SO42−), ammonia (NH4+), and nitrate (NO3−) system with and without halogens. The details of the calculation can be found in the ESI.† These changes equate to a domain average decrease of 1.7 and 4.3%, for PM2.5 and SO42− + NH4+ + NO3−, respectively. NO3− shows the largest changes in topographically elevated regions, highlighting the large decreases in NOx seen at these altitudes on inclusion of halogens.11,12 Small changes are seen in the concentration of SO42− reflecting the changes in the oxidants discussed in Section 5. However, halogens may be able to directly impact the production of SO42− through the oxidation on aerosol of SO2 by hypohalous acids (HOX) on aerosol as has been discussed,97 which may lead to increased SO42− production.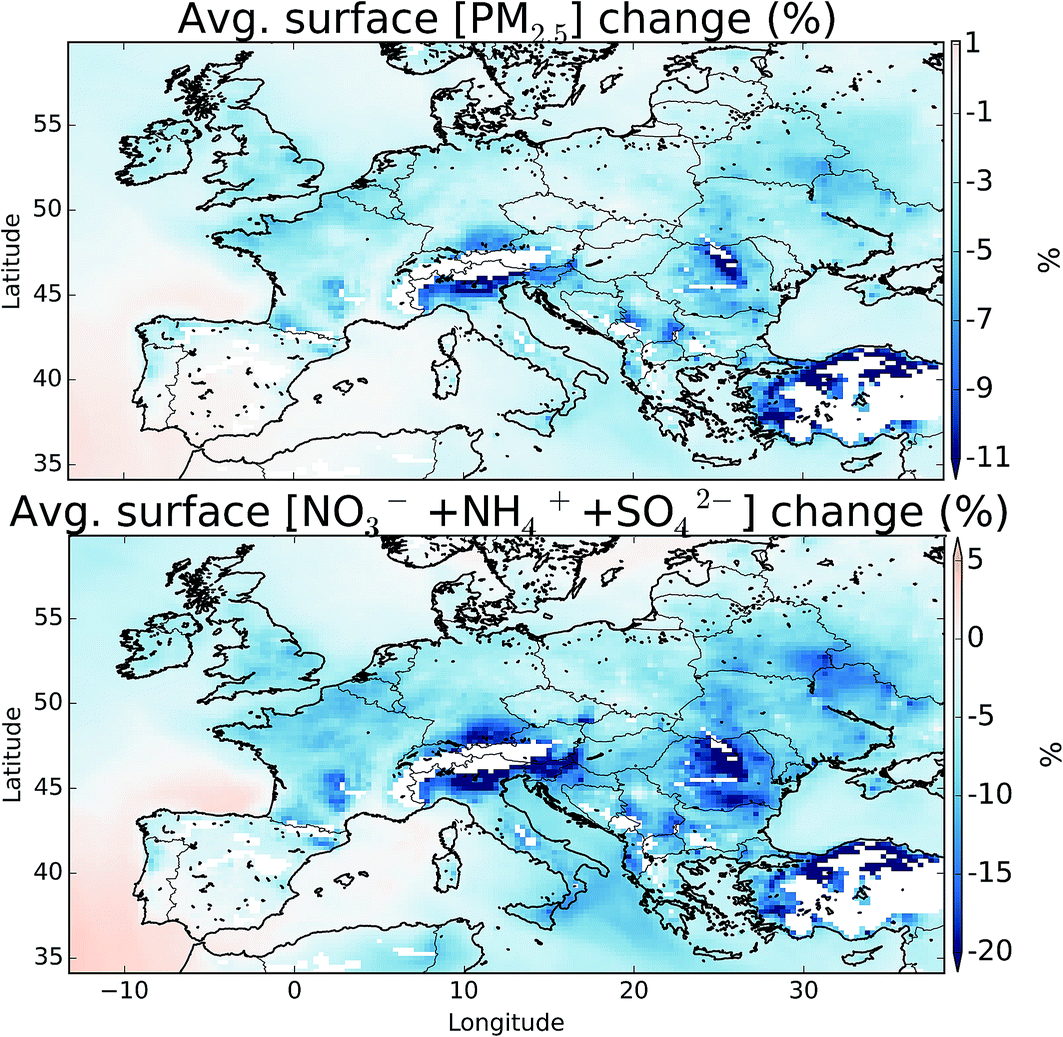 | ||
| Fig. 12 Percentage difference in boundary layer surface (>900 hPa) total fine particulate matter (below 2.5 microns, PM2.5), and the sulfate (SO42−), ammonia (NH4+), and nitrate (NO3−) mode between the simulation with halogens (“HAL”) and without (“NOHAL”). Maximum values on the PM2.5 and SO42− + NH4+ + NO3− plots are −21.1 and 34.9%. Plotted regions are restricted to those with surface pressures greater than 900 hPa to remove larger influences at clean mountain top sites. | ||
8 Conclusions and discussion
We have investigated the impact of Cl, Br and I chemistry on the mixing ratio of O3 and other pollutants over Europe in the summer of 2015 using the GEOS-Chem model in its European configuration. An initial assessment of the model against observations made at the Weybourne Atmospheric Observatory and from the UK air quality network shows some skill in capturing mean mixing ratios and diel cycle of O3, NO2, NOy, and PM2.5 concentrations, however a more extensive assessment of the model in this configuration is needed. Comparisons between observations of ClNO2 made at Weybourne show a model overestimate on average. However, the model significantly underestimates ClNO2 observations reported for more inland regions suggesting some missing processes. The mixing ratios of inorganic bromine and iodine species reported from European sites are significantly higher than those calculated. This likely reflects the lack of realistic representation of coastal processes in the model.Halogen chemistry has a significant impact on the O3 mixing ratios calculated over Europe. The north of Europe is mainly sensitive to the reduction in the global O3 background, whereas the south (notably the Mediterranean) is sensitive to the local halogen chemistry. Chlorine from ClNO2 leads to small regional increases in O3 but this is overwhelmed by the decreases caused by other halogens. We find that mean surface O3 mixing ratios significantly reduced by an average of 13.5 nmol mol−1 (25%), with the frequency of hourly mean surface O3 mixing ratios above 50 nmol mol−1 falling from 46% to 18%. The frequency of occurrence of hourly mean surface ozone mixing ratios above 70 nmol mol−1 falls from 15.1% to 0.9%. Halogen chemistry may therefore play an important role in determining the O3 exposure over Europe. Oxidant mixing ratios are changed by halogens with OH at the surface dropping due to a reduction in primary production. Atomic Cl leads to some additional oxidation of VOCs, notably for ethane, propane and acetone. Halogens appear to have little impact on aerosol mixing ratios.
Given these simulations it would appear that halogen chemistry may play a significant role in determining the O3 mixing ratios found during summertime in Europe, and should be included in model analyses. Further studies are necessary to confirm these findings and to evaluate whether they have any specific relevance to European air quality policy. For example, do regions change from being NOx or VOC limited on inclusion of the halogens? How does the model respond to future emissions scenarios? It would be surprising if Europe was alone in this sensitivity. Previous global model simulations12 show other regions where halogens may play a role in determining the O3 concentrations such as the west coast of the United States and Canada, western India, northern Japan, southern West Africa etc. Air quality simulations for these regions may similarly be sensitive to the inclusion and representation of halogen chemistry.
However, there is little observational constraint on these conclusions. The current set of observations of halogens in Europe are sparse and potentially biased by coastal specific processes. Future efforts to provide observations of atmospheric chlorine, bromine and iodine species in a range of environments, together with ocean iodide observations especially in the Mediterranean would provide a useful constraint here. Continued development of the laboratory measurements, especially of the heterogenous phase chemistry, would also help to provide a better basis for these model simulations and our understanding of the role of halogen chemistry in determining air-quality.
Acknowledgements
We thank DEFRA for Weybourne and air-quality data from the Automatic Urban and Rural Network (AURN) and the National Centre for Atmospheric Science (NCAS) for access to observations made as part of their long-term measurement programme. We thank the National Environment Research Council (NERC) for support through grants (NE/K004603/1, NE/K004069/1, NE/K012398/1, NE/K012169/1) that supported the ICOZA and ClNO2 project. LJC, MJE, and TMS also acknowledge support from NERC grants NE/N009983/1 and NE/L01291X/1. We acknowledge the GEOS-Chem Support Team and the GEOS-Chem user community for their work developing and supporting the regional nested configurations of GEOS-Chem. In particular Junwei Xu for processing meteorological fields for the period of observations and Lee Murray for preparing lightning NOx files for the European grid.References
- W. R. Simpson, S. S. Brown, A. Saiz-Lopez, J. A. Thornton and R. von Glasow, Chem. Rev., 2015, 115, 4035–4062 CrossRef CAS PubMed.
- H. Simon, Y. Kimura, G. McGaughey, D. T. Allen, S. S. Brown, H. D. Osthoff, J. M. Roberts, D. Byun and D. Lee, J. Geophys. Res.: Atmos., 2009, 114, D00F03 CrossRef.
- G. Sarwar, H. Simon, P. Bhave and G. Yarwood, Atmos. Chem. Phys., 2012, 12, 6455–6473 CAS.
- G. Sarwar, H. Simon, J. Xing and R. Mathur, Geophys. Res. Lett., 2014, 41, 4050–4058 CrossRef CAS.
- G. Sarwar, B. Gantt, D. Schwede, K. Foley, R. Mathur and A. Saiz-Lopez, Environ. Sci. Technol., 2015, 49, 9203–9211 CrossRef CAS PubMed.
- R. P. Fernandez, R. J. Salawitch, D. E. Kinnison, J.-F. Lamarque and A. Saiz-Lopez, Atmos. Chem. Phys., 2014, 14, 13391–13410 Search PubMed.
- R. Hossaini, M. P. Chipperfield, A. Saiz-Lopez, R. Fernandez, S. Monks, P. Brauer and R. von Glasow, J. Geophys. Res.: Atmos., 2016, 121, 14271–14297 Search PubMed.
- J. P. Parrella, D. J. Jacob, Q. Liang, Y. Zhang, L. J. Mickley, B. Miller, M. J. Evans, X. Yang, J. A. Pyle, N. Theys and M. Van Roozendael, Atmos. Chem. Phys., 2012, 12, 6723–6740 CrossRef CAS.
- A. Saiz-Lopez, J. F. Lamarque, D. E. Kinnison, S. Tilmes, C. Ordonez, J. J. Orlando, A. J. Conley, J. M. C. Plane, A. S. Mahajan, G. S. Santos, E. L. Atlas, D. R. Blake, S. P. Sander, S. Schauffler, A. M. Thompson and G. Brasseur, Atmos. Chem. Phys., 2012, 12, 3939–3949 CrossRef CAS.
- A. Saiz-Lopez, R. P. Fernandez, C. Ordóñez, D. E. Kinnison, J. C. Gómez Martín, J.-F. Lamarque and S. Tilmes, Atmos. Chem. Phys., 2014, 14, 19985–20044 CrossRef.
- J. A. Schmidt, D. J. Jacob, H. M. Horowitz, L. Hu, T. Sherwen, M. J. Evans, Q. Liang, R. M. Suleiman, D. E. Oram, M. L. Breton, C. J. Percival, S. Wang, B. Dix and R. Volkamer, J. Geophys. Res.: Atmos., 2016, 2169–8996 Search PubMed.
- T. Sherwen, J. A. Schmidt, M. J. Evans, L. J. Carpenter, K. Großmann, S. D. Eastham, D. J. Jacob, B. Dix, T. K. Koenig, R. Sinreich, I. Ortega, R. Volkamer, A. Saiz-Lopez, C. Prados-Roman, A. S. Mahajan and C. Ordóñez, Atmos. Chem. Phys., 2016, 16, 12239–12271 CrossRef CAS.
- T. Sherwen, M. J. Evans, L. J. Carpenter, J. A. Schmidt and L. J. Mickely, Atmos. Chem. Phys., 2017, 17(2), 1557–1569 CrossRef.
- T. E. Graedel and W. C. Keene, Global Biogeochem. Cycles, 1995, 9, 47–77 CrossRef CAS.
- T. Sherwen, M. J. Evans, L. J. Carpenter, S. J. Andrews, R. T. Lidster, B. Dix, T. K. Koenig, R. Sinreich, I. Ortega, R. Volkamer, A. Saiz-Lopez, C. Prados-Roman, A. S. Mahajan and C. Ordóñez, Atmos. Chem. Phys., 2016, 16, 1161–1186 CAS.
- J. Burkholder, J. P. D. Abbatt, R. E. Huie, M. J. Kurylo, D. M. Wilmouth, S. P. Sander, J. R. Barker, C. E. Kolb, V. L. Orkin and P. H. Wine, Chemical Kinetics and Photochemical Data for Use in Atmospheric Studies – Evaluation Number 18, Nasa panel for data evaluation technical report, 2015 Search PubMed.
- B. Alicke, K. Hebestreit, J. Stutz and U. Platt, Nature, 1999, 397, 572–573 CrossRef CAS.
- C. Peters, S. Pechtl, J. Stutz, K. Hebestreit, G. Hönninger, K. G. Heumann, A. Schwarz, J. Winterlik and U. Platt, Atmos. Chem. Phys., 2005, 5, 3357–3375 CrossRef CAS.
- A. S. Mahajan, H. Oetjen, A. Saiz-Lopez, J. D. Lee, G. B. McFiggans and J. M. C. Plane, Geophys. Res. Lett., 2009, 36, L16803 CrossRef.
- A. S. Mahajan, H. Oetjen, J. D. Lee, A. Saiz-Lopez, G. B. McFiggans and J. M. C. Plane, Atmos. Environ., 2009, 43, 3811–3818 CrossRef CAS.
- R. J. Leigh, S. M. Ball, J. Whitehead, C. Leblanc, A. J. L. Shillings, A. S. Mahajan, H. Oetjen, J. D. Lee, C. E. Jones, J. R. Dorsey, M. Gallagher, R. L. Jones, J. M. C. Plane, P. Potin and G. McFiggans, Atmos. Chem. Phys., 2010, 10, 11823–11838 CrossRef CAS.
- G. McFiggans, C. S. E. Bale, S. M. Ball, J. M. Beames, W. J. Bloss, L. J. Carpenter, J. Dorsey, R. Dunk, M. J. Flynn, K. L. Furneaux, M. W. Gallagher, D. E. Heard, A. M. Hollingsworth, K. Hornsby, T. Ingham, C. E. Jones, R. L. Jones, L. J. Kramer, J. M. Langridge, C. Leblanc, J.-P. LeCrane, J. D. Lee, R. J. Leigh, I. Longley, A. S. Mahajan, P. S. Monks, H. Oetjen, A. J. Orr-Ewing, J. M. C. Plane, P. Potin, A. J. L. Shillings, F. Thomas, R. von Glasow, R. Wada, L. K. Whalley and J. D. Whitehead, Atmos. Chem. Phys., 2010, 10, 2975–2999 CrossRef CAS.
- A. S. Mahajan, M. Sorribas, J. C. Gómez Martín, S. M. MacDonald, M. Gil, J. M. C. Plane and A. Saiz-Lopez, Atmos. Chem. Phys., 2011, 11, 2545–2555 CrossRef CAS.
- L. J. Carpenter, S. M. MacDonald, M. D. Shaw, R. Kumar, R. W. Saunders, R. Parthipan, J. Wilson and J. M. C. Plane, Nat. Geosci., 2013, 6, 108–111 CrossRef CAS.
- S. M. MacDonald, J. C. Gómez Martín, R. Chance, S. Warriner, A. Saiz-Lopez, L. J. Carpenter and J. M. C. Plane, Atmos. Chem. Phys., 2014, 14, 5841–5852 CrossRef.
- W. C. Keene, M. A. K. Khalil, D. J. Erickson, A. McCulloch, T. E. Graedel, J. M. Lobert, M. L. Aucott, S. L. Gong, D. B. Harper, G. Kleiman, P. Midgley, R. M. Moore, C. Seuzaret, W. T. Sturges, C. M. Benkovitz, V. Koropalov, L. A. Barrie and Y. F. Li, J. Geophys. Res.: Atmos., 1999, 104, 8429–8440 CrossRef CAS.
- A. McCulloch, M. L. Aucott, T. E. Graedel, G. Kleiman, P. M. Midgley and Y.-F. Li, J. Geophys. Res.: Atmos., 1999, 104, 8417–8427 CrossRef CAS.
- J. A. Thornton, J. P. Kercher, T. P. Riedel, N. L. Wagner, J. Cozic, J. S. Holloway, W. P. Dubé, G. M. Wolfe, P. K. Quinn, A. M. Middlebrook, B. Alexander and S. S. Brown, Nature, 2010, 464, 271–274 CrossRef CAS PubMed.
- G. McFiggans, R. A. Cox, J. C. Mossinger, B. J. Allan and J. M. C. Plane, J. Geophys. Res.: Atmos., 2002, 107, ACH10 CrossRef.
- M. Ammann, R. A. Cox, J. N. Crowley, M. E. Jenkin, A. Mellouki, M. J. Rossi, J. Troe and T. J. Wallington, Atmos. Chem. Phys., 2013, 13, 8045–8228 CrossRef.
- C. Prados-Roman, C. A. Cuevas, T. Hay, R. P. Fernandez, A. S. Mahajan, S.-J. Royer, M. Galí, R. Simó, J. Dachs, K. Großmann, D. E. Kinnison, J.-F. Lamarque and A. Saiz-Lopez, Atmos. Chem. Phys., 2015, 15, 583–593 Search PubMed.
- R. Volkamer, S. Baidar, T. Campos, S. Coburn, J. DiGangi, B. Dix, E. Eloranta, T. Koenig, B. Moley, I. Ortega, B. Pierce, M. Reeves, R. Sinreich, S.-Y. Wang, M. Zondlo and P. Romashkin, Atmos. Meas. Tech., 2015, 8, 623–687 Search PubMed.
- T. J. Bannan, A. M. Booth, A. Bacak, J. B. A. Muller, K. E. Leather, M. Le Breton, B. Jones, D. Young, H. Coe, J. Allan, S. Visser, J. G. Slowik, M. Furger, A. S. H. Prévôt, J. Lee, R. E. Dunmore, J. R. Hopkins, J. F. Hamilton, A. C. Lewis, L. K. Whalley, T. Sharp, D. Stone, D. E. Heard, Z. L. Fleming, R. Leigh, D. E. Shallcross and C. J. Percival, J. Geophys. Res.: Atmos., 2015, 120, 5638–5657 CAS.
- C. B. Faxon, J. K. Bean and L. H. Ruiz, Atmosphere, 2015, 6, 1487 CrossRef.
- L. H. Mielke, A. Furgeson and H. D. Osthoff, Environ. Sci. Technol., 2011, 45, 8889–8896 CrossRef CAS PubMed.
- T. P. Riedel, N. L. Wagner, W. P. Dubé, A. M. Middlebrook, C. J. Young, F. Öztürk, R. Bahreini, T. C. VandenBoer, D. E. Wolfe, E. J. Williams, J. M. Roberts, S. S. Brown and J. A. Thornton, J. Geophys. Res.: Atmos., 2013, 118, 8702–8715 CAS.
- T. P. Riedel, G. M. Wolfe, K. T. Danas, J. B. Gilman, W. C. Kuster, D. M. Bon, A. Vlasenko, S.-M. Li, E. J. Williams, B. M. Lerner, P. R. Veres, J. M. Roberts, J. S. Holloway, B. Lefer, S. S. Brown and J. A. Thornton, Atmos. Chem. Phys., 2014, 14, 3789–3800 Search PubMed.
- Y. J. Tham, C. Yan, L. Xue, Q. Zha, X. Wang and T. Wang, Chin. Sci. Bull., 2014, 59, 356–359 CrossRef CAS.
- D. Chen, Y. Wang, M. B. McElroy, K. He, R. M. Yantosca and P. Le Sager, Atmos. Chem. Phys., 2009, 9, 3825–3839 CrossRef CAS.
- Y. X. Wang, M. B. McElroy, D. J. Jacob and R. M. Yantosca, J. Geophys. Res.: Atmos., 2004, 109(D22), D22307 CrossRef.
- L. Zhang, D. J. Jacob, N. V. Downey, D. A. Wood, D. Blewitt, C. C. Carouge, A. van Donkelaar, D. B. Jones, L. T. Murray and Y. Wang, Atmos. Environ., 2011, 45, 6769–6776 CrossRef CAS.
- L. Zhang, D. J. Jacob, E. M. Knipping, N. Kumar, J. W. Munger, C. C. Carouge, A. van Donkelaar, Y. X. Wang and D. Chen, Atmos. Chem. Phys., 2012, 12, 4539–4554 CrossRef CAS.
- G. C. M. Vinken, K. F. Boersma, D. J. Jacob and E. W. Meijer, Atmos. Chem. Phys., 2011, 11, 11707–11722 CrossRef CAS.
- C. Reed, C. A. Brumby, L. R. Crilley, L. J. Kramer, W. J. Bloss, P. W. Seakins, J. D. Lee and L. J. Carpenter, Atmos. Meas. Tech., 2016, 9, 2483–2495 Search PubMed.
- G. Forster, W. Sturges, Z. Fleming, B. Bandy and S. Emeis, Tellus, Ser. B, 2012, 64, 1–18 CrossRef.
- C. Reed, M. J. Evans, P. Di Carlo, J. D. Lee and L. J. Carpenter, Atmos. Chem. Phys., 2016, 16, 4707–4724 CrossRef CAS.
- K. Clemitshaw, Crit. Rev. Environ. Sci. Technol., 2004, 34, 1–108 CrossRef CAS.
- F. C. Fehsenfeld, R. R. Dickerson, G. Hübler, W. T. Luke, L. J. Nunnermacker, E. J. Williams, J. M. Roberts, J. G. Calvert, C. M. Curran, A. C. Delany, C. S. Eubank, D. W. Fahey, A. Fried, B. W. Gandrud, A. O. Langford, P. C. Murphy, R. B. Norton, K. E. Pickering and B. A. Ridley, J. Geophys. Res.: Atmos., 1987, 92, 14710 CrossRef CAS.
- G. Villena, I. Bejan, R. Kurtenbach, P. Wiesen and J. Kleffmann, Atmos. Meas. Tech., 2012, 5, 149–159 CrossRef CAS.
- J. Williams, K. Baumann, J. M. Roberts, S. B. Bertman, R. B. Norton, F. C. Fehsenfeld, S. R. Springston, L. J. Nunnermacker, L. Newman, K. Olszyna, J. Meagher, B. Hartsell, E. Edgerton, J. R. Pearson and M. O. Rodgers, J. Geophys. Res.: Atmos., 1998, 103, 22261–22280 CrossRef.
- D. L. Slusher, L. G. Huey, D. J. Tanner, F. M. Flocke and J. M. Roberts, J. Geophys. Res., 2004, 109, D19315 CrossRef.
- J. Liao, H. Sihler, L. G. Huey, J. A. Neuman, D. J. Tanner, U. Friess, U. Platt, F. M. Flocke, J. J. Orlando, P. B. Shepson, H. J. Beine, A. J. Weinheimer, S. J. Sjostedt, J. B. Nowak, D. J. Knapp, R. M. Staebler, W. Zheng, R. Sander, S. R. Hall and K. Ullmann, J. Geophys. Res., 2011, 116, D00R02 CrossRef.
- R. D. Thaler, L. H. Mielke and H. D. Osthoff, Anal. Chem., 2011, 83, 2761–2766 CrossRef CAS PubMed.
- DEFRA, Department for Environment Food & Rural Affairs – Automatic Urban and Rural Network Data – downloaded via OpenAir.
- D. C. Carslaw and K. Ropkins, Environ. Model. Software, 2012, 27–28, 52–61 CrossRef.
- J. Mao, F. Paulot, D. J. Jacob, R. C. Cohen, J. D. Crounse, P. O. Wennberg, C. A. Keller, R. C. Hudman, M. P. Barkley and L. W. Horowitz, J. Geophys. Res.: Atmos., 2013, 118, 11256–11268 CAS.
- T. D. Fairlie, D. J. Jacob, J. E. Dibb, B. Alexander, M. A. Avery, A. van Donkelaar and L. Zhang, Atmos. Chem. Phys., 2010, 10, 3999–4012 CrossRef CAS.
- L. Jaeglé, P. K. Quinn, T. S. Bates, B. Alexander and J. T. Lin, Atmos. Chem. Phys., 2011, 11, 3137–3157 Search PubMed.
- S. D. Eastham, D. K. Weisenstein and S. R. H. Barrett, Atmos. Environ., 2014, 89, 52–63 CrossRef CAS.
- J. M. Roberts, H. D. Osthoff, S. S. Brown, A. R. Ravishankara, D. Coffman, P. Quinn and T. Bates, Geophys. Res. Lett., 2009, 36, L20808 CrossRef.
- A. B. Guenther, X. Jiang, C. L. Heald, T. Sakulyanontvittaya, T. Duhl, L. K. Emmons and X. Wang, Geosci. Model Dev., 2012, 5, 1471–1492 CrossRef CAS.
- G. R. van der Werf, J. T. Randerson, L. Giglio, G. J. Collatz, M. Mu, P. S. Kasibhatla, D. C. Morton, R. S. DeFries, Y. Jin and T. T. van Leeuwen, Atmos. Chem. Phys., 2010, 10, 11707–11735 CAS.
- R. Yevich and J. A. Logan, Global Biogeochem. Cycles, 2003, 17(4), 1095 CrossRef.
- T. C. Bond, E. Bhardwaj, R. Dong, R. Jogani, S. Jung, C. Roden, D. G. Streets and N. M. Trautmann, Global Biogeochem. Cycles, 2007, 21(2), GB2018 CrossRef.
- L. T. Murray, D. J. Jacob, J. A. Logan, R. C. Hudman and W. J. Koshak, J. Geophys. Res.: Atmos., 2012, 117, D20307 CrossRef.
- R. C. Hudman, N. E. Moore, A. K. Mebust, R. V. Martin, A. R. Russell, L. C. Valin and R. C. Cohen, Atmos. Chem. Phys., 2012, 12, 7779–7795 CrossRef CAS.
- M. Stettler, S. Eastham and S. Barrett, Atmos. Environ., 2011, 45, 5415–5424 CrossRef CAS.
- V. Vestreng, L. Ntziachristos, A. Semb, S. Reis, I. S. A. Isaksen and L. Tarrasón, Atmos. Chem. Phys., 2009, 9, 1503–1520 CrossRef CAS.
- V. Vestreng, G. Myhre, H. Fagerli, S. Reis and L. Tarrasón, Atmos. Chem. Phys., 2007, 7, 3663–3681 CrossRef CAS.
- R. E. Dunmore, L. K. Whalley, T. Sherwen, M. J. Evans, D. E. Heard, J. R. Hopkins, J. D. Lee, A. C. Lewis, R. T. Lidster, A. R. Rickard and J. F. Hamilton, Faraday Discuss., 2016, 189, 105–120 RSC.
- C. Ordóñez, J. F. Lamarque, S. Tilmes, D. E. Kinnison, E. L. Atlas, D. R. Blake, G. S. Santos, G. Brasseur and A. Saiz-Lopez, Atmos. Chem. Phys., 2012, 12, 1423–1447 Search PubMed.
- European Topic Centre on Air Pollution and Climate Change: AirBase – the European air quality database, European Environment Agency, http://www.eea.europa.eu/data-and-maps/data/ds_resolveuid/%0A3c756b2021754f6bba40447397d67fdf, date accessed: 02/12/2016.
- K. L. Furneaux, L. K. Whalley, D. E. Heard, H. M. Atkinson, W. J. Bloss, M. J. Flynn, M. W. Gallagher, T. Ingham, L. Kramer, J. D. Lee, R. Leigh, G. B. McFiggans, A. S. Mahajan, P. S. Monks, H. Oetjen, J. M. C. Plane and J. D. Whitehead, Atmos. Chem. Phys., 2010, 10, 3645–3663 CrossRef CAS.
- B. J. Allan, G. McFiggans, J. M. C. Plane and H. Coe, J. Geophys. Res.: Atmos., 2000, 105, 14363–14369 CrossRef CAS.
- R. Commane, K. Seitz, C. S. E. Bale, W. J. Bloss, J. Buxmann, T. Ingham, U. Platt, D. Pöhler and D. E. Heard, Atmos. Chem. Phys., 2011, 11, 6721–6733 CrossRef CAS.
- M. Bitter, S. M. Ball, I. M. Povey and R. L. Jones, Atmos. Chem. Phys., 2005, 5, 2547–2560 CrossRef CAS.
- H. Oetjen, PhD thesis, University of Bremen, Germany, 2009.
- A. Saiz-Lopez and J. M. C. Plane, Geophys. Res. Lett., 2004, 31, L04112 Search PubMed.
- R. J. Huang, K. Seitz, J. Buxmann, D. Pöhler, K. E. Hornsby, L. J. Carpenter, U. Platt and T. Hoffmann, Atmos. Chem. Phys., 2010, 10, 4823–4833 CrossRef CAS.
- A. Saiz-Lopez, J. M. C. Plane and J. A. Shillito, Geophys. Res. Lett., 2004, 31, L03111 Search PubMed.
- H. Leser, G. Hönninger and U. Platt, Geophys. Res. Lett., 2003, 30, 1537 CrossRef.
- M. J. Evans and D. J. Jacob, Geophys. Res. Lett., 2005, 32, L09813 CrossRef.
- G. J. Phillips, M. J. Tang, J. Thieser, B. Brickwedde, G. Schuster, B. Bohn, J. Lelieveld and J. N. Crowley, Geophys. Res. Lett., 2012, 39, L10811 Search PubMed.
- I. Allegrini, F. Santis, A. Febo, A. Liberti and M. Possanzini, Physico-Chemical Behaviour of Atmospheric Pollutants, Springer, Netherlands, 1984, pp. 12–19 Search PubMed.
- J.-W. Erisman, A. W. Vermetten, W. A. Asman, A. Waijers-Ijpelaan and J. Slanina, Atmos. Environ., 1988, 22, 1153–1160 CrossRef CAS.
- M. P. Keuken, R. P. Otjes and J. Slanina, in Simultaneously Sampling of NH3, HNO3, HNO2, HCl. SO2 And H2O2 in Ambient Air by A Wet Annular Denuder System, ed. G. Restelli and G. Angeletti, Springer, Netherlands, Dordrecht, 1990, pp. 92–97 Search PubMed.
- P. Marché, A. Barbe, C. Secroun, J. Corr and P. Jouve, Geophys. Res. Lett., 1980, 7, 869–872 CrossRef.
- P. Matusca, B. Schwarz and K. Bächmann, Atmos. Environ., 1984, 18, 1667–1675 CrossRef CAS.
- N. Dimmock and G. Marshall, Anal. Chim. Acta, 1987, 202, 49–59 CrossRef CAS.
- W. T. Sturges and R. M. Harrison, Atmos. Environ., 1989, 23, 1987–1996 CrossRef CAS.
- R. M. Harrison and A. Allen, Atmos. Environ., Part A, 1990, 24, 369–376 CrossRef.
- C. Johnson, L. Sigg and J. Zobrist, Atmos. Environ., 1987, 21, 2365–2374 CrossRef CAS.
- G. Sarwar, D. Kang, K. Foley, D. Schwede, B. Gantt and R. Mathur, Atmos. Environ., 2016, 141, 255–262 CrossRef CAS.
- J.-P. Tuovinen, Environ. Pollut., 2000, 109, 361–372 CrossRef CAS PubMed.
- M. S. Long, W. C. Keene, R. C. Easter, R. Sander, X. Liu, A. Kerkweg and D. Erickson, Atmos. Chem. Phys., 2014, 14, 3397–3425 Search PubMed.
- R. Sommariva and R. von Glasow, Environ. Sci. Technol., 2012, 46, 10429–10437 CrossRef CAS PubMed.
- Q. Chen, L. Geng, J. A. Schmidt, Z. Xie, H. Kang, J. Dachs, J. Cole-Dai, A. J. Schauer, M. G. Camp and B. Alexander, Atmos. Chem. Phys., 2016, 16, 11433–11450 CAS.
Footnotes |
| † Electronic supplementary information (ESI) available. See DOI: 10.1039/c7fd00026j |
| ‡ Now at Facility for Airborne Atmospheric Measurements (FAAM). |
| This journal is © The Royal Society of Chemistry 2017 |