 Open Access Article
 This Open Access Article is licensed under a
 Creative Commons Attribution 3.0 Unported Licence
An assessment of hydrocarbon species in the methanol-to-hydrocarbon reaction over a ZSM-5 catalyst
Suwardiyanto
a,
Russell F.
Howe
ab,
Emma K.
Gibson
b,
C. Richard A.
Catlow
bcd,
Ali
Hameed
e,
James
McGregor
 be,
Paul
Collier
f,
Stewart F.
Parker
bg and
David
Lennon
*bh
be,
Paul
Collier
f,
Stewart F.
Parker
bg and
David
Lennon
*bh
aDepartment of Chemistry, University of Aberdeen, Aberdeen, AB24 3UE, UK
bUK Catalysis Hub, Research Complex at Harwell, STFC Rutherford Appleton Laboratory, Chilton, Oxon, OX11 0FA, UK
cDepartment of Chemistry, University College London, 20 Gordon St., London WC1 HOAJ, UK
dCardiff Catalysis Institute, School of Chemistry, Cardiff University, CF10 3AT, UK
eDepartment of Chemical and Biological Engineering, University of Sheffield, Sheffield, S1 3JD, UK
fJohnson Matthey Technology Centre, Blounts Court, Sonning Common, Reading, RG4 9NH, UK
gISIS Facility, STFC Rutherford Appleton Laboratory, Chilton, Oxon, OX11 0QX, UK
hSchool of Chemistry, University of Glasgow, Joseph Black Building, Glasgow, G12 8QQ, UK. E-mail: David.Lennon@glasgow.ac.uk
First published on 14th February 2017
Abstract
A ZSM-5 catalyst is examined in relation to the methanol-to-hydrocarbon (MTH) reaction as a function of reaction temperature and time-on-stream. The reaction profile is characterised using in-line mass spectrometry. Furthermore, the material contained within a catch-pot downstream from the reactor is analysed using gas chromatography-mass spectrometry. For a fixed methanol feed, reaction conditions are selected to define various stages of the reaction coordinate: (i) initial methanol adsorption at a sub-optimum reaction temperature (1 h at 200 °C); (ii) initial stages of reaction at an optimised reaction temperature (1 h at 350 °C); (iii) steady-state operation at an optimised reaction temperature (3 days at 350 °C); and (iv) accelerated ageing (3 days at 400 °C). Post-reaction, the catalyst samples are analysed ex situ by a combination of temperature-programmed oxidation (TPO) and spectroscopically by electron paramagnetic resonance (EPR), diffuse-reflectance infrared and inelastic neutron scattering (INS) spectroscopies. The TPO measurements provide an indication of the degree of ‘coking’ experienced by each sample. The EPR measurements detect aromatic radical cations. The IR and INS measurements reveal the presence of retained hydrocarbonaceous species, the nature of which are discussed in terms of the well-developed ‘hydrocarbon pool’ mechanism. This combination of experimental evidence, uniquely applied to this reaction system, establishes the importance of retained hydrocarbonaceous species in effecting the product distribution of this economically relevant reaction system.
1. Introduction
As oil reserves continue to diminish, the methanol to olefin (MTO) reaction and related methanol to gasoline (MTG) reactions over zeolitic catalysts such as ZSM-5 are anticipated to play an increasing role in the landscape of large-scale chemical and fuel manufacturing operations. Although the original feedstock for these processes is methanol derived from natural gas, future feedstocks may also include methanol derived from coal and/or biomass. Looking further ahead, renewable sources such as the direct oxidation of methane produced by aerobic digestion could additionally contribute to and sustain the viability of this intricate reaction system.Following the industrial innovation in methanol-to-hydrocarbon (MTH) chemistry that commenced in the 1980s, a vast amount of literature has subsequently materialised, examining all aspects of the associated process chemistry. A representative sample of the contemporary literature follows. Hemelsoet et al. looked at the MTO reaction over ZSM-5 and SAPO-34, concentrating on mechanistic aspects of the process; in particular, they examined the well-established concept of a hydrocarbon pool via a combination of kinetic measurements supplemented by theoretical simulations.1 C. Wang et al. have also concentrated on the hydrocarbon pool chemistry connected with the ZSM-5/MTO reaction, using solid-state NMR spectroscopy to highlight the role of a variety of polymethylbenzenes as reactive intermediates.2 S. Wang et al. have used DFT calculations to probe the MTO process over a range of zeolites and report that the interaction between the proton transfer reagent (methanol or water) and the zeolitic framework are key factors in the olefin elimination step.3 Sun et al. have addressed issues connected with the two distinct catalytic cycles that operate for MTO chemistry over ZSM-5; namely, an olefin homologation/cracking route and the formation of the afore-mentioned hydrocarbon pool.4Via a detailed kinetic analysis, these works show the importance of a hydrogen transfer pathway involving chemisorbed methanol intermediates, which has consequences for sustaining catalyst lifetime under MTO process conditions.4 More recently, Olsbye and co-workers have comprehensively reviewed matters connected with the MTH process over protonated zeotype catalysts.5 This includes an appreciation that the autocatalytic feature of the process involves a role for hydrocarbons as active species but, additionally, as deactivating species. They explicitly consider the topic of catalyst deactivation by (hydro-)carbon residues, which leads on to the concept of coking. The time evolution of the (hydro-)carbon deposits at the micro- and meso-scales is also considered.5 Such investigations employ an armoury of analytical techniques to interrogate the range of active species associated with the product formation pathways as well as with the catalyst deactivation pathways. In addition to the conventional micro-reactor technology, these include probes such as solid-state NMR spectroscopy, infrared spectroscopy, electron paramagnetic resonance (EPR) spectroscopy, thermogravimetric analysis, temperature-programmed oxidation (TPO), Raman scattering, confocal fluorescence microscopy and UV-visible micro-spectroscopy.5
One technique that, up until now, has been little used to examine MTO/MTH reactions over zeolites is inelastic neutron scattering (INS). Increasingly, INS is being applied to investigate heterogeneous catalysts used in a variety of economically relevant reaction systems, such as methyl chloride synthesis,6 methanol synthesis,7 methane reforming,8 Fischer–Tropsch synthesis,9,10etc. The application of inelastic neutron spectrometers to investigate issues in molecular spectroscopy, including aspects of heterogeneous catalysis, has been reviewed by Parker and co-workers.11
In 2016 O'Malley et al. used a variety of neutron scattering methods, including INS, to investigate room temperature methoxylation in zeolites.12 In the same year, Howe et al. reported a preliminary investigation applying INS to examine the methanol-to-gasoline reaction over a ZSM-5 catalyst.13 This latter work demonstrated how INS could be used to obtain the vibrational spectrum of hydrocarbonaceous entities retained by the catalyst during the MTH transformation process at elevated reaction temperatures. Compared to infrared spectroscopy, INS conveys several advantages. Namely, (i) a wide range of vibrational frequencies (600–4500 cm−1) is accessible without obscuration from zeolite framework modes, (ii) the method can be applied to technical catalysts with no requirement for sample preparation and (iii) no restriction on the extent of coke formation is evident. This latter attribute in particular suggests that the methodology adopted by Howe et al. could be used to simultaneously inspect several facets of the MTH process; specifically, the formation of higher molecular weight hydrocarbons and coke precursors.13
Recognising that INS can supplement the already wide range of investigations on MTH chemistry over zeolitic materials, the present study extends the preliminary ZSM-5/MTH investigation of Howe and co-workers13 by using INS to discover if the hydrocarbonaceous species retained by the zeolite is sensitive to reaction conditions. To this end, and for a fixed methanol feed, the following four sets of reaction conditions are selected to define various stages of the reaction coordinate: (i) initial methanol adsorption at a sub-optimum reaction temperature (1 h at 200 °C), (ii) initial stages of reaction at an optimised reaction temperature (1 h at 350 °C), (iii) steady-state operation at an optimised reaction temperature (3 days at 350 °C) and (iii) accelerated ageing (3 days at 400 °C). INS spectra are presented for catalyst samples that have experienced each of these four reaction treatments. In order to contextualise the INS measurements, a multi-technique approach is adopted. Firstly, reaction profiles are characterised by in-line mass spectrometry. Further, products contained within a ‘catch-pot’ downstream from the reactor are analysed by gas chromatography-mass spectrometry. Post-reaction, the catalyst samples are analysed ex situ by a combination of temperature-programmed oxidation (TPO), electron paramagnetic resonance (EPR) spectroscopy and diffuse-reflectance infrared Fourier transform spectroscopy (DRIFTS). These additional measurements facilitate comparisons to literature work as highlighted by, amongst others, Olsbye and co-workers.5 This is the first time that this combination of experimental techniques have been applied to the methanol to hydrocarbon reaction over a ZSM-5 catalyst. In order to ensure a balance between sensitivity and resolution,11 two direct geometry INS spectrometers are employed to better discern the nature of the hydrocarbonaceous material retained at the catalyst surface.
2. Experimental
2.1 Catalyst characterisation
The ZSM-5 catalyst was a commercial grade catalyst supplied by Johnson Matthey (Intercat IC16926, lot no. 16296.02261). As received, it possessed a Si![[thin space (1/6-em)]](https://www.rsc.org/images/entities/char_2009.gif) :Al ratio of ∼30, although it also contained some residual template (tetrapropyl ammonium bromide) at ∼0.7 wt%. The BET surface area was 371 m2 g−1. Chemical analysis using XRF revealed the following composition (wt%): SiO2 (95), Al2O3 (4.96), Fe2O3 (0.03), TiO2 (0.02), CaO (0), Na2O (0), P2O5 (0). In order to remove the residual template, the catalyst was calcined in air at 500 °C for 12 h prior to use. Inspection of the sample post-calcination using infrared spectroscopy showed complete removal of the template material. It is noted that this ZSM-5 catalyst differs from the material examined by Howe and co-workers in their preliminary report13 and that used by O'Malley et al.12
:Al ratio of ∼30, although it also contained some residual template (tetrapropyl ammonium bromide) at ∼0.7 wt%. The BET surface area was 371 m2 g−1. Chemical analysis using XRF revealed the following composition (wt%): SiO2 (95), Al2O3 (4.96), Fe2O3 (0.03), TiO2 (0.02), CaO (0), Na2O (0), P2O5 (0). In order to remove the residual template, the catalyst was calcined in air at 500 °C for 12 h prior to use. Inspection of the sample post-calcination using infrared spectroscopy showed complete removal of the template material. It is noted that this ZSM-5 catalyst differs from the material examined by Howe and co-workers in their preliminary report13 and that used by O'Malley et al.12
2.2 Reaction testing
Reaction testing was performed on a catalyst test system designed to activate and react heterogeneous catalyst samples of the sample sizes typically required for INS measurement (10–20 g). The gas manifold, control system and heating arrangements are comprehensively described elsewhere.14 A new design of stainless steel reactor was used to contain the catalyst samples, Fig. 1. A photograph of the reactor is presented on the left hand side of Fig. 1, whilst the right hand side shows a schematic drawing of the reactor. The internal diameter of the reactor is 35 mm and its length is 60 mm. For a comparable charge, this arrangement minimises the catalyst bed length with respect to previously used designs,15 thereby minimising the possibility of concentration gradients across the length of the bed and ensuring greater homogeneity of sample composition throughout the sample volume.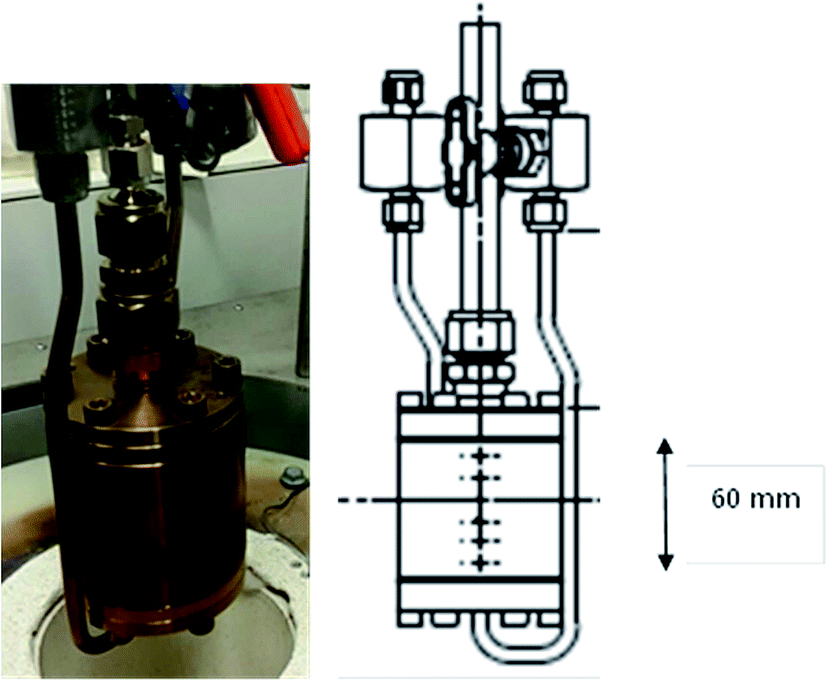 | ||
| Fig. 1 Photograph (left) and schematic (right) of the stainless steel reactor. | ||
The reactor was charged with the calcined catalyst powder (∼12.0 g) and dried using the following procedure: whilst continually maintaining a flow of helium over the catalyst (1000 sccm, CK Gas, >99.0%), the sample was heated to 350 °C at a heating rate of 10 °C min−1 and then maintained at that temperature for 2 h. The heating was stopped and the sample was allowed to cool to ambient temperature in a continuous flow of He. The reactor was then isolated and transferred to an argon-filled glove box (MBraun UniLab MB-20-G, [H2O] < 1 ppm, [O2] < 2 ppm) for loading of the catalyst into an aluminium INS cell that is sealed via an indium wire gasket.14 The sample was then transferred to the INS spectrometer for spectral acquisition. All INS measurements were undertaken at ∼20 K. The resulting spectrum provided the vibrational spectrum of the clean, activated catalyst.
For samples to be reacted with methanol at different temperatures and for varying times-on-stream, a clean activated catalyst sample was prepared in the same manner as described above. However, the dehydration stage was followed by dosing of the catalyst with methanol vapour by means of a bubbler arrangement whilst the catalyst was maintained at a specified reaction temperature (200, 350 or 400 °C) for a specified period of time (1 h or 3 days). Methanol (Aldrich, 99.9%) was entrained in flowing helium (150 ml min−1) and the methanol exposure corresponded to a feed rate of 0.2 g methanol g(cat)−1 h−1. The eluting stream was analysed using in-line mass spectrometry (Hiden Analytical, HPR-20), with the spectrometer connected to the reactor exit line via a differentially-pumped, heated quartz capillary. Relative intensities of various masses were normalized against the signal of the helium carrier gas. The apparatus is equipped with a ‘catch-pot’ downstream of the catalyst that collected liquid products. Material collected there was subsequently analysed using GC-MS (Shimadzu QP2010SE). The column employed was a DB-1MS capillary column (60 m length, 0.25 mm diameter, 0.25 μm thickness). The analytical conditions were as follows: initial oven temperature was 40 °C, held for 2 min, followed by heating at 10 °C min−1 to 150 °C, and then held for 3 min. The injector and detector temperatures were 250 °C.
After the designated time-on-stream, the methanol flow and heating were stopped, and the reactor cooled whilst maintaining the helium flow. The reactor was then isolated and transferred to the glovebox, where the catalyst was loaded into an Al INS cell using the procedure outlined above. During extraction of the reacted catalyst from the stainless steel reactor, a proportion of the sample was set aside for subsequent ex situ analysis. The samples for temperature-programmed oxidation and infrared spectroscopic measurements were stored in glass vials under Ar atmosphere, whilst samples for subsequent electron paramagnetic analysis were transferred to quartz EPR tubes and sealed via a Youngs tap (PTFE seal) before removal from the glove box.
2.3 Inelastic neutron scattering
Two spectrometers were utilised in this study. Due to the relative low quantities of hydrogenous species retained by the catalyst as evidenced by previous measurements,13 the MERLIN spectrometer was used to study all the prepared catalyst samples. This is a direct geometry inelastic spectrometer that affords superior sensitivity compared to other instruments in the Target Station-1 suite of the ISIS Facility of the Rutherford Appleton Laboratory.16 To maximise instrument sensitivity, the low resolution S-chopper package was utilised with incident energies (and frequencies) of 5244 cm−1 (600 Hz), 2017 cm−1 (400 Hz) and 1210 cm−1 (300 Hz).Certain samples were selected to be run on the MAPS spectrometer, which possesses superior resolution compared to MERLIN.16 Given the complexity of the molecules associated with surface reactions in the MTH process,5 favourable resolution is required to discern individual molecular components. Here, the higher resolution A-chopper package was used with incident energies (and frequencies) of 5244 cm−1 (600 Hz), 2017 cm−1 (400 Hz) and 807 cm−1 (200 Hz). All INS spectra displayed (Fig. 9–13) are integrated over the momentum transfer range 0 ≤ Q ≤ 12 Å−1.10
2.4 Other analytical procedures
Temperature-programmed oxidation (TPO) was conducted on the catalysts post-reaction using a Micromeritics Chemisorb 2720 instrument equipped with a thermal conductivity detector. Upon removal of the sample that was contained within a glass vial from the glove box, the sealed vial was retained for approximately 3 weeks before the TPO measurements. Approximately 5 mg of catalyst was used in each case. The sample was first purged with helium (25 ml min−1) before being heated in 5% O2/He (25 ml min−1) at a rate of 10 °C min−1 to a final temperature of 800 °C. This final temperature was then maintained for 30 min to ensure complete combustion of any carbonaceous species.EPR spectra were measured with a JEOL FA200 spectrometer operating at 9.1 GHz at room temperature or 80 K with an Oxford Instruments ESR900 cryostat using liquid nitrogen. Spectra were recorded at low power (0.1 mW) and modulation (0.1 mT) to avoid line broadening. Methanol adsorption experiments were conducted in EPR cells fitted with high vacuum stopcocks. The zeolite was dehydrated at 350 °C on a turbo-pumped vacuum line (base pressure 10−6 mbar), exposed to methanol vapour (100 mbar) at room temperature, then heated to various temperatures. Concentrations of radicals were estimated by comparing doubly integrated signal intensities with that of a weak pitch standard (Bruker, 1013 spins per cm). Simulation of the spectrum was done using the Symphonia (Bruker) software.
Diffuse Reflectance Infrared Fourier Transform Spectroscopy (DRIFTS) spectra were collected with an Agilent Carey 680 FTIR spectrometer, taking 64 scans with a resolution of 4 cm−1 using a liquid nitrogen cooled MCT detector. Upon removal of the sample sealed within a glass vial from the glove box, the vial was retained for approximately 1 day before the DRIFTS measurements were undertaken. Transfer of the used catalyst samples to the DRIFTS apparatus was performed in the presence of a continuous flow of helium. Spectra were collected at every 5 °C whilst the sample was ramped to 375 °C (10 °C min−1) under a 30 ml min−1 flow of helium.
3. Results and discussion
Five samples will be considered in this study. Table 1 defines sample history in terms of exposure to methanol at the standard rate of 0.2 g methanol g(cat)−1 h−1. Sample 1 represents the clean, activated catalyst; this is used as a background in some of the INS measurements. Schulz has shown that there exists a marked temperature dependence in ZSM-5/methanol reactivity, with reaction below 300 °C leading to a rapid loss of activity and significant hydrocarbon deposition compared to tests employed at high reaction temperatures.17 Sample 2 is therefore intended to mimic this phase of reactivity. A reaction temperature of 350 °C is selected as being a representative reaction temperature. Sample 3 considers the case for short reaction times, whilst sample 4 represents longer reaction times. Coking is a fundamental component of MTH chemistry over ZSM-5,5 and the elevated reaction temperature of 400 °C (sample 5) is thought to expose the catalyst to a degree of accelerated ageing. Collectively, this selection of samples provides information on whether the hydrocarbonaceous retained material reported in the preliminary INS study13 is sensitive to reaction conditions.| Sample no. | Sample treatment | Reaction temperature/°C | Duration |
|---|---|---|---|
| 1 | ZSM5 + He | 350 | 1 h |
| 2 | ZSM5 + methanol | 200 | 1 h |
| 3 | ZSM5 + methanol | 350 | 1 h |
| 4 | ZSM5 + methanol | 350 | 3 d |
| 5 | ZSM5 + methanol | 400 | 3 d |
3.1 In-line mass spectrometry and catch-pot analysis
Fig. 2 presents the reaction profile for sample 3, for various stages of the 3 day duration of sustained methanol conversion at 350 °C. Frame (a) corresponds to the initial catalyst conditioning period, frame (b) represents 1 day on-stream, frame (c) 2 days on stream and frame (d) 3 days on-stream. The methanol consumption is approximately constant throughout the whole reaction sequence, although a slight increase in conversion is observed in the data for the third day compared to that observed during the first two days of operation. Whereas the product distribution is broadly consistent after day 1, dramatic swings in product concentrations are observed during the initial period of reaction. Most important is the rise and subsequent fall of dimethyl ether over the ∼2 h period of time presented in Fig. 2(a). It rises almost immediately on introduction of methanol, remains roughly constant for less than an hour, thereafter it drops to a low level that is subsequently maintained for the following 3 days. This profile is indicative of dimethyl ether (DME) being an intermediate species, most likely formed from the dimerization of chemisorbed methoxy groups.18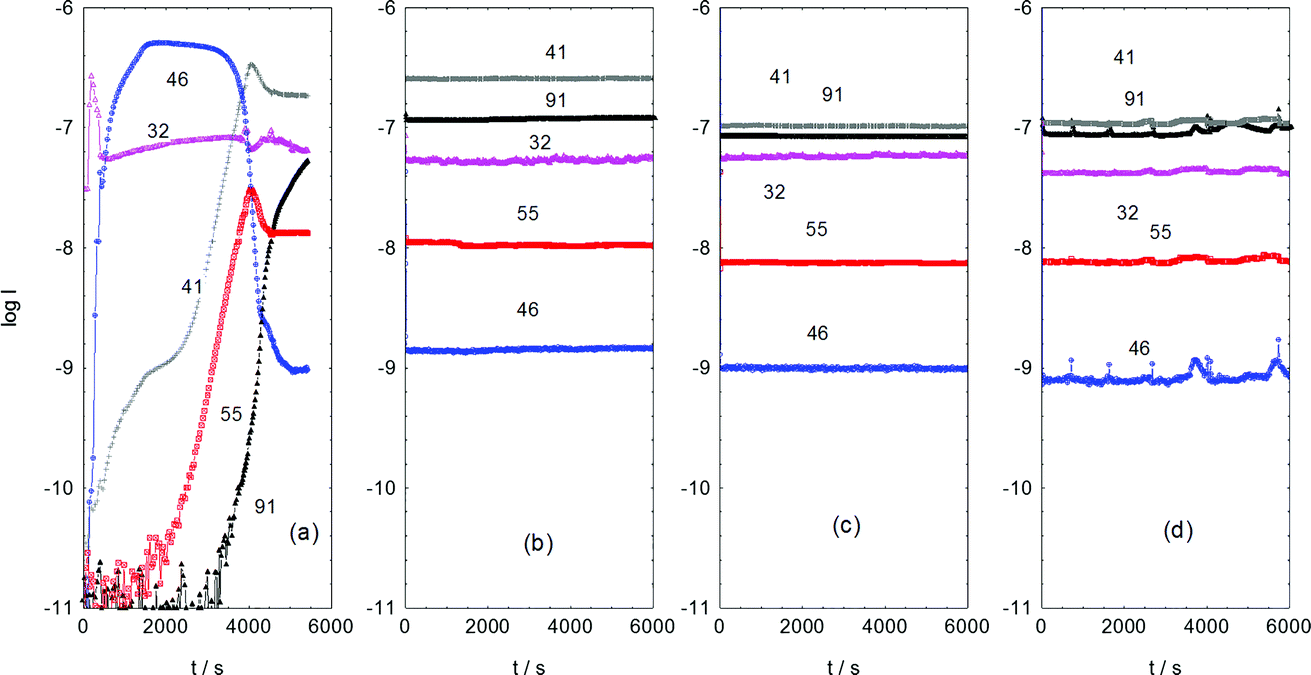 | ||
| Fig. 2 Mass spectral analysis of the effluent from the reactor at 350 °C over a 3 day period of continuous reaction as a function of time on stream: (a) initial introduction of methanol; (b) after 1 day on stream; (c) after 2 days on stream; and (d) after 3 days on stream. Each frame displays the mass spectrometer output over a 1.7 h period. The numbers on the plots correspond to atomic mass numbers: 91 amu corresponds to the tropylium ion that signifies the presence of aromatic species; 55 amu corresponds to butene; 46 amu corresponds to dimethyl ether; 41 amu corresponds to propene; and 32 amu corresponds to methanol. | ||
During the period when DME production is greatest, a rapid increase in propene production is observed that is subsequently sustained throughout the 3 day sequence. In contrast, as DME formation falls, butene production increases and then achieves a nearly constant rate of formation thereafter. At the point where the DME signal starts to significantly decline, the aromatic signal, as signified by the tropylium ion, suddenly rises from baseline levels. This promptly levels out and achieves sustained production. At 3 days, which represents steady-state operation, propene and aromatic entities constitute the major products. The concomitant fall in DME production and rise in aromatic formation suggests that DME could be a precursor to aromatic products. The coincidence of aromatics and olefins in the product stream is consistent with well documented MTH chemistry.4,5 It is noted that for all sets of reactions investigated here (Table 1, samples 2–5), mass spectrometric analysis of the product stream showed no obvious evidence of deactivation during the course of the reactions.
For the catch-pot analysis, two distinct phases were observed: an aqueous phase and an organic phase. The aqueous phase was essentially entirely water. Fig. 3 presents the chromatogram for the organic phase and shows a number of substituted aromatics to be present. The simplest aromatic compound observed, and in relatively low quantities, was toluene. The importance of methylation as a surface mediated reaction is demonstrated by the presence of dimethylbenzenes, trimethylbenzenes and tetramethylbenzenes in relatively significant quantities. However, in addition, although to a lesser degree, polycyclic aromatic hydrocarbons are also produced, as evidenced by the presence of a number of substituted naphthalenes. No higher molecular weight fractions were detected in the liquor. As noted above, when commenting on vapour phase products detectable by mass spectrometry, MTH activity corresponds to the formation of olefins and aromatic species via parallel, coincident pathways.4,5 The main thrust of the present investigation is the application of INS to obtain new information on the nature of the hydrocarbon pool that is frequently connected to the MTH process (see Section 3.4). Although the product analysis here is qualitative, it is informative in terms of identifying relevant trends within the product distribution. A more detailed quantitative study of the different aromatic compounds would be helpful for refining mechanistic insight but this was beyond the scope of the present study.
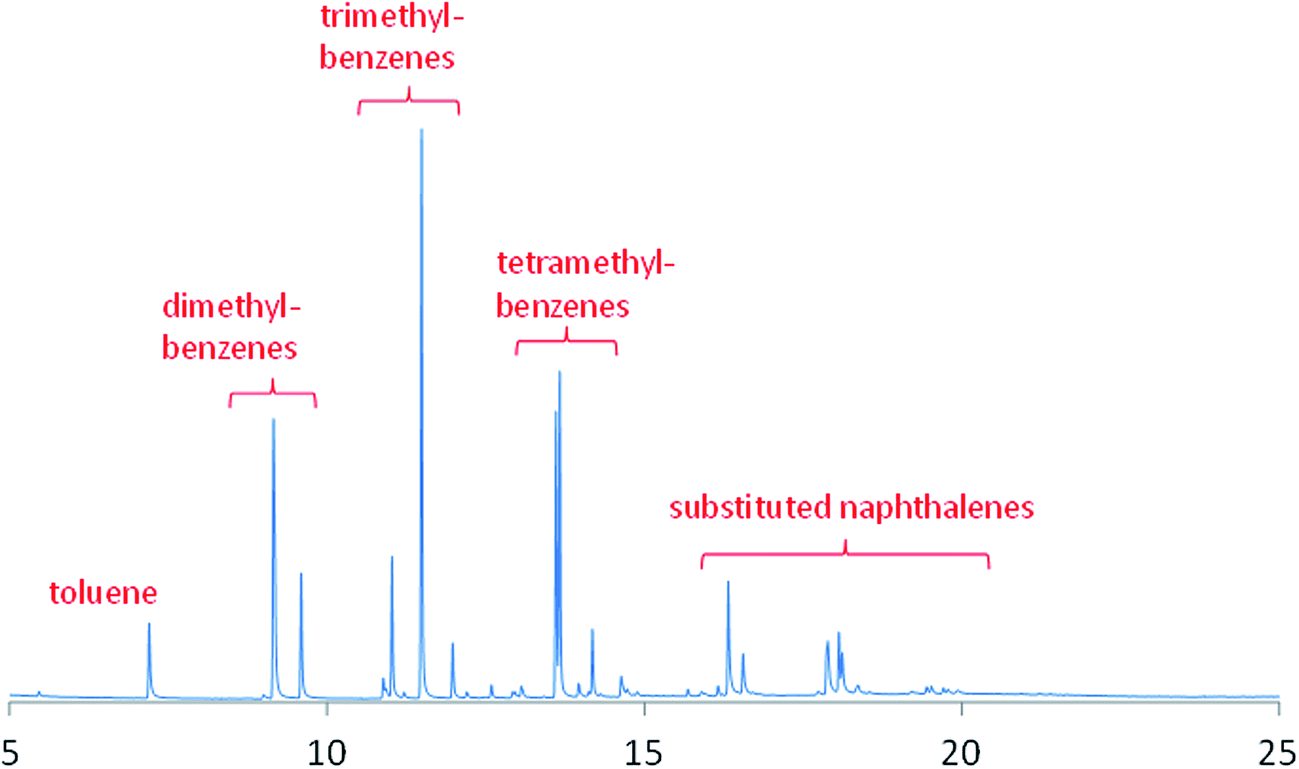 | ||
| Fig. 3 Chromatograph for the organic phase taken from the catch-pot on steady-state operation at 350 °C. | ||
3.2 Temperature-programmed oxidation (TPO)
The post-reaction TPO profiles for samples 2–5 are shown in Fig. 4. Reaction with methanol at a temperature below the idealised reaction temperature of 350 °C, i.e. 200 °C, (Fig. 4(a)) shows little carbon deposition to have occurred over the 1 h reaction period. A weak, relatively narrow signal with a peak maximum at about 280 °C is seen. This is suggestive of homogeneous hydrocarbon species that are weakly bound to the catalyst surface. Increasing the temperature to 350 °C for 1 h causes a modest increase in carbon retention with desorption occurring over a wider temperature range, viz. 280–620 °C, with a peak maximum at ∼590 °C. This indicates that the enhanced reaction temperature has induced greater carbonaceous retention and that this carbon is more strongly bound to the catalyst, and is hence likely to be more ordered, than was the case for the lower temperature reaction. Table 2 presents the quantities of retained carbon for each sample.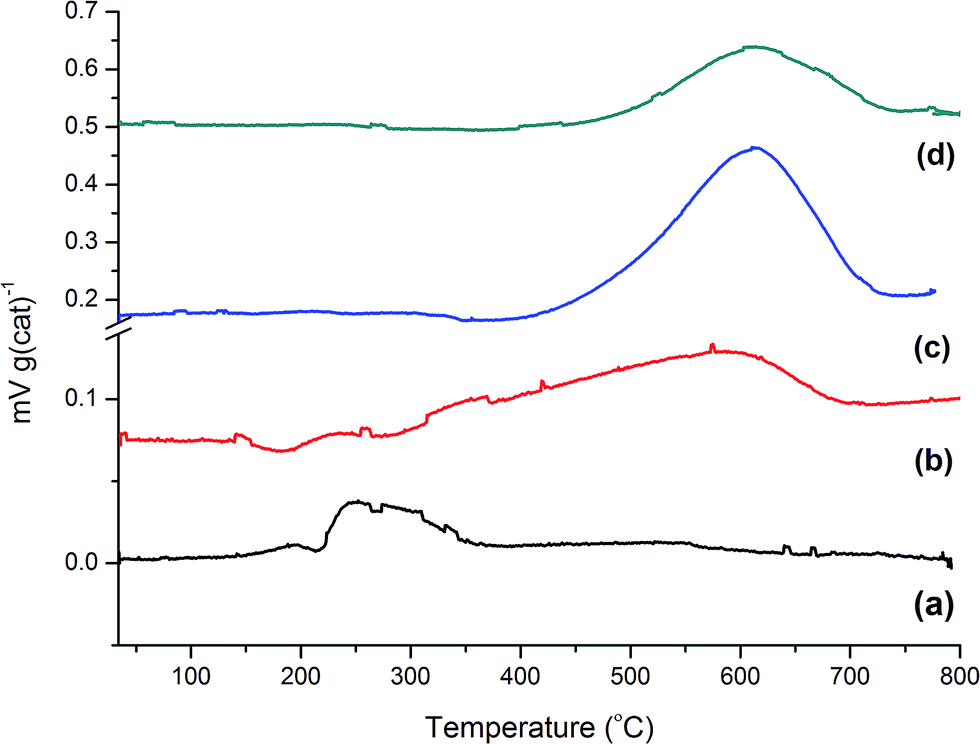 | ||
| Fig. 4 Temperature-programmed oxidation profiles for the ZSM-5 catalyst post reaction: (a) 1 h at 200 °C; (b) 1 h at 350 °C; (c) 3 days at 350 °C; and (d) 3 days at 400 °C. | ||
| Sample no. | Sample treatment | C/wt% |
|---|---|---|
| 2 | ZSM5 + methanol, 200 °C, 1 h | 2.7 |
| 3 | ZSM5 + methanol, 350 °C, 1 h | 2.6 |
| 4 | ZSM5 + methanol, 350 °C, 3 d | 7.1 |
| 5 | ZSM5 + methanol, 400 °C, 3 d | 4.9 |
It appears that the processes contributing to Fig. 4(b) are cumulative, as an extended run time of 3 days leads to a dramatic increase in the quantity of retained carbon, Fig. 4(c). The profile is less skewed than that observed in Fig. 4(b) and displays a distinct maximum at 610 °C. The even distribution of the peak at this Tmax indicates the retained material to be reasonably well ordered and strongly bound to the catalyst. Fig. 4(d) shows the TPO plot for the aged sample (3 days at 400 °C). Although the peak maximum coincides with Fig. 4(c), it is noticeably smaller in intensity. Intuitively, this seems incorrect, as it indicates a lower degree of retention of strongly bound carbonaceous material, where one might have expected coke forming reactions to dominate. However, it is noted that Schulz has previously reported a similar trend for ZSM-5/methanol, where lower coke deposition was seen at 380 °C compared to that observed at 290 °C.17 This pattern also meshes with the comments of Sun et al., who highlight how reaction temperature can disproportionally influence the production rates of the two product streams: the aromatics based cycle dominates at low reaction temperatures but the olefin based cycle is favoured at higher reaction temperatures.4 With respect to the disproportionate intensities observed in Fig. 4(c) and (d), it is thought that the higher operational temperature has disfavoured a coke forming pathway.
One final point for this section concerns the degree of coking. Although the TPO profiles in Fig. 4 for samples 4 and 5 show substantial amounts of carbon being present, it is noted that visual inspection of these samples post-reaction revealed the catalysts to exhibit a light grey colouration; they were most certainly not black in colour. This observation indicates the catalysts to be only mildly coked, consistent with the quantities displayed in Table 2. Bibby and co-workers report that the coke loading at which hydrocarbon production stops varies with zeolite particle size but is within the range of 14–18 wt%.19
3.3 Electron paramagnetic resonance (EPR) spectroscopy
A clean, activated sample of ZSM-5 was EPR silent. Fig. 5 shows the EPR spectra recorded at room temperature from used catalyst samples removed from the reactor and loaded into EPR tubes under argon. After reaction at 350 °C for 1 hour, a weak narrow line at g = 2.003 was observed with a line width of 1.2 mT (Fig. 5(a)). Amplification of this signal (Fig. 5(b)) revealed some indication of poorly resolved hyperfine splitting. After reaction at 350 °C for 3 days, a similar signal was measured with a 20 fold increase in intensity (Fig. 5(c)). Consistent with the TPO data (Section 3.2), the signal obtained after reaction at 400 °C for 3 days (Fig. 5(d)) had lower intensity and a significantly reduced line width (1.0 mT). The concentrations of paramagnetic species in the zeolite in each of these samples were estimated by comparison of the doubly integrated signals with a weak pitch standard. The maximum signal intensity (3 days reaction at 350 °C) corresponded to a concentration of ∼9 × 10¹⁸ spins per gram, or 0.08 spins per unit cell of the zeolite.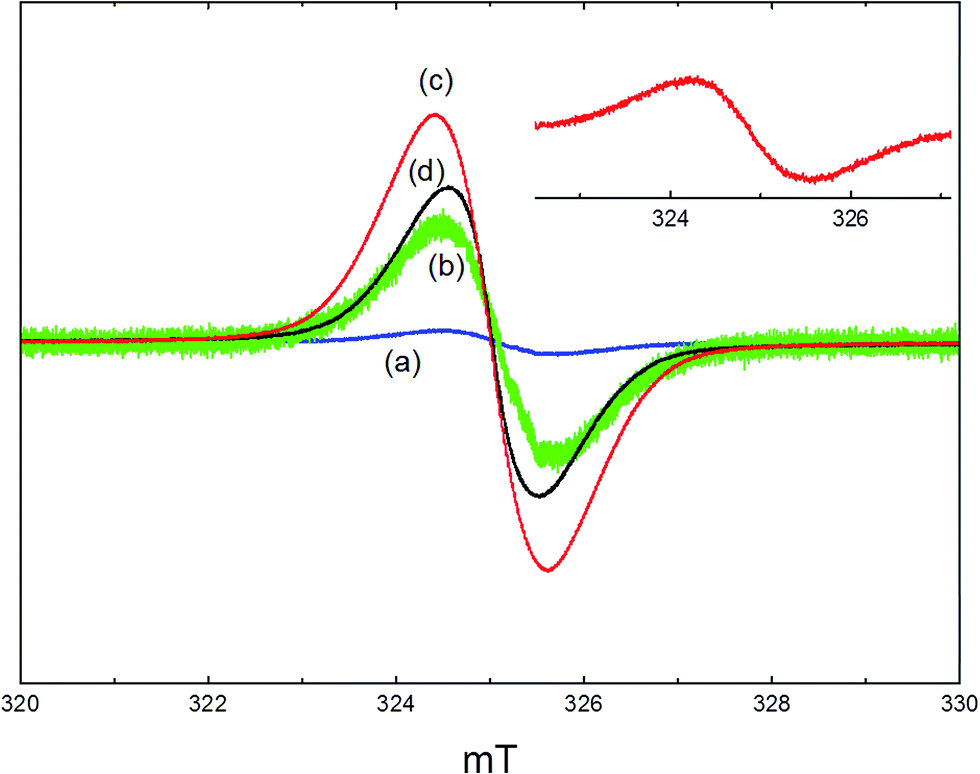 | ||
| Fig. 5 EPR spectra of the ZSM-5 catalyst reacted at (a) 350 °C for 1 hour; (b) 10× expansion of (a); (c) 350 °C for 3 days; (d) 400 °C for 3 days. The inset shows the spectrum obtained by heating ZSM-5 in methanol vapour at 300 °C for 1 hour, then evacuating at 50 °C. | ||
To explore the origins of these signals, further studies were carried out in which samples of zeolite catalyst were dehydrated in a high vacuum cell and then exposed to a static atmosphere of methanol vapour (∼100 mbar) for 1 hour, sealed and transferred to the EPR spectrometer. Exposure to static methanol vapour at high temperatures gave similar signals to those seen from the used catalysts. For example, the inset in Fig. 5 shows the spectrum obtained from a zeolite exposed to methanol at 300 °C for 1 hour, then evacuated at 50 °C prior to measurement. This has the same line width as that seen from the catalysts used at 350 °C. This signal was not removed on subsequent evacuation up to 300 °C.
A notably different spectrum was obtained when the zeolite was exposed to methanol at 250 °C. No signals were detected when such a sample was evacuated at room temperature prior to measurement. Evacuation at 100 °C or 150 °C gave a signal showing a well resolved hyperfine structure, as illustrated in Fig. 6. At least 9 lines can be resolved in the room temperature spectrum, with a hyperfine coupling constant of 0.67 mT. When measured at 80 K, the signal is broadened and the apparent hyperfine splitting increases to 1.0 mT. The integrated intensity of the signal corresponded to ∼5 × 10¹⁵ spins per gram of zeolite. Evacuation at higher temperatures removed this signal completely.
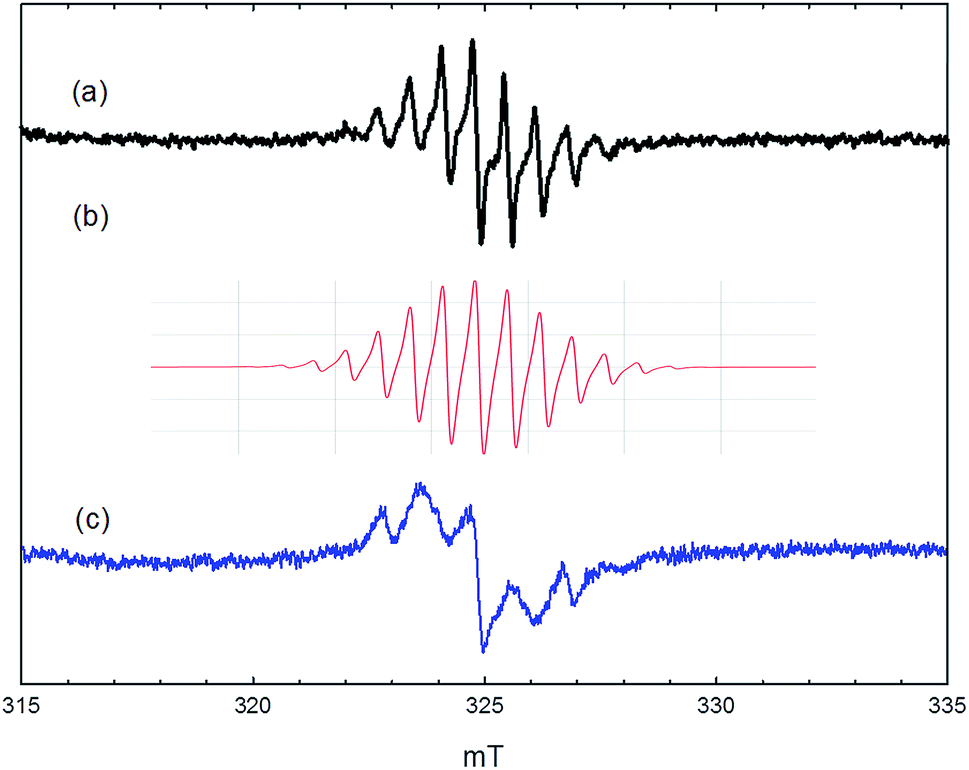 | ||
| Fig. 6 EPR spectra recorded following exposure of ZSM-5 to methanol vapour at 250 °C for 30 min and evacuation at 150 °C for 30 min. (a) Measured at 25 °C; (b) simulation with parameters described in text; (c) measured at −193 °C. | ||
There are several previous reports of EPR signals being generated when methanol is reacted over zeolite catalysts. Kim et al. observed an 11 line signal with a splitting of 0.64 mT when methanol was reacted over HSAPO-34 and its aluminosilicate analogue HSSZ-13 at 350 °C for between 30 and 180 minutes on stream.20 They attributed this signal to the hexamethylbenzene radical cation. The hyperfine splitting is closely similar to that seen for the 13-line spectrum of UV irradiated hexamethylbenzene in sulphuric acid.21 A closely related spectrum was seen when hexamethylbenzene was adsorbed in H-mordenite.20 At longer reaction times the hyperfine structure collapsed and a single symmetrical line was observed. This was extremely narrow in the case of HSAPO-34 (∼0.3 mT) but considerably broader in the case of HSSZ-13 (∼1.3 mT). These authors also report that a single symmetric line was observed when methanol reacted over HZSM-5 at 350 °C for all times on stream, although no spectra were shown.
Spectra very similar to those shown in Fig. 5 were obtained by Madeira et al. from HZSM-5 catalysts used in the conversion of ethanol to hydrocarbons at 350 °C.22 They report a single symmetric line with a line width of 1.0 to 1.4 mT, rising to a maximum intensity after 16 hours on stream corresponding to 3.5 micromol per gram, or ∼1 radical for 50 unit cells of zeolite. Although no hyperfine splitting was resolved in the CW EPR signals, pulsed HYSCORE measurements showed the presence of several proton hyperfine couplings between 0.3 and 0.6 mT.
Spencer et al. report partially resolved signals from mordenite zeolite catalysts exposed to methanol for different times on stream at various reaction temperatures.23 The signals were best resolved at shorter reaction times and the best match between observed and simulated EPR spectra was obtained for the 2,3,6,7-tetramethylnaphthalenium radical cation. At longer reaction times a single symmetrical line with a width of ∼1.6 mT was observed.
Jang et al. describe EPR signals obtained when methanol is reacted over a phosphorus modified HZSM-5 zeolite.24 At short reaction times (e.g. 5 minutes at 350 °C) they observe a partially resolved hyperfine splitting which they attribute to the 1,2,4,5-tetramethylbenzenium cation but, as in the earlier studies, the resolution of the signal was lost at longer reaction times.
It is clear from the above studies and from earlier work on aromatic molecules adsorbed in zeolites that aromatic radical cations are readily formed in acid zeolites.25 The signals we observe from used catalysts (Fig. 5) can be readily assigned to such species, given the methylated aromatic molecules detected in the product stream (Fig. 3). In the absence of resolved hyperfine splitting, it is impossible to identify specific radicals. The absence of hyperfine splitting has been attributed by various authors to exchange interactions between radical cations. We note however that the spin concentrations measured indicate a low number of radicals per unit cell of the zeolite. The spin exchange narrowing observed suggests therefore that the radicals are not uniformly distributed throughout the zeolite pores but rather heterogeneously distributed in close proximity to each other. A further important observation is that the EPR signal from the used 400 °C catalyst sample has a significantly narrower line width than those reacted at 350 °C, even though the spin concentration is lower. This suggests a greater degree of condensation of aromatic rings in the radical cations formed at this temperature.
More surprising is the observation of well resolved proton hyperfine splitting in the signal shown in Fig. 6. The signal is identical to that reported by Kim et al. and assigned to the hexamethylbenzenium cation.20 This radical, with 18 equivalent methyl protons, is expected to give a 19-line hyperfine pattern, but the intensities of the outermost lines are too weak to be detected. The intensity distribution of the inner lines matches well with that in the calculated simulation (Fig. 6(b)) using a single isotropic coupling constant of 0.67 mT (and g = 2.003). The observed spectrum cannot be fitted to simulations for benzenium cations containing fewer methyl groups, where two or more different proton coupling constants are expected from methyl and aromatic ring protons. Hexamethylbenzene is too large to escape from the pores of ZSM-5 and is not detected at all in the reaction products. This work shows, however, that traces of hexamethylbenzene must be formed within the zeolite at temperatures as low as 250 °C when HZSM-5 is heated in a static methanol atmosphere. The radical cation is only detected on subsequent outgassing, and it is not stable to heating above 150 °C in vacuum. We think therefore it is unlikely to play any role in the formation of the hydrocarbon pool; this is borne out also by its low concentration. The change in the appearance of the signal on cooling to 80 K (Fig. 6(c)) suggests a significant anisotropy in the proton hyperfine coupling, which is not normally seen for methyl groups in aromatic radical cations. The observed splitting of 1.0 mT would then be the parallel component, implying a perpendicular component of ∼0.5 mT, not resolved in the spectrum. For comparison, the parallel and perpendicular methyl proton coupling constants in the toluene and xylene radical cations in frozen solution differ by only ∼0.1 mT.26 Further work is required to clarify the nature and structure of the radical in the zeolite environment.
3.4 Diffuse-reflectance infrared spectroscopy (DRIFTS)
Infrared spectra were recorded from the used catalyst samples by diffuse reflectance following temperature-programmed flushing in flowing helium up to the temperature at which they had been reacted. Spectra were recorded over the wavenumber range 4000 to 1000 cm−1, but the region below 1700 cm−1 was found to be obscured by strong bands arising from the dispersive component occurring in the reflected beam from lower frequency absorption bands, due to zeolite framework stretching modes. The overtones of the framework bands at ∼1900 and 2000 cm−1 were used to normalise band intensities. Fig. 7 shows spectra in the ν(OH) region from the fresh catalyst dehydrated at 350 °C and from the four used catalysts, in each case recorded at the temperature at which they had been reacted.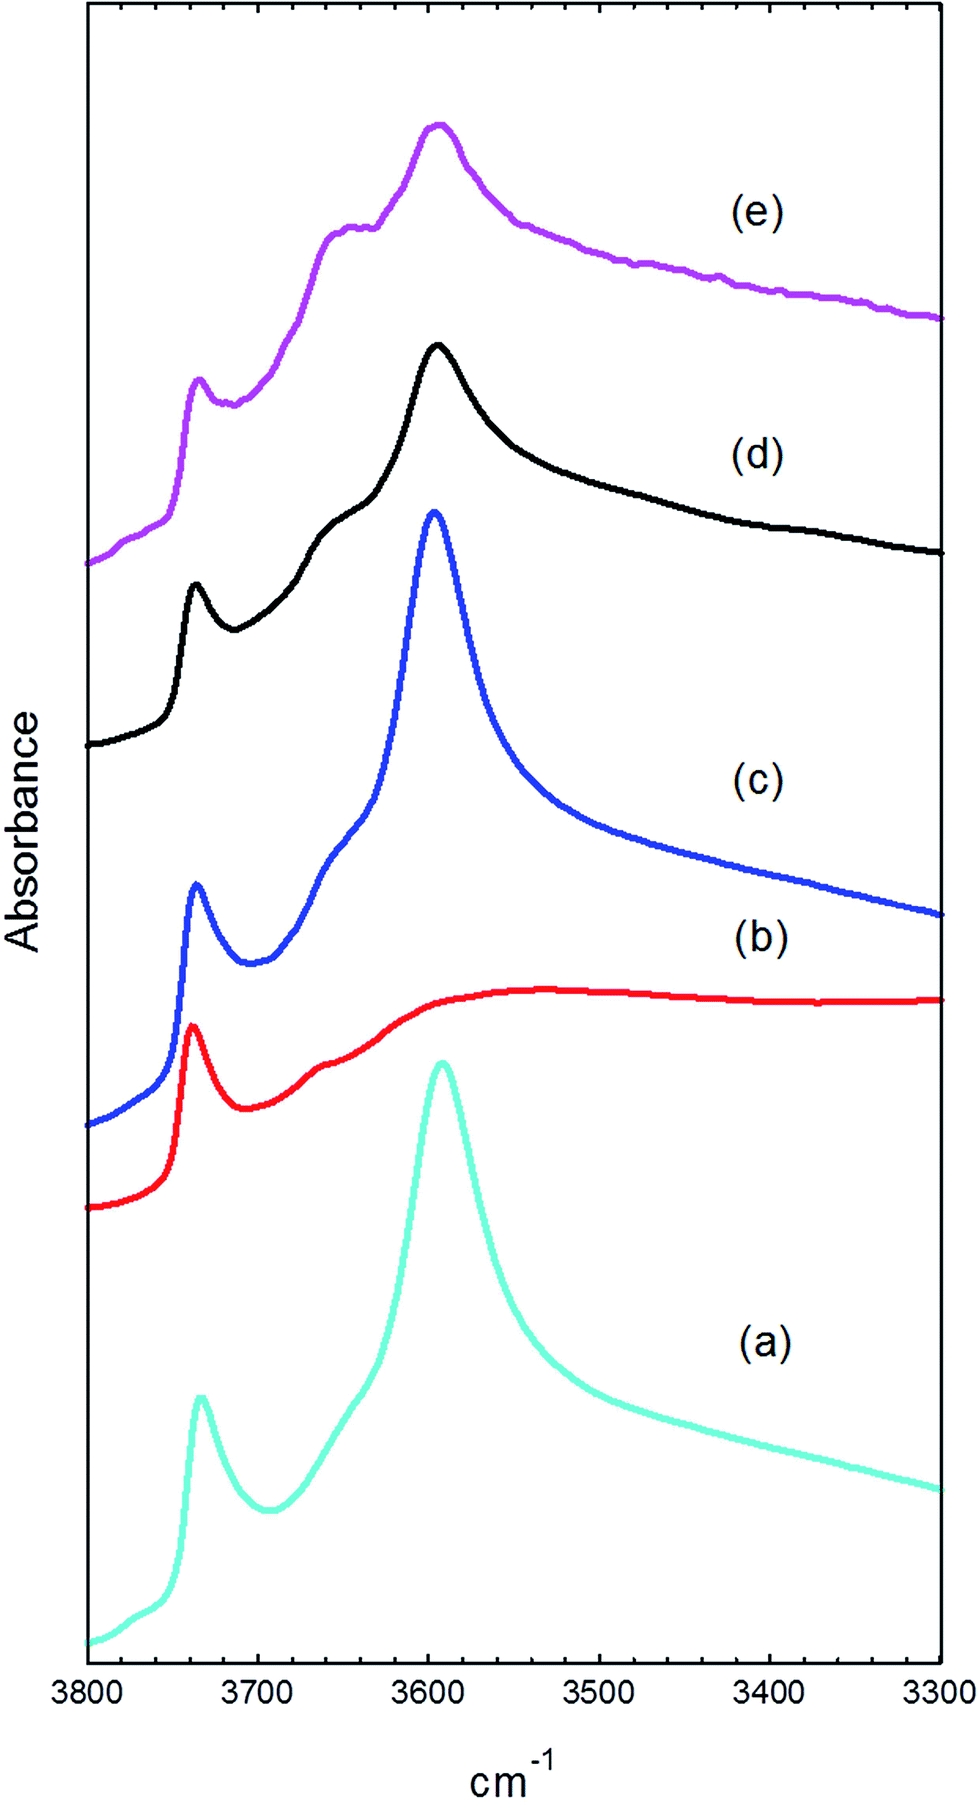 | ||
| Fig. 7 Infrared spectra in the ν(O–H) region of (a) fresh catalyst; (b) catalyst after reaction at 200 °C for 1 h; (c) catalyst after reaction at 350 °C for 1 h; (d) catalyst after reaction at 350 °C for 3 days; (e) catalyst after reaction at 400 °C for 3 days. All spectra were recorded in flowing He at the temperature indicated. | ||
The fresh catalyst shows three bands in this region: a strong band at 3595 cm−1 due to the Brønsted acid hydroxyl groups,27 a weaker band at 3740 cm−1 due to silanol groups on the external surface of the zeolite28 and a weak shoulder at ∼3650 cm−1, which has been previously assigned to AlOH groups associated with extra-framework aluminium.29,30 The intensity of the 3595 cm−1 band and the relatively small contribution from the AlOH band confirms that the HZSM-5 catalyst contains a high concentration of Brønsted acid sites.
After reaction with methanol at 200 °C for 1 hour, the spectrum (measured at 200 °C) shows almost complete removal of the Brønsted OH band (Fig. 7(b)). At lower frequencies (not shown) this was replaced by an intense broad triplet of bands at ∼3000 cm−1 (underlying the CH stretching bands discussed below), ∼2300 cm−1, and ∼1700 cm−1. This pattern is characteristic of strongly hydrogen bonded methanol and has been extensively discussed in the literature.31 The so-called ABC triplet arises from resonant interactions between the ν(OH) mode of the zeolite and the overtone of the bending mode of the perturbed methanol hydroxyl.
The spectrum measured after reaction at 350 °C for 1 hour and flushing in helium at the same temperature gives a ν(OH) spectrum comparable to that of the fresh catalyst (Fig. 7(c)). After reaction at 350 °C for 3 days however, both the Brønsted OH band and the external SiOH band are reduced in intensity, and the AlOH band at 3650 cm−1 becomes more prominent (Fig. 7(d)). After 3 days of reaction at 400 °C the AlOH band grows further, and the Brønsted OH band is further reduced (Fig. 7(e)).
The loss of intensity in the Brønsted OH band at longer reaction times at 350 °C can have two causes. Firstly, methylation of the surface by methanol replaces OH groups with methoxy groups (see below).32 Secondly, Brønsted OH groups can also be lost through hydrolysis by steam produced as a product under the reaction conditions30,33 and the relative increase in intensity of the AlOH band at 3650 cm−1 indicates that some hydrolysis is also occurring here.
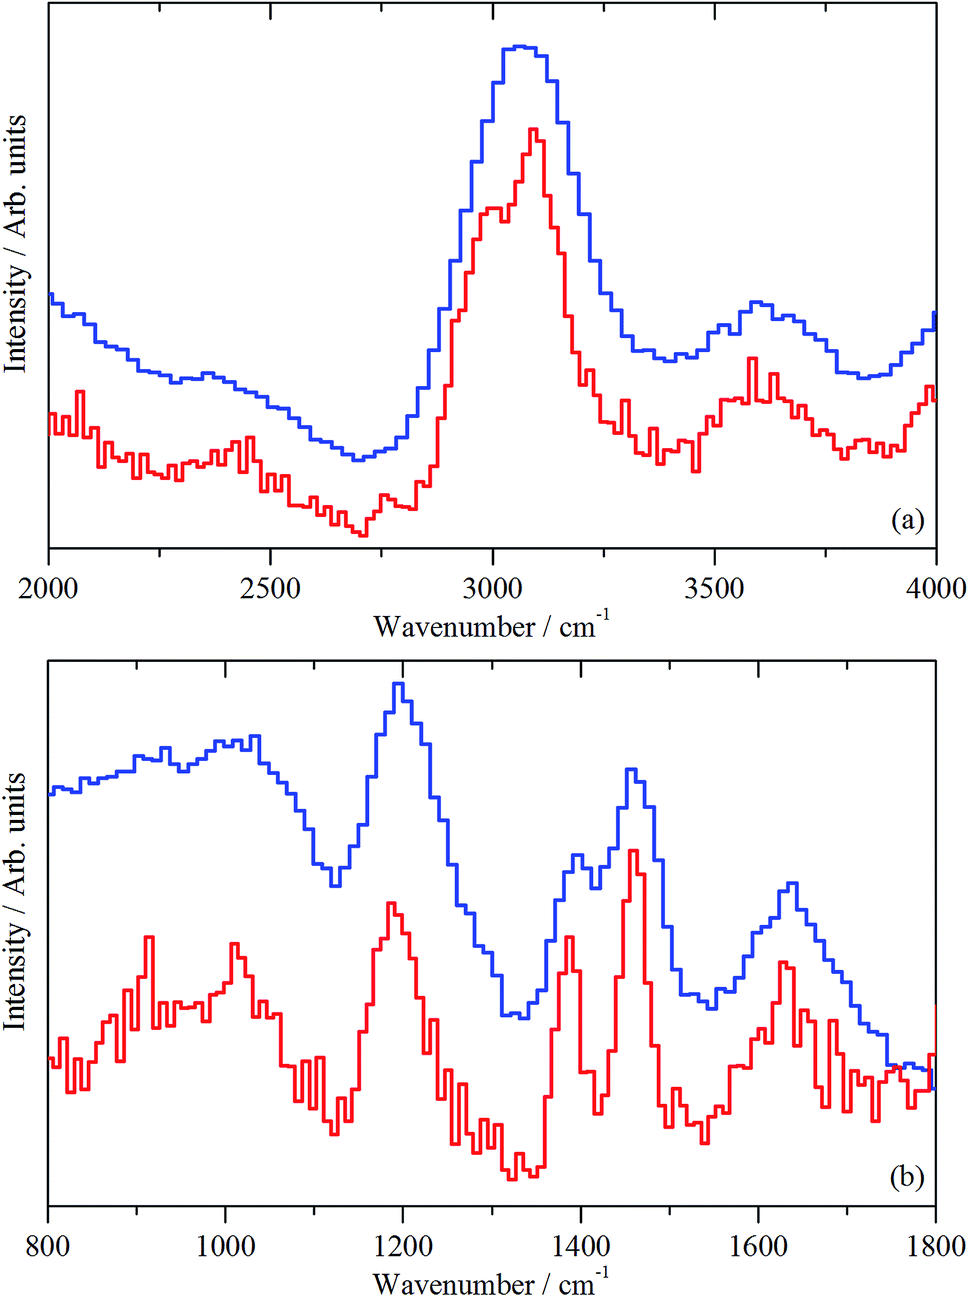
Fig. 8 shows the difference spectra in the CH stretching region of the used catalysts (after subtraction of the spectrum of the fresh catalyst). The catalyst reacted at 200 °C (Fig. 8(a)) shows an envelope of at least 4 bands at 3003, 2970, 2955, and 2848 cm−1 superimposed on the A hydroxyl component of the H-bonded methanol triplet. Three of these can be attributed to the CH stretching vibrations of hydrogen bonded methanol (the degeneracy of the asymmetric CH stretching mode is lifted in the adsorbed state). The low temperature adsorption of methanol in HZSM-5 was studied in detail by Mirth et al.34 They attributed the 3 CH stretching bands observed at 2993, 2958 and 2856 cm−1 to hydrogen bonded protonated methanol, although as discussed more recently,35 the methanol is unlikely to be protonated. Campbell et al. report CH frequencies of 3007, 2957 and 2853 cm−1 for hydrogen bonded methanol.35 The remaining CH band in Fig. 8(a) at 2970 cm−1 is close to that assigned by several groups to the asymmetric stretch of surface methoxy groups.29,32,33,35,36 The corresponding symmetric stretch at about 2868 cm−1 is hidden by the stronger 2848 cm−1 symmetric stretch of hydrogen bonded methanol. We conclude that the catalyst reacted at 200 °C for 1 hour contains both hydrogen bonded methanol and methoxy groups.
 | ||
| Fig. 8 Infrared difference spectra in the ν(C–H) region for the catalyst following reaction with methanol at (a) 200 °C for 1 h; (b) 350 °C for 1 h; (c) 350 °C for 3 days; (d) 400 °C for 3 days. Spectra measured in flowing He at the temperature indicated. | ||
The infrared spectrum of the catalyst reacted at 350 °C for 1 hour contains no evidence of hydrogen bonded methanol. The Brønsted OH band is close to its original intensity, and the CH stretching region (Fig. 8(b)) shows, in addition to small contributions from methoxy groups at 2970 and 2870 cm−1, a weak peak at 2920 cm−1. The 2920 cm−1 band persists and becomes more intense in the catalyst reacted at 350 °C for 3 days (Fig. 8(c)). This spectrum also contains a stronger contribution from the methoxy groups (2970 and 2870 cm−1) and an intense, broader band at 3120 cm−1. Palumbo et al., in their study of HZSM-5 heated in static methanol vapour at elevated temperatures, attribute a band at ∼3100 cm−1 to aromatic CH stretching vibrations of adsorbed methylaromatic species.37 They supported this assignment through the observation of bands in the C–C stretching region (1500–1700 cm−1), which are not accessible in the diffuse reflectance spectra measured in the present work. The dominant band at ∼2920 cm−1 is assigned to methyl groups bonded to aromatic rings; for example durene (1,2,4,5-tetramethylbenzene) has a major CH stretching band at 2930 cm−1.38
The spectrum in the CH stretching region of the catalyst reacted at 400 °C for three days (Fig. 8(d)) shows some interesting differences from that of the 350 °C catalyst. The aromatic CH stretching band at 3120 cm−1 is greatly reduced in intensity, and there are some shifts in the aliphatic CH stretching profile below 3000 cm−1. In particular, the 2970 and 2870 cm−1 bands of surface methoxy groups are lost, the 2920 cm−1 remains, and a new band appears at 2860 cm−1. Detailed discussion of these bands is not warranted, given the complexity of the system, but the reduction in the aromatic CH stretching band does imply a greater degree of methylation of the aromatic rings present in the catalyst at this temperature.
3.5 Inelastic neutron scattering (INS)
As mentioned in Section 2.3, spectra are presented using two direct geometry spectrometers: MERLIN emphasizes sensitivity and MAPS offers superior resolution.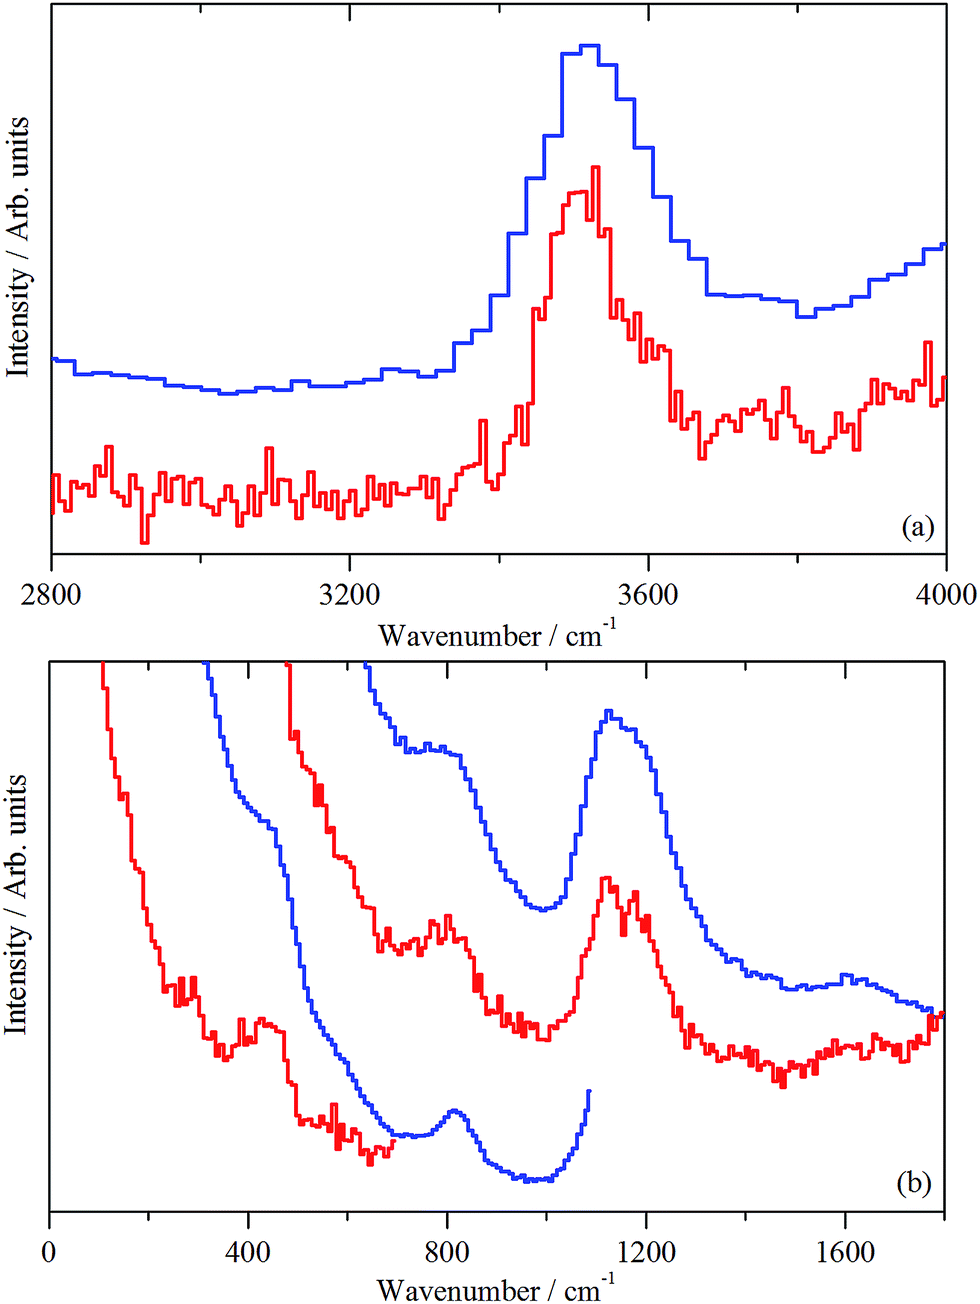 | ||
| Fig. 9 INS spectra (MERLIN (blue) and MAPS (red) spectrometers) of clean, activated ZSM-5 (sample 1). (a) Spectral region 4000–2800 cm−1, recorded with an incident energy of 5244 cm−1; (b) spectral region 1800–0 cm−1, recorded with incident energies of 2017 and 807 cm−1. | ||
| M–O–H + HOCH3 → M–O–CH3 + H2O. | (1) |
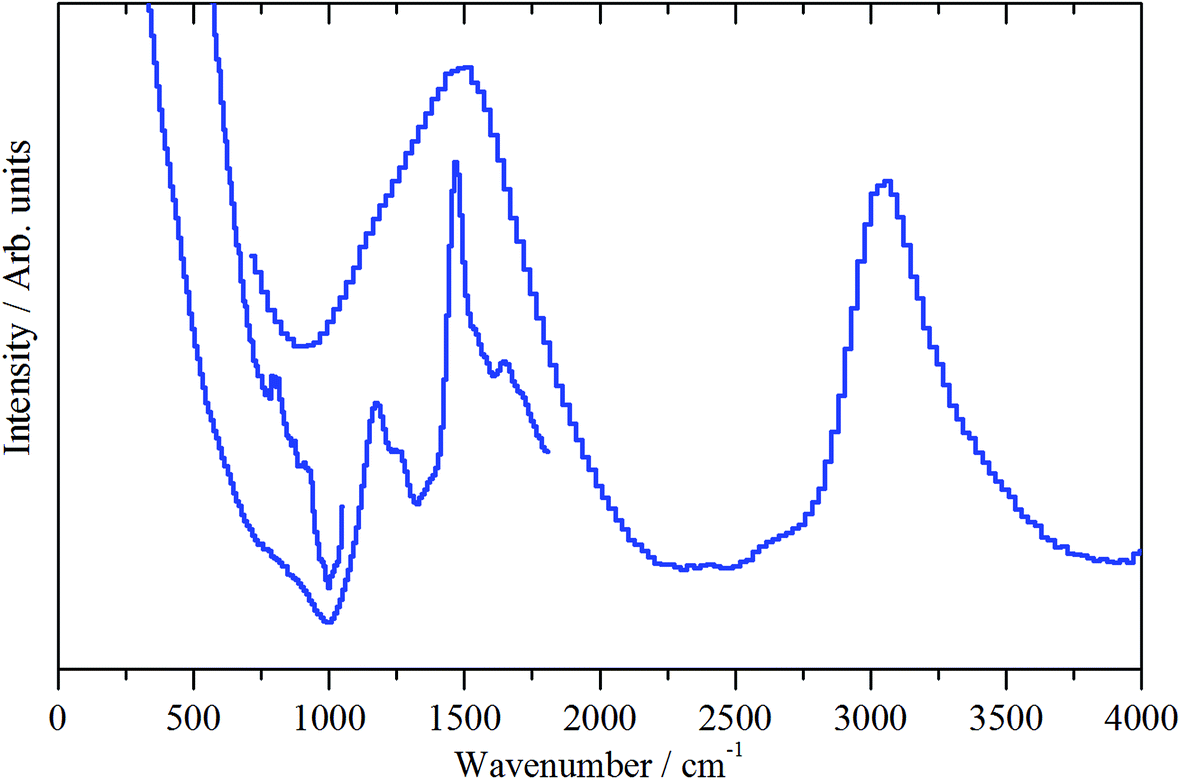 | ||
| Fig. 10 INS spectra (MERLIN spectrometer, 4500–0 cm−1) of the ZSM-5 catalyst after 1 h of reaction at 200 °C (sample 2). Spectra were recorded with incident energies of 5244, 2017 and 1210 cm−1. | ||
The medium energy scan resolves a methyl rocking mode at 1172 cm−1 from the more intense δ(C–H) mode.39 In fact, the methyl rock appears to be split into two components: a band head at 1172 cm−1 and a high energy shoulder at 1247 cm−1. This splitting could indicate that either the local symmetry is highly distorted from C3v, or there are two distinct methoxy populations present, perhaps originating from different hydroxyls. It is noted that Fig. 10 shows no evidence for a methyl torsion that is typically located at about 80 cm−1.39 However, the resolution of MERLIN is insufficient to resolve this from the elastic line with Ei = 1210 cm−1, thus its absence in Fig. 10 does not negate the presence of methyl groups.
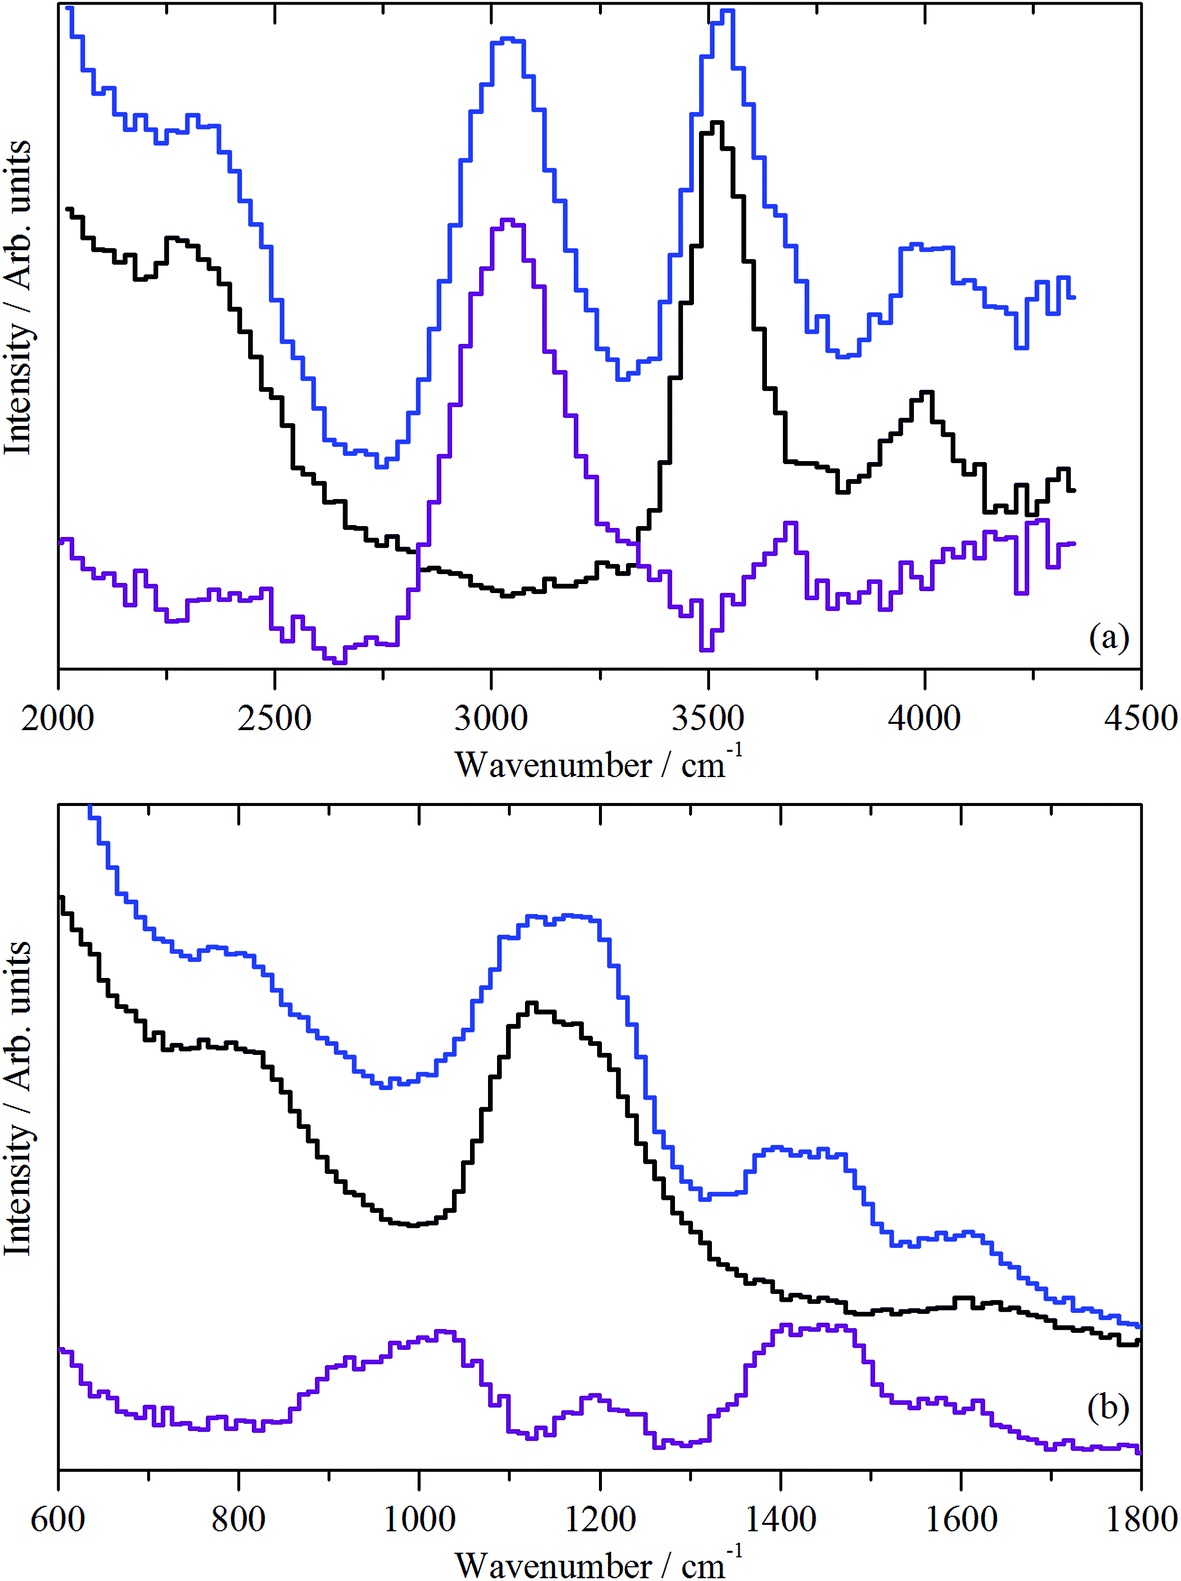 | ||
| Fig. 11 INS spectra (MERLIN spectrometer) of the ZSM-5 catalyst after 1 h of reaction at 350 °C (sample 3): (a) spectral region 4500–2000 cm−1, recorded with an incident energy of 5244 cm−1; (b) spectral region 1800–600 cm−1, recorded with an incident energy of 2017 cm−1. In both (a) and (b) the blue plot represents the post-reaction spectrum, whereas the purple plot represents the difference spectrum [i.e. post-reaction spectrum (sample 3) – spectrum of the clean catalyst (sample 1, black)]. | ||
Fig. 11(b) presents the deformation region of the spectrum. A small increase in the δ(O–H) mode at 1150 cm−1 is seen, alongside broad bands centred at about 1450 and 980 cm−1. The former is possibly a δ(C–H) mode associated with a population of aliphatic species that could be associated with the low energy tail of the intense feature seen in Fig. 11(a) at 3008 cm−1. The 980 cm−1 feature is thought to represent an olefinic wag.40
 | ||
| Fig. 12 INS spectra (MERLIN (blue) and MAPS (red) spectrometers) of the ZSM-5 catalyst after 3 days of reaction at 350 °C (sample 4): (a) spectral region 4000–2000 cm−1, recorded with an incident energy of 5244 cm−1; (b) spectral region 1800–800 cm−1, recorded with an incident energy of 2017 cm−1. | ||
In the deformation region, Fig. 12(b), there are peaks at 1639, 1460, 1390, and 1190, and a broad feature at 800–1100 cm−1 (with a maximum at 1000 cm−1). Although the 1190 cm−1 band coincides with a hydroxyl bending mode as observed in Fig. 9(b), given the intensity of the ν(C–H) mode in Fig. 12(a), the 1190 cm−1 peak is assigned to a C–H mode. The obvious assignment is that the 1460, 1390, and 1190 cm−1 modes are the methyl asymmetric bend, symmetric bend, and rock, respectively. This assignment would require a strong methyl torsion mode below 250 cm−1, but further spectral acquisition is required to discern the presence or absence of this diagnostically significant mode. It is also unusual to see the asymmetric and symmetric bending modes resolved (1460 and 1390 cm−1); for chemisorbed methoxy, only a single broad peak is observed.39 The simplest (but certainly not totally satisfactory) assignment is that all the peaks are due to coupled aromatic C–C stretch and C–H bend modes. This possibility requires further investigation.
In the deformation region, Fig. 13 shows some commonality with the 3 days at 350 °C spectrum (Fig. 12(b), (C–H) deformation modes at ∼1456 cm−1 and methyl rock at ∼1195 cm−1), except for the presence of three new features at 1090, 939 and 782 cm−1. These are thought to arise from aryl C–H wag vibrations. This could include a contribution from naphthalenic species.40 As discussed with sample 4, the splitting of the δ(C–H) mode is thought to indicate the presence of at least two species.
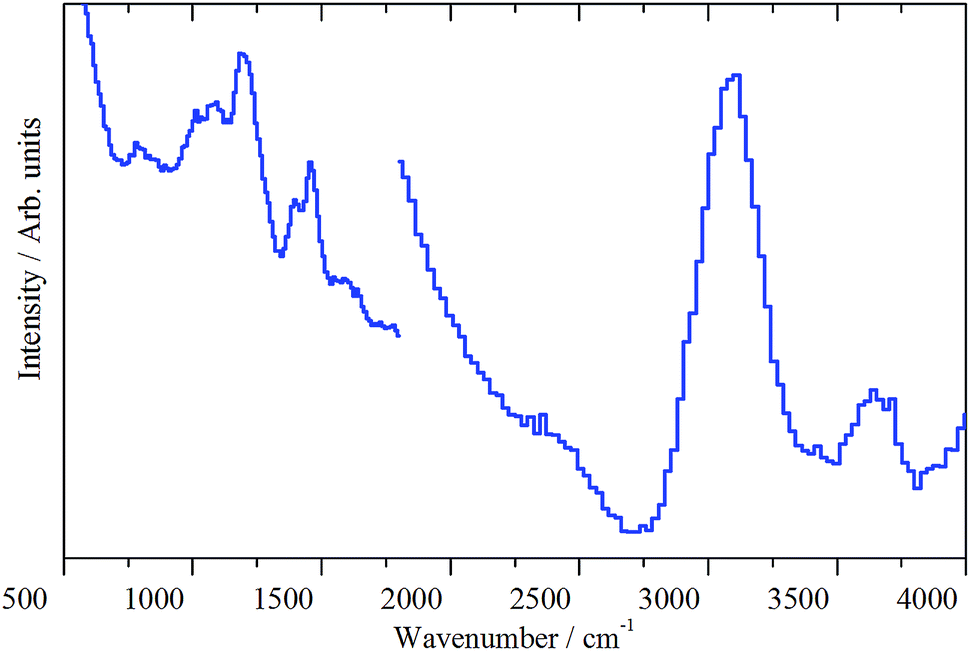 | ||
| Fig. 13 INS spectra (MERLIN spectrometer) of the ZSM-5 catalyst after 3 days of reaction at 400 °C (sample 5) for the spectral region 4000–500 cm−1, recorded with incident energies of 5244 and 2017 cm−1. | ||
The original intention of examining a sample after 3 days at 400 °C was to induce coking reactions. However, despite exhibiting a reasonable TPO profile albeit with a lower coke content than at 350 °C (Fig. 4, Table 2), visual inspection of the sample post-reaction indicates only mild coking at most (Section 3.2). Indeed, as reported in Section 3.1, no deactivation was observed via in-line mass spectrometry. Instead, the IR (Fig. 8(d)) and INS (Fig. 13) data suggest that the progression from 350 to 400 °C has caused some modification to the form of the hydrocarbonaceous material retained by the catalyst. It is possible that this modification is connected to the different emphasis on reaction pathways as a function of temperature, i.e. favouring the olefinic pathway over the aromatic one, as considered by Sun and co-workers.4 Certainly, in order to access a substantial coking component, it will be necessary to examine more forcing conditions in future experiments.
Although INS provides a welcome new handle on the retained hydrogenous population that are engaged in MTH chemistry over ZSM-5, thus far, there is insufficient data to define a precise role for how a hydrocarbon pool simultaneously facilitates the formation of olefin and aromatic products. Nonetheless, there are clearly opportunities for using INS to characterise the nature and quantity of the retained hydrocarbonaceous material with respect to defined process operations. For example, previously, the role of “coking” was considered a key process but Fig. 10–13 provide clear evidence that the ‘coke’ has a substantial hydrogen component, indicating that future studies should more correctly consider a role for hydrocarbonaceous entities. Olsbye et al.'s highlighting of the importance of “(hydro-)carbon residues” similarly endorses this awareness.5Fig. 14 attempts to illustrate the interconnectivity between the species observed in this study.
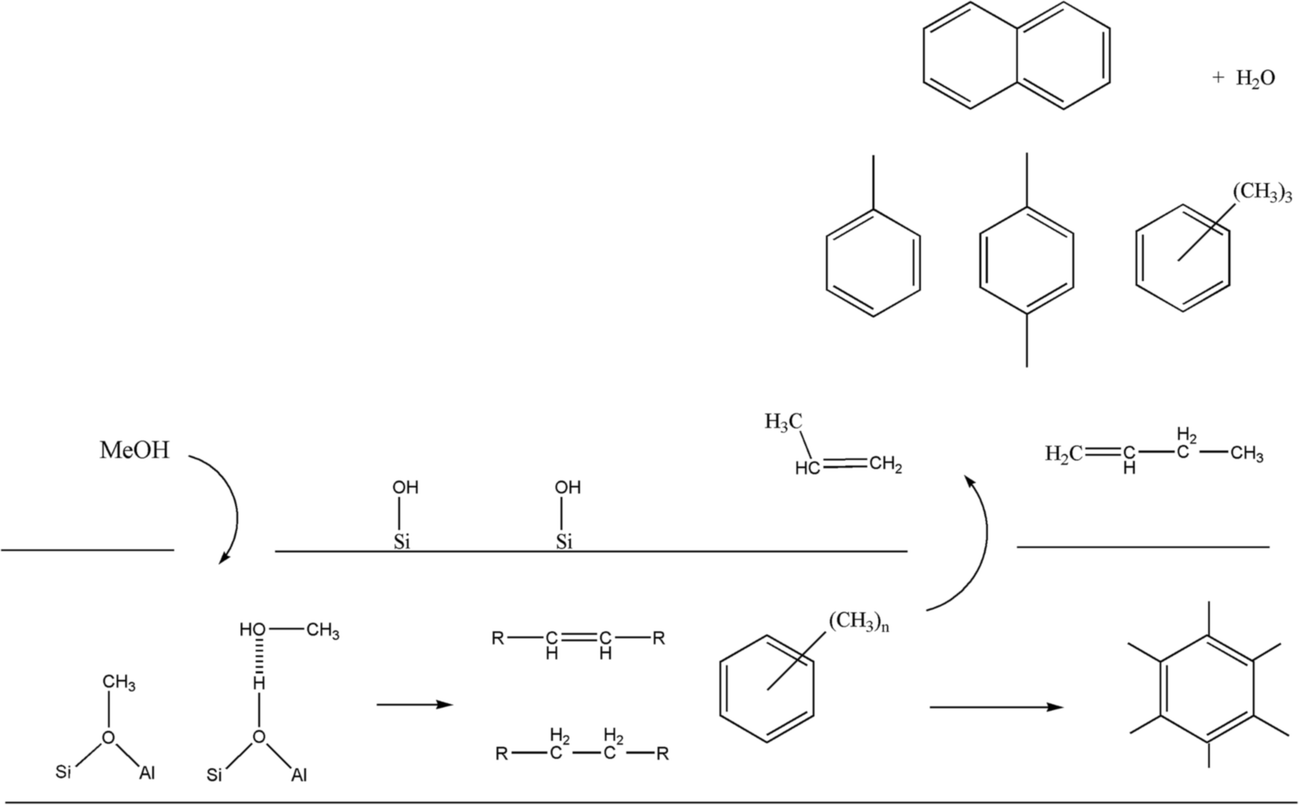 | ||
| Fig. 14 A schematic representation of the principal chemical species identified as part of this multi-technique investigation of the reaction of methanol over ZSM-5 at elevated temperatures. The ‘tube’ is intended to indicate the internal surface of the zeolite. The aliphatic, olefinic and aromatic species in the middle of the tube are representative examples of the retained hydrocarbonaceous material revealed in the INS spectra. | ||
With reference to Fig. 14, it is proposed that INS is a most appropriate probe to be added to the armoury of techniques used to explore the intricacies of MTH chemistry.
4. Concluding remarks
A multi-technique approach using a combination of reaction testing (mass spectrometry and GC-MS), TPO, EPR, IR and INS has been used to examine the methanol-to-hydrocarbon reaction using a commercial grade ZSM-5 catalyst over a range of conditions, varying from constrained reaction at 200 °C, steady-state operation at 350 °C, and an attempt at accelerated ageing via reaction at 400 °C. The following conclusions can be drawn.• The reaction profile for the reaction at 350 °C indicates that methanol dosing leads initially to the formation of dimethyl ether. It is assumed that this forms from the dimerization of chemisorbed methoxy species. Dimethyl ether appears to be a precursor to the simultaneous production of olefinic and aromatic products. The aromatics are typified by methylated benzenes and naphthalenes.
• TPO measurements indicate that an extended time-on-stream at 350 °C leads to a significant population of retained carbonaceous material that is strongly bound to the catalyst.
• EPR measurements indicate that continued reaction leads to an accumulation of undefined aromatic radical cations of low spin density.
• Infrared measurements have provided information on catalyst hydroxyl groups and the retention of hydrocarbonaceous species as the reaction proceeds, confirming the co-existence of sp2 and sp3 hybridised C–H entities for reaction at elevated temperatures.
• INS measurements provide vital information on how hydrogen partitions within the catalyst matrix as the reaction proceeds. For reaction at 200 °C, the co-existence of hydrogen bonded methanol and methoxy species, as evidenced by IR, is confirmed. The INS spectrum of the catalyst after 3 days of operation at 350 °C indicates the presence of sp2 and sp3 hybridised C–H species. However, no discrete molecular assignment for the retained hydrocarbonaceous species is possible as yet, indicating the complexity of the composition of the hydrocarbon pool. Increasing the reaction temperature from 350 to 400 °C modifies the form of the retained hydrocarbon to possibly include napthalenic entities.
Acknowledgements
The UK Catalysis Hub is kindly thanked for resources and support provided via our membership of the UK Catalysis Hub Consortium and funded by EPSRC (grants EP/I038748/1, EP/I019693/1, EP/K014706/1, EP/K014668/1, EP/K014854/1, EP/K014714/1 and EP/M013219/1). Project support from the EPSRC via grant EP/K503903/1 (University of Glasgow) is also acknowledged. The STFC Rutherford Appleton Laboratory is thanked for access to neutron beam facilities. Johnson Matthey plc is thanked for the provision of the ZSM-5 catalyst and its characterisation. A. Hameed acknowledges the support of the Iraqi Ministry of Higher Education and Scientific Research and the Chemical Engineering Department, University of Technology, Baghdad, Iraq.References
- K. Hemelsoet, J. Mynsbrugge, K. De Wispelaere, M. Waroquier and V. Speybroeck, ChemPhysChem, 2013, 14, 1526 CrossRef CAS PubMed.
- C. Wang, Y. Chu, A. Zheng, J. Xu, Q. Wang, P. Gao, G. Qi, Y. Gong and F. Deng, Chem. – Eur. J., 2014, 20, 12432 CrossRef CAS PubMed.
- S. Wang, Y. Chen, Z. Wei, Z. Qin, J. Chen, H. Ma, M. Dong, J. Li, W. Fan and J. Wang, J. Phys. Chem. A, 2014, 118, 8901 CrossRef CAS PubMed.
- X. Sun, S. Mueller, Y. Liu, H. Shi, G. L. Haller, M. Sanchez-Sanchez, A. C. van Veen and J. A. Lercher, J. Catal., 2014, 317, 185 CrossRef CAS.
- U. Olsbye, S. Svelle, K. P. Lillerud, Z. H. Wei, Y. Y. Chen, J. F. Li, J. G. Wang and W. B. Fan, Chem. Soc. Rev., 2015, 44, 7155 RSC.
- S. F. Parker and D. Lennon, Acc. Chem. Res., 2014, 47, 1220 CrossRef PubMed.
- T. Kandemir, M. Friedrich, S. F. Parker, F. Studt, D. Lennon, R. Schlögl and M. Behrens, Phys. Chem. Chem. Phys., 2016, 18, 17253 RSC.
- A. R. McFarlane, I. P. Silverwood, R. Warringham, E. L. Norris, R. M. Ormerod, C. D. Frost, S. F. Parker and D. Lennon, RSC Adv., 2013, 3, 16577 RSC.
- N. G. Hamilton, I. P. Silverwood, R. Warringham, J. Kapitán, L. Hecht, P. B. Webb, R. P. Tooze, S. F. Parker and D. Lennon, Angew. Chem., Int. Ed., 2013, 52, 5608 CrossRef CAS PubMed.
- R. Warringham, A. R. McFarlane, D. A. MacLaren, P. B. Webb, R. P. Tooze, J. Taylor, R. A. Ewings, S. F. Parker and D. Lennon, J. Chem. Phys., 2015, 143, 174703 CrossRef PubMed.
- S. F. Parker, D. Lennon and P. W. Albers, Appl. Spectrosc., 2011, 65, 1325 CrossRef CAS.
- A. J. O'Malley, S. F. Parker, A. Chutia, M. R. Farrow, I. P. Silverwood, V. Garcia-Sakai and C. R. A. Catlow, Chem. Commun., 2016, 52, 2897 RSC.
- R. F. Howe, J. McGregor, S. F. Parker, P. Collier and D. Lennon, Catal. Lett., 2016, 146, 1242 CrossRef CAS.
- R. Warringham, D. Bellaire, S. F. Parker, J. Taylor, R. Ewings, C. M. Goodway, M. Kibble, S. R. Wakefield, M. Jura, M. P. Dudman, R. P. Tooze, P. B. Webb and D. Lennon, J. Phys.: Conf. Ser., 2014, 554, 012005 CrossRef.
- I. P. Silverwood, N. G. Hamilton, A. McFarlane, R. M. Ormerod, T. Guidi, J. Bones, M. P. Dudman, C. M. Goodway, M. Kibble, S. F. Parker and D. Lennon, Rev. Sci. Instrum., 2011, 82, 034101 CrossRef PubMed.
- D. Lennon, R. Warringham, T. Guidi and S. F. Parker, Chem. Phys., 2013, 427, 49 CrossRef CAS.
- H. Schulz, Catal. Today, 2010, 154, 183 CrossRef CAS.
- A. R. McInroy, D. T. Lundie, J. M. Winfield, C. Dudman, P. Jones and D. Lennon, Langmuir, 2005, 21, 11092 CrossRef CAS PubMed.
- D. M. Bibby, N. B. Milestone, J. E. Patterson and L. P. Aldridge, J. Catal., 1986, 97, 493 CrossRef CAS.
- S. J. Kim, H. G. Jang, J. K. Lee, H. K. Min, S. B. Hong and G. Seo, Chem. Commun., 2011, 47, 9498 RSC.
- M. K. Carter and G. Vincow, J. Chem. Phys., 1967, 47, 302 CrossRef.
- F. F. Madeira, H. Vezin, N. S. Gnep, P. Magnoux, S. Maury and N. Cadran, ACS Catal., 2011, 1, 417 CrossRef CAS.
- N. A. Spencer, E. J. Ditzel, J. S. J. Hargreaves and S. Sproules, J. Mater. Chem. A, 2016, 4, 7036 CAS.
- H. Jang, H. Min, S. Hong and G. Seo, J. Catal., 2013, 299, 240 CrossRef CAS.
- X. Liu, K. Iu, J. K. Thomas, H. He and J. Klinowski, J. Am. Chem. Soc., 1994, 116, 11811 CrossRef CAS.
- R. M. Kadam, Y. Itagaki, R. Erickson and A. Lund, J. Phys. Chem. A, 1999, 103, 1480 CrossRef CAS.
- P. A. Jacobs and R. von Ballmoos, J. Phys. Chem., 1982, 86, 3050 CrossRef CAS.
- J. C. Vedrine, A. Auroux and G. Coudurier, ACS Symp. Ser., 1984, 248, 253 CrossRef CAS.
- L. Kubelkova, J. Novakova and K. Nedomova, J. Catal., 1990, 124, 441 CrossRef CAS.
- S. M. Campbell, D. M. Bibby, J. M. Coddington, R. F. Howe and R. H. Meinhold, J. Catal., 1996, 161, 338 CrossRef CAS.
- E. L. Meier, R. A. van Santen and A. P. J. Jansen, J. Phys. Chem., 1996, 100, 9282 CrossRef.
- T. R. Forester and R. F. Howe, J. Am. Chem. Soc., 1987, 109, 3076 CrossRef.
- S. M. Campbell, D. M. Bibby, J. M. Coddington and R. F. Howe, J. Catal., 1996, 161, 350 CrossRef CAS.
- G. Mirth, J. A. Lercher, M. W. Anderson and J. Klinowski, J. Chem. Soc., Faraday Trans., 1990, 86, 3039 RSC.
- S. M. Campbell, X. Z. Jiang and R. F. Howe, Microporous Mesoporous Mater., 1999, 29, 91 CrossRef CAS.
- H. Yamazaki, H. Shima, H. Imai, T. Yokoi, T. Tatsumi and J. Kondo, Angew. Chem., Int. Ed., 2011, 50, 1853 CrossRef CAS PubMed.
- L. Palumbo, F. Bonino, P. Beato, M. Bjorgen, A. Zecchina and S. Bordiga, J. Phys. Chem. C, 2008, 112, 9710 CAS.
- http://webbook.nist.gov/chemistry, accessed 14th September 2016.
- A. R. McInroy, D. T. Lundie, J. M. Winfield, C. Dudman, P. Jones, S. F. Parker, J. W. Taylor and D. Lennon, Phys. Chem. Chem. Phys., 2005, 7, 3093 RSC.
- D. Lin-Vien, N. B. Colthup, W. G. Fateley and J. G. Grasselli, in The Handbook of Infrared and Raman Characteristic Frequencies of Organic Molecules, Academic Press, San Diego, 1991, p. 286 Search PubMed.
| This journal is © The Royal Society of Chemistry 2017 |