
Construction of a 3D-BaTiO3 network leading to significantly enhanced dielectric permittivity and energy storage density of polymer composites†
Suibin
Luo
a,
Yanbin
Shen
a,
Shuhui
Yu
 *a,
Yanjun
Wan
ab,
Wei-Hsin
Liao
b,
Rong
Sun
*a and
Ching-Ping
Wong
ac
*a,
Yanjun
Wan
ab,
Wei-Hsin
Liao
b,
Rong
Sun
*a and
Ching-Ping
Wong
ac
aCenter for Advanced Materials, Shenzhen Institutes of Advanced Technology, Chinese Academy of Sciences, Shenzhen, 518055, China. E-mail: yuushu@gmail.com; rong.sun@siat.ac.cn
bDepartment of Mechanical and Automation Engineering, The Chinese University of Hong Kong, Shatin, Hong Kong, China
cDepartment of Electronics Engineering, The Chinese University of Hong Kong, Shatin, Hong Kong, China
First published on 13th December 2016
Abstract
Herein, the designed 3D-BaTiO3 network in polymer composites results in enhanced permittivity and energy storage density. High permittivities of 200 (εeff/εm ∼ 55.4) and 34.5 are achieved in the composites with only 30 vol% and 16 vol% 3D-BaTiO3, respectively. The latter exhibits a discharged energy density that is over 16 times larger than the polymer matrix.
Broader contextWith the rapid progress of techniques in all fields, consumption of non-renewable energy resources is astonishing along with environmental pollution and destruction. New energy produced from nuclear, solar and wind power has been continuously explored and utilized, which drives the development of efficient energy storage and conversion technology. Among the various energy storage devices, electrostatic capacitors offer the highest rate of energy transfer, longest service time and are the most environmentally friendly. The challenge is to increase their energy density. In this study, we provide a new strategy of constructing a three-dimensional BaTiO3 (3D-BT) network in polymer composites, which significantly reinforces the contribution of BaTiO3 to the dielectric properties and energy storage performance of the derived polymer composites. Construction of the 3D-BT scaffold is proven to be effective in enhancing polarization throughout the composites. This design of light-weight inorganic/polymer composites with greatly improved permittivity and energy density implies promising applications of dielectric materials in modern electrical and electronic industries. |
The rapid energy consumption and exhausting trend of fossil fuel energy have triggered the development of renewable energy and high energy density storage. Among the various energy storage technologies, electrostatic capacitors possess the highest rate of energy transfer, longest service time and are the most environmentally friendly.1 They have wide applications in modern electronic and electrical industries, including portable electronics, computing systems, hybrid electric vehicles and electrical weapon systems.2–6 With the tendency of miniaturization and high performance of electronic devices, dielectric materials with flexibility and high energy storage density are highly desired.
Polymer based composites containing inorganic fillers offer advantages over a single component, and their dielectric properties can be tailored by employing fillers with specific physical and chemical properties. The energy storage density (Ue) of dielectrics relies on the applied electric field (E) and the produced electric displacement (D) by polarization, as described from the equation:  .7 For linear dielectrics,
  , where ε0 and εr are the permittivity of vacuum and the dielectric material, respectively.8 High permittivity and breakdown strength are necessary for achieving a high energy density. Ceramic particles with high permittivity, including BaTiO3 (BT), Ba(Zr0.3Ti0.7)O3 (BZT) and calcium copper titanate (CCTO), are mostly chosen to enhance the dielectric properties of the polymer matrix.9–13 To retain the high breakdown strength of the polymer matrix, the filler content is usually at a level lower than 15 vol%, whereas the permittivity shows a little enhancement.14 Instead, as the filler content is increased to a high level, e.g. 50 vol%, the permittivity shows not more than 15 times improvement compared with the polymer matrix, whereas the breakdown strength evidently decreases.14–16 Therefore, it is still a challenge to find an effective way to achieve both high permittivity and breakdown strength.
Thus far, efforts have been mainly made to modify the surface of the filler particles in order to improve the interaction between the filler and polymer matrix, and the filler loading is kept at a relatively low level, in order to obtain enhanced breakdown strength.8,17–19 However, the improvement in energy storage density is usually less than 2 times in comparison with the polymer matrix. A breakthrough in the energy storage density of polymer/inorganic composites is still absent.
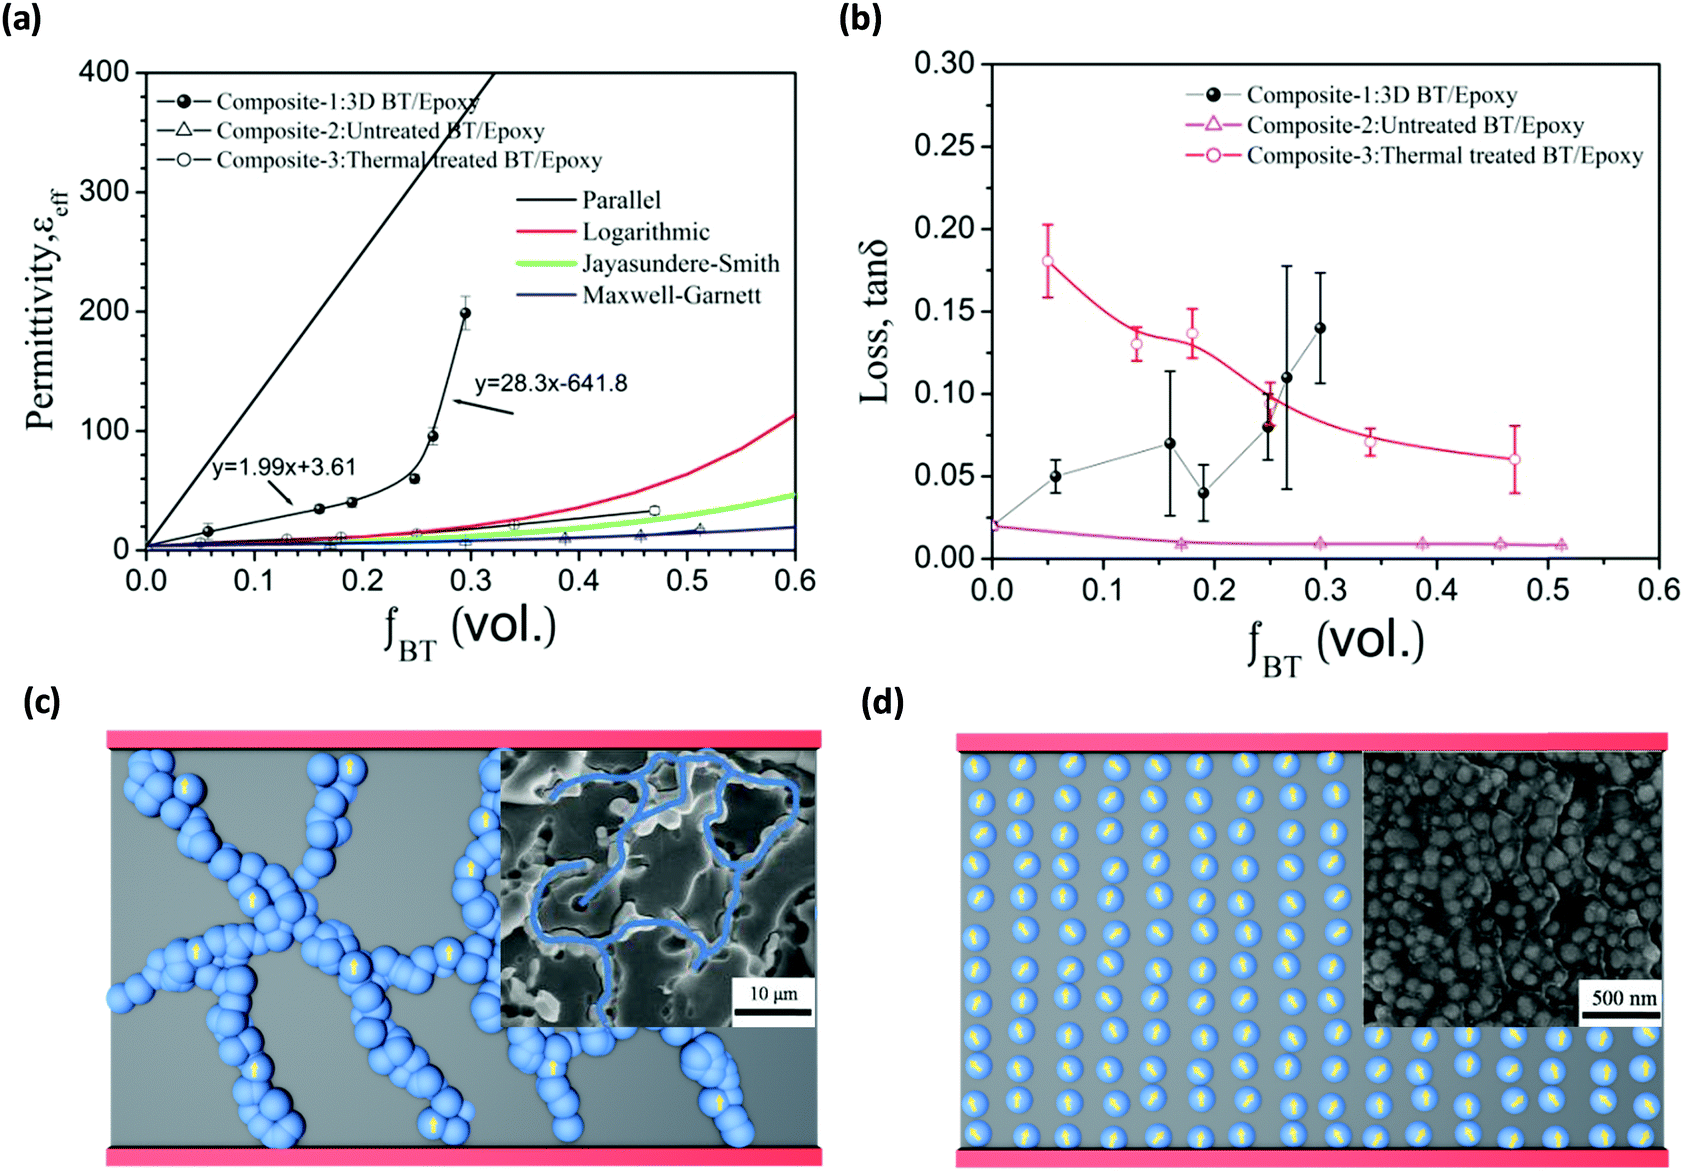
It is interesting but frustrating to note that ceramic particle fillers, even with extremely high permittivity, (e.g. εr ∼ 1000 or more) only lead to an effective permittivity of less than 50 for polymer composites. To find the relationship between filler content and the effective permittivity of polymer composites, researchers have proposed several theoretical models based on tremendous experimental results and certain assumptions considering shape, size, distance and connective structure of fillers.15 The typical models include the parallel model (eqn (S1)), series model (eqn (S2)), logarithmic model (eqn (S3)), Jayasundere–Smith model (eqn (S4)), and Maxwell–Garnett model (eqn (S5)). Among these models, the parallel model and series model give the upper limit and lower limit of effective permittivity (εeff) of polymer composites, respectively, and both are ideal models. This means that a rough range of εeff is limited for a two-phase composite, which lies in-between the two abovementioned models.
Based on the permittivities of BT (εr = 1235) and epoxy resin (εr = 3.6), εeff values are calculated according to the abovementioned theoretical models.14 As certified by most theoretical models and experimental results, the effective permittivity of inorganic/polymer composites is proportional to that of the polymer matrix (εm).20 Therefore, plots of εeff/εmvs. f (volume fraction of filler) are adopted, as shown in Fig. 1. Experimental results from the literature on ceramic particles or wires as fillers are inserted as dotted points in Fig. 1. The Maxwell–Garnett model is based on the basic assumptions of spherical particles, with permittivity εr2, dispersed in a continuous medium, with permittivity εr1, where εr2 ≫ εr1. The Jayasundere–Smith model is formulated based on the Maxwell–Garnett model, which considers the electric field interactions between spheres.21 The position of permittivity of the particle filled composites in Fig. 1 is dependent on the dispersion state of the fillers. The permittivity of composites with homogeneously dispersed fillers fit well with the Maxwell–Garnett model curve. The interactions between fillers are partial for real composites due to the randomly dispersed fillers. Therefore, it is clear that the reported results for particle filled composites are located between the regions of Jayasundere–Smith model and the Maxwell–Garnett model. Wires with a high-aspect-ratio are easily connected in order to enhance the dielectric properties of the composites.22 Thus, the εeff/εm of wire filled composites show higher values than those of particle filled composites and is located in the region between the logarithmic model and the Jayasundere–Smith model. All the calculated values of εeff/εm from the literature are less than 10.
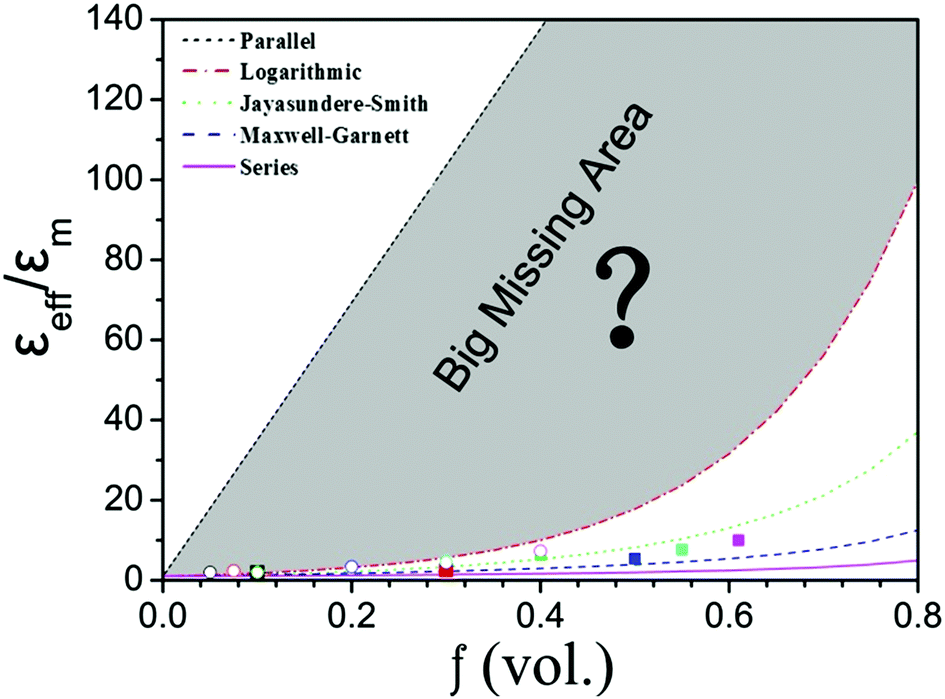 | ||
Fig. 1 Plots of εeff/εmvs. f calculated using various models for polymeric composites. The permittivities of BT (εr = 1235) and epoxy resin (εr = 3.6) are adopted as the permittivity of the filler and matrix for calculation, respectively. The data points presented as boxes and circles correspond to the cited experimental data at 1 kHz for polymer composites filled with high-permittivity particles and wires, respectively. ■23 24 24 25 25 26 26 27 27 28○2 28○2 11 11 16 16 22 22 22 22 13 13 | ||
To the best of our knowledge, and as shown in Fig. 1, the reported permittivities of high-εr ceramic filler filled composites are rarely higher than the predicted values by the logarithmic model, even with an ideally homogenous dispersion of fillers in the polymer matrix. As a result, the region between the parallel model and logarithmic model is empty. We define this region as the “missing area”. A big missing area gives evidence of the asymmetric function of high-εr ceramic fillers and low-εr polymer matrix in composites. The presented results are seriously inclined to the permittivity of the polymer matrix and the contribution of high-εr ceramic fillers is largely restricted. Therefore, it will be significantly meaningful to fill the missing area and achieve substantially improved permittivity.
In this research, we present a strategy to make a breakthrough in filling the big missing area shown in Fig. 1 by constructing a three-dimensional BaTiO3 (3D-BT) network in epoxy composites. Commercial nano-sized BT (100 nm) particles were employed as the raw materials because they possess high permittivity and their nano size facilitates sintering at high temperatures. The designed 3D-BT network, in which all the BT grains are connected tightly and form a porous scaffold, was realized through the process of ball milling, freeze-drying, and sintering of BT powder with lignocellulose, which acts as a skeleton, as illustrated in Fig. 2a. During the high-temperature sintering process, the BT particles were calcined together to form a 3D structure with lignocellulose being carbonized and removed. Epoxy composites were fabricated by injecting an epoxy solution into the porous BT network.
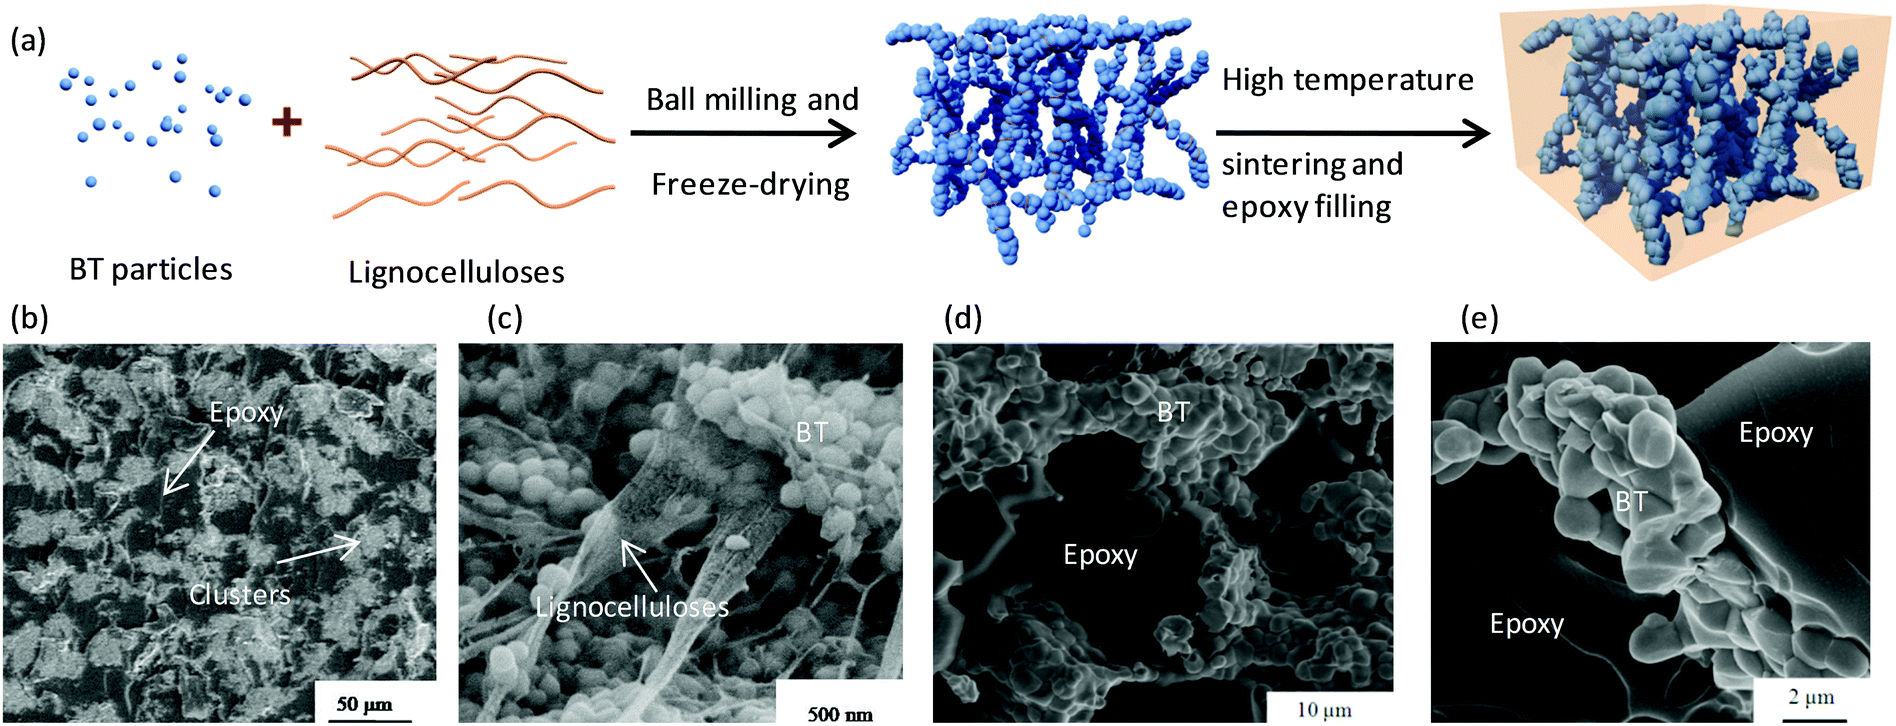 | ||
| Fig. 2 Material fabrication process and micro-structures. (a) Schematic of the preparation of the 3D BT/epoxy composites. (b and c) Cross-section SEM images of the freeze-dried BT–lignocellulose injected with epoxy resin. (d) Fractured-surface SEM image of the 3D BT/epoxy composites under low magnification. (e) Fractured-surface SEM image of the 3D BT/epoxy composites under high magnification. | ||
The freeze-dried BT–lignocellulose samples were easily damaged and hard for testing. Thus, they were filled with epoxy resin for characterization. The fractured surface morphology of the BT–lignocellulose filled with epoxy is shown in Fig. 2b, in which numerous BT–lignocellulose clusters are observed. The BT nanoparticle clusters were enwrapped and supported by the lignocelluloses, as shown in Fig. 2c. After burning off of the lignocellulose, the adjacent clusters were connected and formed a 3D-BT network (Fig. 2d). In addition, the BT particles grew by fusing with each other during the sintering process (Fig. 2e). The size of the BT grains is in the range of 0.5–1 μm.
The achieved permittivities of all the prepared 3D BT/epoxy composites (Composite-1) appear in the missing area, as displayed in Fig. 3a. The permittivity values of the composites quickly exceed the logarithmic curve, particularly when the filler content is higher than 25 vol%. Below 25 vol%, the fitted slope of the permittivity curve of Composite-1 is 1.99; even then, the composite with only 16 vol% 3D-BT reaches a high value of 34.5. As the fraction of 3D-BT is further increased, the permittivity approaches the upper limit simulated by the parallel model with the fitted slope of 28.3. The permittivity is about 60 for the composites with 25 vol% BT. The highest permittivity is about 200 at the filler loading of 30 vol%, which is 55 times larger than that of the epoxy resin (εr ∼ 3.6), which demonstrates the highest permittivity for a ceramic particle filled polymer composite ever reported.
 | ||
| Fig. 3 Dielectric properties and microstructures of the BT/epoxy composites. (a and b) Permittivity and loss tangent vs. fBT of the various composites measured at room temperature and 1 kHz. (c) Schematic of the 3D connected BT in the composites. Inset shows an SEM image of Composite-1. The blue curves are a guide for the eyes of the network structure of the connected BT. (d) Schematic of the randomly distributed BT particles in the composites. Inset shows an SEM image of Composite-2 filled with 100 nm BT particles. The yellow arrows in (c) and (d) show the direction of polarization. The red lines represent the electrodes of the capacitors. | ||
The percolation theory is widely employed to analyze an abrupt change in properties in heterogeneous materials, which is described by a simple power law,
| Properties ∝ |f − fc|±e, |
where e is a well-known critical exponent that varies with materials property and fc is the percolation threshold.29
As described in the percolation theory, a continuous cluster extends throughout the system as f approaches fc. In this study, the variation of the permittivity of Composite-1 with fBT shows a turn point at the filler content of 25 vol%, which falls in the threshold value range of 5–50 vol% depending on the microstructure of the heterogeneous composites.29 These results indicate that when fBT is lower than 25 vol%, the 3D-BT network is not fully formed throughout the entire system and thus the permittivity grows relatively slow and linearly with the 3D-BT content. As fBT further increases and approaches fc ∼ 25 vol%, the 3D network of BT becomes more complete and extends throughout the epoxy matrix, which results in a sharp increase in permittivity.
For comparison, the composites of pristine BT (100 nm) and the high temperature 1000 °C treated BT (0.5–1 μm) filled epoxy, denoted as Composite-2 and Composite-3, respectively, were prepared by milling, coating and curing a mixture of BT and epoxy resin in sequence.
The permittivities of Composite-2 and Composite-3 with varied BT volume fractions are also presented in Fig. 3a. As expected, the permittivities of both composites increase with the BT loading. In contrast to Composite-1, the permittivities of Composite-2 and Composite-3 fall in the area predicted by the logarithmic and Maxwell–Garnett models. The relatively higher permittivity of Composite-3 than Composite-2 is attributed to the higher permittivity of the heat-treated BT with a tetragonal crystal phase (Fig. S2, ESI†). The highest permittivities obtained of Composite-2 and -3 are 17.2 and 33.3 with a filler content of 52 vol% and 47 vol%, respectively, at 1 kHz and room temperature. The experimental results of Composite-2 perfectly fit the Maxwell–Garnett model. This means that the nanosized BT particles are homogeneously distributed in the composites. For Composite-3, its permittivities fit the logarithmic model at lower filler loading and fall in between the curves of the logarithmic model and Jayasundere–Smith models at higher loading. Compared with Composite-2 and -3, the permittivities of Composite-1 are surprisingly high.
The dielectric loss values of Composite-1 are mostly below 0.15, which are in-between that of Composite-2 and -3, as shown in Fig. 3b. The variation in the loss values of Composite-1 at a certain filler loading is due to the inhomogeneous state of the composite system. For the simply mixed Composite-2 and -3, the loss tangent decreases with the BT loading, which is attributed to the lower loss tangent of BT (tan![[thin space (1/6-em)]](https://www.rsc.org/images/entities/char_2009.gif) δ = 0.012) than epoxy resin (tanδ = 0.02).14 The relatively higher loss values of Composite-3 are caused by the poor dispersion of BT particles with a big grain size (see Fig. S3, ESI†).
δ = 0.012) than epoxy resin (tanδ = 0.02).14 The relatively higher loss values of Composite-3 are caused by the poor dispersion of BT particles with a big grain size (see Fig. S3, ESI†).
Table 1 summarizes the dielectric properties of the BT filled composites. The enhanced εeff/εm ratio of the 3D-BT filled composites is much higher than that of the particles filled composites, even those with bimodal fillers.30 BT nanowires (BTNW) and aligned BT are also beneficial for improving the permittivity of composites,22,34 although the constructed 3D-BT network in the composites in this study is much more efficient. For the 3D-BT/epoxy with only 30 vol%, in this study, its εeff of 200 and εeff/εm of 55.4 both are outstandingly high and its dielectric loss is at a low level of 0.04 at 1 kHz.
| Formulation | Size and shape | f BT (vol.) | ε eff, 1 kHz | ε eff/εm | tanδ, 1 kHz |
Ref. |
|---|---|---|---|---|---|---|
| BTNW/PVDF | Nanowires, aspect ratio = 45.8 | 30% | 44.3 | 3.52 | 0.04 | 22 |
| Aligned BT/epoxy | Particles, D50 = 2 μm | 20% | 32 | 8.9 | 0.035 | 34 |
| Mixed BT/epoxy | Particles, 65 nm and 590 nm | 50% | 58 | 16 | 0.023 | 30 |
| Composite-3 | Particles, 0.5–1 μm | 18% | 11 | 3.0 | 0.14 | This study |
| Composite-2 | Particles, 100 nm | 17% | 5.03 | 1.4 | 0.008 | |
| Composite-1 | 3D network, 0.5–1 μm | 16% | 34.5 | 9.6 | 0.07 | This study |
| 19% | 40 | 11 | 0.04 | |||
| 25% | 60 | 16.6 | 0.08 | |||
| 30% | 200 | 55.4 | 0.14 |
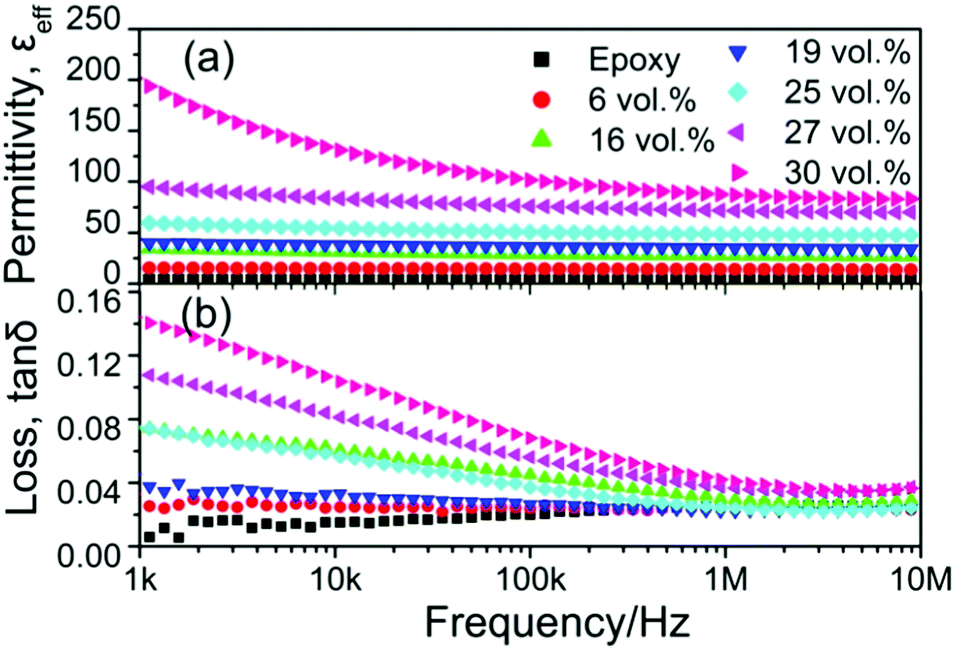
To better understand the dielectric behavior of the composites, schematic structures of 3D connected BT and randomly distributed BT in the composites are illustrated in Fig. 3c and d. In a homogeneous applied field, the polarization (P) and permittivity of a material have a relationship described by P/ε0E = εr − 1.14P is the sum of the electric dipole moment (μ) per unit volume (V), 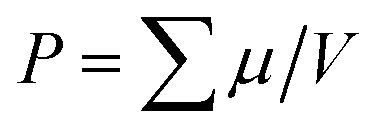 . μ is proportional to the polarizability (α) and local electric field or internal field (Eloc) of the particles. Without an external electric field, the direction of spontaneous polarization of the BT grains is randomly distributed and they offset each other. Uniformity of the polarization direction is beneficial for achieving high permittivity. The polarization state of ferroelectric materials was investigated using piezo-response force microscopy (PFM) in recent studies.31–33 It was found that the direction of polarization can be switched by applying an external electric field. In this study, the connected BT grains formed a 3D network without an epoxy resin layer lying in-between the adjacent BT grains in Composite-1, as shown in the inset of Fig. 3c. The Eloc of BT could be maximally improved owing to the continuous coupling effect of the interconnected adjacent BT grains. Therefore, rearrangement of the spontaneous polarization of BT takes place smoothly under an external electric field. As a result, the direction of polarization can be adjusted towards one direction, as shown in Fig. 3c, to produce a high μ, which leads to the efficiently increased permittivity of the composite. For Composite-2, nano sized BT particles are homogeneously dispersed and surrounded by epoxy resin (see the inset of Fig. 3d). The epoxy resin is a highly insulating material with a resistivity of 107 Ω m (Fig. S4, ESI†) although with weak polarization. Moreover, after applying the external electric filed, the rearrangement of the polarization direction in BT is restricted due to the weakened Eloc caused by the isolating epoxy layer, as shown in Fig. 3d. The weak rearrangement and low μ result in a slow increase in permittivity of Composite-2 and -3.
It is important to emphasize that the increased Eloc of BT in the 3D-BT/epoxy composites should be much higher than that of the agglomerations in the simply mixed composites, which can also cause an enhancement in permittivity. Agglomerations are inevitably produced with the size of several hundred nanometres to micrometers at high filler loading in the mixed composites. However, it should be noted that polymer matrix layers also exist between the agglomerations and fillers and are usually accompanied by pores that possess low permittivity. The existence of polymer matrix layers will largely reduce the effects of Eloc. As a result, composites with a high loading of fillers show little enhancement in permittivity.
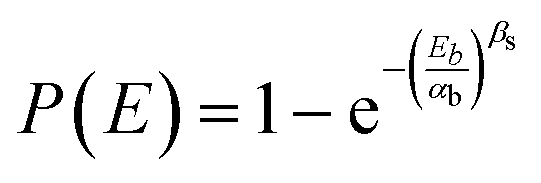
The dependence of the permittivity and loss tangent of Composite-1 on frequency is presented in Fig. 4. When the BT loading is lower than 25 vol%, the permittivity is almost independent of frequency. When the filler loading is further increased, the permittivity decreases at low frequency and stabilizes at high frequency. The permittivity is 84 at 10 MHz for Composite-1 with 30 vol% BT, which demonstrates the highest value at this frequency for any Pb-free ceramic filled polymer composite ever reported.15 The decrease of permittivity with frequency is a universal phenomenon in polymer composites, particularly for composites with a high filler content.10,13,17,35 This phenomenon relates to the contribution of interfacial polarization. The fillers are charged positively or negatively when a polymer possesses mobile charge carriers. The charges accumulated at the interface between the filler and polymer matrix form an electric double layer in such a way that the counter charge carriers with opposite polarity are diffused outward from the contact surface to the Debye shielding length.36–38 Interfacial polarization exists in almost all polymer composites and has a long relaxation time.14 Therefore, at low frequency, the interfacial polarization between the filler and polymer matrix in the high filler loading composites plays an important role in polarization. As the frequency of the electric field increases, the spinning of interfacial polarization cannot catch up with the change of frequency, which results in decreased permittivity.39 A similar tendency of loss tangent with frequency is observed in Fig. 4b. The loss tangent of Composite-1 varies below 0.15 in the frequency range of 1 kHz to 10 MHz. At 10 MHz, the loss tangents are 0.025, 0.025 and 0.04 for Composite-1 with the BT fraction of 16 vol%, 25 vol%, and 30 vol%, respectively.
 | ||
| Fig. 4 Frequency dependence of (a) permittivity and (b) loss tangent of Composite-1 with varied volume fractions of 3D-BT network. | ||
The breakdown strength is another important parameter of energy storage. The failure probability of Composite-1 with varied BT fractions was measured and analysed according to the Weibull distribution function, which is described as follows:40
 | (1) |
| ln[−ln(1 − P(E))] = βslnE − βslnαb | (2) |
As shown in Fig. 5a and b, the αb of epoxy is 587.45 kV cm−1 and this decreases to 489.35 kV cm−1 for the composite incorporated with 16 vol% BT and monotonically decreases to 266.27 kV cm−1 with a further increase in the filler loading to 30 vol%. The achieved αb of epoxy is a little higher than the reported results (250–450 kV cm−1).14 The dielectric breakdown is a result of the developing process of electrical treeing in the composites.10,41 With an increase in BT content, the 3D network of BT extends throughout the entire epoxy matrix, which causes a decrease in αb. Interestingly, the βs of all the tested samples of Composite-1 shows a value larger than 20, which indicates good dielectric reliability and that few defects are formed in the composites. The βs increases with the filler content and achieves the maximum value (βs = 26.36) at 25 vol%.
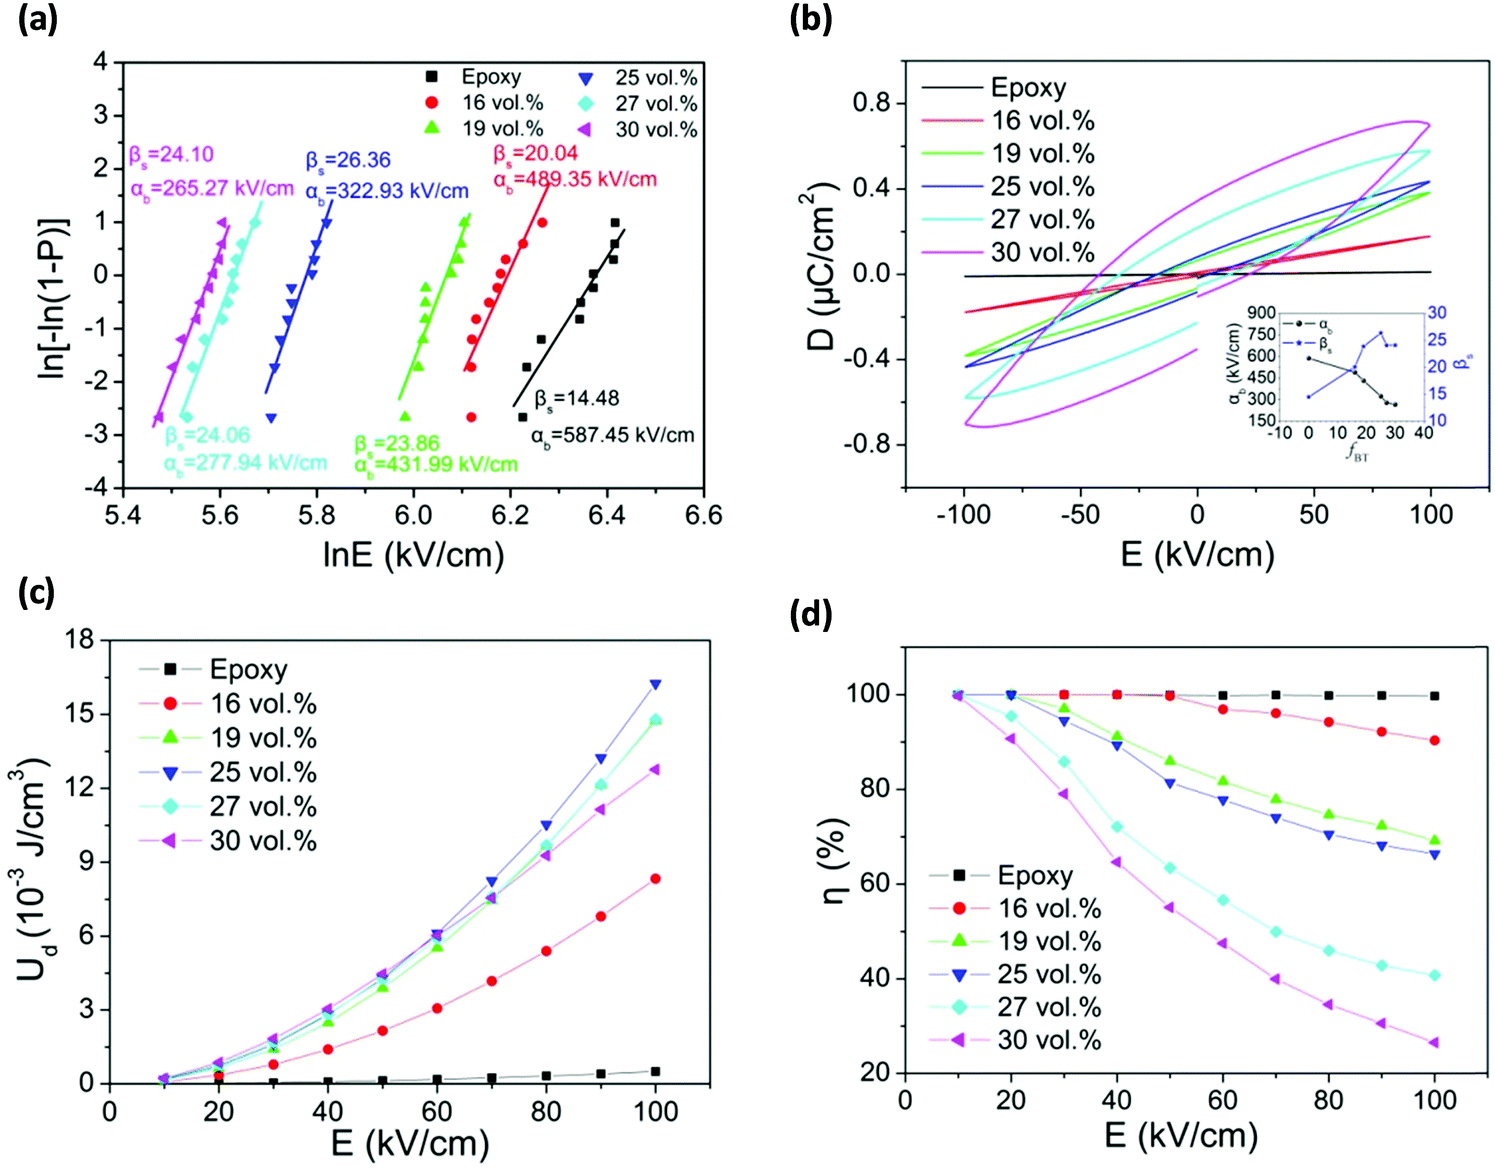 | ||
| Fig. 5 Energy storage properties of Composite-1. (a) Cumulative failure probability distribution of Composite-1 with different volume fractions of BT as a function of electric field. The Weibull breakdown strength (αb) and shape parameters (βs) were calculated from linear regressive fit and inserted. (b) D–E loops of Composite-1 under an electric field of 100 kV cm−1. The inset shows the variation of αb and βs with different volume fractions of BT. (c) Calculated discharged energy density (Ud) from the D–E loops of Composite-1 with different volume fractions of BT as a function of electric field. (d) Variation of charge–discharge efficiency (η) with electric field for Composite-1 with varied volume fractions of 3D-BT. | ||
In order to calculate the discharged energy density (Ud), D–E loops were measured at 100 Hz under the field of 100 kV cm−1 and room temperature, as shown in Fig. 5b. The maximum electric displacement (Dmax) increases from 0.01 μC cm−2 to 0.7 μC cm−2 as fBT increases from 0 to 30 vol%, which results from the enhanced permittivity. More interestingly, the Dmax of Composite-1 is much higher than that of Composite-3 when their permittivities are close, e.g. Dmax ∼ 0.18 μC cm−2 for Composite-1 with 16 vol% 3D-BT (εeff ∼ 34.5) and Dmax ∼ 0.04 μC cm−2 for Composite-3 with 47 vol% BT particles (εeff ∼ 33.3, see Fig. S5, ESI†). These results further confirm that the 3D connected BT is beneficial for enhancing polarization under an applied electric field. Moreover, the remnant polarization increases from 0.001 μC cm−2 to 0.35 μC cm−2 as fBT gradually increases. The energy density is calculated from the D–E loops based on the integral  .7 The variation of the calculated Ud of Composite-1 with the electric field is presented in Fig. 5c. The Ud increases with the electric field as a result of enhanced polarization. The Ud of the composites under 100 kV cm−1 increases with fBT, approaches the maximum value when fBT is 25 vol%, and then decreases. The achieved Ud values under 100 kV cm−1 of Composite-1 with 16 vol%, 25 vol% and 30 vol% BT are 8.3 × 10⁻³ J cm−3, 16.3 × 10⁻³ J cm−3 and 12.8 × 10⁻³ J cm−3, respectively. These results suggest that the composites exhibit a superior improvement in discharged energy density compared with the pure epoxy resin (Ud ∼ 0.5 × 10⁻³ J cm−3), and the enhancement is 16.6 times higher for Composite-1 with 16 vol% BT. Moreover, the enhancement is about 4 times larger than that of Composite-3 with 47 vol% BT particles (Ud ∼ 2.08 × 10⁻³ J cm−3, see Fig. S6, ESI†).
For the traditional mixing method, the improvement ratio of the composites to the pure polymer matrix is only 1 to 2 times.2 Therefore, the construction of a 3D-BT network in the polymer matrix is an efficient way to achieve high energy density. The improvement ratio of 16.6 times achieved in this study could be the highest value ever reported.
To better evaluate the energy storage property of the composites, the charge–discharge efficiency (η = discharge energy/charge energy × 100%) was calculated using the D–E loops, and the results are shown in Fig. 5d. With an increase in the electric field from 10 kV cm−1 to 100 kV cm−1, the η decreases with the filler content. The η values are 90.3%, 69.2%, 66.4%, 40.8% and 26.5% for Composite-1 with the BT content of 16 vol%, 19 vol%, 25 vol%, 27 vol%, and 30 vol%, respectively. η is related to the dielectric loss at high electric field, which contains the conduction loss and hysteresis loss,42–44 and both increase with the content of 3D-BT, which has a relatively lower resistivity than epoxy and ferroelectric behaviour. As a result, a high filler loading results in high remnant polarization and low η. Even though Composite-1 filled with 30 vol% 3D-BT achieved the highest permittivity, its low η restricted the improvement of Ud. Combining the factors of permittivity, remnant polarization, and η, Composite-1 filled with 25 vol% BT shows the highest Ud, as shown in Fig. 5c.
Since the parameters pertinent to energy storage include permittivity, breakdown strength, discharged energy density and charge–discharge efficiency, it is not an all-sided view with only some of them to judge a composite with high performance. In order to compare the properties more directly, a radar chart is presented in Fig. 6 based on the results of Composite-1 with 16 vol% BT, and the reported co-polymer P(VDF-CTFE) – 3% triallyl isocyanurate (TAIC) – 3% 1,4-bis(t-butyl peroxy) diisopropylbenzene denoted as C242 and polymer based composites prepared by the mixing method with 3 vol% TiO2 nanofibers embedded with BT nanoparticles denoted as BTO@TO_nfs2 and 10 vol% BTNW.16 Since the properties of the composites are related to the polymer matrix, the ratios of εeff/εm, Eb/Em and Ud/Um are adopted for comparison. εm, Em and Um are the permittivity, breakdown strength and discharged energy density of the original polymer matrix. The detailed data are listed in Table S1 (ESI†).
 | ||
| Fig. 6 Comparison of the properties of Composite-1 with 16 vol% 3D-BT and the reported co-polymer and polymer based composites filled with various fillers by the mixing method. Eb and Em represent the experimental breakdown strength of the composites and original polymer matrix, respectively. Ud and Um represent the discharged energy density of the composites and original polymer matrix, respectively. | ||
As shown in Fig. 6, Composite-1 with 16 vol% BT shows an extremely higher εeff/εm ∼ 9.6 and Ud/Um ∼ 16.6 compared with the other three composites, and the increment rate of Ud is the highest ever reported. For the traditional strategy, the improvement in energy density was mostly realized through holding or improving the breakdown strength while keeping εeff at a relatively low level; however, the E/Em ratios are usually less than 2. As a result, the ratios of Ud/Um are mostly below 2 for the previously reported results. In addition, the η of Composite-1 with 16 vol% BT is also higher than that of the others. This suggests that the new type of composites obtained in this study could produce less waste heat and possess long lifetimes.
In summary, a 3D interconnected BT network was designed and synthesized, which was used to fabricate polymer composites by injecting an epoxy solution into the porous structure. With 3D-BT loadings of 16 vol% to 30 vol%, high permittivities of 34.5–200 (εmax/εm ∼ 55) are achieved, which fill the missing area predicted in-between by the parallel model and the logarithmic model. The obtained high permittivity is due to the 3D-BT network, which is beneficial for the transmission of polarization in BT under an applied electric field. In addition, a high breakdown strength (αb ∼ 489.35 kV cm−1), high energy density (Ud ∼ 8.3 × 10⁻³ J cm−3 and Ud/Um ∼ 16.6 at 100 kV cm−1) and charge–discharge efficiency (η ∼ 90.3% under 100 kV cm−1) are obtained in the composite containing 16 vol% 3D-BT. The increments of permittivity and discharge energy density in comparison with the polymer matrix both achieve the highest values for dielectric energy storage composites ever reported. Therefore, this study provides a new avenue to design polymer based composites with high permittivity and energy storage density.
Acknowledgements
This study was financially supported by the National Natural Science Foundation of China (No. 51377157), the Guangdong Innovative Research Team Program (No. 2011D052) and Shenzhen Key Fundamental Research Program (JCYJ20160608160307181). The authors thank Dr Wenjie Li for helpful discussion on ferroelectric polarization and Zhonghua Wang for providing the cartoon.Notes and references
- G. Yu, X. Xie, L. Pan, Z. Bao and Y. Cui, Nano Energy, 2013, 2, 213–234 CrossRef CAS.
- X. Zhang, Y. Shen, B. Xu, Q. Zhang, L. Gu, J. Jiang, J. Ma, Y. Lin and C. W. Nan, Adv. Mater., 2016, 28, 2055–2061 CrossRef CAS PubMed.
- Z. M. Dang, M. S. Zheng and J. W. Zha, Small, 2016, 12, 1688–1701 CrossRef CAS PubMed.
- M. D. Bartlett, A. Fassler, N. Kazem, E. J. Markvicka, P. Mandal and C. Majidi, Adv. Mater., 2016, 28, 3726–3731 CrossRef CAS PubMed.
- Q. Li, L. Chen, M. R. Gadinski, S. Zhang, G. Zhang, H. Li, A. Haque, L. Q. Chen, T. Jackson and Q. Wang, Nature, 2015, 523, 576–579 CrossRef CAS PubMed.
- Q. Li and Q. Wang, Macromol. Chem. Phys., 2016, 217, 1228–1244 CrossRef CAS.
- B. Chu, X. Zhou, K. Ren, B. Neese, M. Lin, Q. Wang, F. Bauer and Q. M. Zhang, Science, 2006, 313, 334–336 CrossRef CAS PubMed.
- S. Wang, X. Huang, G. Wang, Y. Wang, J. He and P. Jiang, J. Phys. Chem. C, 2015, 119, 25307–25318 CAS.
- X. Lin, P. Hu, Z. Jia and S. Gao, J. Mater. Chem. A, 2016, 4, 2314–2320 CAS.
- Y. Shen, D. Shen, X. Zhang, J. Jiang, Z. Dan, Y. Song, Y. Lin, M. Li and C.-W. Nan, J. Mater. Chem. A, 2016, 4, 8359–8365 CAS.
- S. Liu, S. Xue, S. Xiu, B. Shen and J. Zhai, Sci. Rep., 2016, 6, 26198 CrossRef CAS PubMed.
- S. Luo, S. Yu, R. Sun and C. P. Wong, ACS Appl. Mater. Interfaces, 2014, 6, 176–182 CAS.
- H. Tang, Z. Zhou, C. C. Bowland and H. A. Sodano, Nano Energy, 2015, 17, 302–307 CrossRef CAS.
- Prateek, V. K. Thakur and R. K. Gupta, Chem. Rev., 2016, 116, 4260–4317 CrossRef CAS PubMed.
- Z.-M. Dang, J.-K. Yuan, J.-W. Zha, T. Zhou, S.-T. Li and G.-H. Hu, Prog. Mater. Sci., 2012, 57, 660–723 CrossRef CAS.
- G. Wang, X. Huang and P. Jiang, ACS Appl. Mater. Interfaces, 2015, 7, 18017–18027 CAS.
- K. Yang, X. Huang, J. He and P. Jiang, Adv. Mater. Interfaces, 2015, 2, 1–10 Search PubMed.
- Y. Niu, Y. Bai, K. Yu, Y. Wang, F. Xiang and H. Wang, ACS Appl. Mater. Interfaces, 2015, 7, 24168–24176 CAS.
- H. Luo, D. Zhang, C. Jiang, X. Yuan, C. Chen and K. Zhou, ACS Appl. Mater. Interfaces, 2015, 7, 8061–8069 CAS.
- M. Lai, S. Yu, R. Sun, X. Zeng, S. Luo and C.-P. Wong, Compos. Sci. Technol., 2013, 89, 127–133 CrossRef CAS.
- N. Jayasundere and B. V. Smith, J. Appl. Phys., 1993, 73, 2462 CrossRef.
- H. Tang, Z. Zhou and H. A. Sodano, ACS Appl. Mater. Interfaces, 2014, 6, 5450–5455 CAS.
- L. Gao, J. He, J. Hu and Y. Li, J. Phys. Chem. C, 2014, 118, 831–838 CAS.
- T. Zhou, J. W. Zha, R. Y. Cui, B. H. Fan, J. K. Yuan and Z. M. Dang, ACS Appl. Mater. Interfaces, 2011, 3, 2184–2188 CAS.
- J. Fu, Y. Hou, M. Zheng, Q. Wei, M. Zhu and H. Yan, ACS Appl. Mater. Interfaces, 2015, 7, 24480–24491 CAS.
- K. Yu, H. Wang, Y. Zhou, Y. Bai and Y. Niu, J. Appl. Phys., 2013, 113, 034105 CrossRef.
- K. Yu, Y. Niu, Y. Zhou, Y. Bai, H. Wang and C. Randall, J. Am. Ceram. Soc., 2013, 96, 2519–2524 CrossRef CAS.
- B. Luo, X. Wang, Y. Wang and L. Li, J. Mater. Chem. A, 2014, 2, 510 CAS.
- C. W. Nan, Y. Shen and J. Ma, Annu. Rev. Mater. Res., 2010, 40, 131–151 CrossRef CAS.
- J. Xu, S. Bhattacharya, P. Pramanik and C. P. Wong, J. Electron. Mater., 2006, 35, 2009–2015 CrossRef CAS.
- S. V. Kalinin, A. Gruverman, B. J. Rodriguez, J. Shin, A. P. Baddorf, E. Karapetian and M. Kachanov, J. Appl. Phys., 2005, 97, 074305 CrossRef.
- B. J. Rodriguez, S. Jesse, S. V. Kalinin, J. Kim, S. Ducharme and V. M. Fridkin, Appl. Phys. Lett., 2007, 90, 122904 CrossRef.
- K. Y. Lee, S. K. Kim, J.-H. Lee, D. Seol, M. K. Gupta, Y. Kim and S.-W. Kim, Adv. Funct. Mater., 2016, 26, 3067–3073 CrossRef CAS.
- D. S. Kim, C. Baek, H. J. Ma and D. K. Kim, Ceram. Int., 2016, 42, 7141–7147 CrossRef CAS.
- S. Cho, J. S. Lee and J. Jang, Adv. Mater. Interfaces, 2015, 2, 1500098 CrossRef.
- D. Dhakras and S. Ogale, Adv. Mater. Interfaces, 2016, 3, 1600492 CrossRef.
- Z. M. Dang, J. K. Yuan, S. H. Yao and R. J. Liao, Adv. Mater., 2013, 25, 6334–6365 CrossRef CAS PubMed.
- T. Tanaka, M. Kozako, N. Fuse and Y. Ohki, IEEE Trans. Dielectr. Electr. Insul., 2005, 12, 669 CrossRef CAS.
- S. Liu and J. Zhai, J. Mater. Chem. A, 2015, 3, 1511–1517 CAS.
- S. K. Ghosh, W. Rahman, T. R. Middya, S. Sen and D. Mandal, Nanotechnology, 2016, 27, 215401 CrossRef PubMed.
- Y. Shen, Y. Hu, W. Chen, J. Wang, Y. Guan, J. Du, X. Zhang, J. Ma, M. Li, Y. Lin, L.-q. Chen and C.-W. Nan, Nano Energy, 2015, 18, 176–186 CrossRef CAS.
- P. Khanchaitit, K. Han, M. R. Gadinski, Q. Li and Q. Wang, Nat. Commun., 2013, 4, 2845 Search PubMed.
- Q. Li, K. Han, M. R. Gadinski, G. Zhang and Q. Wang, Adv. Mater., 2014, 26, 6244–6249 CrossRef CAS PubMed.
- Q. Li, G. Zhang, F. Liu, K. Han, M. R. Gadinski, C. Xiong and Q. Wang, Energy Environ. Sci., 2015, 8, 922–931 CAS.
Footnote |
| † Electronic supplementary information (ESI) available: Experimental details, structure characterization and more dielectric measurements. See DOI: 10.1039/c6ee03190k |
| This journal is © The Royal Society of Chemistry 2017 |