 Open Access Article
Creative Commons Attribution 3.0 Unported Licence
The role of trinuclear species in a palladium acetate/trifluoroacetic acid catalytic system†
Jiří
Váňa
 *a,
Jan
Lang
 b,
Mária
Šoltésová
b,
Jiří
Hanusek
a,
Aleš
Růžička
b,
Mária
Šoltésová
b,
Jiří
Hanusek
a,
Aleš
Růžička
 c,
Miloš
Sedlák
a and
Jana
Roithová
 d
d
aInstitute of Organic Chemistry and Technology, Faculty of Chemical Technology, University of Pardubice, Studentská 573, 53210 Pardubice, Czech Republic. E-mail: jiri.vana@upce.cz
bDepartment of Low Temperature Physics, Faculty of Mathematics and Physics, Charles University, V Holešovičkách 2, 18000 Prague 8, Czech Republic
cDepartment of General and Inorganic Chemistry, Faculty of Chemical Technology, University of Pardubice, Studentská 573, 53210 Pardubice, Czech Republic
dDepartment of Organic Chemistry, Faculty of Science, Charles University, Hlavova 2030/8, 12843 Prague 2, Czech Republic
First published on 1st November 2017
Abstract
Reactions catalyzed by palladium(II) acetate and trifluoroacetic acid (TFA) have a clear preactivation phase. However, the structure of real catalytic species remains unclear. We show that the key species are cyclic trinuclear complexes of composition [Pd3(OAc)6−x(OTFA)x] (x = 1–6) formed by a sequential ligand exchange from [Pd3(OAc)6]. Furthermore, we prove that the trinuclear palladium backbone of the precatalyst remains preserved during the first phase of the C–H activation reaction of acetanilides. In other words, the reaction pathway including the trinuclear species should be taken into account in discussion about mechanisms of the reactions catalyzed by palladium acetates.
Introduction
Knowledge of the exact structures of reactants, catalytic species and reaction intermediates has a crucial importance for understanding chemical reactions. Detailed mechanistic studies are rather scarce and their results are often not accounted for in simplified mechanistic pictures. Catalysis by palladium(II) acetate could serve as an example. Despite the fact that it is one of the most widely used catalysts or catalytic precursors for many years,1 its active forms and common impurities affecting its reactivity strongly have been described only recently.2 Furthermore, even though its trimeric cyclic structure is well documented3 (Fig. 1a) and characterized trinuclear complexes (Fig. 1b)4 indicate that the trinuclear backbone might be involved in the first steps of the catalytic cycles, the experimental link confirming the involvement of these catalytic species is still missing.5 The concept of the trinuclear complexes as the catalytically active species in C–H activations is not straightforward; therefore most of the proposed reaction schemes do not take trinuclear intermediates into account.6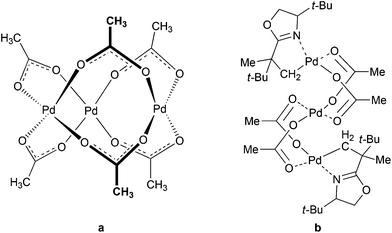 | ||
| Fig. 1 Cyclic structure of Pd3(OAc)6 (a) and trinuclear C–H activated complex with oxazoline5b (b). | ||
We encountered this issue in our previous mechanistic work, where we were using the reaction protocol popularized by Fujiwara based on the combination of palladium acetate with trifluoroacetic acid7 for the C–H activation reaction of acetanilides. We observed a different kinetic behavior in dependence on the sequence, in which the individual reaction components were mixed.8 This indicated that the formation of a precatalyst from palladium acetate and TFA is an important reaction step and raised the question “What is the structure of the precatalyst and what is its role in the subsequent reaction steps?”. Only few studies are devoted to studying the behavior of palladium acetate in the presence of TFA or the behavior of palladium(II) trifluoroacetate in solution. Most of them propose a breakup of the trinuclear cyclic palladium skeleton and formation of smaller units. Wilkinson et al. determined that palladium(II) trifluoroacetate is monomeric in ethyl acetate.9 Swang et al. proposed a three step formation of monomeric square planar [Pd(OTFA)2(HOAc)2] that undergoes a slow oligomerization.10 Furthermore, [Pd(OTFA)]+ and [(OTFA)2Pd(TFA)3]+ were proposed to be the active species in hydroarylations.11 Finally, Lu et al. observed a different product distribution in dependence on the amount of TFA added to palladium acetate.12
Results and discussion
Ligand exchange in the Pd3(OAc)6/TFA system
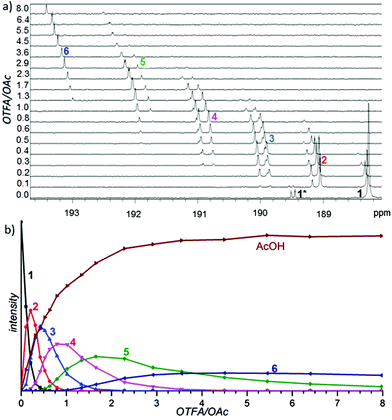
In the first set of experiments, we focused our attention on the nature of the precatalyst formed by a combination of palladium(II) acetate with TFA. We sequentially added TFA to the solution of palladium acetate in CD2Cl2 and recorded the 1H, 13C and 19F NMR spectra (Fig. 2a for carbonyl and Fig. S1–S5† for methyl and trifluoromethyl groups).There are seven groups of signals (1–7) whose gradual appearance and disappearance is dependent on the added amount of TFA. In the first spectra (without addition of TFA) there are only signals corresponding to cyclic trimeric [Pd3(OAc)6] (1) accompanied by signals corresponding to [Pd3(μ2-OH)(OAc)5] (1*).2c,e With increasing amount of added TFA the signals of [Pd3(OAc)6] (1) decrease and a new downfield shifted group of signals (2) appears. After reaching the maximum of its intensity it starts to decrease again, while the next downfield shifted group of signals (3) appears. This behavior is repeated until there is only the group of signals (7) left in the last spectra of the series. Its intensity is increasing along with increasing OTFA/OAc ratio.13 Next, during the additions, signals corresponding to the released acetic acid grow. The signal pattern within each of the signal groups (1–7) remains constant during the addition.
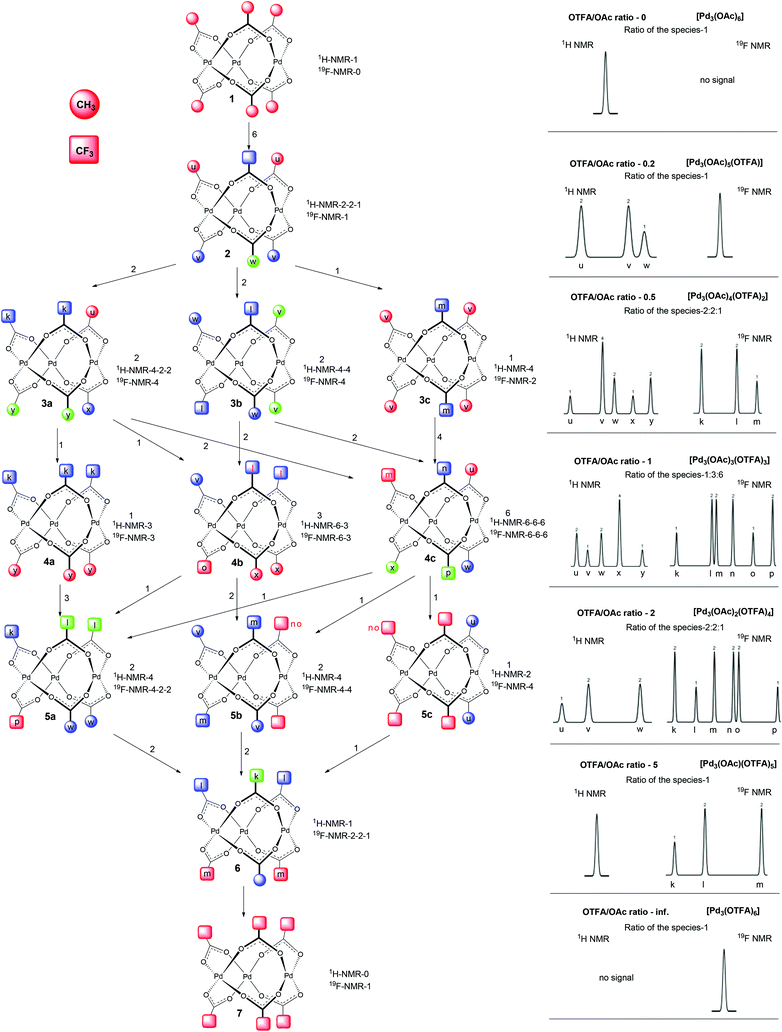
Deeper insight into the structure of the individual species included in the groups could be attained using detailed analysis of signal patterns of individual signal groups. These signal patterns together with signal integrals obtained by detailed analysis from 1H and 19F NMR data are depicted in the right side of Scheme 1 or in more detail in Fig. S7.†
Comparison of the patterns shows central symmetry. It means that the pattern of the signal group 1 in 1H NMR spectra is a mirror image of 7 in 19F NMR spectra. The same can be found for 1H and 19F NMR spectra of 2 and 6, 3 and 5 and, finally, 4 in the 1H NMR spectra is a mirror image of 4 in the 19F NMR spectra. Observed symmetry is strong evidence for the preservation of a cyclic triangular motif during the sequential exchange of ligands. Furthermore, the plots of the total intensities of each group of the signals against the ratio of OTFA/OAc (Fig. 2b and Fig. S6†) show that the maximum concentrations of the species 2, 3, 4, 5 and 6 occur at the OTFA/OAc ratios: 0.2, 0.5, 1, 2 and 5, respectively. These ratios are in perfect agreement with the ligand ratios in complexes [Pd3(OAc)6] (1), [Pd3(OAc)5(OTFA)] (2), [Pd3(OAc)4(OTFA)2] (3), [Pd3(OAc)3(OTFA)3] (4), [Pd3(OAc)2(OTFA)4] (5), [Pd3(OAc)(OTFA)5] (6) and [Pd3(OTFA)6] (7). The overall view on consecutive ligand exchange in dependence of amount of added TFA is depicted in Scheme 1.
At the beginning there exists only trimeric cyclic [Pd3(OAc)6](1) contaminated by a small amount of [Pd3(μ2-OH)(OAc)5](1*). At the OTFA/OAc ratio 0.2 one acetate ligand is exchanged for trifluoroacetate and the dominant species is [Pd3(OAc)5(OTFA)](2) which should show one signal of the CF3 group in 19F NMR spectra and due to the distinct environment three different signals of CH3 groups (2![[thin space (1/6-em)]](https://www.rsc.org/images/entities/char_2009.gif) :
:![[thin space (1/6-em)]](https://www.rsc.org/images/entities/char_2009.gif) 2
2![[thin space (1/6-em)]](https://www.rsc.org/images/entities/char_2009.gif) :
:![[thin space (1/6-em)]](https://www.rsc.org/images/entities/char_2009.gif) 1 ratio) in 1H NMR spectra.
1 ratio) in 1H NMR spectra.
At the ratio 0.5, the most abundant species is [Pd3(OAc)4(OTFA)2]. However, there are three possible isomeric structures 3a, b, and c (Scheme 1) corresponding to this formula. 3a with two neighboring trifluoroacetates should show three signals for methyl groups in 2![[thin space (1/6-em)]](https://www.rsc.org/images/entities/char_2009.gif) :
:![[thin space (1/6-em)]](https://www.rsc.org/images/entities/char_2009.gif) 1
1![[thin space (1/6-em)]](https://www.rsc.org/images/entities/char_2009.gif) :
:![[thin space (1/6-em)]](https://www.rsc.org/images/entities/char_2009.gif) 1 ratio in 1H NMR spectra and one signal of CF3 group in 19F NMR spectra. 3b containing trifluoroacetates on the opposite sides of the palladium triangle should have two signals (1
1 ratio in 1H NMR spectra and one signal of CF3 group in 19F NMR spectra. 3b containing trifluoroacetates on the opposite sides of the palladium triangle should have two signals (1![[thin space (1/6-em)]](https://www.rsc.org/images/entities/char_2009.gif) :
:![[thin space (1/6-em)]](https://www.rsc.org/images/entities/char_2009.gif) 1) in 1H NMR spectra and one signal in 19F NMR spectra. Finally, 3c with trifluoroacetates bridging one pair of palladium atoms from both sides should give one signal in 1H NMR spectra and one in 19F NMR spectra. In order to obtain an observed signal pattern for this set 3 with signal integrals 1,2,2,2,1,2 (Scheme 1) the three possible isomers 3a, b, and c must be present in the ratio 2
1) in 1H NMR spectra and one signal in 19F NMR spectra. Finally, 3c with trifluoroacetates bridging one pair of palladium atoms from both sides should give one signal in 1H NMR spectra and one in 19F NMR spectra. In order to obtain an observed signal pattern for this set 3 with signal integrals 1,2,2,2,1,2 (Scheme 1) the three possible isomers 3a, b, and c must be present in the ratio 2![[thin space (1/6-em)]](https://www.rsc.org/images/entities/char_2009.gif) :
:![[thin space (1/6-em)]](https://www.rsc.org/images/entities/char_2009.gif) 2
2![[thin space (1/6-em)]](https://www.rsc.org/images/entities/char_2009.gif) :
:![[thin space (1/6-em)]](https://www.rsc.org/images/entities/char_2009.gif) 1. This ratio is in perfect agreement with the statistical distribution of the species. For illustration, there are two ways how to obtain 3a from 2 (Scheme 1) (i.e. substitution of red acetates (u) in 2), two ways how to obtain 3b (substitution of blue acetates (v) in 2) and one way how to obtain 3c (substitution of green acetate (w) in 2). There is an overlap of two signals with very similar chemical surrounding, giving one signal with integral value 4 (3v) instead of two signals with integral values of 2 in the 1H NMR signal pattern of set 3 (Scheme 1). Better resolved 19F NMR spectra of analogous species 5 show these two signals to be separated (3n, 3o). Note that species 3 are analogous to the species 5 only with inverse ligand distribution.
1. This ratio is in perfect agreement with the statistical distribution of the species. For illustration, there are two ways how to obtain 3a from 2 (Scheme 1) (i.e. substitution of red acetates (u) in 2), two ways how to obtain 3b (substitution of blue acetates (v) in 2) and one way how to obtain 3c (substitution of green acetate (w) in 2). There is an overlap of two signals with very similar chemical surrounding, giving one signal with integral value 4 (3v) instead of two signals with integral values of 2 in the 1H NMR signal pattern of set 3 (Scheme 1). Better resolved 19F NMR spectra of analogous species 5 show these two signals to be separated (3n, 3o). Note that species 3 are analogous to the species 5 only with inverse ligand distribution.
At the OTFA/OAc ratio 1, the most abundant species are those with the composition [Pd3(OAc)3(OTFA)3]. Again, there exist three possible structures 4a, b, and c that could be formed statistically from 3a, b, and c. Their distribution in 1![[thin space (1/6-em)]](https://www.rsc.org/images/entities/char_2009.gif) :
:![[thin space (1/6-em)]](https://www.rsc.org/images/entities/char_2009.gif) 3
3![[thin space (1/6-em)]](https://www.rsc.org/images/entities/char_2009.gif) :
:![[thin space (1/6-em)]](https://www.rsc.org/images/entities/char_2009.gif) 6 ratios perfectly agree with the obtained NMR data and signal patterns.
6 ratios perfectly agree with the obtained NMR data and signal patterns.
The same expectation is valid for the presence and signal patterns of the three isomers of 5 (5a, b, c) that occur in the ratio 2![[thin space (1/6-em)]](https://www.rsc.org/images/entities/char_2009.gif) :
:![[thin space (1/6-em)]](https://www.rsc.org/images/entities/char_2009.gif) 2
2![[thin space (1/6-em)]](https://www.rsc.org/images/entities/char_2009.gif) :
:![[thin space (1/6-em)]](https://www.rsc.org/images/entities/char_2009.gif) 1 and the structure and signal patterns of species 6 [Pd3(OAc)(OTFA)5] and 7 [Pd3(OTFA)6]. Those later mentioned complexes could exist only in one isomeric form.
1 and the structure and signal patterns of species 6 [Pd3(OAc)(OTFA)5] and 7 [Pd3(OTFA)6]. Those later mentioned complexes could exist only in one isomeric form.
The signals of individual methyl (depicted as letters u, v, w, x, y, z) and trifluoromethyl (k, l, m, n, o, p) groups in Scheme 1 were assigned according to the following observations: The more CF3 groups are present on the same palladium triangle side, the higher the downfield shift of groups on the same side is to be (e.g. in structure 2 the 2u methyl groups are more downfield shifted then 2v and 2w ones) (Scheme 1). The opposition of the CH3 group causes higher downfield shift than opposition of the CF3 group (e.g. the 3v methyl groups in 3b are more downfield shifted than the 3w ones).
Fig. 2b and integral intensities within each group of signals show that the populations of the complexes are controlled only by the OTFA/OAc ratio and the population of different isomers within each type of complex follows binomial statistics, i.e. no particular isomer is energetically favored.
In order to exclude the presence of smaller precatalytic units containing one or two metal centers, we measured 1H and 19F DOSY NMR spectra. The determined diffusion coefficients (Table S1†) of all palladium containing species present at the individual OTFA/OAc ratios are identical within the range of experimental error and account for different molar weights of acetate and trifluoroacetate residues. All these observations prove that trimeric cyclic species [Pd3(OAc)6] undergo a sequential exchange of acetate ligands for trifluoroacetate ones while the triangular cyclic motif is preserved.
Next, we focused our attention on the dynamic behavior of the species. Reversibility of ligand exchange was tested by the addition of acetic acid to the solution prepared at a defined OTFA/OAc ratio. Upon addition of acetic acid, the overall signal pattern changes to the pattern corresponding to a lower OTFA/OAc ratio which proves the reversibility (Fig. S8 and 9†). Also, we attempted to test the ligand exchange in solution of commercially available palladium trifluoroacetate in CD2Cl2. However, it did not dissolve in an amount detectable by NMR spectroscopy neither alone nor upon the addition of acetic or trifluoroacetic acid. This indicates that it has a different structure (most probably polymeric) and does not easily transform into the cyclic trimeric complexes [Pd3(OAc)6−x(OTFA)x] in solution.
Lastly, we probed the kinetics of the ligand exchange process in the precatalyst by NMR spectroscopy. The experimental sequence of adding TFA to palladium(II) acetate solution and then setting up the NMR experiment allowed us to obtain the first spectra only in about 50 seconds after initiation of the reaction. This leads to a loss of information about the first ligand exchanges, but still permits monitoring of the ligand exchange in the species with more trifluoroacetate ligands (Fig. S10 and 11†). The gradual disappearance of the signals corresponding to the species with a smaller number of OTFA ligands (3, 4) correlates well with the growing intensity of the signals corresponding to the species with a higher number of the OTFA ligands (5, 6), which is a confirmation of the sequential ligand exchange. Qualitatively, the solution mixture is equilibrated within several minutes. The fact that the exchange occurs in the minute rather than in the second timescale is further supported by the fact that no ligand exchange was detected by 1H or 19F EXSY measurements.
C–H activation of acetanilides
With the knowledge of the precatalyst's structure and dynamics, we turned our attention to its behavior in a real reaction. We chose the C–H activation of acetanilides as a model reaction. Previous experiments showed that the mixing of acetanilide with palladium acetate and TFA in DCM leads to the formation of cyclopalladated acetanilide in a dimeric form (Scheme 2). This step is analogous to many other palladium catalyzed ortho-functionalizations directed by a remote coordination function.14 | ||
| Scheme 2 Schematic representation of C–H activation of acetanilides by palladium(II) acetate and TFA. | ||
At the beginning, we examined the necessity of TFA for the C–H activation reaction. The reaction mixture, containing equimolar amounts of acetanilide and palladium acetate in CD2Cl2, was monitored for 24 hours. There was no spectral change observed during the measurement and only the signals of the starting compounds were present (Fig. S12†). Hence, TFA has to be present in the reaction mixture in order to initiate the reaction.
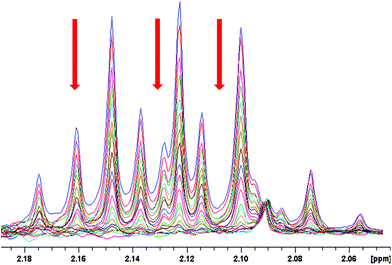
Next, we carried out several NMR measurements of the reaction kinetics. The precatalyst was prepared by the addition of TFA to palladium acetate dissolved in CD2Cl2. After 10 minutes, 3-bromoacetanilide was added and the reaction kinetics was followed. The shape of the 1H and 19F signals of the precatalyst remains constant, but the spectral intensities decrease with time (Fig. 3 and S13†). Based on the assumption of a lower bridging effectivity of trifluoroacetate compared to acetate3g and thus higher reactivity of the complexes containing trifluoroacetate ligands it could be expected that the most reactive triangular species are those containing the highest number of trifluoroacetate ligands. Nevertheless, the fast equilibration of the mixture with the free acids present in solution ensures repopulation of the most reactive complexes and thus preservation of the overall NMR signal pattern of the precatalyst. During the reaction course, we detected only the signals of acetates and trifluoroacetates corresponding to the starting precatalyst and the products; no other palladium complexes were observed. This suggests that the precatalytic trinuclear palladium motif remains preserved during the C–H activation process and the complexes do not undergo fragmentation to smaller units.
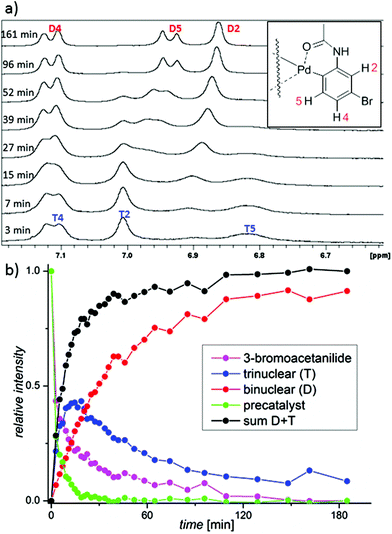
The formation of the C–H activated products can be best monitored in the range of the NMR signals of 3-bromoacetanilide. The decrease of the signals of the starting material is correlated with an increase of the signals corresponding to two types of the products (Fig. 4 and S14–16†). Their occurrence is dependent on time and the reactant stoichiometry (Fig. S17†). The reaction first leads to the product T. Next, signals corresponding to the second product D appear and later they become dominant. At the end of the reaction, only the signals of the product D are detected. The NMR kinetics clearly shows that the reaction proceeds in the following consecutive steps: 3-bromoacetanilide + [Pd3(OAc)6−x(OTFA)x] → complex T![[thin space (1/6-em)]](https://www.rsc.org/images/entities/char_2009.gif) 15 → complex D (Fig. 4b).
15 → complex D (Fig. 4b).
Both complexes were characterized by diffraction techniques (Fig. 5; for experimental details and discussion see the ESI S18–20†). Complex D is yellow and corresponds to the known binuclear dimeric complex where two palladium atoms are bound to the carbon atoms of two activated acetanilide units and they are connected by two bridging trifluoroacetates (Fig. 5). In order to trap complex T, we used the acetanilide in a sub-stoichiometric amount with respect to palladium acetate. After about 2 hours, greenish crystals crystallized from the solution. The analysis revealed that complex T has a linear trinuclear structure. The activated acetanilide units are bound to the palladium atoms at both ends of the complex in the anti-orientation (Fig. 5). Both complexes were isolated from a solution containing a large excess of trifluoroacetic acid. In solutions with a lower OTFA/OAc ratio, analogous complexes containing one or more acetate ligands instead of trifluoroacetates are most probably present (for an indirect proof of their existence see Fig. S22†).
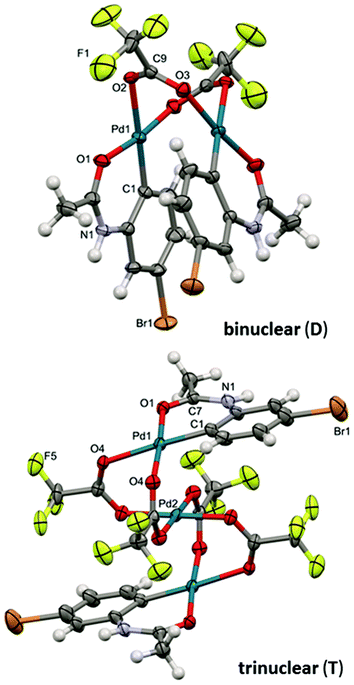 | ||
| Fig. 5 The ORTEP structures of binuclear (D) and trinuclear (T) complexes. Thermal ellipsoids set at 35% probability. Hydrogen atoms are omitted for clarity. | ||
In synthesis, palladium acetate is used in a catalytic amount related to acetanilide. Therefore, we performed the kinetic measurements at different palladium-to-acetanilide ratios (Fig. S17–21†). The increasing ratio of acetanilide results in a decrease of the observable amount of the complex T (Fig. 6). This can be explained in such a way that the unstable trinuclear complex T is transformed to the stable binuclear complex D by the attack of a molecule of substrate. Thus complex T behaves as a reactive intermediate under catalytic arrangement.
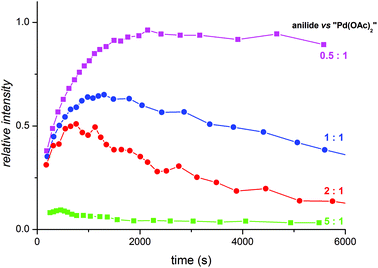 | ||
Fig. 6 Relative abundances of the trinuclear complex T obtained from NMR kinetic measurements at acetanilide![[thin space (1/6-em)]](https://www.rsc.org/images/entities/char_2009.gif) : :![[thin space (1/6-em)]](https://www.rsc.org/images/entities/char_2009.gif) palladium acetate ratios 0.5 palladium acetate ratios 0.5![[thin space (1/6-em)]](https://www.rsc.org/images/entities/char_2009.gif) : :![[thin space (1/6-em)]](https://www.rsc.org/images/entities/char_2009.gif) 1 (violet), 1 1 (violet), 1![[thin space (1/6-em)]](https://www.rsc.org/images/entities/char_2009.gif) : :![[thin space (1/6-em)]](https://www.rsc.org/images/entities/char_2009.gif) 1 (blue), 2 1 (blue), 2![[thin space (1/6-em)]](https://www.rsc.org/images/entities/char_2009.gif) : :![[thin space (1/6-em)]](https://www.rsc.org/images/entities/char_2009.gif) 1 (red) and 5 1 (red) and 5![[thin space (1/6-em)]](https://www.rsc.org/images/entities/char_2009.gif) : :![[thin space (1/6-em)]](https://www.rsc.org/images/entities/char_2009.gif) 1 (green). 1 (green). | ||
Furthermore, the instability of the trinuclear complex T under reaction conditions can serve as an indirect proof of C–H activation proceeding via a trinuclear species. The alternative pathway5b involving the C–H activation step that occurs on monopalladium species and is followed by the formation of an unstable trinuclear complex T from mono-palladacycles seems to be less probable.
Conclusions
In summary, our results reveal previously unnoticed aspects of the catalyst activation phase as well as the first steps of the following C–H activation reaction. The addition of TFA to the triangular trinuclear palladium acetate complex in the precatalytic phase leads to a fast (within minutes) substitution of the acetate ligands by trifluoroacetate ones in the amount corresponding to the ratio of OTFA/OAc while the triangular trinuclear motif remains preserved. Introduction of more electron withdrawing trifluoroacetate ligands leads to a decrease of electron density at the palladium atoms. It facilitates the next reaction step in which the triangular precatalyst reacts with two acetanilide molecules. The reaction results in an opening of the cyclic structure and the terminal trifluoroacetate ligands are replaced by the C–H activated acetanilide molecules to form complex T. Complex T can react with another molecule of acetanilide which leads to the formation of stable bimetallic complexes D (Scheme 3). Details of the C–H activation within the trinuclear palladium complexes as well as the role of mononuclear or binuclear complexes formed during this initial phase of the reaction represent a challenging nut to be cracked and our work is ongoing. | ||
| Scheme 3 A reaction scheme considering the reaction pathway proceeding via trifluoroacetate palladium complexes. | ||
Conflicts of interest
There are no conflicts to declare.Acknowledgements
University of Pardubice and the European Research Council (ERC CoG No. 682275) are gratefully acknowledged for financial support. The NMR spectrometer at Charles University was purchased within the project CZ.2.16/3.1.00/21566 funded by the Operational Programme Prague – Competitiveness.Notes and references
- (a) New Trends in Cross-Coupling: Theory and Applications, ed. T. J. Colacot, RSC, Cambridge, UK, 2015 Search PubMed; (b) Handbook of Organopalladium Chemistry for Organic Synthesis, ed. E.-i. Negishi, John Wiley & Sons, Inc., Hoboken, NJ, 2002 Search PubMed.
- (a) W. A. Carole and T. J. Colacot, Chem. – Eur. J., 2016, 22, 7686 CrossRef CAS PubMed; (b) W. A. Carole, J. Bradley, M. Sarwar and T. J. Colacot, Org. Lett., 2015, 17, 5472 CrossRef CAS PubMed; (c) R. B. Bedford, J. G. Bowen, R. B. Davidson, M. F. Haddow, E. A. Seymour-Julen, H. A. Sparkes and R. L. Webster, Angew. Chem., Int. Ed., 2015, 54, 6591 CrossRef CAS PubMed; (d) V. V. Tatarchuk, A. P. Sergievskaya, N. V. Kuratieva, I. V. Korol'kov, L. A. Sheludyakova and S. A. Gromilov, J. Struct. Chem., 2014, 55, 142 CrossRef CAS; (e) V. M. Nosova, Y. A. Ustynyuk, L. G. Bruk, O. N. Temkin, A. V. Kisin and P. A. Storozhenko, Inorg. Chem., 2011, 50, 9300 CrossRef CAS PubMed; (f) V. I. Bakhmutov, J. F. Berry, F. A. Cotton, S. Ibragimov and C. A. Murillo, Dalton Trans., 2005, 1989 RSC; (g) S. E. Bajwa, T. E. Storr, L. E. Hatcher, T. J. Williams, C. G. Baumann, A. C. Whitwood, D. R. Allan, S. J. Teat, P. R. Raithby and I. J. S. Fairlamb, Chem. Sci., 2012, 3, 1656 RSC.
- More information about the structure of palladium acetate in solid state and solution can be found therein: (a) A. C. Skapski and M. L. Smart, J. Chem. Soc., Chem. Commun., 1970, 658 RSC; (b) R. F. Mulagalee and S. D. Kirik, Russ. J. Appl. Chem., 2010, 83, 2065 CrossRef; (c) I. A. Efimenko, R. E. Podobedov, A. V. Churakov, L. G. Kuz'mina, I. A. Garbuzova, B. V. Lokshin, A. L. Maksimov and V. R. Flid, Russ. J. Coord. Chem., 2011, 37, 625 CrossRef CAS; (d) A. S. Batsanov, G. A. Timko, Y. T. Struchkov, N. V. Gerbeleu, K. M. Indrichan and G. A. Popovich, Koord. Khim., 1989, 15, 688 CAS; (e) R. N. Pandey and P. M. Henry, Can. J. Chem., 1974, 52, 1241 CrossRef CAS; (f) T. R. Jack and J. Powell, Can. J. Chem., 1975, 53, 2558 CrossRef CAS; (g) T. Diao, P. White, I. Guzei and S. S. Stahl, Inorg. Chem., 2012, 51, 11898 CrossRef CAS PubMed; (h) E. S. Stoyanov, J. Struct. Chem., 2000, 41, 440 CrossRef CAS; (i) L. A. Adrio, B. N. Nguyen, G. Guilera, A. G. Livingston and K. K. Hii, Catal. Sci. Technol., 2012, 2, 316 RSC; (j) J. Evans, L. O'Neill, V. L. Kambhampati, G. Rayner, S. Turin, A. Genge, A. J. Dent and T. Neisius, J. Chem. Soc., Dalton Trans., 2002, 2207 RSC.
- (a) Review: V. K. Jain and L. Jain, Coord. Chem. Rev., 2010, 254, 2848 CrossRef CAS.
- The only exception is work. (a) R. G. Brown, R. V. Chaudhari and J. M. Davidson, J. Chem. Soc., Dalton Trans., 1977, 176 RSC; the theoretical work. (b) R. Giri, Y. Lan, P. Liu, K. N. Houk and J.-Q. Yu, J. Am. Chem. Soc., 2012, 134, 14118 CrossRef CAS PubMed; polynuclear complexes are discussed in: (c) B. E. Haines, J. F. Berry, J.-Q. Yu and D. G. Musaev, ACS Catal., 2016, 6, 829 CrossRef CAS; (d) N. T. S. Phan, M. Van Der Sluys and C. W. Jones, Adv. Synth. Catal., 2006, 348, 609 CrossRef CAS.
- A brief discussion about trinuclear complexes: (a) D. L. Davies, S. A. Macgregor and C. L. McMullin, Chem. Rev., 2017, 117, 8649 CrossRef CAS PubMed; (b) J. He, M. Wasa, K. S. L. Chan, Q. Shao and J.-Q. Yu, Chem. Rev., 2017, 117, 8754 CrossRef CAS PubMed; (c) R. Giri, X. Chen and J.-Q. Yu, Angew. Chem., Int. Ed., 2005, 44, 2112 CrossRef CAS PubMed.
- (a) C. Jia, D. Piao, J. Oyamada, W. Lu, T. Kitamura and Y. Fujiwara, Science, 2000, 287, 1992 CrossRef CAS PubMed; (b) X. Zhao, C. S. Yeung and V. M. Dong, J. Am. Chem. Soc., 2010, 132, 5837 CrossRef CAS PubMed; (c) F. Yang, F. Song, W. Li, J. Lan and J. You, RSC Adv., 2013, 3, 9649 RSC; (d) Z. Chen, B. Wang, J. Zhang, W. Yu, Z. Liu and Y. Zhang, Org. Chem. Front., 2015, 2, 1107 RSC; (e) C. S. Yeung, X. Zhao, N. Borduas and W. M. Dong, Chem. Sci., 2010, 1, 331 RSC.
- J. Váňa, V. Petrović, T. Terencio, O. Tischler, Z. Novák and J. Roithová, Organometallics, 2017, 36, 2072 CrossRef.
- T. A. Stephenson, S. M. Morehouse, A. R. Powell, J. P. Heffer and G. Wilkinson, J. Chem. Soc., 1965, 3632 RSC.
- O. Swang, R. Blom, O. B. Ryan and K. Fægri, J. Phys. Chem., 1996, 100, 17334 CrossRef CAS.
- J. A. Tunge and L. N. Foresee, Organometallics, 2005, 24, 6440 CrossRef CAS.
- R. Li, L. Jiang and W. Lu, Organometallics, 2006, 25, 5973 CrossRef CAS.
- Note that the abbreviation TFA stands for trifluoroacetic acid, OTFA for trifluoroacetate anion and the OTFA/OAc for the overall sums of acids and their conjugated bases present in solution or bonded to the palladium as ligands.
- (a) F. Szabó, J. Daru, D. Simkó, T. Y. Nagy, A. Stirling and Z. Novák, Adv. Synth. Catal., 2013, 355, 685 CrossRef; (b) S. J. Tremont and H. U. Rahman, J. Am. Chem. Soc., 1984, 106, 5759 CrossRef CAS; (c) Y. Wu, B. Li, F. Mao, X. Li and F. Y. Kwong, Org. Lett., 2011, 13, 3258 CrossRef CAS PubMed; (d) Y. Wu, P. Y. Choy, F. Mao and F. Y. Kwong, Chem. Commun., 2013, 49, 689 RSC; (e) C. Li, L. Wang, P. Li and W. Zhou, Chem. – Eur. J., 2011, 17, 10208 CrossRef CAS PubMed; (f) M. J. Jang and S. W. Youn, Bull. Korean Chem. Soc., 2011, 32, 2865 CrossRef CAS; (g) X. Zhao and V. M. Dong, Angew. Chem., Int. Ed., 2011, 50, 932 CrossRef CAS PubMed; (h) O. Daugulis and V. G. Zaitsev, Angew. Chem., Int. Ed., 2005, 44, 4046 CrossRef CAS PubMed; (i) L. Zhang, K. Chen, G. Chen, B. Li, S. Luo, Q. Guo, J. Wei and Z. Shi, Org. Lett., 2013, 15, 10 CrossRef CAS PubMed; (j) F. Szabó, D. Simkó and Z. Novák, RSC Adv., 2014, 4, 3883 RSC; (k) O. Tischler, B. L. Tóth and Z. Novák, Chem. Rec., 2017, 17, 184 CrossRef CAS PubMed; (l) O. Tischler, Sz. Kovács, G. Érsek, P. Králl, J. Daru, A. Stirling and Z. Novák, J. Mol. Catal. A: Chem., 2017, 426, 444 CrossRef CAS.
- The trinuclear complex T is unstable. Attempts to dissolve it in a coordinating solvent like DMSO, methanol, acetone or acetonitrile cause its transformation to the yellow binuclear complex D. This proves its reaction intermediate character.
Footnote |
| † Electronic supplementary information (ESI) available: Detailed spectra of exchange experiments, diffusion coefficient measurements, kinetic experiments, compound characterization and crystallographic information. CCDC 1561485 and 1561486. For ESI and crystallographic data in CIF or other electronic format see DOI: 10.1039/c7dt03832a |
| This journal is © The Royal Society of Chemistry 2017 |

