 Open Access Article
Creative Commons Attribution 3.0 Unported Licence
2-Acyl-1,1,3,3-tetracyanopropenides (ATCN): structure characterization and luminescence properties of ammonia and alkali metal ATCN salts†
Ya. S.
Kayukov
a,
S. V.
Karpov
 *a,
A. A.
Grigor'ev
a,
O. E.
Nasakin
a,
V. A.
Tafeenko
b,
K. A.
Lyssenko
 c,
A. V.
Shapovalov
c and
E. A.
Varaksina
d
aI. N. Ul'yanov Chuvash State University, Moskovskii Prospekt 15, Cheboksary, 428015, Russia. E-mail: serg31.chem@mail.ru
bLomonosov Moscow State University, Leninskiye Gory 1-3, Moscow, 119991, Russia
cA. N. Nesmeyanov Institute of Organoelement Compounds, Russian Academy of Sciences (INEOS RAS), 119991 Moscow, Russia
dP.N. Lebedev Physical Institute of the Russian Academy of Sciences (FIAN), 119991 Moscow, Russia
First published on 13th November 2017
Abstract
Herein, syntheses, crystal structures, and photoluminescence properties of 24 new ammonia and alkali metal ATCN salts characterized via single-crystal X-ray diffraction are reported. Moreover, ten structure types of these salts have been described, three of which are predominant. Some ATCNs were obtained as two crystalline polymorphs. It was estimated that most ATCN powders exhibited yellow-green fluorescence (at 450–600 nm). For samples that possess fluorescence of low intensity in the solid state, several optical centers of emission exist. It was speculated that the obtained spectral features were due to anion-anion intermolecular interactions. ATCN being a new representative of stable tetracyanoallyl salts is a promising candidate for creation of various 1D, 2D, and 3D supramolecular structures and potential functional materials.
Introduction
The coordination chemistry of salts1 and coordination polymers2 containing tetracyanoallyl (TCA) anion has been intensively studied because of the diverse nature of applications and potentially useful properties, such as semiconducting,3 thermo- and photochromic,4 magnetic,5 and photomagnetic properties,6 of these materials. TCA ligands have also received interest for creation of spin-crossover (SCO) materials,7 ionic liquids,8 (including radiolysis resistant IL,9 efficient propellants,10 and burning-rate (BR) catalysts).11 Moreover, in recent studies, TCA ligands have found application as components of redox electrocatalysts12 and fluorine-free solid-polymer electrolytes for sodium-ion batteries.13 Some TCA complexes have also shown antimicrobial activity.14In this study, we continued the systematic study of new representatives of TCA salts, 2-acyl-1,1,3,3-tetracyanopropenides (ATCN). These salts are stable and can be easily obtained from readily available reagents.15 For the obtained salts, the absorption and fluorescence spectra both in the solution and solid state were acquired. The obtained spectral data were compared with the results of X-ray experiments to find out the correlations between ammonia and alkali metal ATCN structure and their fluorescence properties.
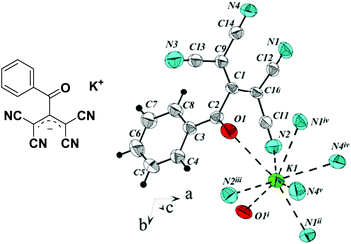
Among a broad range of TCA ligands, ATCN are noteworthy because they contain an acyl group at position 2 of TCA anion, and the carbonyl oxygen can form an additional coordination bond with the cation (Fig. 1).
Some ATCNs were obtained as two crystalline polymorphs. In this case, we designated them as α and β. The conditions for their formation are different. α-Forms were obtained by slow evaporation of the solvent at r.t., whereas β-forms were isolated via rapid evaporation of a warm solution.
The ORTEP images, additional crystallographic data, and methods of single crystal preparation are presented in the ESI.†
Designation of ATCN salts
Results and discussion
Description of ATCN crystal packing
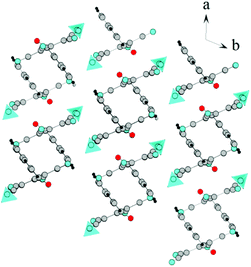
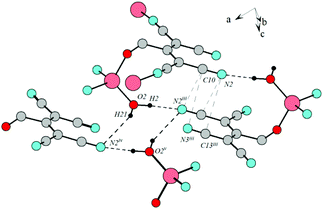
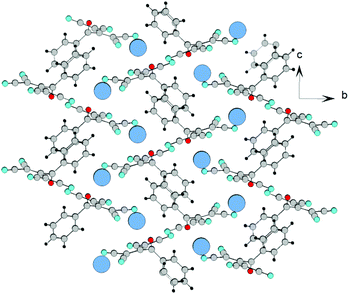
![[1 with combining macron]](https://www.rsc.org/images/entities/char_0031_0304.gif) . In this case, ATCN anions are lined up in chains in a head-to-tail arrangement along one of the crystallographic axes. Every two neighboring chains are connected by a center of symmetry. Each cation coordinates five anions from four neighboring chains (Fig. 2). Fig. 3 shows the resulting formation of the 3D ionic structure of these salts.
. In this case, ATCN anions are lined up in chains in a head-to-tail arrangement along one of the crystallographic axes. Every two neighboring chains are connected by a center of symmetry. Each cation coordinates five anions from four neighboring chains (Fig. 2). Fig. 3 shows the resulting formation of the 3D ionic structure of these salts.
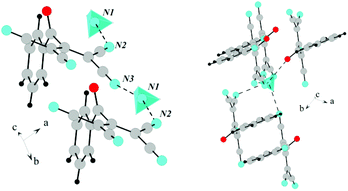 | ||
| Fig. 2 The arrangement of ATCN anions in the crystal of 1a. Gray, red, and blue spheres represent carbon, oxygen, and nitrogen atoms, respectively. Blue tetrahedra are ammonia cations. | ||
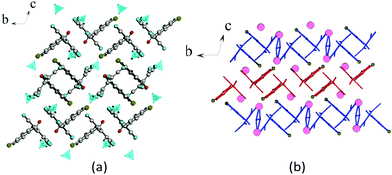
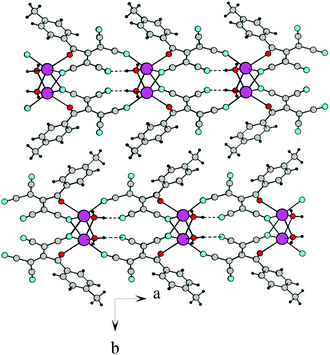
Contrary to the crystal 1a, in the independent part of the unit cell of the crystals 4a and 4e, there are two crystallographically independent types of ATCN anions (designated as blue and red in Fig. 4b). These anions form layers in the b–a plane that alternate with each other.
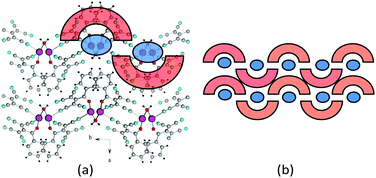 | ||
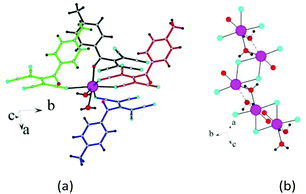
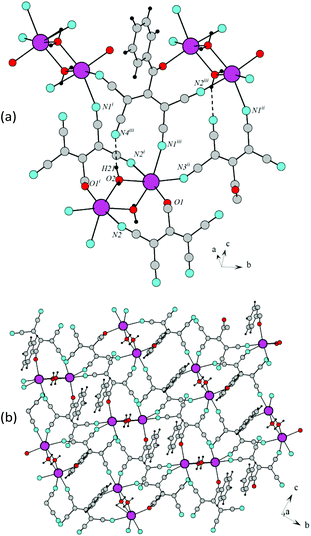
| Fig. 6 (a) Fragment of the crystal lattice of β-1c viewed along the c axis. Magenta spheres represent sodium atoms. (b) General schematic of the crystal packing. | ||
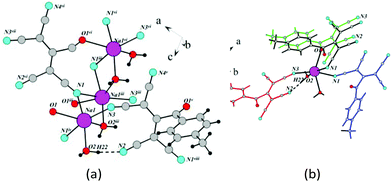
Sodium 2-benzoyl-1,1,3,3-tetracyanopropenide β-1c has a layered 2D ion-molecular structure, as shown in Fig. 6. Each layer was formed by sodium chains, which were united by water bridges and ATCN anions. Each sodium cation coordinates four ATCN anions (Fig. 7). The salt 3c has an analogous structure.
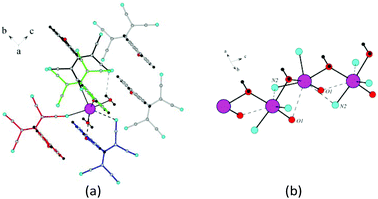 | ||
| Fig. 7 (a) Coordination environment of Na in β-1c. (b) Sodium cations united by water bridges. Na⋯Na distances are 3.779 Å. | ||
The salts 3a, β-1d, and α-3d do not contain crystallization water. Each cation coordinates six ATCN anions, and the cations are linked in chains via nitrogen bridges (Fig. 8).
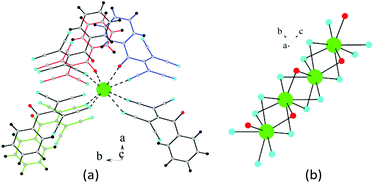 | ||
| Fig. 8 (a) Coordination environment of K (green sphere) in β-1d. (b) Potassium cations united by nitrogen bridges. K⋯K distances are 3.618 Å. | ||
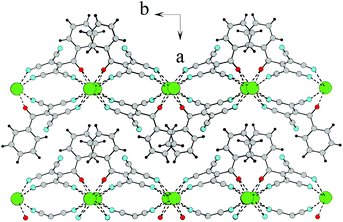
Fig. 9 shows the general crystal packing of β-1d. The salts 3a and α-3d have an analogous structure.
![[1 with combining macron]](https://www.rsc.org/images/entities/char_0031_0304.gif) .
.
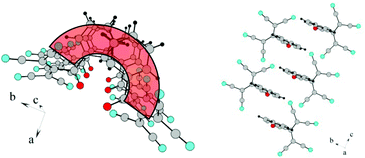
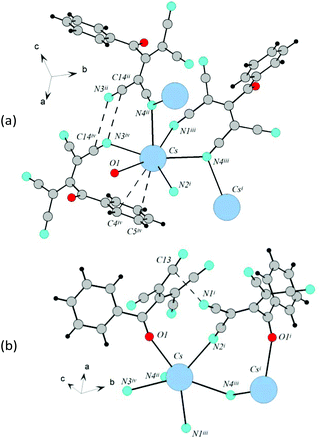
In the crystal of 2d, each potassium cation coordinates five ATCN anions belonging to three neighboring gutters. The cations are linked in chains via oxygen O1 and nitrogen N4 bridges (K⋯K distance is 4.705 Å). The chains are packed in 2D sheets via N3 nitrogens (K⋯K distance is 4.438 Å), as shown in Fig. 10.
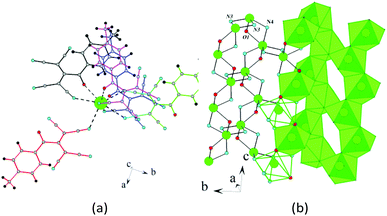 | ||
| Fig. 10 (a) Coordination environment of K in 2d. (b) Schematic of the formation of the 2D sheet in 2d. | ||
Fig. 11 shows the general crystal packing of 2d. The salts 4d, 2e, and 2f have an analogous structure.
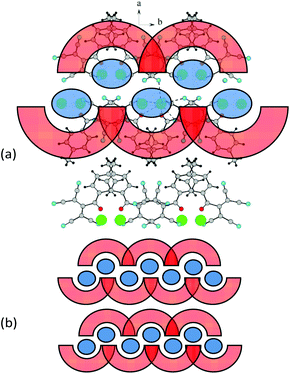 | ||
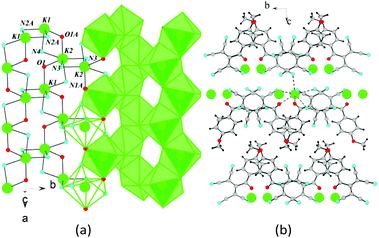
| Fig. 11 (a) Fragment of the crystal lattice of 2d viewed along the c axis. (b) General schematic of the crystal packing. | ||
The salts β-3d and 3e have an analogous structure with a minor difference. The crystal lattice of β-3d is composed of two types of crystallographically independent ATCN anions. They alternate in gutters, and the methoxy groups are disordered. The alternating ions K1 and K2 are also connected via bridging heteroatoms belonging to ATCN anions; this results in the formation of the 2D sheet in the a–b plane (Fig. 12(a)). The distances between potassium cations alternate (the distance between K1⋯K2 that is bonded via O1A and N4 is 4.596 Å, whereas the distance between K1⋯K2 that is bonded via O1 and N1A is 4.654 Å). The bridging nitrogen N2A connects K2 cations (K2⋯K2 distance is 4.445 Å). The nitrogen N3 connects the K1 cations (K1⋯K1 distance is 4.451 Å). For the rest, the architecture of the crystals is the same as in 2d (Fig. 12(b)). The salt 3e has an analogous structure.
 | ||
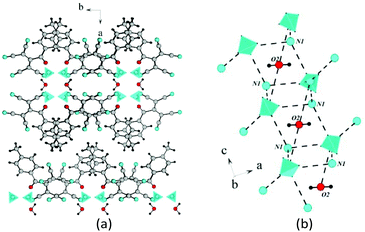
| Fig. 14 (a) Fragment of the crystal lattice of β-2c viewed along the c axis. (b) General schematic of the crystal packing. | ||
The salt 2a has a similar crystal packing. In this case, the crystal lattice is composed of two types of crystallographically independent ATCN anions. The cations are linked to chains via bridging N1 and aqua bridges (Fig. 15).
![[1 with combining macron]](https://www.rsc.org/images/entities/char_0031_0304.gif) . The crystals of 2b, 3b, and 4b are monoclinic with the space group of P21/c.
. The crystals of 2b, 3b, and 4b are monoclinic with the space group of P21/c.
Each lithium cation coordinates the nitrogens N1 and N2 belonging to different ATCN anions and connects them to an infinite chain. These chains are combined in pairs by coordination of lithium with the carbonyl oxygen; this forms a 1D chain structure. The fourth coordination site of lithium is occupied by a water molecule.
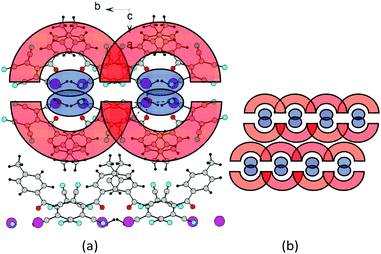
Type five: two chains are centrosymmetric (running toward each other, as shown in Fig. 16).15a Type six: two chains are arranged in one direction (Fig. 17).
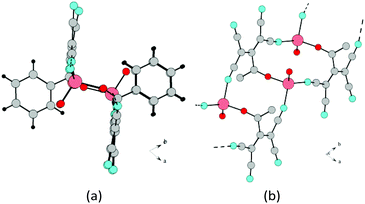 | ||
| Fig. 16 (a) Fragment of the 1D chain structure of 1b viewed along the c axis. (b) Schematic of the formation of 1D chain in 1b. | ||
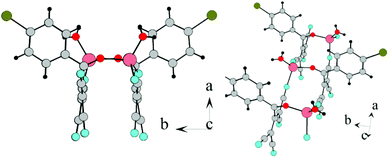 | ||
| Fig. 17 (a) Fragment of the 1D chain structure of 4b viewed along the c axis. (b) Schematic of the formation of 1D chain in 4b. | ||
In both cases, the hydrogen bonds between the coordination water and the nitrogen atoms of the nitrile groups as well as CN–CN dipole–dipole interactions are present in the crystal (Fig. 18).
 | ||
| Fig. 19 (a) Sodium cations bonded by water and nitrogen bridges in α-2c. Na–Na distance is 3.737 Å. (b) Coordination environment of Na in α-2c. | ||
The salt 4c has an analogous structure.
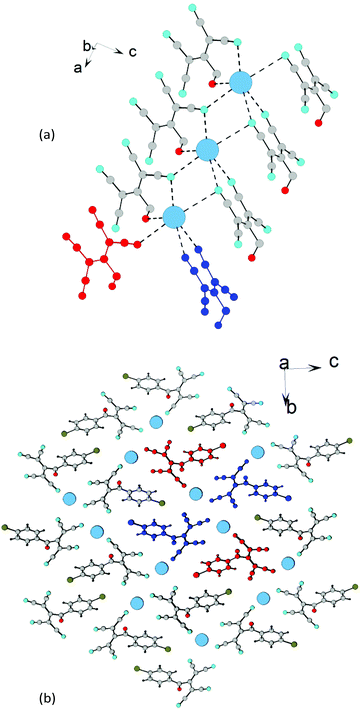 | ||
| Fig. 24 (a) Schematic of the formation of 1D chains in 4f (benzene rings are hidden). (b) Fragment of the crystal lattice of 4f viewed along the a axis. | ||
The X-ray data was obtained using the STOE diffractometer, Pilatus 100 K detector, focusing mirror collimation, and Cu Kα (1.54086 Å) radiation in the rotation method mode. The STOE X-AREA software was used for cell refinement and data reduction. Intensity data were scaled with LANA (part of X-Area) to minimize the differences in the intensities of symmetry-equivalent reflections (multi-scan method). The structures were solved and refined with the SHELX program. The non-hydrogen atoms were refined using the anisotropic full matrix least-square procedure. Molecular geometry calculations were performed with the SHELX program, and the molecular graphics were prepared using the Diamond software.
Absorption and fluorescence properties
Absorption spectra of the solutions were obtained using a Varian Cary 100 Scan spectrophotometer in a 0.1 cm layer at a concentration of 10−4 M in non-deaerated ethanol.Fluorescence emission and excitation spectra of ethanol solutions and powders were obtained using a Horiba Jobin Yvon Fluorolog 3-221 fluorescence spectrometer at room temperature in a 0.1 or 0.02 cm cuvette in the reflectance mode at an angle of 7–10° for an optical density of D ∼ 0.2 (for solutions) at the excitation wavelength.
Relative fluorescence quantum yield (φrel) of solutions was measured vs. a solution of 9,10-diphenylanthracene in ethanol (for non-deaerated solutions, φ = 90%),16 and φrel accuracy was ±5% (for three measurements).
Absolute fluorescence quantum yield (φabs) of powders was measured via an integrating sphere G8 GMPSA with Spectralone layer,17 and φabs accuracy was ±10% (for three measurements).
Fluorescence lifetimes (τ) were measured in the photo-counting mode with a diode laser at 369 nm and pulse length of <100 ns as the excitation source, and τ accuracy was ±10% (for three measurements).
Electronic excitation energies were calculated via the time-dependent density-functional theory (TD-DFT) using the Orca program package.18
The powders of ATCN for absorbance and fluorescence investigation were prepared from single crystals.
Absorption properties
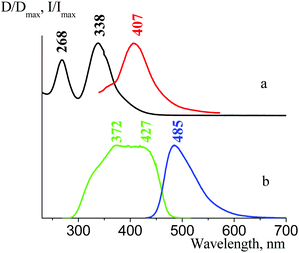
Fig. 25(a) shows the 2f absorbance spectrum in a dilute ethanol solution (C ∼ 10−4 mol l−1). There are two bands in the absorbance spectrum with a maxima at 338 nm (ε = 45![[thin space (1/6-em)]](https://www.rsc.org/images/entities/char_2009.gif) 360 L cm−1 mol−1) and 268 nm (ε = 35
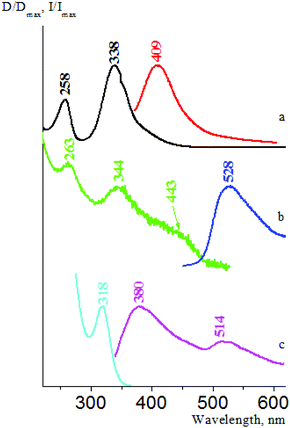
360 L cm−1 mol−1) and 268 nm (ε = 35![[thin space (1/6-em)]](https://www.rsc.org/images/entities/char_2009.gif) 150 L cm−1 mol−1). The absorbance spectrum of 1f in ethanol (Fig. 26(a)) as well as those for 3f and 4f (see Fig. 1 and 2 in the ESI†) are almost the same. This fact led us speculate that the π-system structure of the tetracyanopropenide fragment of the ligand did not change significantly via the introduction of a substituent group (Br, Me, and OMe) in the para-position of the ligand benzene ring. The absorption spectra of salts with different cations (2a, 2b, 2c, 2d, and 2e) in an ethanol solution are also similar (see Fig. 3–8 in ESI†). Thus, we can conclude that the absorbance spectra of ATCNs in solution are mainly determined by electron transitions in the π-system of the tetracyanopropenide fragment of the ligand. These data are in good agreement with the results of quantum-chemical calculations (see Table 1).
150 L cm−1 mol−1). The absorbance spectrum of 1f in ethanol (Fig. 26(a)) as well as those for 3f and 4f (see Fig. 1 and 2 in the ESI†) are almost the same. This fact led us speculate that the π-system structure of the tetracyanopropenide fragment of the ligand did not change significantly via the introduction of a substituent group (Br, Me, and OMe) in the para-position of the ligand benzene ring. The absorption spectra of salts with different cations (2a, 2b, 2c, 2d, and 2e) in an ethanol solution are also similar (see Fig. 3–8 in ESI†). Thus, we can conclude that the absorbance spectra of ATCNs in solution are mainly determined by electron transitions in the π-system of the tetracyanopropenide fragment of the ligand. These data are in good agreement with the results of quantum-chemical calculations (see Table 1).
| Parameter | Calculation | Experimental |
|---|---|---|
| a Determined via the intersection point of 2f emission and long-wavelength absorbance bands in ethanol. | ||
| λ absmax, nm | ||
| S0 → S1 | 473.1 | |
| S0 → S2 | 334.0 | 338 |
| S0 → S3 | 323.3 | |
| S0 → S4 | 299.9 | |
| S0 → S5 | 292.1 | |
| S0 → S6 | 279.3 | |
| S0 → S7 | 260.2 | 268 |
| S0 → S8 | 255.4 | |
| λ emmax, nm | ||
| S1 → S0 | 758.2 | |
| S2 → S0 | 398.3 | 407 |
| E HOMO–LUMO, eV | ||
| 0–0 transition | 3.87 | 3.36a |
Fig. 25(b) demonstrates that the 2f solid state absorption spectrum differs from the solution spectrum: it is shifted towards longer wavelengths by about 10–20 nm and has one more band, which can only be seen as a shoulder at 380–420 nm. The 1f solid state absorption spectrum (Fig. 26(b)) is also bathochromically shifted as compared to the solution spectrum and also has one more absorbance band in the area 400–450 nm. This indicates that in the solid state, there are intermolecular interactions, which are similar for different salts. However, the fluorescence properties of 1f and 2f are essentially different (see below); thus, we should find out the reason of this fact by analyzing their emission and excitation spectra.19
Fluorescence properties
All the investigated ATCNs possess no visible fluorescence in solution. As an example, Fig. 25(a) shows the 2f fluorescence spectrum in ethanol, which mirrors symmetrically its long-wavelength absorption band. The relative fluorescence quantum yield φrel of 2f ethanol solution is equal to 0.4%, and its fluorescence lifetime τ is 8.1 ns. The 1f fluorescence spectrum in ethanol (Fig. 26(a)) is similar to that of 2f. However, in the solid state, 2f possesses visible fluorescence at 450–600 nm (like most of the investigated tetracyanopropenide salts, see Table 2 and Fig. 9–32 in the ESI†), and 1f possesses no visible fluorescence.| ATCN | λ exmax (λreg), nm | λ emmax (λex), nm | Visual appearance of the compounds under UV/visible light | CCDC | Structure type | |
|---|---|---|---|---|---|---|
| a Shoulder ∼. b Principal maximum in bold. | ||||||
| 1a | 328∼![[thin space (1/6-em)]](https://www.rsc.org/images/entities/char_2009.gif) a, 368b, 462 (525) a, 368b, 462 (525) |
527 (365) |

|

|
694326 | 1 |
| 1b | 332, 365, 400, 462 (525) | 511 (365) |

|

|
1452033 | 5 |
| α-1c | 328 (380) | 400, 488∼, 533 (320) |

|

|
1452034 | 8 |
| 365, 435 (525) | 495, 528 (420) | |||||
| 537, 584∼ (640) | 562, 584∼ (500) | |||||
| β-1c | 331∼, 370, 426 (525) | 522 (365) |

|

|
1574996 | 2 |
| α-1d | 318 (380) | 378, 511 (320) |

|

|
1452031 | 8 |
| 331∼, 370, 427 (525) | 511 (365) | |||||
| β-1d | 275, 307∼, 372, 426 (525) | 471 (365) |

|

|
1574998 | 2 |
| 1e | 318 (380) | 380, 414∼, 508 (320) |

|

|
1581463 | 9 |
| 334∼, 368, 446 (525) | 511 (365) | |||||
| 1f | 318 (380) | 380, 514 (320) |

|

|
1580717 | 9 |
| 320, 365∼ (525) | 528 (365) | |||||
| 2a | 322∼, 373, 426 (580) | 553 (365) |

|

|
1575039 | 4 |
| 2b | 330∼, 370, 418 (525) | 470 (365) |

|

|
1575056 | 6 |
| α-2c | 322∼, 369, 452 (525) | 505 (365) |

|

|
1575015 | 7 |
| 320∼, 369, 450, 480∼ (550) | 554 (490) | |||||
| β-2c | 319 (380) | 379, 509 (320) |

|

|
1575014 | 4 |
| 325∼, 368, 465 (525) | 509 (365) | |||||
| 325∼, 368, 476, 524 (580) | 543 (525) | |||||
| 2d | 320∼, 369, 455 (525) | 521 (365) |

|

|
1575020 | 3 |
| 2e | 331∼, 370, 435 (525) | 496 (365) |

|

|
1575001 | 3 |
| 2f | 334∼, 372, 424 (525) | 485 (365) |

|

|
1575038 | 4 |
| 3a | 318 (380) | 379, 482 (320) |

|

|
1575023 | 2 |
| 328, 368, 413 (480) | 488 (365) | |||||
| 325∼, 365, 437, 525 (580) | 591 (525) | |||||
| 3b | 328∼, 372, 422 (525) | 480 (365) |

|

|
1575055 | 4 |
| 3c | 326∼, 370, 423 (525) | 496 (365) |

|

|
1575016 | 2 |
| α-3d | 319 (380) | 375, 460 (320) |

|

|
1575088 | 2 |
| 323∼, 370, 418 (460) | 460 (365) | |||||
| 325∼, 368, 434, 469∼ (525) | 513 (450) | |||||
| β-3d | 276, 309∼, 370, 444 (525) | 506 (365) |

|

|
1575000 | 3 |
| 3e | 328∼, 370, 450 (525) | 504 (365) |

|

|
1575021 | 3 |
| 3f | 319 (380) | 378, 484 (320) |

|

|
No X-ray data | |
| 324∼, 371, 425 (525) | 484 (365) | |||||
| 4a | 319 (380) | 377, 513 (320) |

|

|
1575024 | 1 |
| 333∼, 371, 428 (525) | 513 (365) | |||||
| 4b | 318 (380) | 380, 476 (320) |

|

|
1575057 | 6 |
| 332, 370, 427, 485∼ (525) | 476 (365) | |||||
| 4c | 334∼, 373, 459 (525) | 517 (365) |

|

|
1575040 | 7 |
| 4d | 276, 307∼, 369, 465 (525) | 527 (365) |

|

|
1575041 | 3 |
| 4e | 332∼, 370, 440 (525) | 510 (365) |

|

|
1575022 | 1 |
| 4f | 318 (380) | 379, 486 (320) |

|

|
1575037 | 10 |
| 327, 371, 426 (525) | 489 (365) | |||||
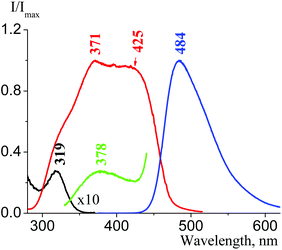
We then examined the fluorescence properties of cesium salt powders in the series 1f, 4f, 3f, and 2f. We have estimated that there is a fluorescence intensity increase in this row: 4f, 3f, and 2f have absolute fluorescence quantum yields φabs equal to 0.6%, 1.9% and 16.7%, respectively; consequently, their fluorescence lifetimes τ are 7.4 ns, 4.5 ns, and 3.7 ns (1f fluorescence in the solid state is very weak). There are two emission optical centers (OC) in the 1f fluorescence spectra: OC1 (λemmax = 380 nm, Fig. 26(c)) and OC2 (λemmax = 514 nm, Fig. 26(b)), and the OC1 band is more intense. The 1f excitation spectra also consist of two bands – an intense band at 319 nm (OC1) and another band at 365 nm with low intensity (OC2), which can be seen only as a shoulder (see Fig. 14 in the ESI†). The OC1 and OC2 bands in the 4f emission and excitation spectra are almost of the same intensity (Fig. 27). The OC2 bands in the 3f emission and excitation spectra are about ten times more intense as compared to the OC1 bands (Fig. 28). There is only an OC2 emission band in the 2f spectra (λemmax = 485 nm), and the OC1 band in its excitation spectra can be seen only as a shoulder (Fig. 25(b)).
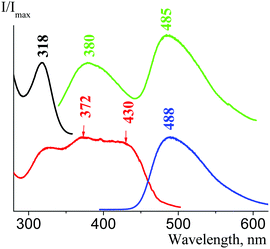 | ||
| Fig. 27 Solid state 4f emission and excitation spectra; excitation wavelength is 320 nm (green curve) and 365 nm (blue curve), registration wavelength is 380 nm (black curve) and 525 nm (red curve). | ||
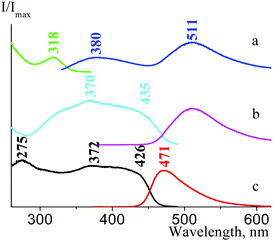
The fluorescence properties of the ATCN α and β polymorph modification are also different. We found out that the fluorescence of β-1c, β-1d, and β-3d is more intense than that of α-1c, α-1d, and α-3d. As we can see in Fig. 29, there are two OC bands in the α-1d emission and excitation spectra: OC1 (λemmax = 380 nm, λexmax = 318 nm) and OC2 (λemmax = 511 nm, λexmax = 435 nm). Moreover, only OC2 is responsible for the β-1d fluorescence (λemmax = 471 nm, λexmax = 426 nm). For the α-2c and β-2c species, several OC bands are observed (see Table 2), and both these polymorphs show a weak fluorescence.
Comparison and discussion
The revealed fluorescence property differences of tetracyanopropenide salts in the solid state (or visible fluorescence origin) can be explained by a comparison of the obtained electron spectra and the results of the X-ray experiment for the same compounds. There are two types of interactions in the ATCN crystals: anion-anion (between different tetracyanoallyl fragments) and anion–cation (between CN-groups of tetracyanoallyl fragments and ammonia or alkali metal cation). Tetracyanoallyl fragments in the 1f cesium salt crystal are not parallel, and the distances between their CN-groups are about 3.52–6.37 Å. In the 4f crystals, these fragments are parallel, but shifted to each other, and the distances between them are a bit shorter and equal to 4.05–4.41 Å. In the 2f crystals, the tetracyanoallyl fragments are parallel, turned to each other for about 90°; thus, the examined distances are shorter and equal to about 3.54–3.79 Å. For rubidium salts, these distances are about 3.49–5.47 Å for 1e, 3.50–4.57 Å for 4e, 3.55–4.54 Å for 3e, and 3.45–3.61 Å for 2e. In the case of 2f and 2e crystals, direct short contacts between tetracyanoallyl fragments of different ligands are detected. Anion–cation interactions for cesium and rubidium salts don't differ significantly. For cesium salts, each tetracyanoallyl fragment is coordinated with four (1f) or five (4f and 2f) cesium cations. This type of cesium coordination can lead to distortion of tetracyanoallyl fragments: their torsion angles are equal: 10.8° for 1f, 3.5° for 4f, and 6.9° for 2f. For rubidium salts, these values are similar.The lack of visible fluorescence in ATCN dilute solutions and its origin in the solid state led us speculate that the fluorescence of powders was due to the intermolecular interactions, which didn't exist in solution. We suppose that the origin of the visible fluorescence is mainly due to the anion–anion interactions between tetracyanoallyl fragments at their parallel location at the distances of 3.5–4.0 Å (for different types of anion–anion interactions in the crystals see literature20). In this case, the fluorescence properties of tetracyanopropenide salts are determined by one OC of emission, and these samples possess more intense fluorescence as compared to those that have several OCs. Further research is required to estimate the observed OC nature. It should be noted that the samples 1e and 1f, which show a weak fluorescence and have more intense OC1 emission bands than OC2 bands, belong to the same 9th structure type.
A characteristic feature of the tetracyanopropenide fluorescence spectra is that their emission maxima values correlate with distances between parallel tetracyanoallyl fragments. When these distances decrease in the series 2b, 2f, 2e, and 2d from 4.2 to 3.4 Å, fluorescence bands shift bathochromically by about 50 nm (Fig. 30). These results correspond to the analogous effect, which has been reported for tetracyanopirrolates.21
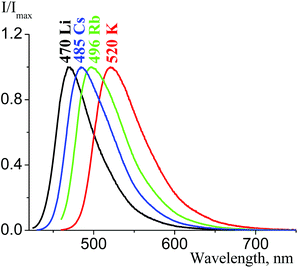 | ||
| Fig. 30 Solid state emission spectra of 2b (black curve, λex = 450 nm), 2f (blue curve, λex = 420 nm), 2e (green curve, λex = 425 nm), and 2d (red curve, λex = 425 nm). | ||
H-bond is another factor that influences the fluorescence properties of tetracyanopropenides in the solid state. H-bond existence between cation and anion (for 2a) or between anion and molecules of solvated water (for 2c) leads to emission band broadening (for about 2500 cm−1, i.e. almost twice) and long-wavelength shift (Fig. 31). A more detailed study of H-bond influence on the emission spectra of tetracyanopropenides is required.
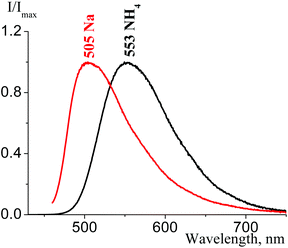 | ||
| Fig. 31 Solid state emission spectra of 2a (black curve, λex = 420 nm) and α-2c (red curve, λex = 450 nm). | ||
Conclusions
In conclusion, we have synthesized 24 ammonia and alkali metal ATCN salts, most of which have not been described previously. The crystal structures of 23 of them are reported. Some ATCN were obtained as two crystalline polymorphs. Moreover, ten structure types of these salts are described, three of which are predominant. In the solid state, most ATCN exhibit blue, green or yellow-green photoluminescence with nanosecond lifetimes. ATCN absorbance and fluorescence spectra in a dilute solution are almost the same. It is shown that ATCN fluorescence in the solid state is mainly originated due to intermolecular anion–anion interactions between different tetracyanoallyl fragments of ligands. Fluorescence band location and shape are mostly determined by distances between tetracyanoallyl fragments, their orientation to each other, and by the presence of H-bonds. ATCN might be used as bridging ligands for the construction of various 1D, 2D, and 3D coordination polymeric frameworks and potentially functional materials.Conflicts of interest
There are no conflicts to declare.Acknowledgements
This work was supported by RFBR, research project 16-33-60135 “мол_a_дк”. The X-ray study was supported in part by M. V. Lomonosov Moscow State University Program of Development. The contribution of the Center for molecular composition studies of INEOS RAS is gratefully acknowledged.Notes and references
- (a) Z. Setifi, A. Valkonen, M. A. Fernandes, S. Nummelin, H. Boughzala, F. Setifi and C. Glidewell, Acta Crystallogr., Sect. E: Struct. Rep. Online, 2015, 71, 509–515 CAS; (b) Z. Setifi, K. V. Domasevitch, F. Setifi, P. Mach, S. W. Ng, V. Petříček and M. Dušek, Acta Crystallogr., Sect. C: Cryst. Struct. Commun., 2013, 69(Pt 11), 1351–1356 CAS; (c) F. Setifi, D. K. Geiger, I. Abdul Razak and Z. Setifi, Acta Crystallogr., Sect. C: Struct. Chem., 2015, 71(Pt 8), 658–663 CAS; (d) Z. Setifi, F. Setifi, H. Boughzala, A. Beghidja and C. Glidewell, Acta Crystallogr., Sect. C: Struct. Chem., 2014, 70(Pt 5), 465–469 CAS; (e) Z. Setifi, F. Lehchili, F. Setifi, A. Beghidja, S. W. Ng and C. Glidewell, Acta Crystallogr., Sect. C: Struct. Chem., 2014, 70(Pt 3), 338–341 CAS; (f) B. Gaamoune, Z. Setifi, A. Beghidja, M. El-Ghozzi, F. Setifi and D. Avignant, Acta Crystallogr., Sect. E: Struct. Rep. Online, 2010, 66(Pt 8), m1044–m1045 CAS.
- (a) Z. Setifi, F. Setifi, L. El Ammari, M. El-Ghozzi, J. Sopková-de Oliveira Santos, H. Merazig and C. Glidewell, Acta Crystallogr., Sect. C: Struct. Chem., 2014, 70(Pt 1), 19–22 CAS; (b) Z. Setifi, B. Gaamoune, H. Stoeckli-Evans, D. A. Rouag and F. Setifi, Acta Crystallogr., Sect. C: Cryst. Struct. Commun., 2010, 66(Pt 10), m286–m289 CAS; (c) T. Franck and S. P. Jean, Polyhedron, 2003, 22, 1837–1843 CrossRef; (d) E. I. Klimova, M. M. Garcia, M. Flores-Alamo, A. V. Churakov, S. Cortez Maya and I. P. Beletskaya, Polyhedron, 2014, 68, 272–278 CrossRef CAS; (e) S. Duclos, F. Conan, S. Triki, Y. Le Mest, M. Liu-Gonzalez and J. Sala-Pala, Polyhedron, 1999, 18, 1935–1939 CrossRef CAS; (f) F. Thetiot, S. Triki, J. Sala-Pala and S. Golhen, Inorg. Chim. Acta, 2005, 358, 3277–3282 CrossRef CAS; (g) Y. Funasako, K.-I. Abe and T. Mochida, Thermochim. Acta, 2012, 532, 78–82 CrossRef CAS; (h) Asrial, F. Olbrich, M. Spoida, A. Fischer and F. T. Edelmann, Anorg. Allg. Chem., 2011, 637, 190–194 CAS.
- (a) S. Shuichi, K. Akihiko, Y. Hideki and S. Gunzi, Mol. Cryst. Liq. Cryst., 2002, 376, 207–212 CrossRef; (b) S. Shuichi, T. Chiyoko, Y. Hideki and S. Gunzi, J. Mater. Chem., 2001, 11, 2293–2302 RSC; (c) Y. Hideki, T. Chiyoko, S. Shuichi, S. Gunzi, K. Masami and S. Ken-Ichi, Mol. Cryst. Liq. Cryst., 1996, 284, 379–390 CrossRef; (d) S. Benmansour, M. Marchivie, S. Triki and C. J. Gómez-García, Crystals, 2012, 2, 306–326 CrossRef CAS; (e) S. Shuichi, N. Matsukawa, Y. Hideki and S. Gunzi, Synth. Met., 2003, 133, 455–457 Search PubMed; (f) S. Shuichi, Y. Hideki and S. Gunzi, Synth. Met., 2003, 135, 631–632 Search PubMed.
- G. Dupouy, S. Triki, M. Marchivie, N. Cosquer, C.-J. Gomez-Garcia, S. Pillet, E.-E. Bendeif, C. Lecomte, S. Asthana and J.-F. Letard, Inorg. Chem., 2010, 49, 9358–9368 CrossRef CAS PubMed.
- (a) J. A. Schlueter and U. Geiser, Acta Crystallogr., Sect. C: Cryst. Struct. Commun., 2003, 59(Pt 4), M146–M148 Search PubMed; (b) B. Samia, T. Smail and J. G.-G. Carlos, Magnetochemistry, 2016, 2, 1–15 Search PubMed; (c) A. Abderezak, S. Fatima, G. K. Konstantin, G. Christopher, S. Zouaoui, S. Graham and R. Jan, Polyhedron, 2015, 87, 307–310 CrossRef; (d) Y. Consuelo, B. Abdeslem, M. Nadia, A. Donatella, S. Fatima, T. Smail, L. Francesc and J. Miguel, Polyhedron, 2009, 28, 1287–1294 CrossRef; (e) S. Triki, J. Sala-Pala, M. Decoster, P. Molinie and L. Toupet, Angew. Chem., Int. Ed., 1999, 38, 113–115 CrossRef CAS; (f) S. Triki, F. Thetiot, F. Vandevelde, J. Sala-Pala and C.-J. Gomez-Garcia, Inorg. Chem., 2005, 44, 4086–4093 CrossRef CAS PubMed; (g) E. Lefebvre, F. Conan, N. Cosquer, J.-M. Kerbaol, M. Marchivie, J. Sala-Pala, M. Kubicki, E. Vigier and C.-J. Gomez-Garcia, New J. Chem., 2006, 30, 1197–1206 RSC; (h) M. L. Yates, A. M. Ari, J. L. Manson, B. A. Kalm, B. B. Burkhart and J. S. Miller, Inorg. Chem., 1998, 37, 840–841 CrossRef CAS.
- (a) G. Dupouy, M. Marchivie, S. Triki, J. Sala-Pala, C. J. Gomez-Garcia, S. Pillet, C. Lecomte and J. F. Letard, Chem. Commun., 2009, 3404–3406 RSC; (b) G. Dupouy, S. Triki, M. Marchivie, N. Cosquer, C. J. Gomez-García, S. Pillet, E.-E. Bendeif, C. Lecomte, S. Asthana and J.-F. Letard, Inorg. Chem., 2010, 49, 9358–9368 CrossRef CAS PubMed.
- (a) D. Gaelle, M. Mathieu, T. Smail, S.-P. Jean, S. Jean-Yves, J. G.-G. Carlos and G. Philippe, Inorg. Chem., 2008, 47, 8921–8931 CrossRef PubMed; (b) B. Samia, A. Chahlae, S. Fatima, T. Smaïl, M. Mathieu and J. G.-G. Carlos, Coord. Chem. Rev., 2010, 254, 1468–1478 CrossRef; (c) G. Dupouy, M. Marchivie, S. Triki, J. Sala-Pala, C. J. Gomez-García, S. Pillet, C. Lecomte and J.-F. Letard, Chem. Commun., 2009, 3404–3406 RSC.
- Y. Yukihiro, K. Masatoshi and S. Gunzi, J. Phys. Chem. B, 2009, 113(26), 8960–8966 CrossRef PubMed.
- S. Ilya, W. M. Timothy and W. James, J. Phys. Chem. B, 2013, 117(23), 7084–7094 CrossRef PubMed.
- (a) H. Gao, Z. Zeng, B. Twamley and J. M. Shreeve, Chem. – Eur. J., 2008, 14, 1282–1290 CrossRef CAS PubMed; (b) Z. Dongmei, L. Jizhen, B. Fuqiang, Y. Yahui, G. Xiaoni, Z. Weiqiang, Z. Guofang and G. Ziwei, Z. Naturforsch., B: Chem. Sci., 2015, 70, 317–326 Search PubMed.
- (a) X. Liu, J. Li, F. Bi, W. Zhang, G. Zhang and Z. Gao, Eur. J. Inorg. Chem., 2015, 1496–1504 CrossRef CAS; (b) S. Ersha, L. Dongdong, L. Jizhen, Z. Guofang, Z. Weiqiang and G. Ziwei, Z. Anorg. Allg. Chem., 2016, 642, 871–881 CrossRef.
- L. Yan, T. Ling-Zhi and Z. Shu-Zhong, Inorg. Chem. Commun., 2017, 75, 49–53 CrossRef.
- B.-M. Anna, M. N. Gene, Ż. Grażyna, Z. Aldona, P. Marcin, T. Tomasz, D. Maciej, K. Michał, J. Piotr, N. Leszek, Z. Janusz, M. Marek and W. Władysław, Sci. Rep., 2017, 7, AN: 40036 CrossRef PubMed.
- A. Samir, S. Carla and K. George, J. Therm. Anal. Calorim., 2015, 119(2), 1171–1182 CrossRef.
- (a) S. V. Karpov, A. A. Grigor'ev, Y. S. Kayukov, I. V. Karpova, O. E. Nasakin and V. A. Tafeenko, J. Org. Chem., 2016, 81, 6402–6408 CrossRef CAS PubMed; (b) S. V. Karpov, Y. S. Kaukov, A. A. Grigor'ev, O. E. Nasakin, O. V. Kaukova and V. A. Tafeenko, Org. Biomol. Chem., 2016, 14, 3758–3764 RSC.
- A. Maciejewski and R. P. Steer, J. Photochem., 1986, 1, 59–69 CrossRef.
- C. Würth, M. Grabolle, J. Pauli, M. Spieles and U. Resch-Genger, Nat. Protoc., 2013, 8, 1535–1550 CrossRef PubMed.
- F. Neese, The ORCA program system, Wiley Interdiscip. Rev.: Comput. Mol. Sci., 2012, 2(1), 73–78 CrossRef CAS.
- Luminescent analysis, ed. G. I. Romanovskaya (in Russian), Moscow, Nauka, 2015 Search PubMed.
- Y. V. Nelyubina, M. Y. Antipin and K. A. Lyssenko, Russ. Chem. Rev., 2010, 79, 167–188 CrossRef CAS.
- V. A. Tafeenko, S. I. Gurskiy, A. N. Baranov, T. V. Kaisarova and L. A. Aslanov, Acta Crystallogr., Sect. C: Cryst. Struct. Commun., 2009, 65, m52–m55 CAS.
Footnote |
| † Electronic supplementary information (ESI) available. CCDC 694326, 1452033, 1452034, 1574996, 1452031, 1574998, 1452035, 1452031, 1575039, 1575056, 1575015, 1575014, 1575020, 1575001, 1575038, 1575023, 1575055, 1575016, 1575088, 1575000, 1575021, 1575024, 1575057, 1575040, 1575041, 1575022 and 1575037. For ESI and crystallographic data in CIF or other electronic format see DOI: 10.1039/c7dt03625f |
| This journal is © The Royal Society of Chemistry 2017 |

