 Open Access Article
Creative Commons Attribution 3.0 Unported Licence
The lone-pair-electron-driven phase transition and order–disorder processes in thermochromic (2-MIm)SbI4 organic–inorganic hybrid†
A.
Gągor
 *a,
G.
Banach
b,
M.
Węcławik
c,
A.
Piecha-Bisiorek
 c and
R.
Jakubas
 c
c
aW. Trzebiatowski Institute of Low Temperature and Structure Research PAS, P.O. Box 1410, 50-950 Wrocław, Poland. E-mail: a.gagor@int.pan.wroc.pl
bInstitute of Physics, University of Zielona Góra, ul. Prof. Szafrana 4a, 65-516 Zielona Góra, Poland
cFaculty of Chemistry, University of Wrocław, Joliot-Curie 14, 50-383 Wrocław, Poland
First published on 6th November 2017
Abstract
The easy to prepare and stable in air (2-methylimidazolium) tetraiodoantimoniate(III) single-crystals with optical band gap of 2.17(1) eV at room temperature have been synthesized. The crystal structure features one-dimensional [SbI4]−n anionic chains, which are intercepted with stacks of 2MIm+ ions. At 294/295 K, it undergoes a structural phase transition to an incommensurately modulated phase as a result of subtle, lone-pair-electron-driven distortions of the anions. Separately from the anion displacements, the ordering of 2MIm+ countercations takes place over a wide temperature range of the modulated phase. The disorder changes from dynamic to static around 200 K, which affects the crystal structure leading to discontinuities and step-like contraction of the lattice parameters. The material is thermochromic with prominent color changes, from raspberry to yellow at low temperatures. The calculated electronic structures and observed optical properties signify its semiconducting character.
Introduction
Halobismuthates(III) and haloantimoniates(III) constitute an important class in the field of hybrid, organic–inorganic materials. Over the last two decades, they have been extensively explored as functional materials for optoelectronics, mainly due to their encouraging electrical, optical and elastic properties. Many of them crystallize in polar space groups exhibiting non-linear optical, piezoelectric and ferroelectric properties.1–5 Due to the thermochromic, photochromic and photovoltaic properties, the iodometallates stand out from the other halide connections.6–8 Currently, they are studied as prospective photovoltaic materials and stable in air and environmentally friendly alternatives to toxic light harvesting methylammonium lead halide.9,10 Very recently, (CH3NH3)3Sb2I9 and (CH3NH3)3Bi2I9 have been reported as new potential absorbers for photovoltaics.10,11Both dimensionality and structure of the anionic part and the nature and dynamics of the countercations govern the physical properties of the halometallates (Sb(III), Bi(III)). The basic building block of anion substructure, which is MX6 octahedron or MX5 square pyramid, may form various discrete or polymeric connections including edge-sharing, vertex sharing, and face-sharing motifs. The extended networks (chains and layers) are less common than the 0D units. It appears that iodometallates are the most promising for photovoltaic applications due to their extended anionic network, large absorption cross-sections (small energy gaps), and lower effective masses for electrons and holes. On the other hand, ferroelectricity seems to be weakly dependent on the dimensionality of the anionic substructure. This has been found to exist so far in R5M2X11 chemical compositions having discrete M2X115− bioctahedra;12,13 in R2MX5 and RMX4 having 1D polymeric anions14,15 as well as R3M2X9 with [M2X9]3−n 2D layers.16,17 Ferroelectricity arises mainly as a result of order–disorder transformations of the polar organic cations, which are more or less conjugated with the distortion of anions. The displacement-type mechanism, driven by 5s2 or 6s2 lone-pair electrons is often shielded by dominating order-disorder processes. However, the change in the degree of the lone-pair stereochemical activity with temperature appears to be responsible for phase transitions to acentric phases with polar properties.18–20 The lone-pair activity is usually suppressed when the ligands are very large. Iodine ions are the largest halogen ions, and thus iodometallates rarely adopt a square-pyramidal coordination for which the lone pair is active and acts as an additional ligand. The lone-pair-electron-driven displacement-type transitions dominate for crystals with chlorine and bromine ligands.18,21 However, BiI52− units, which form 0D structures with square pyramidal coordination or bi-octahedra Bi2I104−, also exist.22 Recently, we have shown that even in iodometallates, the lone-pair activity may influence the collective atomic displacements and lead to a phase transition in (2-MIm)BiI4.23 Herein, we present the syntheses and phase sequence in (2-methylimidazolium) tetraiodoantimoniate(III) analogue, abbr (2-MIm)SbI4. These formally isostructural compounds are characterized by a different degree of disordering. In (2-MIm)BiI4, cations are frozen just below the Tc temperature, while in (2-MIm)SbI4, the movements are active over a wide temperature range, and ordering affects the entire crystal structure, leading to the step-like lattice contraction. Additionally, structural analysis together with the DOS results further clarify which interactions are the most responsible for the prominent thermochromism observed in (2-MIm)SbI4.
Experimental
Crystal structure
Single-crystal X-ray diffraction was performed on Xcalibur diffractometer equipped with CCD camera and MoKα radiation source (λ = 0.71073 Å). CrysAlisPRO was used for data collection and reduction. An absorption correction was applied using the multi-scan approach implemented by ADSYMM. The temperature was stabilized by an open-flow cooling system (Oxford Cryosystem). The structure was solved and refined using SHELXL24 and Jana2006,25 respectively, at temperatures 330, 270, 200 and 140 K. The details of the crystal, data collection and reduction are presented in Table 1. The phase sequence in (2-MIm)SbI4 is similar to that of the recently published (2-MIm)BiI4; thus, we refer the reader for details concerning the refinement of the modulated phase to.23 The discussion of the superspace approach to the solution of the modulated structures can be found in several articles.26–28 The first order harmonics were used to calculate displacements of iodine and bismuth and the rigid-body refinement was implemented for 2-MIm+ translational and rotational modulation. The fractional coordinates and displacement parameters were also refined for individual C and N atoms. The C–N distances were constrained to the values obtained from the high-temperature phase. Hydrogen atoms were included in calculated positions. The occupancy of 2-MIm+ was modeled with harmonics at 270 K. Below this temperature, at 200 and 140 K a crenel function was used, with value 1 for x4 = [0; 1/2] and 0 elsewhere, (the second position was created in the x4 = [1/2, 1] section by the two-fold rotation axis (−x1, x2, −x3 + 1/2, x4 + 1/2), and for every value of t either 2-MIm+ or its equivalent exhibited full occupancy).| a Symmetry operations: (1) x1, x2, x3, x4; (2) −x1, x2, −x3 + 1/2, x4 + 1/2; (3) −x1, −x2, −x3, −x4; (4) x1, −x2, x3 + 1/2, −x4 + 1/2; (5) x1 + 1/2, x2 + 1/2, x3, x4; (6) −x1 + 1/2, x2 + 1/2, −x3 + 1/2, x4 + 1/2; (7) −x1 + 1/2, −x2 + 1/2, −x3, −x4; (8) x1 + 1/2, −x2 + 1/2, x3 + 1/2, −x4 + 1/2. | ||||
|---|---|---|---|---|
| Phase | II | II | II | I |
| Chemical formula | C4H7I4N2Sb | |||
| M r | 712.5 | |||
| Crystal system, space group | Monoclinic, C2/c(0β0)s0a | Monoclinic, C2/c | ||
| Temperature (K) | 139.9(2) | 200.0(2) | 270.0(1) | 330.0(2) |
| Wave vectors | q = 0.604(1)b* | q = 0.604(1)b* | q = 0.605(1)b* | |
| a, b, c (Å) | 13.445(2), 12.812(5), 7.77(1) | 13.489(6), 12.844(5), 7.768(9) | 13.550(1), 12.897(2), 7.821(1) | 13.575(1), 12.933(1), 7.842 (1) |
| β (°) | 94.5 (2) | 94.4 (1) | 94.2 (1) | 94.16 (1) |
| V (Å3) | 1334.4 (18) | 1341.9 (18) | 1363.1 (3) | 1373.1 (2) |
| Z | 4 | |||
| Radiation type | Mo Kα | |||
| μ (mm−1) | 11.28 | 11.22 | 11.04 | 10.96 |
| Crystal size (mm) | 0.11 × 0.15 × 0.20 | |||
| Diffractometer | Xcalibur, Atlas | |||
| T min, Tmax | 0.521, 1 | 0.521, 1 | 0.489, 1 | 0.475, 1 |
| No. of measured, independent and observed [I > 3σ(I)] ref. | 17![[thin space (1/6-em)]](https://www.rsc.org/images/entities/char_2009.gif) 130, 4940, 2658 130, 4940, 2658 |
17![[thin space (1/6-em)]](https://www.rsc.org/images/entities/char_2009.gif) 275, 4980, 2542 275, 4980, 2542 |
17![[thin space (1/6-em)]](https://www.rsc.org/images/entities/char_2009.gif) 296, 5025, 2168 296, 5025, 2168 |
4897, 1309, 1044 [I > 2σ(I)] |
| R int | 0.038 | 0.039 | 0.042 | 0.031 |
(sin![[thin space (1/6-em)]](https://www.rsc.org/images/entities/char_2009.gif) θ/λ)max (Å−1) θ/λ)max (Å−1) |
0.699 | 0.707 | 0.707 | 0.610 |
| R[F2 > 2σ(F2)], wR(F2), S (mean) | 0.030, 0.071, 0.92 | 0.031, 0.074, 0.93 | 0.034, 0.076, 0.90 | 0.036, 0.118, 1.14 |
| R[F2 > 2σ(F2)], wR(F2), (main) | 0.026, 0.072 | 0.026, 0.074 | 0.028, 0.067 | |
| R[F2 > 2σ(F2)], wR(F2), (satellites) | 0.037, 0.081 | 0.040, 0.064 | 0.047, 0.094 | |
| No. of reflections (main/satellites) | 1019/1639 | 1019/1523 | 1002/1166 | 1309 |
| No. of parameters | 105 | 105 | 105 | 90 |
| H-atom treatment | H-atom parameters constrained | |||
| Δρmax, Δρmin (e Å−3) | 0.69, −0.95 | 0.50, −0.81 | 0.41, −0.93 | 1.50, −1.43 |
Synthesis
The starting materials were commercial antimony(III) iodide (Sigma-Aldrich, ≥99.8%) and 2-methylimidazole (Sigma-Aldrich, ≥99%). (2-MIm)SbI4 crystals were prepared by dissolving stoichiometric amounts of SbI3 and 2-MIm in diluted HI solution. Dark red, plate-like single crystals were grown from an aqueous solution by slow evaporation at constant room temperature (300 K).Dielectric measurements
The complex dielectric constant, ε* = ε′ − iε′′ was measured between 140 and 320 K by the Agilent 4284A Precision LCR Meter in the frequency range between 135 Hz and 2 MHz. The overall error was less than 5%. The measurements were carried out on a single-crystal (5 × 3 × 1 mm3) and powder samples. The La Bail refinement of the powder diffraction data is presented in Fig. S1 in ESI.† The samples were deposited with silver conducting glue. The dielectric measurements were carried out in a controlled atmosphere (N2). The complex dielectric constant was modeled with the Cole–Cole function.TGA, DTA and DSC
TGA–DTA measurements were performed on a Setaram SETSYS 16/18 instrument in the temperature range 300–750 K with a ramp rate 2 K min−1. The scan was performed in flowing nitrogen (flow rate 1 dm3 h−1). Differential scanning calorimetry (DSC) runs were recorded using a PerkinElmer DSC-7 system in the temperature range 160–320 K with a scanning rate of 10 K min−1.Calculation details
The first-principles calculations were carried out using density-functional theory (DFT), the full potential linear augmented plane-wave method (FLAPW) was implemented in the WIEN2K29 package, and norm-conserving pseudopotentials with pseudo-atomic localized basis functions were implemented in the OpenMX version.30,31 The first analyses were performed for the high-temperature phase with the FLAPW method. The symmetry of the unit cell was reduced to P1, consisting of 18 atoms, to avoid partial occupancy of atom sites. Both, anionic and cationic parts were considered for the calculations. The obtained results were adopted as a reference for further pseudopotential studies in OpenMX, which were carried out subsequently for each temperature phase. Both methods gave the same density of states and energy gaps. This allowed us to perform calculations for the very large unit cell in the low-temperature phase containing 360 atoms (5-fold approximant of the high-temperature cell along the b axis in P1 symmetry) using norm-conserving pseudopotentials with pseudo-atomic localized basis functions.The following parameters were adopted for calculation in WIEN2K: the Brillouin zone of the binary compounds primitive cell was sampled using 5 × 4 × 4 Monkhorst and Pack mesh (42 k-points), and the muffin-tin radii Rmt were set to 2.2, 2.0, 1.14, 0.57, and 1.05 bohr for Sb, I, C, H, and N, respectively. The product of Rmt and Kmax was 7. Similar parameters were assumed in OpenMX: 5 × 4 × 4 Monkhorst and Pack mesh and 300 Ry for cutoff energy. In all cases, the Generalized Gradient Approximation (GGA) of Perdew, Burke, and Ernzerhof (PBE)32 was used for the exchange–correlation energy. For low-temperature calculations, due to the large size of the unit cell, considerably smaller parameters were used: 1 × 1 × 2 Monkhorst and Pack mesh and 200 Ry for cutoff energy.
Results and discussion
Phase transition and dielectric properties
(2-MIm)SbI4 is stable in air up to 350 K, Fig. 1(a). It undergoes a phase transition at 294/295 (cooling/heating), which is evidenced in the DSC data (Fig. 1(b)) as a very weak thermal effect, with a temperature hysteresis ∼1 K. These features point to subtle distortions of the crystal structure. Temperature hysteresis and step-like changes of lattice parameters (Fig. 2) point to a weak first-order character of the transformation.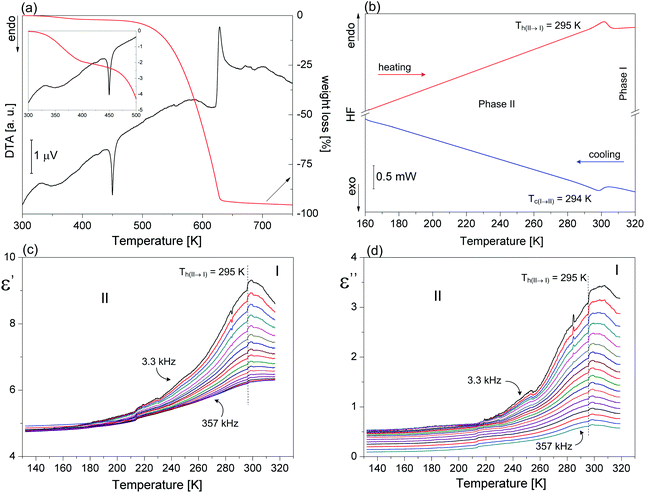 | ||
| Fig. 1 (a) DSC traces for (2-MIm)SbI4 on cooling and heating scans, (b) DTA and TG results, (c)–(d) the real and imaginary parts of the complex electric permittivity in (2-MIm)SbI4. | ||
Dielectric constant measurements were carried out both for the powder sample and for the single crystal along the [010], [001] and [1–10]-directions. The dielectric results differ substantially. Temperature dependence of the real and imaginary parts of the dielectric constant measured along the b-axis is shown in Fig. 1(c) and (d). Around the expected phase transition close to 294 K, ε′ vs. temperature curves show maxima at low frequencies, whereas in the higher frequency region, there is a change in the slope of the linear part of ε′(T). A quite similar dielectric function is recorded for the imaginary part of permittivity (ε′′). No dielectric relaxation processes are visible along the [010] and [001] directions, (Fig. S2(a)†), in the temperature region studied here. On the other hand, dielectric measurements for the powder sample and based on [1–10] disclosed weak low-frequency relaxation processes in the low-temperature region of phase II, see ESI Fig. S2(b), (c) and S3.†
The observed divergence in the dielectric constants is probably due to the conductivity process, which may mask the dielectric relaxation phenomena. It also indicates that dielectric properties of the (2-MIm)SbI4 are characterized by a strong anisotropy.
The crystal structure of phase I
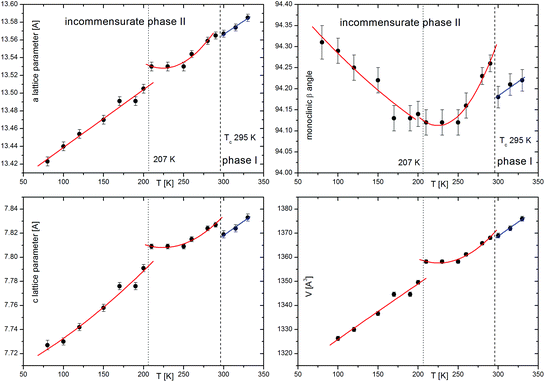
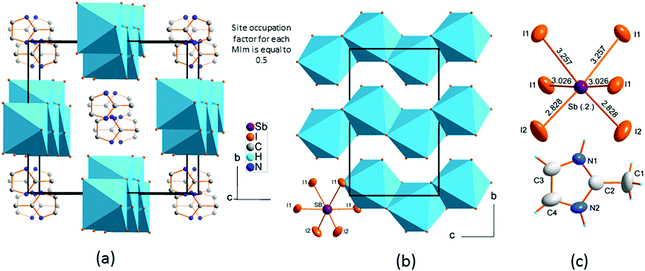
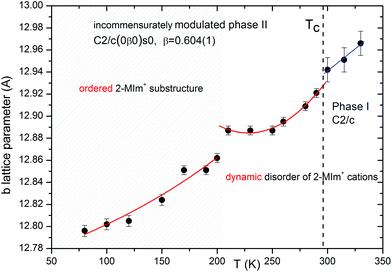
(2-MIm)SbI4 is isostructural in phase I to its bismuth analogue.23 It crystallizes in the monoclinic C2/c space group. The crystal structure comprises [SbI4]−n chains of edge-shared octahedra that are intercepted with stacks of 2MIm+ ions. Fig. 3 illustrates the main features of the crystal structure in phase I. The 2MIm+ ion is dynamically disordered over two positions, which have a 50% probability of being occupied. The switching between the two settings may be done by rotations of the whole molecule in the plane of the ring. This can possibly be explained by hydrogen contacts, which are too weak to anchor the countercations. In both (2-MIm)SbI4 and (2-MIm)BiI4, the size of the crystal void occupied by the 2-MIm+ is almost the same, 274 vs. 279 Å3, respectively. Zig-zag [SbI4]−n chains expand along the c-direction. The basic unit, building the entire anionic substructure, is the SbI6 octahedron of C2 symmetry. The asymmetric unit consists of one Sb and two I atoms, bridging I1 and terminal I2, as well as one 2MIm+ with 1/2 occupancy. Due to the trans-effect present in halometallates,33 the Sb–I bonds show distinct differences in bond lengths with the shortest terminal bonds (Sb–I2) and the longest terminal bridging bonds (Sb–I1).Upon cooling, extra diffraction peaks appear in the b direction where Tc ∼ 294 K. At the same time, a subtle contraction of the unit cell takes place. All diffraction patterns may be indexed (H = ha* + kb* + lc* ± 1q) by introducing the modulation vector q = 0.605(1)b*; hence, only first-order satellites are present. Fig. 3 presents the temperature evolution of lattice parameters in the cooling run. The most affected by the phase transition are the c-direction and the monoclinic β angle, which exhibit step-like anomalies. With temperature lowering, the unit cell contracts in all directions. Around 200 K, the second discontinuity in unit cell parameters appears. This alteration in the lattice behavior couples to the changes of the dynamic 2-MIm+ counter-cations observed around 200 K in dielectric relaxation processes (Fig. S2 and S3†).
The crystal structure of phase II
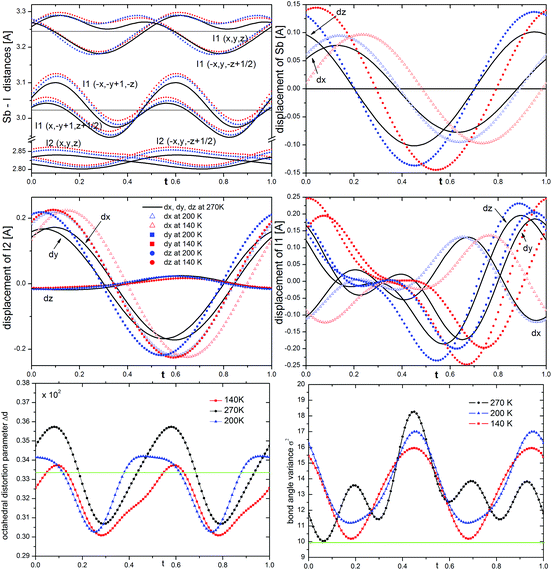
The phase transition is associated with the incommensurate modulation of the crystal structure with a temperature-invariable modulation vector of q = 0.605(1)b* (at 270 K), and may be described in the C2/c(0β0)s0 super-space group (β – the amplitude of q). The symbol of the space group means that the lattice is monoclinic, b-unique with additional (3 + 1) dimensional centering (1/2 1/2 0 0) and a modulation wave vector parallel to the b* axis. The two-fold rotation axis is associated with an intrinsic shift of 1/2 along the fourth dimension; the c-glide plane is related to a phase inversion of the modulation wave.The final structural model of modulated phase can be described by the following two features: translation and deformation of the [SbI4]−n chains and ordering of the 2-MIm+ cations (site occupancy factor changes from 0.5 to 0 or 1). The modulation of anionic substructure may be described in terms of sinusoidal waves of displacements of atoms from their high-temperature positions. The Sb3+ and I− coordinates vary as shown in Fig. 4. The terminal iodine atoms I(2) display the largest shifts in the (a,b) plane with the highest amplitude of 0.22 Å at 140 K. The bridging I(1) atoms shift in all directions with the largest amplitude for dx and dz of 0.25 Å. Due to the symmetry restrictions, Sb displacements take place only in (a,c) plane with similar amplitudes along and perpendicular to the chains (max dz = 0.15 Å and max dx = 0.10 Å at 140 K). The first-order components of the modulation wave of Sb displacements in the b direction are equal to 0.
It is worth noting that the sinusoidal modulation appears at Tc and does not affect the anions much as the temperature is lowered. The amplitudes of atomic displacements and Sb–I distances are comparable at 270, 200 and 140 K, see the colored lines in Fig. 4. With temperature lowering the Sb–I(2) distances of terminal iodine, the Sb–I(1) distances to bridging across bridging iodine atoms progressively grow. This may be explained by an increase in the attraction between I(2) and I(1) ions and NH hydrogen donors from 2-MIm+. However, even at 140 K, the N–H⋯I interactions are very weak. Table S1 and Fig. S4 in ESI† show the geometry of the possible hydrogen bond interactions in phase I and modulated phase II. At 330 K the N⋯I distances range from 3.609(12) to 4.215(10) Å; the corresponding N–H–I angles vary from 120 to 158°. N2–H2⋯I2 contacts do not fulfill the Jeffrey criterion34 for hydrogen bond formation, which requires N⋯I distance to be less than 4.03 Å for N–H⋯I hydrogen bonds. On the other hand, N1–H1⋯I1 contacts have a poor N–H–I angles, which do not go beyond 125°. In the modulated phase, the N⋯I distances oscillate around the non-modulated values, for different t. However, the geometry of the longest bonds slightly improves.
The modulation affects the coordination sphere of Sb3+. The point group symmetry is reduced from C2 to C1, and Sb3+ shifts more from the center of gravity of the ligands than that in the high-temperature phase. The bond angle variance σ2 of coordination octahedra35 notably increases in the modulated phase for all t (see Fig. 4). It reaches the highest values at 270 K and then decreases as the temperature lowers. However, even at 140 K it is larger than in phase I. In turn, the octahedral distortion parameter Δd oscillates at 270 K around the non-modulated value and, similar to σ2, decreases at low temperatures.
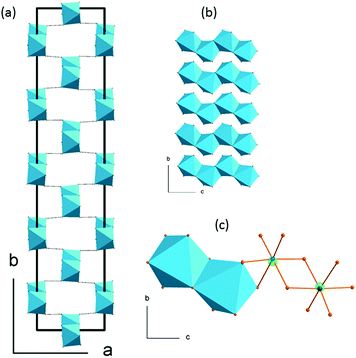
The 5-fold approximant of the modulated phase is presented in Fig. 5. The basic building block of each chain is built of two neighboring octahedra of C1 symmetry. These bi-units are the same in every chain laying on the same (a,c) plane. Their geometry changes, however, from plane to plane when going in the b-direction. In (2-MIm)SbI4, the atomic displacements, and thus, alterations of anionic substructure are smaller than distortions observed in bismuth analogue. The disorder present on terminal iodine sites in [BiI4]−n chain (as two split sites) is not observed in (2-MIm)SbI4 crystals. In (2-MIm)BiI4, the octahedral distortion parameters are remarkably lower, see Fig. S5 is ESI.† On the other hand, the displacements of bismuth and iodine atoms from non-modulated values in phase II are almost twice as large as those in the (2-MIm)SbI4 analogue (maximum dx and dy displacements ∼0.4 Å). This implies that the [BiI4]n− chains are much more liable to bending deformation and may easily adjust to the change in the local arrangement of cations and suppress their movements by the N–H⋯I interactions. In (2-MIm)BiI4, cations are frozen just below the Tc temperature.
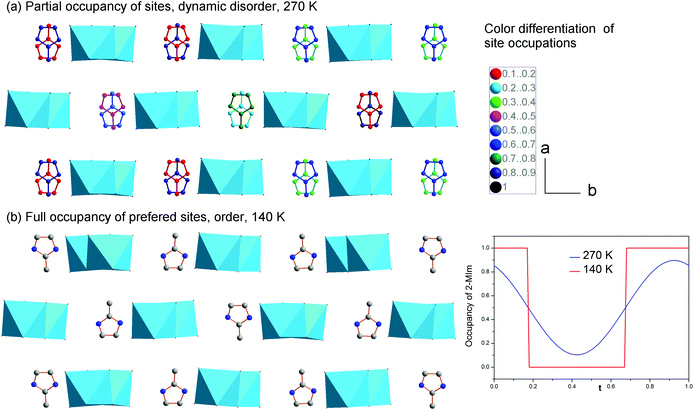
The second structural feature of the modulated phase concerns the ordering of 2-MIm+. In the studied crystals, two models have been developed to explain the dielectric properties and lattice behavior in the modulated phase. Starting from the high-temperature phase, the 2-MIm+ counter-cations may occupy two equivalent positions with methyl groups directed opposite to each other, in one crystal cavity. A lack of a strong directional bonding allows for thermally-activated rotations of whole cations and switching between the two positions. Cooling gradually dismisses these movements. The dielectric permittivity shows that the distinct cation dynamics is present down to 200 K, Fig. S2 and S3 in ESI.† Thus, the occupancy of the 2-MIm+ in the modulated phase at 270 K, was refined with harmonics. This approach gave better final R factors for all reflections as well as corresponded well to the dielectric response. Fig. 6(a) illustrates the disorder of 2-MIm+ at 270 K. The two high temperature positions are still occupied; however, in modulated phase they are not equivalent and may adopt different occupation factors. The sum of the occupancies of both positions is equal to 1.
Further cooling leads to the ordering of the cationic substructure. The step-like lattice contraction and a change in the dielectric response around 200 K are associated with the freezing of the reorientation motions of dipolar units. The refinement of the structure at 200 and 140 K gives better results for the Crenel function, which describes a totally ordered cationic substructure. Each cavity possesses one, fully occupied position. The two models are compared in Fig. 6. In the real crystal, the distribution of the cations may be regarded as statistical disorder. On the length scale of a few unit cells, there are regions with a different number of ions directed in opposite directions, which give uncompensated local dipole moments. The (3 + 1) dimensional symmetry operations, however, reproduce the structure with the same number of 2-MIm+ cations oriented parallel and antiparallel.
The summary of structural changes in (2-MIm)SbI4 is presented in Fig. 7. In the wide temperature range, they involve both distortions of anionic substructure and ordering of the 2-MIm+ counter-cations. However, the normal-to-modulated phase transformation affects mainly the anionic framework. The ordering of 2-MIm+ counter-cations takes place at lower temperatures and affects the lattice with step-like contraction in all directions. The complex structures observed in (2-MIm)SbI4 crystals result from the interplay between the short-range intermolecular forces, the flexibility of the anionic units and the steric effects associated with them. Additionally, the thermally activated dynamics complicate the picture. It seems that between 200 and 295 K, the hydrogen bond interactions are not able to overcome the thermally induced rotations of cations. Ordering of the cations below 200 K coincides with lowering of Δd and σ2 at 200 K and a significant reduction of the distortion parameters with further cooling. It may be inferred that at low temperatures, the N–H⋯I interactions affect the anionic part and cannot be neglected.
Thermochromism
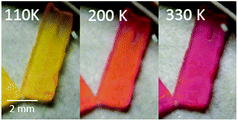
The (2-MIm)SbI4 is a thermochromic material. Lowering of the temperature induces a color change from raspberry at 330 K to yellow at 150 K, Fig. 8. The brightening of the crystal points to modification of the electronic structure near the Fermi level and increase of the optical band gap at low temperature. The optical gap obtained from UV-vis spectroscopy at ambient temperature using the Kubelka–Munk method36 is equal to 2.17(1) eV and fits well the band gap calculated by DFT methods (2.00 eV at 330 K), which is only slightly underestimated. The color changes are related mostly to the modification of the anionic substructure. The cation electronic levels lay deep in the valence band and do not affect the Fermi level. It may be established from the crystal structure analysis that the inter-chain I–I contacts do not disturb the electronic structure as well. Their length at low temperatures is shorter compared to that in phase I, shorter even than the van der Waals contact distance (3.96 Å). This contraction should reduce the energy gap, which is opposed to observed thermochromism. Thus, only Sb⋯Sb and intra-chain Sb–I interactions shape the DOS around the Fermi level and decide about the electronic and optical properties.DOS
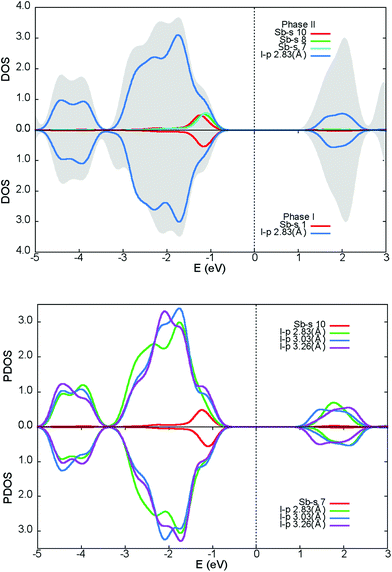
Fig. 9 illustrates the total density of states (DOS) with selected atomic-resolved DOS (PDOS) in both phases. The states of the conduction band are dominated by iodine atoms, whereas both types of atoms contribute to upper states of the valence band. The total DOS seems to be undisturbed after the transition. The foremost differences between the phases are seen in the PDOS. The modulation affects the position of the Sb-s states maxima near the top of the valence band and the total Sb-s states are smeared to a larger degree than the non-modulated phase. PDOS in the modulated phase, for the two Sb-s states most affected by the modulation, together with their iodide ligands, are shown at the bottom of the Fig. 9. It may be noted that the PDOS of the I-p states coordinating to Sb(10) is remarkably disordered compared to the Sb(7) ligands. In both phases, the Sb-s and I-p states are mixed near the top of the valence band and in the conduction band, which denotes that the Sb3+ lone pair is active.37,38 The main difference between the phases concerns the upper region of the valence band. In the modulated phase, the PDOS distribution of the Sb-s and I-p states is modified. This may be a sign of the change in activity of the bismuth lone pair electrons in the modulated phase. Sb-s and I-p electron coupling creates a modulated charge distribution in the unit cell. As the temperature increases, the coupling of the s–p Sb and I electrons becomes more symmetrical and the modulated distribution in the cell disappears.To visualize the lone pair associated with Sb3+, the total charge distribution map is shown for phase I in Fig. 10(a). The map has been drawn in a way to accommodate all Sb–I inequivalent distances; Sb to terminal, bridging across terminal and bridging across bridging iodine. The shortest bonds have denser electron distributions. This is best visualized for the Sb–I2 bond to terminal iodine, which is the strongest one in the structure. A stereoactive lone pair of electrons density can clearly be seen as a semi-circle on the difference map of the total charge density and the superposition of atoms charge density, opposite to the most bonding iodine I2.
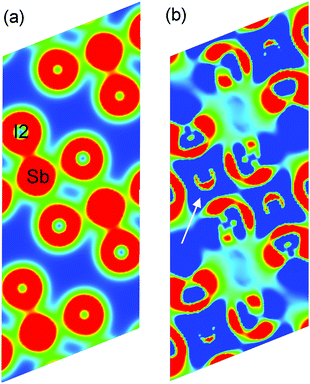 | ||
| Fig. 10 (a) The map of the total charge density for the surface intersecting Sb, I2, and two I1 atoms. The saturation set up (min, max) = (0.0005, 0.06). (b) The difference map of the total charge density and the superposition of atoms charge density. The stereoactive lone pair is marked by arrows. The saturation set up (min, max) = (0.0001, 0.0015). Created in Vesta.39 | ||
Conclusions
(2-MIm)SbI4 crystals undergo a normal-to-modulated phase transition around 295 K. The transformation from the monoclinic C2/c space group to the modulated C2/c(0β0)s0 super-space group is associated with a subtle distortion of [SbI4]−n chains of edge-shared octahedra. The driving force of the transition is the change in stereochemical activity of the Sb3+ lone-pair inducing deformation of SbI6 octahedral units. Thermal evolution of lattice parameters as well as dielectric behavior indicate that ordering of 2-MIm+ counter-cations takes place at lower temperatures and affects the lattice with a step-like contraction in all directions. The rotations of 2-MIm+ between the two allowed high-temperature positions are blocked around 200 K and the dynamic disorder converts to static with 2-MIm+ occupancy described by the crenel function in (3 + 1) dimensional space.(2-MIm)SbI4 is thermochromic with prominent color changes, from raspberry (at 330 K) to yellow (at 110 K), which correlates to the modification of the intra chain Sb–I and Sb⋯Sb connections. The alteration of inter-chain I⋯I contacts do not disturb the electronic structure.
Conflicts of interest
There are no conflicts to declare.Acknowledgements
Authors are indebted to referees for valuable comments and suggestions. We also would like to thank Prof. Przemysław Dereń for taking the pictures of crystals at various temperatures.Notes and references
- N. Mercier, Eur. J. Inorg. Chem., 2013, 1, 19 CrossRef.
- S. A. Adonin, M. N. Sokolov and V. P. Fedin, Coord. Chem. Rev., 2016, 312, 1 CrossRef CAS.
- T. Hang, W. Zhang, H. Ye and R. Xiong, Chem. Soc. Rev., 2011, 40, 3577 RSC.
- W. Zhang and R. Xiong, Chem. Rev., 2012, 112, 1163 CrossRef CAS PubMed.
- R. Lin, G. Xu, M. Wang, G. Lu, P. Li and G. Guo, Inorg. Chem., 2013, 52, 1199 CrossRef CAS PubMed.
- A. M. Ganose, Ch. N. Savory and D. O. Scanlon, Chem. Commun., 2017, 53, 20 RSC.
- M. Lyu, J.-H. Yun, M. Cai, Y. Jiao, P. V. Bernhardt, M. Zhang, Q. Wang, A. Du, H. Wang, G. Liu and L. Wang, Nano Res., 2016, 9, 692 CrossRef CAS.
- R. L. Z. Hoye, R. E. Brandt, A. Osherov, V. B. Stevanovic, S. D. Stranks, M. W. B. Wilson, H. Kim, A. J. Akey, J. D. Perkins, R. C. Kurchin, J. R. Poindexter, E. N. Wang, M. G. Bawendi, V. Bulovic and T. Buonassisi, Chem. – Eur. J., 2016, 22(8), 2605 CrossRef CAS PubMed.
- N. A. Yelovik, A. V. Mironov, M. A. Bykov, A. N. Kuznetsov, A. V. Grigorieva, Z. Wei, E. V. Dikarev and A. V. Shevelkov, Inorg. Chem., 2016, 55, 4132 CrossRef CAS PubMed.
- B.-W. Park, B. Philippe, X. Zhang, H. Rensmo, G. Boschloo and E. M. J. Johansson, Adv. Mater., 2015, 27, 6806 CrossRef CAS PubMed.
- D. M. Fabian and S. Ardo, J. Mater. Chem. A, 2016, 4, 6837–6841 CAS.
- A. Piecha, A. Białońska and R. Jakubas, J. Phys.: Condens. Matter, 2008, 20, 325224 CrossRef.
- R. Jakubas and L. Sobczyk, Phase Transitions, 1990, 20, 163–193 CrossRef CAS.
- A. Piecha, A. Białońska and R. Jakubas, J. Mater. Chem., 2012, 22, 333 RSC.
- W. Bi, N. Leblanc, N. Mercier, P. Auban-Senzier and C. Pasquier, Chem. Mater., 2009, 21, 4099 CrossRef CAS.
- G. Bator, R. Jakubas, L. Sobczyk and J. Mróz, Ferroelectr. Lett. Sect., 1987, 74, 339 Search PubMed.
- J. Zaleski and A. Pietraszko, Acta Crystallogr., Sect. B: Struct. Sci., 1996, 52, 287 Search PubMed.
- W.-P. Zhao, Ch. Shi, A. Stroppa, D. Di Sante, F. Cimpoesu and W. Zhang, Inorg. Chem., 2016, 55, 10337–10342 CrossRef CAS PubMed.
- R. Jakubas, A. Piecha, A. Pietraszko and G. Bator, Phys. Rev. B: Condens. Matter, 2005, 72, 104107 CrossRef.
- P. Szklarz, M. Gałązka, P. Zieliński and G. Bator, Phys. Rev. B: Condens. Matter, 2006, 74, 184111 CrossRef.
- A. Gagor, M. Wojtas and R. Jakubas, Acta Crystallogr., Sect. B: Struct. Sci., 2009, 182, 3021 Search PubMed.
- Y. Chen, Z. Yang, Ch.-X. Guo, Ch.-Y. Ni, Z.-G. Ren, H.-X. Li and J. Lang, Eur. J. Inorg. Chem., 2010, 5326 CrossRef CAS.
- A. Gągor, M. Węcławik, B. Bondzior and R. Jakubas, CrystEngComm, 2015, 17, 3286–3296 RSC.
- G. M. Sheldrick, Acta Crystallogr., Sect. A: Found. Crystallogr., 2008, 64, 112 CrossRef CAS PubMed.
- V. Petricek, M. Dusek and L. Palatinus, Z. Kristallogr., 2014, 229(5), 345 CAS.
- T. Janssen, A. Janner, A. Looijenga-Vos and P. M. de Wolff, International Tables of Crystallography, 1992, vol. C, p. 797 Search PubMed.
- A. Schönleber, Z. Kristallogr., 2011, 226, 499–517 Search PubMed.
- T. Wagner and A. Schönleber, Acta Crystallogr., Sect. B: Struct. Sci., 2009, 65, 249 CAS.
- P. Blaha, K. Schwarz, G. K. H. Madsen, D. Kvasnicka and J. Luitz, WIEN2K: An Augmented Plane Wave+Local Orbitals Program for Calculating Crystal Properties, Technische Universität Wien, Austria, 2001 Search PubMed.
- T. Ozaki, Phys. Rev. B: Condens. Matter, 2003, 67, 155108 CrossRef.
- http://www.openmx-square.org/ .
- J. P. Perdew, K. Burke and M. Ernzerhof, Phys. Rev. Lett., 1996, 77, 3865–3868 CrossRef CAS PubMed.
- J. Laane and P. W. Jagodzinski, Inorg. Chem., 1980, 19, 44 CrossRef CAS.
- G. A. Jeffrey, An Introduction to Hydrogen Bonding, Oxford University Press, 1997 Search PubMed.
- M. E. Fleet, Mineral. Mag., 1976, 40, 531 Search PubMed.
- P. Kubelka and F. Munk, Z. Tech. Phys., 1931, 12, 593 Search PubMed.
- L. E. Orgel, J. Chem. Soc., 1954, 4, 3815 Search PubMed.
- U. V. Waghmare, N. A. Spaldin, H. C. Kandpal and R. Seshardi, Phys. Rev. B: Condens. Matter, 2003, 67, 125111 CrossRef.
- K. Momma and F. Izumi, J. Appl. Crystallogr., 2011, 44, 1272 CrossRef CAS.
Footnote |
| † Electronic supplementary information (ESI) available. CCDC 1576308. For ESI and crystallographic data in CIF or other electronic format see DOI: 10.1039/c7dt03622a |
| This journal is © The Royal Society of Chemistry 2017 |

