
 Open Access Article
 This Open Access Article is licensed under a
 Creative Commons Attribution 3.0 Unported Licence
A mononuclear iron carbonyl complex [Fe(μ-bdt)(CO)2(PTA)2] with bulky phosphine ligands: a model for the [FeFe] hydrogenase enzyme active site with an inverted redox potential†
M.
Natarajan
a,
H.
Faujdar
a,
S. M.
Mobin‡
 b,
M.
Stein
*c and
S.
Kaur-Ghumaan
*a
b,
M.
Stein
*c and
S.
Kaur-Ghumaan
*a
aDepartment of Chemistry, University of Delhi, Delhi 110007, India. E-mail: skaur@chemistry.du.ac.in
bNational Single Crystal X-ray Diffraction Facility, IIT Bombay, Powai, Mumbai 400076, India
cMax-Planck-Institute for Dynamics of Complex Technical Systems, Molecular Simulations and Design Group, Sandtorstrasse 1, 39106 Magdeburg, Germany. E-mail: matthias.stein@mpi-magdeburg.mpg.de; Fax: +49-391-6110403
First published on 10th July 2017
Abstract
A mononuclear hexa-coordinated iron carbonyl complex [Fe(μ-bdt)(CO)2(PTA)2] 1 (bdt = 1,2-benzenedithiolate; PTA = 1,3,5-triaza-7-phosphaadamantane) with two bulky phosphine ligands in the trans position was synthesized and characterized by X-ray structural analysis coulometry data, FTIR, electrochemistry and electronic structure calculations. The complex undergoes a facilitated two-electron reduction 1/12− and shows an inverted one-electron reduction for 1/1− at higher potentials. Electrochemical investigations of 1 are compared to the closely related [Fe(bdt)(CO)2(PMe3)2] compound. A mechanistic suggestion for the hydrogen evolution reaction upon proton reduction from acid media is derived. The stability of 1 in both weak and strong acids is monitored by cyclic voltammetry.
Introduction
The metabolism of hydrogen in cyanobacteria and other microorganisms is catalyzed by hydrogenase enzymes (H2ase).1 There are three types of hydrogenases known: [FeFe], [Fe] only and [NiFe].2 The [FeFe] hydrogenases have a bias to catalyse hydrogen production under mild conditions. The structure of the hydrogenases has been established by X-ray crystallographic measurements in the late 90s.3 Based on X-ray structure determination and spectroscopic studies, the active site of the enzyme has been shown to consist of a Fe2S2 core linked to a cubanoid [Fe4S4] cluster via the cysteine S atom. In addition, inorganic CO and CN− ligands complete the coordination sphere of the iron centres in the Fe2S2 core (Fig. 1).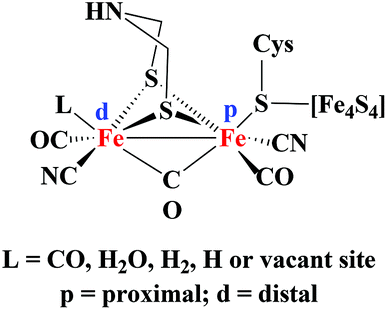 | ||
| Fig. 1 Schematic representation of the [FeFe] hydrogenase enzyme active site. | ||
Close mimics of the active site have been synthesized in order to generate biomimetic hydrogen producing catalysts. In this regard, many diiron complexes with a wide variation of dithiolate linkers and σ-donating ligands have been developed in an attempt to prepare models resembling the active site of the enzyme.2,4 There are only few examples of mononuclear iron carbonyl complexes with dithiolate and phosphine ligands (mono- or bi-dentate and cyclic) (Fig. 2).5–7 The mononuclear complexes have gained significant interest as minimal functional models of the coordination of Fed (d = distal) where H2 is formed.
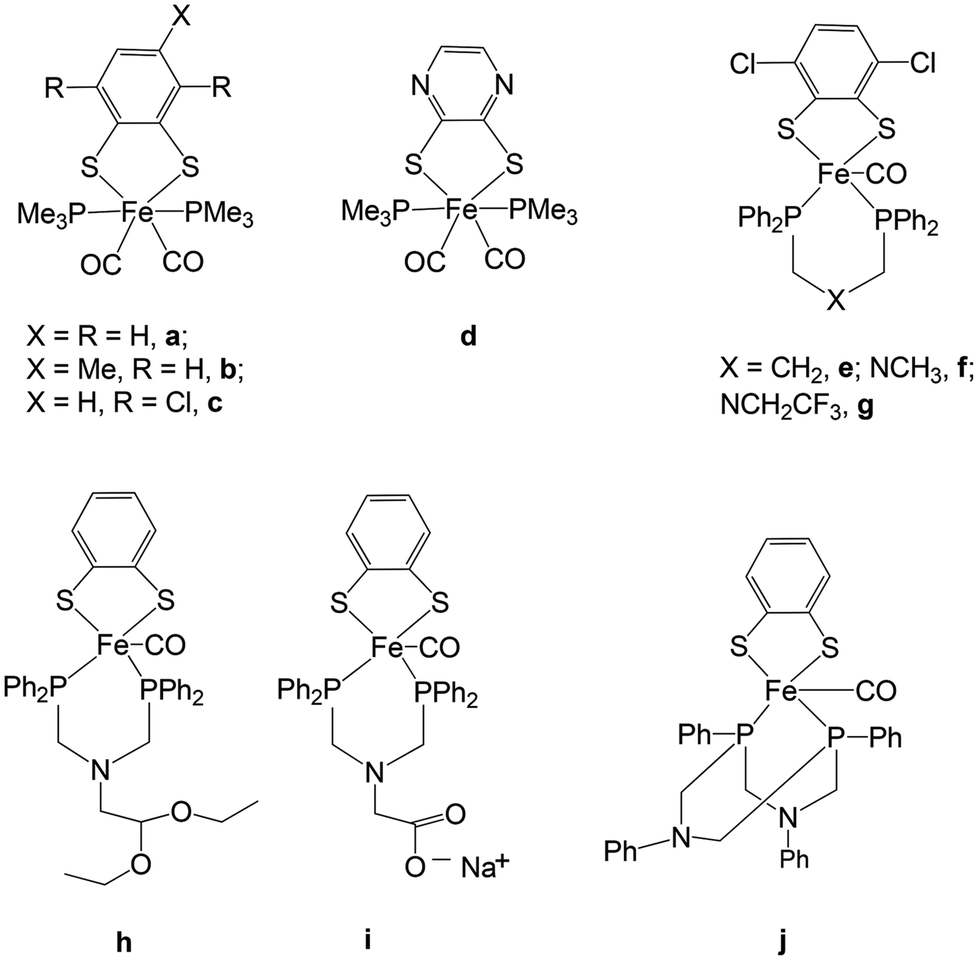 | ||
| Fig. 2 Reported mononuclear complexes (a–j) from the literature. | ||
Examples of mononuclear, functional catalysts have been reported by Ott and co-workers where they have shown that complexes a and c are minimal models for the [FeFe] hydrogenase active site.5 Complex d reported by Gao and co-workers can also catalyze the production of hydrogen from acetic acid via two different pathways (ECCE and EECC) depending on the sequence of one-electron reduction events (−2.02 and −2.28 V vs. Fc/Fc+).7 The results for complex d were consistent with those obtained by Ott et al. on analogous complexes (a and c).5 Ott and co-workers have also reported penta-coordinated Fe-complexes (e–j) as minimal models for the Fed-centre.6 DuBois and co-workers have shown that mononuclear Ni complexes can also function as viable catalysts for hydrogen production.8 Other mononuclear iron complexes developed so far have been compared mainly with the mononuclear [Fe] hydrogenase active site known to catalyze the reverse oxidation of hydrogen to protons by using an organic cofactor.9 There is still no final conclusion regarding the mechanism of hydrogen production from the dinuclear complexes. The stability of the intermediate hydride species during the reaction cycle of hydrogen formation is critical for an efficient production process. The overstability and diminished reactivity of the bridging hydride is discussed versus the higher reactivity of the terminal hydride4,10 or the sequential formation of first the terminal and then the bridging hydride by some of the catalysts. Mononuclear Fe biomimetic complexes are not able to form the bridging hydride species but breaking of an iron–thiolate bond is required to open an iron coordination site. We hence investigate the influence of a sterically demanding ligand on the reduction potentials and Fe–thiolate bond dissociation.
The bulky phosphine ligand 1,3,5-triaza-7-phosphaadamantane (PTA, having N-atoms) makes the mononuclear catalyst more water-soluble in comparison with PMe3,5 provides additional protonation sites at the nitrogen atoms of the ligand and an increase of electron density at the iron atom compared to the all carbonyl complex. These modifications provide additional insight into factors influencing the stability of various intermediates during the catalytic cycle. The aim was to improve the solubility of the catalyst in aqueous solution due to the presence of hydrophilic PTA ligands. Even though FeFe dinuclear complexes with PTA have already been reported and studied,11 it is interesting to compare their properties and functions with mononuclear iron complexes with PTA. Hence, in this paper, we report the synthesis and electrochemical investigations of the mononuclear iron complex Fe(μ-bdt)(CO)2(PTA)21 [bdt = 1,2-benzeneditholate;]. Multi-electron transfer reactions usually proceed via a sequential one-electron reduction with positive redox potential differences. Negative potential differences have been reported for several organic compounds and multinuclear transition metal complexes.12 Such a redox potential inversion is indicative of large structural rearrangements to facilitate the second reduction step at lower potentials than the first.
Results and discussion
Preparation and structural characterization
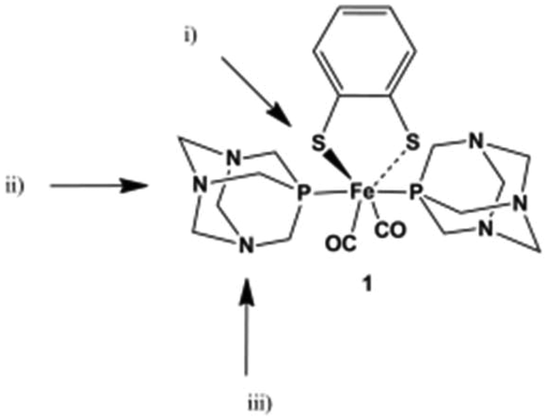
The mononuclear complex [Fe(μ-bdt)(CO)2(PTA)2] 1 was synthesized from FeCl2, bdt and PTA in methanol under a CO atmosphere in a fair yield of approximately 30% (Scheme 1). It was characterized by various spectroscopic techniques including X-ray crystallography. The 1H NMR spectrum of 1 in CDCl3 (see the ESI†) displayed peaks at 7.19 and 6.72 ppm for the four protons of the phenyl ring of the dithiolate ligand and two peaks at 4.47 and 4.22 ppm for twenty four protons of the adamantane ligand. A singlet at −36.78 ppm was observed in the 31P {1H} NMR spectrum of the complex in CDCl3.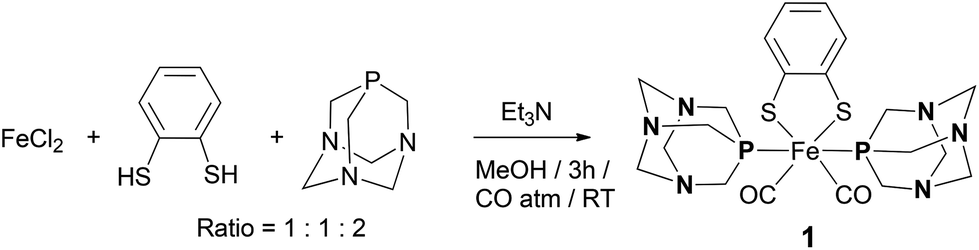 | ||
| Scheme 1 Synthesis of complex 1. | ||
The FTIR spectrum of complex 1 showed νCO absorptions at 2019 and 1967 cm−1 in dichloromethane (see the ESI†). These vibrations are very similar to those of the reported complex [Fe(μ-bdt)(CO)2(PMe3)2]4c,5a which displayed bands at 2014 and 1958 cm−1 in acetonitrile. It shows that the electron donating effects of PMe3 and PTA ligands are comparable and only slightly more pronounced for PMe3.
The calculated spectral peaks of 2014 of 1983 cm−1 correspond to the symmetric and anti-symmetric CO stretching frequencies and allow a clear assignment.
The crystal structure of 1 is shown in Fig. 3. For the crystallographic parameters and refinement details, see the ESI (Table S1†). Selected bond distances and angles and a comparison between the experimental and calculated data are shown in Table 1. Complex 1 is a centro-symmetric molecule with two PTA ligands in the trans-position.
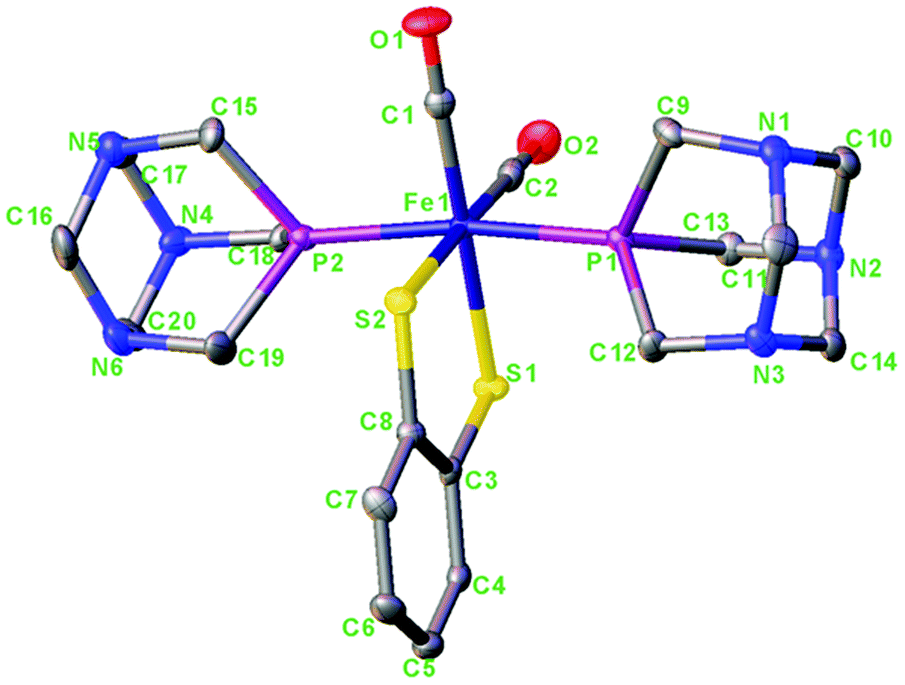 | ||
| Fig. 3 Molecular structure of [Fe(μ-bdt)(CO)2(PTA)2] 1. Hydrogen atoms have been omitted for clarity. Thermal ellipsoids are drawn at the 50% probability level. | ||
| Bond lengths [Å] | Bond angles [°] | ||||
|---|---|---|---|---|---|
| Exp. | Calc. | Exp. | Calc. | ||
| Fe–C1 | 1.774(5) | 1.77 | C1–Fe–C2 | 92.6(2) | 93.1 |
| Fe–C2 | 1.777(5) | 1.77 | C–Fe–P | 92.21/93.96 | 94.9/95.3 |
| Fe–P1 | 2.2388(13) | 2.25 | P–Fe–P | 171.56(5) | 165.2 |
| Fe–P2 | 2.2308(13) | 2.24 | C1–Fe–S1 | 179.42(17) | 178.8 |
| Fe–S1 | 2.3109(12) | 2.36 | C2–Fe–S1 | 87.63(15) | 88.1 |
| Fe–S2 | 2.3200(13) | 2.36 | P–Fe–S | 87.26/86.54 | 84.8/84.7 |
| C1–O1 | 1.137(5) | 1.17 | C1–Fe–S2 | 90.18(15) | 88.4 |
| C2–O2 | 1.127(6) | 1.17 | C2–Fe–S2 | 177.12(15) | 179.0 |
| P–Fe–S | 86.73/87.5 | 85.0/84.7 | |||
| S–Fe–S | 89.54(4) | 90.4 | |||
The Fe–S, Fe–C and Fe–P bond distances in 1 are 2.31/2.32; 1.77/1.77 and 2.21, 2.24 Å, respectively. The Fe–S and Fe–C bond distances in 1 are comparable whereas the Fe–P bond distances are only slightly smaller in comparison with those reported for complex a (Fe–S, 2.299, 2.304; Fe–C, 1.767, 1.772; Fe–P, 2.255, 2.271)4c and also comparable to those of the dinuclear complex.11b The calculated structural parameters agree very well with the experimental. For bond distances, the accuracy is about 0.1–0.2 Å and for bond angles 0.5–2° (see Table 1) which is within the accuracy of the BP86 functional for transition metal geometries.13
Electrochemistry
The electrochemical properties of complex 1 were measured in acetonitrile under an argon atmosphere (Fig. 4). The mononuclear complex 1 displayed two reduction waves in acetonitrile at Epc = −1.63 and −1.94 V. In addition, an irreversible oxidation wave (FeII → FeIII) was observed at Epa = 0.15 V. Controlled potential coulometry at −2.05 V corresponds to the passage of two electrons per molecule (see the ESI†).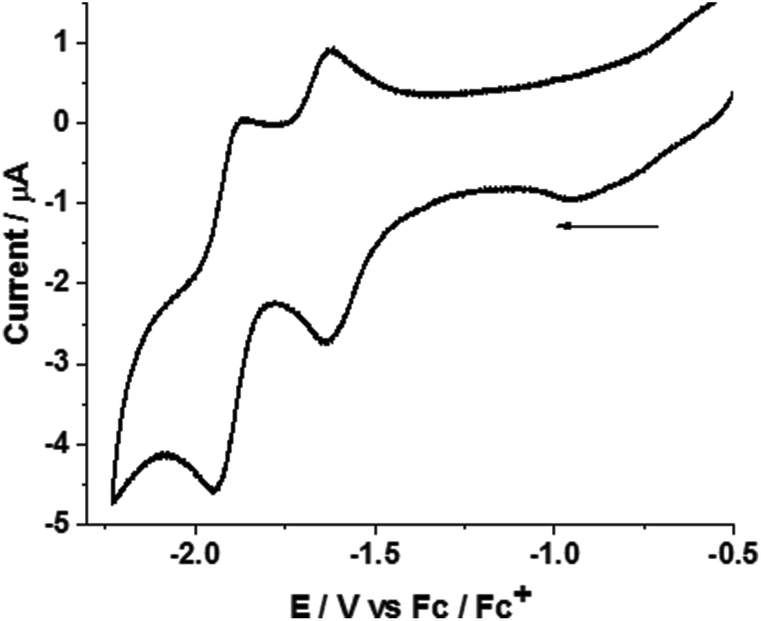 | ||
| Fig. 4 Cyclic voltammogram of complex 1 (1.2 mM) in acetonitrile. Potentials are vs. Fc/Fc+ couple at a scan rate of 0.1 V s−1. | ||
DFT calculations show that the observed peaks originate from an inverted redox potential of the two one-electron reductions of 1. Relative to the Fc+/Fc couple in acetonitrile, the two-electron reduction to yield 12− is calculated from DFT to occur at −1.43 V. The one-electron reduction 1/1− is predicted from the calculations to occur at −2.06 V. This agrees well with experiment and allows a definite assignment of electrochemical peak positions. The 1−/12− reduction is facile and from the DFT calculations it is estimated to occur at −0.7 V.
The singly reduced complex, 1−, is an open-shell S = 1/2 Fe(I) complex. The spin density distribution shows that the one-electron reduction is almost purely metal-based (Fig. 5). The calculated atomic spin densities from a multipole-derived charge analysis up to the quadrupole moment of Fe (0.55), S (0.009/0.025), P (0.01/0.002), C (0.01/0.13) support this picture. The calculated structural bond distance parameters of 1− Fe–P 2.21/2.22, Fe–C 1.76/1.80, and Fe–S 2.88/2.40 show that the reduction leads to an asymmetry of the Fe–S ligand coordination.
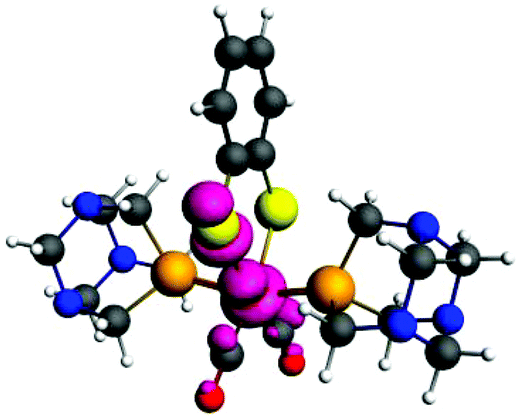 | ||
| Fig. 5 Calculated unpaired spin density distribution for 1− at an isocontour value of 0.005 e Å−3. | ||
Although the Fe–P bond distances only slightly decrease by 0.03 Å due to the increased π P–Fe back donation, one of the Fe–S bonds significantly elongates by 0.4 Å and this sulphur atom carries a spin density of 0.03 e−. This opens an additional protonation site at the decoordinating sulfur and also makes the iron atom accessible to direct protonation.5 The Fe–CO bond length increase leads to a shift in IR by 105 (for the symmetric) and 137 cm−1 (for the anti-symmetric) CO stretching frequencies to lower wavenumbers (see the ESI†).
The analysis of the HOMO of complex 1− shows that also the second one-electron reduction to yield 12− is metal-based. The HOMO of 1− is made up of Fe orbitals (22% dxy, 7% 3dz2, and 6% 3dx2−y2) and the elongated Fe–S bond (S 16% 3py) (see the ESI† for more details).
The reduction potentials of complex 1 are lower in comparison with complexes [Fe(μ-bdt)(CO)2(PMe3)2] a (Epc = −2.21 and −2.45 V) and [Fe(μ-Cl2bdt)(CO)2(PMe3)2] c (Epc = −2.15 and −2.34 V). This indicates that the PTA ligand is less electron-donating than the PMe3 ligand. The diiron bdt-bridged complex with two PTA ligands has been reported to display one-electron reduction at −1.86 V vs. Fc/Fc+, reversible only at scan rates greater than 2 V s−1.11b At lower scan rates, two oxidative waves have been reported on the return sweep of the voltammogram probably due to the slow exchange of the CO ligand for a weakly bound solvent molecule, CH3CN.
Upon addition of acetic acid, a new peak appears at −2.08 V which levels off after the addition of 130 mM of acid (Fig. 6).
 | ||
| Fig. 6 Cyclic voltammograms of complex 1 (2.65 mM) in acetonitrile in the absence (––) and presence of (6.95, 27.62, 41.27, 48.05, 61.53, and 74.91 mM) acetic acid (—). Potentials are vs. Fc/Fc+ couple at a scan rate of 0.1 V s−1. | ||
In addition, a second peak (shoulder) was observed at −2.34 V after the addition of 27.62 mM of acid. These can be assigned to the redox couple of the monoreduced, monoprotonated species 1SH and the doubly reduced, subsequent state 1SH− (see below). The colour of the solution also changes from blood-red to pink upon addition of an acid (weak or strong), indicating the decomposition of the complex in the presence of an acid. Similar behavior was observed when the cyclic voltammograms were measured in dichloromethane in the absence and presence of acids. The background currents due to the direct reduction of protons at the glassy carbon electrode without a catalyst in the presence of acetic acid (−1.5 to −2.6 V) were adjusted in the currents due to the presence of a catalyst. Hence, the acid-induced currents in the presence of catalyst can be attributed to catalytic turnover.
Protonation states
The HER requires a concerted or sequential series of electrochemical (E) or chemical (C) steps (see Scheme 2). An initial chemical step (protonation) of 1 to give a protonated complex 1H+ is not realistic since the calculated proton affinities for protonating either the bdt-thiolate sulfur or the PTA-nitrogen are negative (see the ESI†). A first one-electron reduction step (E) of 1 to 1− is thus plausible. The calculated proton affinities (PA) of different possible sites of the protonation of 1− were calculated (see Table 2). Protonation (i) of the bdt-thiolate is clearly preferred. The proton affinity of the thiolate is 23 kcal mol−1 whereas protonating one of the triaza nitrogen atoms to yield a protonated PTA ligand (PTAH) is thermodynamically not favorable. Upon protonating the bdt-thiolate sulfur atom, the Fe⋯SH distance further increases to 3.07 Å while the spin density distribution of 1SH hardly changes compared to 1−. (see the ESI†). After an initial EC scenario, the second one-electron reduction from 1SH to 1SH− is accompanied by a complete loss of (bdt)HS⋯Fe coordination (Fe–SH(bdt) distance increases to 3.47 Å) affording a penta-coordinate Fe(0) species (ECE).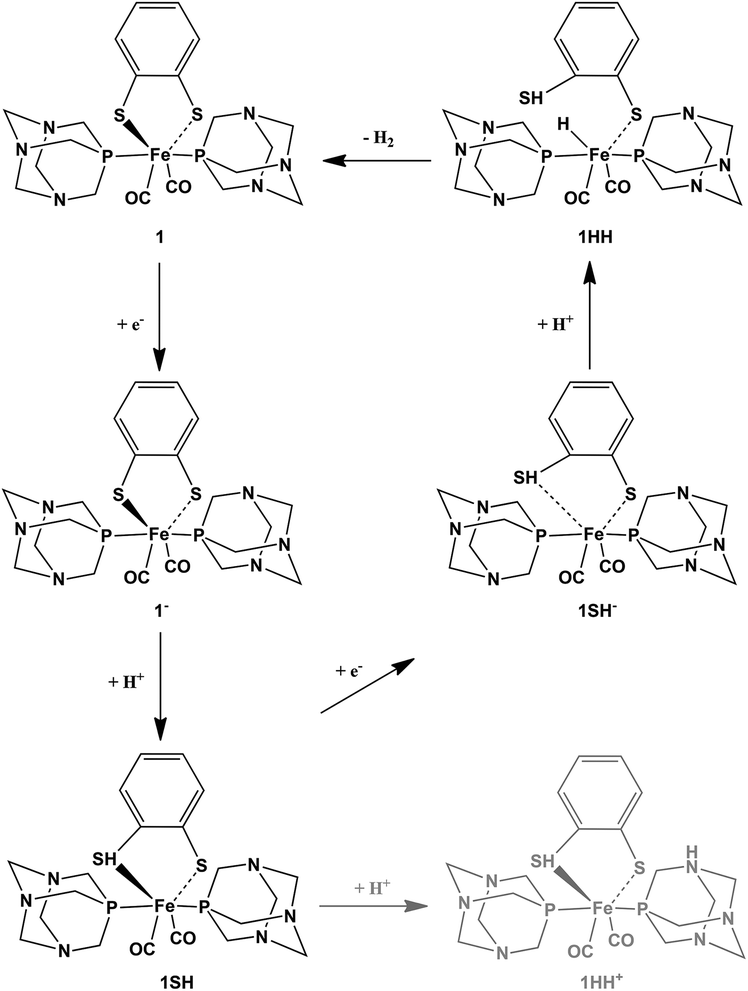 | ||
| Scheme 2 Suggested ECEC mechanism for the HER in acid media from complex 1. | ||
|
|
|||
|---|---|---|---|
| Bdt thiolate (i) | PTA N1 (ii) | PTA N2 (iii) | |
| Energy | +28.17 | +3.10 | +6.33 |
| Gibbs energy | +23.05 | −4.02 | −3.18 |
For the second protonation step (ECEC), the Gibbs free energy or protonation of either of the nitrogen atoms of the PTA nitrogen atoms was calculated to be only 1.3 and 0.9 kcal mol−1, respectively, and thus appear not feasible. In contrast, direct protonation of the penta-coordinate Fe atom to form a Fe(II)–H− is thermodynamically favorable with a proton affinity of 33.1 kcal mol−1. This brings the newly formed hydride in close proximity to the protonated bdt-thiolate S atom, so that the formation and release of molecular hydrogen become possible (see Scheme 2). This observation of an ECEC mechanism was also suggested for the dinuclear FeFe(PTA)2 complex, however, an inverted redox potential was not reported for that complex.11b This led to smaller catalytic peak currents compared to the FeFe(bdt)(CO)6 compound.
Conclusions
We here present a mononuclear Fe(II) complex 1 which catalyzes the hydrogen evolution reaction (HER) in acidic media. DFT calculations showed that the reduction peaks observed in the cyclic voltammogram for complex 1 originated from inverted redox potentials. The two-electron reduced species was formed prior to the one-electron reduced species and both reductions were metal-based. This behaviour has not been reported so far for mononuclear iron complexes. However, examples of inverted redox potentials for diiron complexes with bdt as a bridging ligand are known in the literature.12i,14In our mononuclear complex 1, the opening of the favorable protonation site already occurs in the monoanion and 1 acts as a catalyst and not as a pre-catalyst. While PTA increases the electron density at the FeS2 core only slightly compared to all the carbonyl compounds, the bulky ligand does not obstruct the formation of a dianonic species 12− at an inverted redox potential less negative than 1− due to the facile and swift structural rearrangements of the soft Fe–S bonds.
Complex 1 undergoes a series of sequential one-electron reduction and protonation steps (following an ECEC mechanism) resulting in the reduction of protons to dihydrogen. The inverted redox potential of complex 1 is a characteristic for a large structural re-arrangement from 1/1− and subsequent protonation at the thiolate. Such a re-arrangement is necessary to open a coordination site at the iron atom and catalyse the proton reduction. The stability of electrocatalysts for energy conversion can further be improved by immobilizing them on surfaces.15
Experimental
Methods and materials
All the reagents and solvents were purchased from commercial sources and used as received unless and otherwise mentioned. The solvents were dried and distilled prior to use according to standard methods. The reagents FeCl2, 1,2-benzenedithiolate (bdt) and 1,3,5-triaza-7-phosphaadamantane (PTA) were purchased from Sigma-Aldrich and used as received. All the reactions were carried out under an argon atmosphere using Schlenk-line techniques. Elemental (C, H and N) analyses were performed on a PerkinElmer 240 C elemental analyzer. FTIR spectra were recorded from dichloromethane solutions of the sample over the range 400–4000 cm−1 on a PerkinElmer IR Spectrometer. 1H and 31P NMR spectra were recorded on a JEOL 400 MHz NMR spectrometer. Cyclic voltammograms were measured in dichloromethane using an Autolab potentiostat with a GPES electrochemical interface (Eco Chemie). The working electrode was a glassy carbon disc (diameter 3 mm, freshly polished) for cyclic voltammetry. A glassy carbon rod in a compartment separated from the bulk solution by a fritted disk and platinum were used as the counter electrodes. The reference electrode was a non-aqueous Ag/Ag+ electrode (CH Instruments, 0.010 M AgNO3 in acetonitrile). All the potentials (text, tables, and figures) are quoted against the ferrocene–ferrocenium couple (Fc/Fc+); ferrocene was added as an internal standard at the end of the experiments. All solutions were prepared from dry dichloromethane and acetonitrile (Sigma-Aldrich, spectroscopic grade, dried with MS 3 Å).X-ray structure analysis
X-ray diffraction data for complex 1 were collected using a PC-controlled Enraf-Nonius CAD-4 (MACH-3) single crystal X-ray diffractometer using Mo-Kα radiation. The structure was solved and refined by full-matrix least-squares techniques on F2 using the SHELX-97 program.16 The absorption correction was done by the multiscan technique (SHELXTL program package). All data were corrected for Lorentz and polarization effects, and the non-hydrogen atoms were refined anisotropically. Hydrogen atoms were included in the refinement process as per the riding model. Significant crystallographic parameters and refinement details are listed in Table S1 (see ESI†). For molecular graphics, the program OLEX2-1.2 was used.17Synthesis of [Fe(μ-bdt)(CO)2(PTA)2] 1
A solution of FeCl2 (64 mg, 0.5 mmol) and PTA (240 mg, 1.5 mmol) in 10 mL of methanol under CO was treated with a methanolic solution of 1,2-benzenedithiolate (bdt) (71 mg, 0.5 mmol) and Et3N (0.14 mL, 1 mmol). The reaction turned pink-red and then black, after three hours of stirring at room temperature. The resulting solid was purified by column chromatography on silica gel with CH2Cl2/CH3CN (2![[thin space (1/6-em)]](https://www.rsc.org/images/entities/char_2009.gif) :3 v/v) as a gradient eluent which gave 1 as a blood-red solid. Single crystals of 1 suitable for X-ray analysis were obtained by slow evaporation of the CH2Cl2/hexane solution of the complex at room temperature.
:3 v/v) as a gradient eluent which gave 1 as a blood-red solid. Single crystals of 1 suitable for X-ray analysis were obtained by slow evaporation of the CH2Cl2/hexane solution of the complex at room temperature.
1: Yield: 30% (0.051 g). FTIR (cm−1, CH2Cl2): (νCO) 2019, 1967. 1H NMR (400 MHz, CDCl3): 7.19 (2H); 6.72 (2H); 4.47 (12H); 4.22 (12H) ppm. 31P NMR (161.8 MHz, CDCl3): −36.78 ppm (s, Fe–P). Anal. Calcd for C20H28FeN6O2P2S2: C, 42.41; H, 4.98; N, 14.84. Found: C, 42.58; H, 5.00; N, 15.10.
Computational details
The DFT-D calculations were carried out with ADF 2014.01.18 The BP86 gradient density functional19 was employed, and Grimme's latest dispersion correction20 was used to account for dispersive interactions. The basis functions for all of the atoms were of valence triple-ζ Slater-type quality with polarization functions (TZP) from the ADF basis-set library. All electron calculations without any frozen orbitals were performed. An auxiliary set of s, p, d, f, and g STOs was used to fit the molecular density and to represent the Coulomb and exchange potentials accurately in each SCF cycle. The restricted and unrestricted formalisms were used for closed-shell and open-shell species, respectively. In the COSMO calculation,21 the solute molecule is embedded in a molecule-shaped cavity surrounded by a dielectric medium. Vibrational frequencies were obtained through analytical second derivatives. Enthalpies at 298.15 K and 1 atmosphere (H 298) were calculated from electronic bond energies (E), thermal corrections to the electronic energy, pressure volume work (pV = RT) and vibrational frequencies using standard thermochemistry relationships for an ideal gas.22 In an investigation of proton affinities of anionic and neutral species, the BP86 emerged as one of the best functionals.23Conflict of interest
There are no conflicts of interest to declare.Acknowledgements
Financial support from the Department of Science & Technology (DST) India (SR/S1/IC-28/2011) is acknowledged. SKG is thankful to the University of Delhi for a R&D grant and to the DST-Max Planck Society (MPS) for a fellowship. HF and MN are grateful to the University Grants Commission (UGC), India and the Council of Scientific & Industrial Research, India (CSIR), respectively, for fellowships. This work was supported by the Max Planck Society for the Advancement of Science and, in part, by the EU COST Action CM1305 ‘ECOSTBio’. Open Access funding provided by the Max Planck Society.References
- N. S. Lewis and D. G. Nocera, Proc. Natl. Acad. Sci., U. S. A., 2006, 103, 15729–15735 CrossRef CAS PubMed.
- C. Tard and C. J. Pickett, Chem. Rev., 2009, 109, 2245–2274 CrossRef CAS PubMed.
- J. W. Peters, W. N. Lanzilotta, B. J. Lemon and L. C. Seefeldt, Science, 1998, 282, 1853–1858 CrossRef CAS PubMed.
- (a) N. Wang, M. Wang, L. Chen and L. Sun, Dalton Trans., 2013, 42, 12059–12071 RSC; (b) T. R. Simmons, G. Berggren, M. Bacchi, M. Fontecave and V. Artero, Coord. Chem. Rev., 2014, 270–271, 127–150 CrossRef CAS; (c) L. Schwartz, P. S. Singh, L. Eriksson, R. Lomoth and S. Ott, C. R. Chim., 2008, 11, 875–889 CrossRef CAS; (d) I. K. Pandey, M. Natarajan and S. Kaur-Ghumaan, J. Inorg. Biochem., 2015, 143, 88–110 CrossRef CAS PubMed.
- S. Kaur-Ghumaan, L. Schwartz, R. Lomoth, M. Stein and S. Ott, Angew. Chem., Int. Ed., 2010, 49, 8033–8036 CrossRef CAS PubMed.
- (a) M. Beyler, S. Ezzaher, M. Karnahal, M. P. Santoni, R. Lomoth and S. Ott, Chem. Commun., 2011, 47, 11662–11664 RSC; (b) J. M. Gardner, M. Beyler, M. Karnahl, S. Tschierlei, S. Ott and L. Hammarstrom, J. Am. Chem. Soc., 2012, 134, 19322–19325 CrossRef CAS PubMed; (c) A. Orthaber, M. Karnahl, S. Tschierlei, D. Streich, M. Stein and S. Ott, Dalton Trans., 2014, 43, 4537–4549 RSC.
- S. Gao, J. Fan, S. Sun, F. Song, X. Peng, Q. Duan, D. Jiang and Q. Liang, Dalton Trans., 2012, 41, 12064–12074 RSC.
- (a) D. L. DuBois and R. M. Bullock, Eur. J. Inorg. Chem., 2011, 1017–1027 CrossRef CAS; (b) M. L. Helm, M. P. Stewart, R. M. Bullock, M. R. DuBois and D. L. DuBois, Science, 2011, 333, 863–866 CrossRef CAS PubMed; (c) T. Liu, D. L. Dubois and R. M. Bullock, Nat. Chem., 2013, 5, 228–233 CrossRef CAS PubMed; (d) J. Y. Yang, S. E. Smith, T. Liu, W. G. Dougherty, W. A. Hoffert, W. S. Kassel, M. R. DuBois, D. L. DuBois and R. M. Bullock, J. Am. Chem. Soc., 2013, 135, 9700–9712 CrossRef CAS PubMed; (e) M. O'Hagan, W. J. Shaw, S. Raugei, S. Chen, J. Y. Yang, U. J. Kilgore, D. L. DuBois and R. M. Bullock, J. Am. Chem. Soc., 2011, 133, 14301–14312 CrossRef PubMed.
- S. Dey, P. K. Das and A. Dey, Coord. Chem. Rev., 2013, 257, 42–63 CrossRef CAS.
- S. Tschierli, S. Ott and R. Lomoth, Energy Environ. Sci., 2011, 4, 2340–2352 Search PubMed.
- (a) Z. Wang, J. Liu, C. He, S. Jiang, B. Åkermark and L. Sun, Inorg. Chim. Acta, 2007, 360, 2411–2419 CrossRef CAS; (b) A. K. Vannucci, S. Wang, G. S. Nichol, D. L. Lichtenberger, D. H. Evans and R. S. Glass, Dalton Trans., 2010, 39, 3050–3056 RSC.
- (a) S. Muratsugu, K. Sodeyama, F. Kitamura, S. Tsukada, M. Tada, S. Tsuneyuki and H. Nishihara, Chem. Sci., 2011, 2, 1960–1968 RSC; (b) G. A. N. Felton, B. J. Petro, R. S. Glass, D. L. Lichtenberger and D. H. Evans, J. Am. Chem. Soc., 2009, 131, 11290–11291 CrossRef CAS PubMed; (c) N. A. Macıas-Ruvalcaba and D. H. Evans, J. Phys. Chem. B, 2006, 110, 5155–5160 CrossRef PubMed; (d) N. A. Macıas-Ruvalcaba and D. H. Evans, J. Phys. Chem. B, 2006, 110, 24786–24795 CrossRef PubMed; (e) S. F. Nelsen, G. Li, K. P. Schultz, H. Q. Tran, I. A. Guzei and D. H. Evans, J. Am. Chem. Soc., 2008, 130, 11620–11622 CrossRef CAS PubMed; (f) D. H. Evans and K. Hu, J. Chem. Soc., Faraday Trans., 1996, 92, 3983–3990 RSC; (g) N. A. Macıas-Ruvalcaba and D. H. Evans, Chem. – Eur. J., 2007, 13, 4386–4395 CrossRef PubMed; (h) D. H. Evans, Chem. Rev., 2008, 108, 2113–2144 CrossRef CAS PubMed; (i) F. Gloaguen and T. B. Rauchfuss, Chem. Soc. Rev., 2009, 38, 100–108 RSC.
- M. Swart and J. G. Snijders, Theor. Chem. Acc., 2003, 110, 34–41 CrossRef CAS.
- (a) J.-F. Capon, F. Gloaguen, P. Schollhammer and J. Talarmin, J. Electroanal. Chem., 2004, 566, 241–247 CrossRef CAS; (b) G. A. N. Felton, A. K. Vannucci, J. Chen, L. T. Lockett, N. Okumura, B. J. Petro, U. I. Zakai, D. H. Evans, R. S. Glass and D. L. Lichtenberger, J. Am. Chem. Soc., 2007, 129, 12521–12530 CrossRef CAS PubMed; (c) J.-F. Capon, F. Gloaguen, P. Schollhammer and J. Talarmin, J. Electroanal. Chem., 2006, 595, 47–52 CrossRef CAS; (d) R. Becker, S. Amirjalayer, P. Li, S. Woutersen and J. N. H. Reek, Sci. Adv., 2016, 2, e1501014 Search PubMed.
- R. M. Bullock, A. K. Das and A. M. Appel, Chem. – Eur. J., 2017, 23, 7626–7641 CrossRef CAS PubMed.
- G. M. Sheldrick, SHELX-97 Program for Crystal Structure Solution and Refinement, University of Göttingen, Göttingen, Germany, 1997 Search PubMed.
- O. V. Dolomanov, L. J. Bourhis, R. J. Gildea, J. A. K. Howard and H. Puschmann, OLEX2: A complete structure solution, refinement and analysis program, J. Appl. Crystallogr., 2009, 42, 339–341 CrossRef CAS.
- (a) G. te Velde, F. M. Bickelhaupt, E. J. Baerends, C. Fonseca Guerra, S. J. A. van Gisbergen, J. G. Snijders and T. Ziegler, J. Comput. Chem., 2001, 22, 931–967 CrossRef CAS; (b) E. J. Baerends, J. Autschbach, A. Bérces, F. M. Bickelhaupt, C. Bo, P. M. Boerrigter, L. Cavallo, D. P. Chong, L. Deng and R. M. Dickson, et al., ADF2014, SCM, Theoretical Chemistry, 2014, Vrije Universiteit, Amsterdam, The Netherlands, http: //www.scm.com Search PubMed.
- (a) A. D. Becke, Phys. Rev. A, 1988, 38, 3098–3100 CrossRef CAS; (b) J. P. Perdew, Phys. Rev. B: Condens. Matter, 1986, 33, 8822 CrossRef ; Erratum J. P. Perdew, Phys. Rev. B: Condens. Matter, 1986, 34, 7406 Search PubMed.
- S. Grimme, J. Anthony, S. Ehrlich and H. Krieg, J. Chem. Phys., 2010, 132, 154104–154119 CrossRef PubMed.
- (a) A. Klamt and G. Schüürmann, J. Chem. Soc., Perkin Trans. 2, 1993, 799–805 RSC; (b) C. C. Pye and T. Ziegler, Theor. Chem. Acc., 1999, 101, 396–408 CrossRef CAS.
- F. Jensen, Introduction to Computational Chemistry, Wiley, Chichester, UK, 1999, p. 84 Search PubMed.
- M. Swart and F. M. Bickelhaupt, J. Chem. Theory Comput., 2006, 2, 281–287 CrossRef CAS PubMed.
Footnotes |
| † Electronic supplementary information (ESI) available: FTIR and NMR spectra, X-ray data, coulometry data and computational details. CCDC 933626 for 1. For ESI and crystallographic data in CIF or other electronic format see DOI: 10.1039/c7dt01994g |
| ‡ Current address: School of Basic Sciences, IIT Indore, Indore 452017, Madhya Pradesh, India. |
| This journal is © The Royal Society of Chemistry 2017 |