 Open Access Article
Creative Commons Attribution 3.0 Unported Licence
A comparative study of optical properties and X-ray induced luminescence of octahedral molybdenum and tungsten cluster complexes†
Darya V.
Evtushok
a,
Anatoly R.
Melnikov
bc,
Natalya A.
Vorotnikova
a,
Yuri A.
Vorotnikov
 a,
Alexey A.
Ryadun
a,
Natalia V.
Kuratieva
ac,
Konstantin V.
Kozyr
d,
Natalia R.
Obedinskaya
d,
Evgeniy I.
Kretov
d,
Igor N.
Novozhilov
a,
Yuri V.
Mironov
ac,
Dmitri V.
Stass
bc,
Olga A.
Efremova
a,
Alexey A.
Ryadun
a,
Natalia V.
Kuratieva
ac,
Konstantin V.
Kozyr
d,
Natalia R.
Obedinskaya
d,
Evgeniy I.
Kretov
d,
Igor N.
Novozhilov
a,
Yuri V.
Mironov
ac,
Dmitri V.
Stass
bc,
Olga A.
Efremova
 *e and
Michael A.
Shestopalov
 *acf
*acf
aNikolaev Institute of Inorganic Chemistry SB RAS, 3 Acad. Lavrentiev Ave., 630090 Novosibirsk, Russian Federation. E-mail: shtopy@niic.nsc.ru; Fax: +7-383-330-94-89; Tel: +7-383-330-92-53
bVoevodsky Institute of Chemical Kinetics and Combustion SB RAS, 3 Institutskaya st., Novosibirsk, 630090, Russian Federation
cNovosibirsk State University, 2 Pirogova st., 630090 Novosibirsk, Russian Federation
dMeshalkin Siberian Federal Biomedical Research Center, 15 Rechkunovskaya st., 630055 Novosibirsk, Russian Federation
eSchool of Mathematics and Physical Sciences, University of Hull, Cottingham Road, HU6 7RX, Hull, UK. E-mail: o.efremova@hull.ac.uk; Tel: +44 (0)1482 465417
fResearch Institute of Experimental and Clinical Medicine, 2 Timakova st., 630060 Novosibirsk, Russian Federation
First published on 7th August 2017
Abstract
Octahedral metal cluster complexes have high potential for biomedical applications. In order to evaluate the benefits of these moieties for combined CT/X-ray luminescence computed tomography, this paper compares photoluminescence, radiodensity and X-ray induced luminescence properties of eight related octahedral molybdenum and tungsten cluster complexes [{M6I8}L6]n (where M is Mo or W and L is I−, NO3−, OTs− or OH−/H2O). This article demonstrates that despite the fact that molybdenum cluster complexes are better photoluminescence emitters, tungsten cluster complexes, in particular (Bu4N)2[{W6I8}I6], demonstrate significantly higher X-ray induced luminescence due to a combination of relatively good photoluminescence properties and high X-ray attenuation. Additionally, photo-degradation of [{M6I8}(NO3)6]2− was evaluated.
Introduction
X-rays have been widely used in biomedical imaging over the last century, during which bioimaging techniques based on the detection of X-ray attenuation have been evolving to achieve high precision and spatial resolution in Computed Tomography (CT). Due to the weakness of the photoelectric absorption and the scattering of X-rays by biological tissues (apart from bone tissue) a range of radio contrast agents – molecules or particles based on heavy elements that significantly increase X-ray absorption and scattering have also been developed.1–4 To complement CT, alternative X-ray based bioimaging techniques are currently being developed, for example X-ray luminescence computed tomography5–7 that uses the X-ray excited optical luminescence (XEOL) of a bioimaging agent. Moreover, XEOL has also been considered in the context of Photodynamic Therapy (PDT) – a medically approved cancer treatment technique based on the photoexcitation of a sensitiser. Typical photosensitisers are highly phosphorescent pharmacologically inactive in the dark moieties (e.g. porphyrins) capable of generating highly cytotoxic oxygen species, in particular singlet oxygen (1O2). In the case of PDT, X-ray excitation may solve a major drawback of the conventional PDT technique, namely its inability to treat tumours deep under the skin due to the strong absorption of excitation UV/Vis light by biological tissue.A few types of nanomaterials have already been considered as contrast agents for XEOL based bioimaging and as photosensitisers including lanthanide doped inorganic nanoparticles,8–12 gold nanoparticles13 and MOFs.14 The potential of octahedral molybdenum cluster complex (Bu4N)2[{Mo6I8}(OOC-1-adamantane)6] for X-ray excited optical luminescence and X-ray induced PDT has also been recently revealed in ref. 15. Indeed, the family of octahedral cluster complexes [{Re6Q8}L6] and [{Mo6X8}L6] (where X is Cl, Br or I; Q is S, Se or Te and L are organic or inorganic ligands) and materials based on them have been intensively studied in the last few years in the context of biomedical applications.16–33 First of all, this is due to the progress made in the development of phosphorescent octahedral molybdenum cluster complexes, all based on the {Mo6I8}4+ cluster core that have particularly high quantum yields34–37 and high efficiency in generating singlet oxygen.38–43 Specifically, our recent studies have shown that materials doped using {Mo6I8}4+ are highly photoluminescent and have low cellular toxicity in the dark, while by a careful selection of a matrix the cellular internalisation and photoinduced toxicity of the materials can be tuned.18–21
It is clear that for X-ray excitation, octahedral clusters based on heavier metals should have a significant advantage of increased photoelectric absorption and scattering. Indeed, a comparison of the radiodensity of a range of octahedral molybdenum cluster complexes with that of octahedral rhenium cluster complexes with the cluster core {Re6Q8}2+ demonstrates that the latter are significantly more radiodense, especially in the case of Q = Te.1,29 It should be noted that {W6I8}2+ cluster complexes, i.e. isoelectronic to {Re6Q8}2+ species, are generally far less studied, despite the recent data that suggests these complexes can also be highly luminescent.44–47
In this work we compare optical and XEOL properties of octahedral tungsten complexes: (Bu4N)2[{W6I8}I6] (1) and new complexes (Bu4N)2[{W6I8}(NO3)6] (2), (Bu4N)2[{W6I8}(OTs)6] (OTs− is p-toluenesulfonate) (3) and [{W6I8}(OH)4(H2O)2]·6H2O (4) with those of the corresponding molybdenum analogues: (Bu4N)2[{Mo6I8}I6] (5), (Bu4N)2[{Mo6I8}(NO3)6] (6), (Bu4N)2[{Mo6I8}(OTs)6] (7) and [{Mo6I8}(OH)4(H2O)2]·2H2O (8).
Results and discussion
Synthesis and characterisation of tungsten cluster complexes
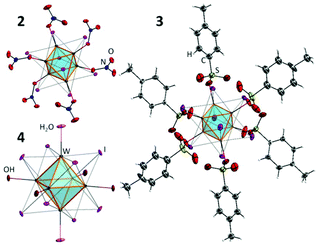
The starting cluster complex, (Bu4N)2[{W6I8}I8] (1), was synthesised by the method described earlier48 using the reaction of W6Cl12 with a KI/LiI melt (70/30, mol%) followed by the dissolution of the cooled melt in ethanol and the precipitation of (Bu4N)2[{W6I8}I6] by adding Bu4NI to the solution. The W6Cl12 compound was synthesised by the high temperature reaction of WCl6 with metallic Bi. Compounds 2 and 3 were obtained by the ligand exchange reaction of 1 with 6 eq. of AgNO3 or AgOTs, respectively, according to the procedures described for the analogous molybdenum cluster complexes. To obtain compound 4, complex 3 was hydrolysed by aqueous ammonia. Molybdenum cluster complexes 5–8 were obtained according to earlier publications.37–39,49,50The structures of new cluster compounds 2–4 (Fig. 1) were confirmed by single crystal XRD of the corresponding solvates/hydrates 2·CH2Cl2, 3·Me2CO·1.5Et2O and 4·12H2O. The details of the experiment are summarised in Table 1S, ESI.† All three compounds feature the octahedral cluster core {W6I8}2+ composed of a nearly perfect W6 octahedron inscribed into an I8 cube with bond lengths W–W and W–I (Table 2S†) similar to those in the starting cluster complex 1 and the related cluster compound (Bu4N)2[{W6I8}(CF3COO)6].45,51 Each tungsten atom is additionally coordinated by an oxygen atom of NO3− (2), R-SO3− (3) or OH−/H2O (4). The FTIR spectra of compounds 2 and 3 provided additional confirmation of monodentate coordination mode of nitrato- and sulfonato-ligands, respectively, i.e. FTIR shows clear νas and νs vibrations of NO2 or SO2 groups and valent NO or SO vibrations (Fig. 1S†).
Finally the structure of 3 was additionally confirmed by NMR. Indeed, only one set of signals from the coordinated OTs− was detected, while the ratio between signals from OTs− and Bu4N+ confirmed the stoichiometry of 3![[thin space (1/6-em)]](https://www.rsc.org/images/entities/char_2009.gif) :
:![[thin space (1/6-em)]](https://www.rsc.org/images/entities/char_2009.gif) 1 (Fig. 2S†).
1 (Fig. 2S†).
The overall crystal structure of solvate 2·CH2Cl2 is isostructural to that of compound 5·3Me2CO![[thin space (1/6-em)]](https://www.rsc.org/images/entities/char_2009.gif) 37 with the only differences being in the type and the number of solvate molecules. The crystal structure of 3·Me2CO·1.5Et2O is also isostructural to that of solvate 6·Me2CO·1.5H2O from ref. 38.
37 with the only differences being in the type and the number of solvate molecules. The crystal structure of 3·Me2CO·1.5Et2O is also isostructural to that of solvate 6·Me2CO·1.5H2O from ref. 38.
The crystal structure of 4·12H2O is, however, not isostructural to any of the other dodecahydrate phases reported for complex 8![[thin space (1/6-em)]](https://www.rsc.org/images/entities/char_2009.gif) 39,52 or to the best of our knowledge to any other aqua-hydroxo complexes of octahedral clusters. 4·12H2O crystallises in the triclinic space group with just one cluster in the unit cell, whose centre coincides with the centre of inversion. The bond length W1–O1 (2.104(4) Å) is noticeably longer than W2–O2 (2.090(3) Å) and W3–O3 (2.087(3) Å), which implies that O1 is likely a H2O ligand, while O2 and O3 are OH−. The apical ligands and the water of crystallisation form a 3D framework (Fig. 3S†).
39,52 or to the best of our knowledge to any other aqua-hydroxo complexes of octahedral clusters. 4·12H2O crystallises in the triclinic space group with just one cluster in the unit cell, whose centre coincides with the centre of inversion. The bond length W1–O1 (2.104(4) Å) is noticeably longer than W2–O2 (2.090(3) Å) and W3–O3 (2.087(3) Å), which implies that O1 is likely a H2O ligand, while O2 and O3 are OH−. The apical ligands and the water of crystallisation form a 3D framework (Fig. 3S†).
XRPD data for the powdered sample of compound 4 clearly demonstrate the presence of a crystalline phase of 4·12H2O (Fig. 4S†), however TGA records the removal of only 6 solvate water molecules in the temperature range of up to 130 °C (Fig. 5S†). This may signify the presence of another X-ray amorphous aqua-hydroxo phase with a lower number of solvate water molecules, for example amorphous 4·2H2O. Indeed, the co-existence of amorphous 8·2H2O alongside crystalline phases was previously demonstrated for the molybdenum cluster complex [{Mo6Br8}(H2O)4(OH)2]·6H2O.39,52
Optical properties
Absorption spectra of cluster complexes 1–3 were recorded in acetonitrile and are shown in Fig. 2. A comparison of the absorption spectra of the starting complex 1 with those of 2 and 3 shows that the substitution of apical iodide ligands by nitrato- and tosylato-ligands results in a blueshift of the absorption bands. This blueshift of the absorption band was noticed in earlier studies of molybdenum octahedral complexes, i.e. in the products of apical iodide ligand substitution in [{Mo6I8}I6]2− by NO3−, N3−, NCS−, organic sulfonates and fluorinated carboxylates.36–38,53,54 The HOMO orbital in tungsten cluster complexes has thus significant contribution from the apical ligands, while absorption spectra are a likely result of ligand-to-metal charge transfer (LMCT).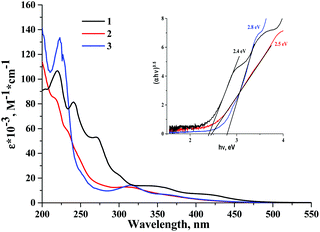 | ||
| Fig. 2 The UV-vis spectra of 1–3 in acetonitrile. The inset is the Tauc plot used to estimate excited state energy. | ||
A further comparison of spectra of 1–3 with their corresponding analogues 5–7 also shows that although extinction coefficients of the complexes are comparable, the absorption of cluster complexes of molybdenum is noticeably red shifted in comparison with those of tungsten. Thus, the energy gap between the ground state and the first singlet excited state is generally narrower for molybdenum cluster complexes than that for tungsten. A similar conclusion can be drawn from the study of electrochemical properties of 1–3 (see data in the ESI†).
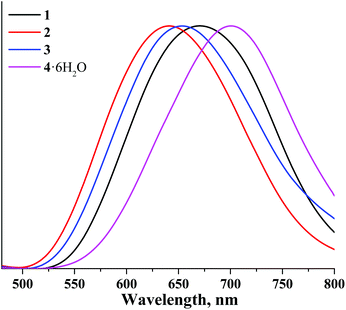
The corrected normalised photoluminescence spectra of compounds 1–4 in the solid state and in deaerated acetonitrile solutions are presented in Fig. 3 and 6S.† The photophysical characteristics i.e. emission maximum wavelengths (λem), quantum yields (Φem) and lifetimes (τem) of all compounds measured in the solid state as well as in acetonitrile solutions (both air-equilibrated and degassed) are summarised in Table 1. The photophysical properties of compounds 5–8 are also given in Table 1 for the sake of comparison.16,37,38
| M = Mo37–40,48 | M = W | ||||||
|---|---|---|---|---|---|---|---|
| λ em, nm | τ em, μs (A) | Φ em | λ em, nm | τ em, μs | Φ em | ||
| (Bu4N)2[{M6I8}I6] | Powdered sample | 735 | 19 | 0.10 | 685 | 12 | 0.29 (0.33 (ref. 48)) |
| Aerated solution | — | — | — | 685 | — | <0.01 | |
| Deaerated CH3CN solution | 730 | 90 | 0.12 | 685 | 35 | 0.23 | |
| (Bu4N)2[{M6I8}(NO3)6] | Powdered sample | 666 | τ 1 = 93 (0.7) | 0.26 | 660 | 7 | 0.04 |
| τ 2 = 26 (0.3) | |||||||
| Aerated CH3CN solution | 669 | 3.4 | <0.01 | 660 | — | <0.01 | |
| Deaerated CH3CN solution | 669 | 185 | 0.25 | 660 | 11 | 0.01 | |
| (Bu4N)2[{M6I8}(OTs)6] | Powdered sample | 662 | τ 1 = 135 (0.6) | 0.44 | 640 | 35 | 0.28 |
| τ 2 = 56 (0.4) | |||||||
| Aerated CH3CN solution | 667 | 5.0 | 0.01 | 640 | — | 0.01 | |
| Deaerated CH3CN solution | 667 | 305 | 0.65 | 640 | 48 | 0.29 | |
| [{M6I8}(OH)4(H2O)2]·nH2O | Powdered sample | — | — | — | 700 | 5 | <0.01 |
Table 1 shows that the photophysical characteristics of the molybdenum and tungsten sets of complexes are strongly dependent on the nature of apical ligands. Specifically, both aqua-hydroxo complexes 4 and 8 do not demonstrate any significant photoluminescence properties. This could be due to enhanced non-radiative relaxation through vibrations of OH groups: this effect is commonly observed for many phosphorescent complexes.53,55–57 On the other hand, compounds 1–3 demonstrate photoluminescence in red and near-infrared regions similar to compounds 5–7. Notably, in comparison with molybdenum cluster complexes, photoluminescence lifetimes of the corresponding tungsten analogues are somewhat lower, while emission maxima are somewhat shifted toward the blue region. The shift of emission spectra of tungsten cluster complexes in comparison with those of molybdenum complexes once again signifies the broader energy gap for tungsten cluster complexes.
In analogy to other octahedral cluster complexes, the photoluminescence of 1 and 3 is efficiently quenched by molecular oxygen, as confirmed by the significant reduction of photoluminescence quantum yields measured in air-equilibrated and degassed acetonitrile solutions.
X-ray attenuation
X-ray propagation through materials is determined by the X-ray attenuation coefficient. For monochromatic X-ray radiation, the intensity exponentially decreases following the Lambert–Beer law. For the crystalline compounds 1–8 linear attenuation coefficients are summarised in Table 2 for λ = 0.71073 Å. From these data, it can be easily seen that X-ray attenuation for compounds 1 and 5, i.e. compounds with heavy outer ligands, are close to those for the corresponding aqua-hydroxo cluster complexes 4 and 8, which are noticeably higher than those for complexes with organic counter-ion and light-weight outer ligands.| Φ em | μ, cm−1 | μ/D, cm2 g−1 | Slopeb, HU L mol−1 | Slopec, HU g mol−1 | χ X | |
|---|---|---|---|---|---|---|
| a Quantum yield in the powdered sample. b DMSO solution. c Pelleted mixtures of the compounds with α-lactose monohydrate. | ||||||
| 1 | 0.23 | 179.96 | 52.16 | 6.2 × 10⁴ | 6.4 × 10⁷ | 1.2 × 10⁴ |
| 2 | 0.01 | 133.73 | 46.43 | 5.2 × 10⁴ | 6.1 × 10⁷ | 1.2 × 10² |
| 3 | 0.29 | 84.11 | 37.79 | — | — | 6.1 × 10³ |
| 4 | <0.01a | 282.20 | 57.80 | — | — | 20 |
| 5 | 0.12 | 77.76 | 26.89 | 4.4 × 10⁴ | 4.3 × 10⁷ | 7.8 × 10² |
| 6 | 0.25 | 43.67 | 19.92 | 3.2 × 10⁴ | 2.1 × 10⁷ | 4.2 × 10² |
| 7 | 0.65 | 30.06 | 17.68 | — | — | 3.0 × 10³ |
| 8 | 0a | 99.47 | 25.35 | — | — | 1 |
To further assess the effect of molecular weight of both the cluster core and the apical ligand on the X-ray attenuation, the CT study of complexes 1, 2, 5 and 6 was undertaken in both DMSO solutions and the solid state in a mixture with α-lactose monohydrate (Fig. 7S†). Fig. 4 and Fig. 8S† demonstrate the dependence of radiodensity on Hounsfield unit scale vs. concentration. The graph demonstrates that for all of the clusters studied, the X-ray attenuation has a linear dependence on the concentration. The slope of the dependence is a characteristic of the molar radiodensity and can be used to compare X-ray attenuation of different compounds. Our experimental data demonstrate that tungsten cluster complexes are noticeably more radiodense than even molybdenum compound 5, which has 6 iodide apical ligands. Furthermore, a comparison of these data with the data obtained earlier for rhenium cluster complexes29 shows that the radiodensity of compound 1 is similar (if not higher) to that of the compound K4[{Re6Te8}(CN)6], which is 8.1 times more radiodense than iohexol (Omnipaque®, GE Healthcare) – currently being used as a standard contrast agent.
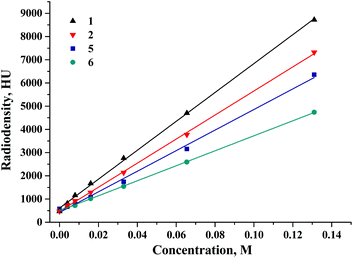 | ||
| Fig. 4 The dependence of radiodensity of 1, 2, 5 and 6 in DMSO solution on Hounsfield unit scale vs. concentration. | ||
X-ray induced luminescence
The spectra of X-ray induced luminescence were recorded under ambient conditions using naked thin strips of powdered compounds (Fig. 9S†) directly exposed to the incident X-ray beam and to the optics of the light-collecting part of the detection system. This was done for several reasons. Firstly, characterisation of material directly exposed to X-rays helps avoid ambiguities associated with radiation-induced luminescence of a cuvette material, as both quartz and polystyrene can produce rather intense visible/near-infrared light emission under X-ray irradiation. Secondly, the colour centres induced by irradiation of the cuvette material would further impose its optical absorption spectrum on the sought emission spectrum of the sample. Finally, a thin sample is preferable due to high penetration of X-rays into the bulk of the sample.The X-ray induced luminescence spectra normalised by the number of moles and corrected for the spectral sensitivity of the detector are presented in Fig. 5. Each spectrum contains 512 wavelength points and is the average of four independent wavelength scans for 15 minutes each, except for the two nitrato-complexes that demonstrated photodegradation with the rates of ca. 0.25% min−1 for 2 and 0.56% min−1 for 5 (Fig. 11S and 12S†). For the latter, the experimental spectra were averaged over two scans to reduce signal loss. At the red end of the spectral range the spectra were cut off at an arbitrarily chosen limit of 800 nm, beyond which the sensitivity of the detector is too low to obtain reliable results. Nevertheless, the available spectral range is sufficient to cover the maxima of the emission bands for all the complexes studied in this work. To quantify the X-ray induced emission efficiencies of different complexes we used the relative figure of merit χX, which is the value of the numerical integral of the normalised and corrected spectra (Table 2 and Fig. 13S†). Further details of the calibration routine, background signal, raw experimental spectra and their corrected counterparts, X-ray bleaching kinetics for compounds 2 and 4, and the reliability check can be found in the ESI.†
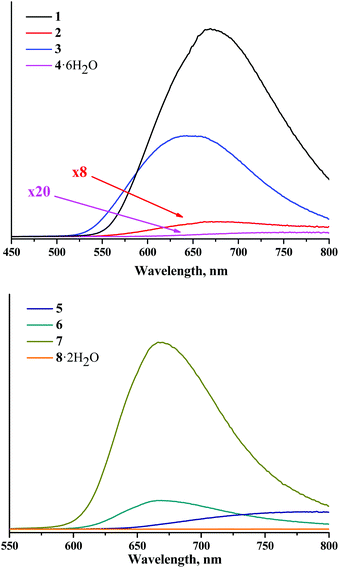 | ||
| Fig. 5 Corrected and normalised X-ray induced luminescence spectra for complexes 1–8 in the solid state and in air. | ||
The profile of X-ray induced luminescence spectra of the photoluminescent and photo-/X-ray stable complexes roughly follow the profile of photoluminescence spectra (Fig. 14S†), which suggests that X-ray induced emission occurs from the same excited states as photoluminescence. In terms of efficiency, the χX values show that tungsten clusters in the same ligand environment are comparable or more efficient X-ray induced emitters than molybdenum analogues, where compound 1 is the most efficient XEOL emitter from the studied set of compounds.
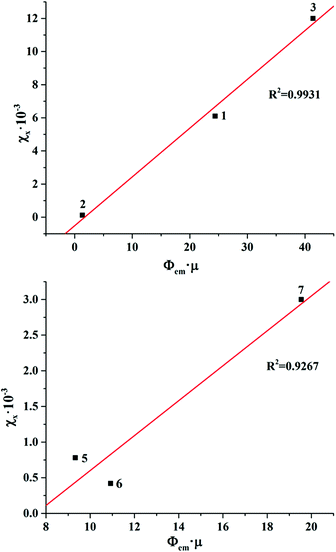
Bringing the χX values in the context of the X-ray attenuation and photoluminescence quantum yields clearly demonstrates that the higher both these parameters are, the higher the integrated intensity of the X-ray induced luminescence. Indeed, the dependence of χX on Φem × μ for photoluminescent compounds 1–3 and 5–7 is nearly linear (Fig. 6). This means that both X-ray attenuation and photoluminescence quantum yield have equal contribution to the X-ray induced luminescence intensity. This conclusion is crucial for the design of the efficient XEOL emitters based on molybdenum and tungsten clusters. Specifically, it signifies that complexes with higher X-ray attenuation are far more desirable as materials for XEOL-based applications. For example, it is remarkable that compound 1 has only an average photoluminescence quantum yield, but due to a high value of X-ray attenuation, it has high XEOL intensity. On the other hand, the most photoluminescent from the set, compound 7, has only an average value of χX, which aligns with noticeably weaker X-ray attenuation.
Photo-degradation studies
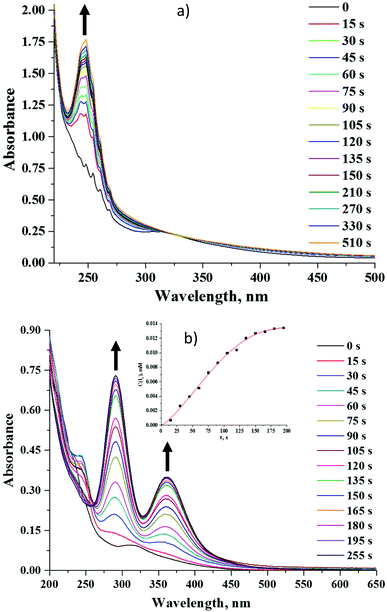
Octahedral cluster compounds are generally regarded as highly stable moieties under ambient conditions.19,58 Reports on the photo-bleaching of octahedral molybdenum clusters are indeed quite rare.59,60 In our research we have observed some X-ray induced bleaching of compounds 2 and 5. We have also noticed that unlike compound 5, 2 changes its colour irreversibly from yellow to maroon when exposed to light (Fig. 15S†).We have studied the photodegradation of 2 and 5 by UV-Vis spectroscopy in acetonitrile solution. Our studies show that compound 5 is indeed photo-stable for at least 20 minutes upon constant photoirradiation with light of λ > 400 nm in solution (Fig. 16S†), while compound 2 is prone to rapid photo-degradation. Fig. 7a demonstrates evolution of absorption spectra of 2 under an inert atmosphere upon photo-irradiation. The spectra clearly showed the progressive appearance of a strong absorbance band at 248 nm. After the solution was kept in the dark in the same stoppered cuvette for 25 min more, two small shoulders at 291 nm and 363 nm appeared. The latter bands became even more intensive after 18 h (Fig. 17S†). Similar spectra recorded under an ambient atmosphere in an open cuvette have also demonstrated the disappearance of absorbance maximum at 324 nm and appearance of the bands at 248, 291 and 363 nm (Fig. 7b). The band at 248 nm reached its maximal value after 45 s of irradiation and then started disappearing, while bands at ∼290 and ∼360 nm kept increasing within the period of measurements. Absorption bands at 291 nm and 363 nm are very similar to those found for the I3− ion,61–63 while the chemical form that absorbs at 248 nm is likely to be I−.63 Moreover, from the presence of an isosbestic point at 260 nm and significantly more rapid formation of I3− in an oxygen-rich environment it can be concluded that photoexcitation leads to the photooxidation of the iodide ion into a three-iodide ion with the estimated rate of 0.10 μM s−1.
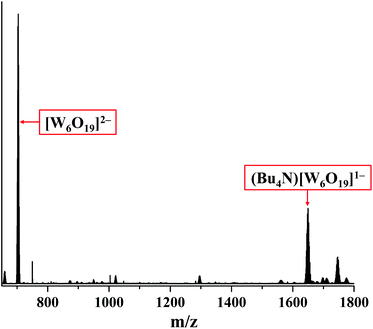
The degradation of compound 2 indeed occurs due to the photo-activation, as the prolonged storage of the compound in the dark in acetonitrile under an ambient atmosphere does not affect the absorption spectrum in the solution (Fig. 18S†). Although the role of nitrato ligands in photodegradation is not fully understood, we think that the photoexcitation of 2 leads to an intramolecular redox reaction, upon which NO3− groups act as an oxidative agent. Indeed, the HR-ESI-MS analysis of the acetonitrile solution of 2 irradiated for 18 h under an ambient atmosphere showed no peak from [W6I8(NO3)6]2− in the negative region. On the other hand, the two most intensive peaks in the spectrum coincide with [W6O19]2− and (Bu4N)[W6O19]− ions (Fig. 8 and 19S†). It should be noted that in UV-Vis spectra the absorption band for [W6O19]2− would overlap with the absorption band of I3− at ∼290 nm.64,65 We have also collected the product of photodegradation by evaporation of the solvent and washing the solid residue with toluene to remove iodine. The EDX of the remaining yellowish solid gave the ratio W![[thin space (1/6-em)]](https://www.rsc.org/images/entities/char_2009.gif) :
:![[thin space (1/6-em)]](https://www.rsc.org/images/entities/char_2009.gif) O
O![[thin space (1/6-em)]](https://www.rsc.org/images/entities/char_2009.gif) :
:![[thin space (1/6-em)]](https://www.rsc.org/images/entities/char_2009.gif) I = 6.0
I = 6.0![[thin space (1/6-em)]](https://www.rsc.org/images/entities/char_2009.gif) :
:![[thin space (1/6-em)]](https://www.rsc.org/images/entities/char_2009.gif) 20.7
20.7![[thin space (1/6-em)]](https://www.rsc.org/images/entities/char_2009.gif) :
:![[thin space (1/6-em)]](https://www.rsc.org/images/entities/char_2009.gif) 0.7, which also suggests that the tungsten polyoxometalate complex is the main product of the photo-degradation of compound 2 in air.
0.7, which also suggests that the tungsten polyoxometalate complex is the main product of the photo-degradation of compound 2 in air.
In summary, the photo-degradation of compound 2 results in the decomposition of the cluster core with the change in the formal oxidation state of tungsten from +2 to +6, accompanied by the release of iodide ions. We believe that the significantly more rapid formation of the three-iodine ion in the solution in the oxygen-rich environment is likely due to consequent photocatalytic oxidation of iodide ions. The photocatalytic activity of polytungstate species is indeed well-established.66–69
Experimental
Materials and methods
(Bu4N)2[{W6I8}I6], (Bu4N)2[{Mo6I8}I6], (Bu4N)2[{Mo6I8}(NO3)6], (Bu4N)2[{Mo6I8}(OTs)6] and [{Mo6I8}(OH)4(H2O)2]·2H2O were synthesised according to previously reported procedures.37–39,48,49 All other reactants and solvents were purchased from Fisher, Alfa Aesar and Sigma-Aldrich and used as received. NMR spectra were recorded on a Bruker Avance III 500 NMR spectrometer. Elemental analyses were performed using a EuroVector EA3000 Elemental Analyser. FTIR spectra were recorded on a Bruker Vertex 80 as KBr disks. Energy-dispersive X-ray spectroscopy (EDS) was performed on a Hitachi TM3000 TableTop SEM with a Bruker QUANTAX 70 EDS equipment. The thermal properties were studied on a Thermo Microbalance TG 209 F1 Iris (NETZSCH) in the temperature range of 25–850 °C with a heating rate of 10 °C min−1 in a helium flow (30 mL min−1). Absorption spectra were recorded on a Cary 60 UV-Vis spectrophotometer (Agilent). The mass spectrometric (MS) detection was performed in negative mode within the 500–4000 m/z range on an electrospray ionization quadrupole time-of-flight (ESI-q-TOF) high-resolution mass spectrometer Maxis 4G (Bruker Daltonics, Germany). The photo-degradation studies were undertaken using Hamamatsu LIGHTNINGCURE Spot light source LC8 Type no. L9588-03 (Japan) which has a power of 150 W and emits in the wavelength region of 400–700 nm.Synthetic procedures
2: Yield: 150 mg (68%). For C32H72I8N8O18W6: calcd: C 12.9; H 2.4; N 3.8. Found: C 12.9; H, 2.4; N, 3.7. EDS: W![[thin space (1/6-em)]](https://www.rsc.org/images/entities/char_2009.gif) :
:![[thin space (1/6-em)]](https://www.rsc.org/images/entities/char_2009.gif) I ratio of 6
I ratio of 6![[thin space (1/6-em)]](https://www.rsc.org/images/entities/char_2009.gif) :
:![[thin space (1/6-em)]](https://www.rsc.org/images/entities/char_2009.gif) 8.3. IR (KBr, cm−1): νas(NO2) = 1499, νs(NO2) = 1264, ν(NO) = 975. UV-vis (CH3CN): λmax, nm (ε, M−1 cm−1): 233 (5.9 × 10⁴), 309 (1.3 × 10⁴).
8.3. IR (KBr, cm−1): νas(NO2) = 1499, νs(NO2) = 1264, ν(NO) = 975. UV-vis (CH3CN): λmax, nm (ε, M−1 cm−1): 233 (5.9 × 10⁴), 309 (1.3 × 10⁴).
3: Yield: 136 mg (50%). For C74H114I8N2O18S6W6 calcd: C 24.5; H, 3.2; N, 0.8; S, 5.3. Found: C 24.3; H 3.1; N 0.8; S 5.0. EDS: W![[thin space (1/6-em)]](https://www.rsc.org/images/entities/char_2009.gif) :
:![[thin space (1/6-em)]](https://www.rsc.org/images/entities/char_2009.gif) I
I![[thin space (1/6-em)]](https://www.rsc.org/images/entities/char_2009.gif) :
:![[thin space (1/6-em)]](https://www.rsc.org/images/entities/char_2009.gif) S ratio of 6
S ratio of 6![[thin space (1/6-em)]](https://www.rsc.org/images/entities/char_2009.gif) :
:![[thin space (1/6-em)]](https://www.rsc.org/images/entities/char_2009.gif) 8.2
8.2![[thin space (1/6-em)]](https://www.rsc.org/images/entities/char_2009.gif) :
:![[thin space (1/6-em)]](https://www.rsc.org/images/entities/char_2009.gif) 5.8. IR (KBr, cm−1): νas(SO2) = 1270, νs(SO2) = 1157, ν(SO) = 975. λmax, nm (ε, M−1 cm−1): 315 (1.4 × 10⁴), 363 (6.7 × 10³). 1H NMR (acetone-d6) δ (ppm): 7.66–7.55 (12H, m, 6 × 2Hortho), 7.32–7.21 (12H, m, 6 × 2Hmeta), 3.45–3.31 (16H, m, 2 × 4CH2), 2.39 (18H, s, 6 × CH3), 1.77 (16H, quin, 2 × 4CH2, J = 7.4), 1.42 (16H, sex, 2 × 4CH2, J = 7.4), 0.96 (24H, t, 2 × 4CH3, J = 7.4).
5.8. IR (KBr, cm−1): νas(SO2) = 1270, νs(SO2) = 1157, ν(SO) = 975. λmax, nm (ε, M−1 cm−1): 315 (1.4 × 10⁴), 363 (6.7 × 10³). 1H NMR (acetone-d6) δ (ppm): 7.66–7.55 (12H, m, 6 × 2Hortho), 7.32–7.21 (12H, m, 6 × 2Hmeta), 3.45–3.31 (16H, m, 2 × 4CH2), 2.39 (18H, s, 6 × CH3), 1.77 (16H, quin, 2 × 4CH2, J = 7.4), 1.42 (16H, sex, 2 × 4CH2, J = 7.4), 0.96 (24H, t, 2 × 4CH3, J = 7.4).
![[thin space (1/6-em)]](https://www.rsc.org/images/entities/char_2009.gif) :
:![[thin space (1/6-em)]](https://www.rsc.org/images/entities/char_2009.gif) I ratio of 6
I ratio of 6![[thin space (1/6-em)]](https://www.rsc.org/images/entities/char_2009.gif) :
:![[thin space (1/6-em)]](https://www.rsc.org/images/entities/char_2009.gif) 8.1. The crystals suitable for X-ray diffraction analysis were obtained by slow evaporation of the reaction solution in air and selected from the mother liquor. It was found that 4 crystallises as a dodecahydrate [{W6I8}(OH)4(H2O)2]·12H2O. Despite this, the XRPD of the dried crystalline powder corresponds to the theoretical diffraction pattern of 4·12H2O; however the TGA data show a quasi-two-step mass loss that corresponds to the removal of 6 solvate water molecules and 2 apical H2O ligands.
8.1. The crystals suitable for X-ray diffraction analysis were obtained by slow evaporation of the reaction solution in air and selected from the mother liquor. It was found that 4 crystallises as a dodecahydrate [{W6I8}(OH)4(H2O)2]·12H2O. Despite this, the XRPD of the dried crystalline powder corresponds to the theoretical diffraction pattern of 4·12H2O; however the TGA data show a quasi-two-step mass loss that corresponds to the removal of 6 solvate water molecules and 2 apical H2O ligands.
Crystallography
Single-crystal X-ray diffraction data were collected at 150 K on a Bruker Nonius X8 Apex 4 K CCD diffractometer fitted with graphite monochromatised MoKα radiation (λ = 0.71073 Å). All crystallographic data are summarised in Table 1S.† Absorption corrections were made empirically using the SADABS program.70 The structures were solved by the direct methods and further refined by the full-matrix least-squares method using the SHELXTL program package.70 All non-hydrogen atoms were refined anisotropically. The positions of the hydrogen atoms of the tetra-n-butylammonium cation and toluene sulfonate were calculated corresponding to their geometrical conditions and refined using the riding model. The positions of the hydrogen atoms in the water molecules and OH− ligands were not localised. CCDC 1539550, 1539551, 1549215† and CSD 432782 contain the supplementary crystallographic data for this paper.Photoluminescence measurements
Room temperature emission spectra were recorded with a Horiba Jobin Yvon Fluorolog 3 photoluminescence spectrometer that was equipped with a 450 W ozone-free Xe-lamp, a cooled photon detection module PC177CE-010, a fluorescence lifetime determination system PMT, an integrating sphere Quanta-φ and double grating excitation and emission monochromators. Emission spectra were corrected for source intensity (lamp and grating) and emission spectral response (detector and grating) by standard correction curves. For photoluminescence measurements, powdered samples of complexes 1–8 were placed between two non-fluorescent quartz plates. The acetonitrile solutions of the complexes were poured into quartz cuvettes, and the absorbance of solutions was set at <0.1 at 355 nm. The solutions were deaerated by purging the cuvettes with an Ar-gas stream for 30 min and subsequently sealed. Corrected emission spectra were recorded at 355 nm excitation. The Savitzky–Golay filter was used for smoothing the luminescence spectra to increase the signal-to-noise ratio.71X-ray induced luminescence measurements
The spectra of X-ray induced luminescence were recorded on a MARY spectrometer with a spectral resolution described elsewhere72 adapted to measure such powder samples. X-rays were generated by using an X-ray tube (BSV-27-Mo, Svetlana, St Petersburg, Russia) operated at 40 kV and 20 mA. Full-spectrum bremsstrahlung was used for excitation, and the beam covered the entire sample strip. The detection channel included a quartz optical imaging system and a grating monochromator (MDR-206, LOMO Photonics, St Petersburg, Russia, objective focus length 180 mm, grating 1200 lines per mm, inverse linear dispersion 4.3 nm mm−1) with slits set to 2.2 mm/2.2 mm (spectral resolution about 10 nm). To extend the spectral range of detection to the red region, the original detector was substituted for a Hamamatsu H10493-012 photosensor module with enhanced sensitivity down to near IR, and the entire system was recalibrated for spectral sensitivity.To prepare samples, a 100 μm thick copper stencil with a 3 × 8 mm rectangular opening was placed onto a flat horizontal copper base. Compounds 1–8 were finely ground in a mortar and poured over the opening to cover it completely. Excess powder was raked off with a flat copper blade, and the stencil was lifted off vertically, leaving an island of powder with reasonably well controlled dimensions of 3 mm (W) by 8 mm (H) by 0.1 mm (D). A rectangular aluminum plate with dimensions 9 × 10 mm was then cut from a 0.8 mm thick sheet, and double-sided scotch tape was applied to both sides. The backing liner was removed from one of the surfaces, and the obtained sandwich was weighed on a laboratory balance (Ohaus Analytical Plus) to a 0.01 mg resolution. After weighing the plate was firmly pressed with its sticky side down flat onto the island of powder, which ensured a clean and complete transfer of the powdered sample to the plate, providing sufficient adhesion so that the sample could safely withstand further handling. The plate was weighed again, and the difference in weight readings was noted as the mass of the sample. During the measurement the sample was installed vertically at 45 degrees to the directions of both the incident X-ray beam and the detection system, which were horizontal and normal to each other, by pressing its sticky back surface into the sample holder. The employed sample geometry and positioning ensured homogeneous sample illumination and detection reproducibility for each sample, which was critical for the quantitative comparison between the compounds.
X-ray computed tomography radiodensity studies
The comparative radiodensity investigations for compounds 1, 2, 5 and 6 were performed using a Toshiba Aquilion 64 CT scanner with CT-scan parameters: 120 kV and 40 mA on solid samples and solutions. The pellets (diameter 15 mm, thickness 2.1 mm) were prepared from a mixture of 500 mg of α-lactose monohydrate with different amounts (0.03, 0.015, 0.007, 0.004, and 0.002 mmol) of the cluster complexes 1, 2, 5 and 6 by using a laboratory hydraulic press under a pressure up to 4 tons. The radiodensity measurements were undertaken for clusters 1, 2, 5 and 6 dissolved in DMSO. Namely, 0.2 mL of a 0.131 M stock solution of the clusters were 5 times two-fold diluted and placed in a flat-bottomed cell culture multiwell plate (0.4 ml) alongside pure DMSO, as a negative radiolucency reference.Conclusions
In this work we have compared the optical and X-ray induced luminescence properties of a variety of octahedral molybdenum and tungsten clusters with the cluster core {M6I8}4+ (M = Mo or W). All complexes apart from the aqua-hydroxo complexes [{M6I8}(OH)4(H2O)2] demonstrate bright photoluminescence in the red region of the spectra. We have shown that both absorption and emission profiles of the tungsten cluster complexes are somewhat blue shifted in comparison with their molybdenum analogues, which signifies the broader energy gaps for the former, which is likely to be associated with the slightly higher electronegativity of tungsten atoms.Although tungsten cluster complexes 1–3 only demonstrated average photoluminescence quantum yields (indeed, among the whole family of octahedral cluster complexes, it is those comprising molybdenum that hold the highest recorded photoluminescence quantum yields),36,38 the study of X-ray induced luminescence demonstrate that tungsten cluster complexes are significantly superior emitters to the molybdenum cluster analogues. This is due to significantly higher X-ray attenuation by the heavier tungsten atoms. Indeed the compound (Bu4N)2[{W6I8}I6] has demonstrated both the highest radiodensity in the solid state and in solution and the highest intensity of XEOL. Materials based on this compound are therefore good candidates as agents for the combined CT/X-ray luminescence CT bioimaging method and X-ray induced PDT.
Additionally we have found that both nitrato cluster compounds 2 and 5 are prone to degradation upon X-ray irradiation. The tungsten cluster compound does also degrade upon photoirradiation both under an inert atmosphere and in air. Although the role of nitrato ligands in the photo-degradation is not fully understood, it is clear that the photo-irradiation of 2 results in the total destruction of the cluster core with the formation of a thermodynamically stable Lindqvist anion [W6O19]2− and iodide ions.
Conflicts of interest
There are no conflicts to declare.Acknowledgements
This work was supported by the Russian Science Foundation [grant number 15-15-10006]. Also, M. A. Shestopalov acknowledges the Grant of the President of the Russian Federation [grant number MK 180.2017.3], O. A. Efremova is grateful to the University of Hull for the academic starting grant and Y. A. Vorotnikov thanks the government of Novosibirsk region for the fellowship for young scientists.References
- A. A. Krasilnikova, M. A. Shestopalov, K. A. Brylev, I. A. Kirilova, O. P. Khripko, K. E. Zubareva, Y. I. Khripko, V. T. Podorognaya, L. V. Shestopalova, V. E. Fedorov and Y. V. Mironov, J. Inorg. Biochem., 2015, 144, 13–17 CrossRef CAS PubMed.
- S.-B. Yu and A. D. Watson, Chem. Rev., 1999, 99, 2353–2378 CrossRef CAS PubMed.
- H. Chen, M. M. Rogalski and J. N. Anker, Phys. Chem. Chem. Phys., 2012, 14, 13469–13486 RSC.
- M. Shilo, T. Reuveni, M. Motiei and R. Popovtzer, Nanomedicine, 2012, 7, 257–269 CrossRef CAS PubMed.
- G. Zhang, F. Liu, J. Liu, J. Luo, Y. Xie, J. Bai and L. Xing, IEEE Trans. Med. Imaging, 2017, 36, 225–235 CrossRef PubMed.
- G. Pratx, C. M. Carpenter, C. Sun and L. Xing, IEEE Trans. Med. Imaging, 2010, 29, 1992–1999 CrossRef PubMed.
- D. Chen, S. Zhu, H. Yi, X. Zhang, D. Chen, J. Liand and J. Tian, Med. Phys., 2013, 40, 031111 CrossRef PubMed.
- M. V. dos S. Rezende, P. J. R. Montes, A. B. Andrade, Z. S. Macedo and M. E. G. Valeio, Phys. Chem. Chem. Phys., 2016, 18, 17646–17654 RSC.
- M. Nikl, Meas. Sci. Technol., 2006, 17, R37–R54 CrossRef CAS.
- S. L. Issler and C. C. Torardi, J. Alloys Compd., 1995, 229, 54–65 CrossRef CAS.
- H. Chen, G. D. Wang, Y.-J. Chuang, Z. Zhen, X. Chen, P. Biddinger, Z. Hao, F. Liu, B. Shen, Z. Pan and J. Xie, Nano Lett., 2015, 15, 2249–2256 CrossRef CAS PubMed.
- C. Sun, G. Pratx, C. M. Carpenter, H. Liu, Z. Cheng, S. S. Gambhir and L. Xing, Adv. Mater., 2011, 23, H195–H199 CrossRef CAS PubMed.
- Y. Osakada, G. Pratx, C. Sun, M. Sakamoto, M. Ahmad, O. Volotskova, Q. Ong, T. Teranishi, Y. Harada, L. Xing and B. Cui, Chem. Commun., 2014, 50, 3549–3551 RSC.
- C. Wang, O. Volotskova, K. Lu, M. Ahmad, C. Sun, L. Xing and W. Lin, J. Am. Chem. Soc., 2014, 136, 6171–6174 CrossRef CAS PubMed.
- K. Kirakci, P. Kubát, K. Fejfarová, J. Martinčík, M. Nikl and K. Lang, Inorg. Chem., 2016, 55, 803–809 CrossRef CAS PubMed.
- N. A. Vorotnikova, O. A. Efremova, A. R. Tsygankova, K. A. Brylev, M. V. Edeleva, O. G. Kurskaya, A. J. Sutherland, A. M. Shestopalov, Y. V. Mironov and M. A. Shestopalov, Polym. Adv. Technol., 2016, 27, 922–928 CrossRef CAS.
- C. Neaime, M. Amela-Cortes, F. Grasset, Y. Molard, S. Cordier, B. Dierre, M. Mortier, T. Takei, K. Takahashi, H. Haneda, M. Verelst and S. Lechevallier, Phys. Chem. Chem. Phys., 2016, 18, 30166–30173 RSC.
- A. O. Solovieva, Y. A. Vorotnikov, K. E. Trifonova, O. A. Efremova, A. A. Krasilnikova, K. A. Brylev, E. V. Vorontsova, P. A. Avrorov, L. V. Shestopalova, A. F. Poveshchenko, Y. V. Mironov and M. A. Shestopalov, J. Mater. Chem. B, 2016, 4, 4839–4846 RSC.
- A. Beltrán, M. Mikhailov, M. N. Sokolov, V. Pérez-Laguna, A. Rezusta, M. J. Revillo and F. Galindo, J. Mater. Chem. B, 2016, 4, 5975–5979 RSC.
- A. M. Cheplakova, A. O. Solovieva, T. N. Pozmogova, Y. A. Vorotnikov, K. A. Brylev, N. A. Vorotnikova, E. V. Vorontsova, Y. V. Mironov, A. F. Poveshchenko, K. A. Kovalenko and M. A. Shestopalov, J. Inorg. Biochem., 2017, 166, 100–107 CrossRef CAS PubMed.
- E. V. Svezhentseva, A. O. Solovieva, Y. A. Vorotnikov, O. G. Kurskaya, K. A. Brylev, A. R. Tsygankova, M. V. Edeleva, S. N. Gyrylova, N. Kitamura, O. A. Efremova, M. A. Shestopalov, Y. V. Mironov and A. M. Shestopalov, New J. Chem., 2017, 41, 1670–1676 RSC.
- M. A. Shestopalov, K. E. Zubareva, O. P. Khripko, Y. I. Khripko, A. O. Solovieva, N. V. Kuratieva, Y. V. Mironov, N. Kitamura, V. E. Fedorov and K. A. Brylev, Inorg. Chem., 2014, 53, 9006–9013 CrossRef CAS PubMed.
- C. Echeverría, A. Becerra, F. Nuñez-Villena, A. Muñoz-Castro, J. Stehberg, Z. Zheng, R. Arratia-Perez, F. Simon and R. Ramírez-Tagle, New J. Chem., 2012, 36, 927–932 RSC.
- S.-J. Choi, K. A. Brylev, J.-Z. Xu, Y. V. Mironov, V. E. Fedorov, Y. S. Sohn, S.-J. Kim and J.-H. Choy, J. Inorg. Biochem., 2008, 102, 1991–1996 CrossRef CAS PubMed.
- J. G. Elistratova, K. A. Brylev, A. O. Solovieva, T. N. Pozmogova, A. R. Mustafina, L. V. Shestopalova, M. A. Shestopalov, V. V. Syakayev, A. A. Karasik and O. G. Sinyashin, J. Photochem. Photobiol., A, 2017, 340, 46–52 CrossRef CAS.
- A. A. Krasilnikova, A. O. Solovieva, K. E. Trifonova, K. A. Brylev, A. A. Ivanov, S.-J. Kim, M. A. Shestopalov, M. S. Fufaeva, A. M. Shestopalov, Y. V. Mironov, A. F. Poveshchenko and L. V. Shestopalova, Contrast Media Mol. Imaging, 2016, 11, 459–466 CrossRef CAS PubMed.
- T. N. Pozmogova, A. A. Krasilnikova, A. A. Ivanov, M. A. Shestopalov, S. N. Gyrylova, L. V. Shestopalova, A. M. Shestopalov and V. A. Shkurupy, Bull. Exp. Biol. Med., 2016, 161, 64–68 CrossRef CAS PubMed.
- K. A. Brylev, M. A. Shestopalov, O. P. Khripko, V. A. Trunova, V. V. Zvereva, C. C. Wang, Y. V. Mironov and V. E. Fedorov, Bull. Exp. Biol. Med., 2013, 155, 741–744 CrossRef CAS PubMed.
- A. A. Krasilnikova, A. O. Solovieva, A. A. Ivanov, K. E. Trifonova, T. N. Pozmogova, A. R. Tsygankova, A. I. Smolentsev, E. I. Kretov, D. S. Sergeevichev, M. A. Shestopalov, Y. V. Mironov, A. M. Shestopalov, A. F. Poveshchenko and L. V. Shestopalova, Nanomedicine, 2017, 13, 755–763 CrossRef CAS PubMed.
- J. Elistratova, M. Mikhailov, V. Burilov, V. Babaev, I. Rizvanov, A. Mustafina, P. Abramov, M. Sokolov, A. Konovalov and V. Fedin, RSC Adv., 2014, 4, 27922–27930 RSC.
- J. Elistratova, V. Burilov, A. Mustafina, M. Mikhailov, M. Sokolov, V. Fedin and A. Konovalov, Polymer, 2015, 72, 98–103 CrossRef CAS.
- J. G. Elistratova, A. R. Mustafina, K. A. Brylev, K. A. Petrov, M. A. Shestopalov, Y. V. Mironov, V. M. Babaev, I. K. Rizvanov, P. Masson and O. G. Sinyashin, Analyst, 2016, 141, 4204–4210 RSC.
- A. A. Krasilnikova, A. O. Solovieva, A. A. Ivanov, K. A. Brylev, T. N. Pozmogova, M. A. Gulyaeva, O. G. Kurskaya, A. Y. Alekseev, A. M. Shestopalov, L. V. Shestopalova, A. F. Poveshchenko, O. A. Efremova, Y. V. Mironov and M. A. Shestopalov, Toxicol. Res., 2017, 6, 554–560 RSC.
- O. A. Efremova, K. A. Brylev, Y. A. Vorotnikov, L. Vejsadová, M. A. Shestopalov, G. F. Chimonides, P. Mikes, P. D. Topham, S.-J. Kim, N. Kitamura and A. J. Sutherland, J. Mater. Chem. C, 2016, 4, 497–503 RSC.
- M. N. Sokolov, M. A. Mihailov, E. V. Peresypkina, K. A. Brylev, N. Kitamura and V. P. Fedin, Dalton Trans., 2011, 40, 6375–6377 RSC.
- M. A. Mikhailov, K. A. Brylev, P. A. Abramov, E. Sakuda, S. Akagi, A. Ito, N. Kitamura and M. N. Sokolov, Inorg. Chem., 2016, 55, 8437–8445 CrossRef CAS PubMed.
- O. A. Efremova, M. A. Shestopalov, N. A. Chirtsova, A. I. Smolentsev, Y. V. Mironov, N. Kitamura, K. A. Brylev and A. J. Sutherland, Dalton Trans., 2014, 43, 6021–6025 RSC.
- O. A. Efremova, Y. A. Vorotnikov, K. A. Brylev, N. A. Vorotnikova, I. N. Novozhilov, N. V. Kuratieva, M. V. Edeleva, D. M. Benoit, N. Kitamura, Y. V. Mironov, M. A. Shestopalov and A. J. Sutherland, Dalton Trans., 2016, 45, 15427–15435 RSC.
- Y. A. Vorotnikov, O. A. Efremova, N. A. Vorotnikova, K. A. Brylev, M. V. Edeleva, A. R. Tsygankova, A. I. Smolentsev, N. Kitamura, Y. V. Mironov and M. A. Shestopalov, RSC Adv., 2016, 6, 43367–43375 RSC.
- K. Kirakci, P. Kubát, M. Dušek, K. Fejfarová, V. Šícha, J. Mosinger and K. Lang, Eur. J. Inorg. Chem., 2012, 3107–3111 CrossRef CAS.
- K. Kirakci, K. Fejfarová, M. Kučeráková and K. Lang, Eur. J. Inorg. Chem., 2014, 2331–2336 CrossRef CAS.
- K. Kirakci, V. Šícha, J. Holub and K. Lang, Inorg. Chem., 2014, 53, 13012–13018 CrossRef CAS PubMed.
- M. Amela-Cortes, Y. Molard, S. Paofai, A. Desert, J.-L. Duvail, N. G. Naumov and S. Cordier, Dalton Trans., 2016, 45, 237–245 RSC.
- V. Cîrcu, Y. Molard, M. Amela-Cortes, A. Bentaleb, P. Barois, V. Dorcet and S. Cordier, Angew. Chem., Int. Ed., 2015, 54, 10921–10925 CrossRef PubMed.
- L. Riehl, A. Seyboldt, M. Ströbele, D. Enseling, T. Jüstel, M. Westberg, P. R. Ogilby and H.-J. Meyer, Dalton Trans., 2016, 45, 15500–15506 RSC.
- T. Hummel, M. Ströbele, D. Schmid, D. Enseling, T. Jüstel and H.-J. Meyer, Eur. J. Inorg. Chem., 2016, 5063–5067 CrossRef CAS.
- Y. Molard, Acc. Chem. Res., 2016, 49, 1514–1523 CrossRef CAS PubMed.
- Y. A. Vorotnikov, M. A. Mikhailov, K. A. Brylev, D. A. Piryazev, N. V. Kuratieva, M. N. Sokolov, Y. V. Mironov and M. A. Shestopalov, Russ. Chem. Bull., 2015, 64, 2591–2596 CrossRef CAS.
- K. Kirakci, S. Cordier and C. Perrin, Z. Anorg. Allg. Chem., 2005, 631, 411–416 CrossRef CAS.
- M. A. Mikhailov, A. L. Gushchin, M. R. Gallyamov, A. V. Virovets, M. N. Sokolov, D. G. Sheven' and V. V. Pervukhin, Russ. J. Coord. Chem., 2017, 43, 172–180 CrossRef CAS.
- T. C. Zietlow, W. P. Schaefer, B. Sadeghi, N. Hua and H. B. Gray, Inorg. Chem., 1986, 25, 2195–2198 CrossRef CAS.
- M. A. Mikhaylov, P. A. Abramov, V. Y. Komarov and M. N. Sokolov, Polyhedron, 2017, 122, 241–246 CrossRef CAS.
- K. Kirakci, P. Kubát, M. Kučeráková, V. Šícha, H. Gbelcová, P. Lovecká, P. Grznárová, T. Ruml and K. Lang, Inorg. Chim. Acta, 2016, 441, 42–49 CrossRef CAS.
- Y. A. Vorotnikov, O. A. Efremova, I. N. Novozhilov, V. V. Yanshole, N. V. Kuratieva, K. A. Brylev, N. Kitamura, Y. V. Mironov and M. A. Shestopalov, J. Mol. Struct., 2017, 1134, 237–243 CrossRef CAS.
- J. L. Kropp and M. W. Windsor, J. Chem. Phys., 1963, 39, 2769–2770 CrossRef CAS.
- J. L. Kropp and M. W. Windsor, J. Chem. Phys., 1965, 42, 1599–1608 CrossRef CAS.
- A. Beeby, I. M. Clarkson, R. S. Dickins, S. Faulkner, D. Parker, L. Royle, A. S. de Sousa, J. A. G. Williams and M. Wood, J. Chem. Soc., Perkin Trans. 2, 1999, 493–504 RSC.
- R. N. Ghosh, P. A. Askeland, S. Kramer and R. Loloee, Appl. Phys. Lett., 2011, 98, 221103 CrossRef.
- K. Kirakci, P. Kubát, J. Langmaier, T. Polívka, M. Fuciman, K. Fejfarová and K. Lang, Dalton Trans., 2013, 42, 7224–7232 RSC.
- F. Grasset, F. Dorson, S. Cordier, Y. Molard, C. Perrin, A. M. Marie, T. Sasaki, H. Haneda, Y. Bando and M. Mortier, Adv. Mater., 2008, 20, 143–148 CrossRef CAS.
- A. D. Awtrey and R. E. Connick, J. Am. Chem. Soc., 1951, 73, 1842–1843 CrossRef CAS.
- N. Li, L. Shi, X. Wang, F. Guo and C. Yan, Int. J. Anal. Chem., 2011, 2011, 130102 Search PubMed.
- J. M. Gardner, M. Abrahamsson, B. H. Farnum and G. J. Meyer, J. Am. Chem. Soc., 2009, 131, 16206–16214 CrossRef CAS PubMed.
- D. Ravelli, D. Dondi, M. Fagnoni, A. Albini and A. Bagno, J. Comput. Chem., 2011, 32, 2983–2987 CrossRef CAS PubMed.
- T. Takashima, R. Nakamura and K. Hashimoto, Electrochemistry, 2011, 79, 783–786 CrossRef CAS.
- A. Maldotti, R. Amadelli, G. Varani, S. Tollari and F. Porta, Inorg. Chem., 1994, 33, 2968–2973 CrossRef CAS.
- E. Papaconstantinou and A. Hiskia, Photochemistry and photocatalysis by polyoxometalates, in Nato Sci Ser Ii Math, Springer, Netherlands, 2003, pp. 381–416 Search PubMed.
- C. Tanielian, R. Seghrouchni and C. Schweitzer, J. Phys. Chem. A, 2003, 107, 1102–1111 CrossRef CAS.
- Y. H. Ren, M. Y. Wang, X. Y. Chen, B. Yue and H. Y. He, Materials, 2015, 8, 1545–1567 CrossRef PubMed.
- Bruker, APEX2 (Version 1.08), SAINT (Version 07.03), SADABS (Version 02.11), SHELXTL (Version 06.12), Bruker AXS Inc., Madison, WI, USA, 2004 Search PubMed.
- A. Savitzky and M. J. E. Golay, Anal. Chem., 1964, 36, 1627–1639 CrossRef CAS.
- E. V. Kalneus, A. R. Melnikov, V. V. Korolev, V. I. Ivannikov and D. V. Stass, Appl. Magn. Reson., 2013, 44, 81–96 CrossRef CAS.
Footnote |
| † Electronic supplementary information (ESI) available: Single crystal data; FTIR, UV/Vis and 1H NMR spectra; XRPD, TG, and DTG data; electrochemical properties; X-ray attenuation vs. concentration data, X-ray induced luminescence measurements, photo-degradation studies, figures and tables. CCDC 1539550, 1539551 and 1549215. For ESI and crystallographic data in CIF or other electronic format see DOI: 10.1039/c7dt01919j |
| This journal is © The Royal Society of Chemistry 2017 |

