
 Open Access Article
 This Open Access Article is licensed under a Creative Commons Attribution-Non Commercial 3.0 Unported Licence
Palladium(II) in liquid ammonia: an investigation of structural and dynamical properties by applying quantum mechanical charge field molecular dynamics (QMCF-MD)†
Muhammad
Saleh
 and
Thomas S.
Hofer
*
and
Thomas S.
Hofer
*
Theoretical Chemistry Division, Institute of General, Inorganic and Theoretical Chemistry, Center for Chemistry and Biomedicine, University of Innsbruck, Innrain 80-82, A-6020 Innsbruck, Austria. E-mail: T.Hofer@uibk.ac.at; Fax: +43-512-507-57199; Tel: +43-512-507-57111
First published on 27th June 2017
Abstract
The structural and dynamical properties of Pd2+ in liquid ammonia have been investigated via quantum mechanical charge field molecular dynamics. Similar to the case of aqueous Pd2+, a six-fold coordination polyhedron in the form of a tetrahedrally elongated octahedron is observed with two ligands in axial positions forming an extended first shell. To highlight the difference in solvation between the aqueous and ammonia case a selection based on the angular-radial distribution with respect to the well-known square planar motif was applied also providing a detailed understanding of ligand exchange between the extended first and second shells. All structural properties resulting from this investigation compare well with the available solid-state data of various N-containing complexes. From the dynamical perspective, Pd2+ in liquid ammonia forms a more flexible complex with a higher rate of ligand exchange than that of its aqueous counterpart.
1 Introduction
Liquid ammonia and its interactions with metal ions became a subject of particular interest due to the broad use of ammonia solutions in industrial applications.1–4 Its interactions with palladium(II) are prominent examples that have been investigated in the context of catalysis as well as in electrochemical processes,2,5–8 however, the majority of experimental investigations have been carried out only with ammonia-containing complexes.9–13 The only experimental investigation in liquid ammonia was conducted by Rasmussen et al.14 reporting a dissociation rate of Pd(NH3)42+ as 7.8 × 10⁻⁴ s−1. Thus, the respective structural properties of Pd2+ in liquid ammonia remain ambiguous today. The vast majority of experimental investigations report a square-planar coordination geometry,9–11,13,15,16 but a number of studies also highlight the presence of ligands in an axial position with respect to the plane17–19 similar to the aqueous case.20 Caminiti et al.21 performed EXAFS and LAXS measurements on (NH4)2PdCl4 in aqueous solutions and reported the presence of two axial water molecules at 2.77 Å coordinated to the [PdCl4]2− complex. Investigations on cyclic polythioether also showed that Pd2+ coordinates five to six ligands where two axial ligands coordinate weakly at 2.96–3.27 Å.22Theoretical investigations in water by Marcos and coworkers via classic molecular dynamics (MD)23 and Car–Parrinello molecular dynamics (CPMD)24 indicate the formation of a tetrahedrally elongated octahedral Pd2+–H2O complex. The two ligands in an axial position are located at a longer distance from the Pd2+ ion and thus, have been termed meso-shell. Shah et al.25 investigated the same system via a hybrid QM/MM-MD26,27 approach and reported a square-pyramidal complex. However, it was concluded that the simulation of the system is not sufficiently accurate if only a single hydration shell is included in the quantum mechanical treatment. Application of an enlarged quantum region including the first plus second hydration shell as realised in the QMCF-MD procedure20 revealed the presence of two axial H2O ligands located at 2.7 Å in excellent agreement with EXAFS measurements. The QMCF-MD28–32 framework itself has been proven to be a sophisticated QM/MM-MD approach employing an enlarged quantum region and an improved coupling between the QM and MM zone resulting in a more accurate representation of solvated compounds33–37 in excellent agreement with available experimental investigations. In this paper, the QMCF-MD simulation approach is applied to study the structural and dynamical properties of Pd2+ in liquid ammonia, including a detailed comparison with the simulation results obtained for the aqueous case.20
2 Methods
As mentioned previously, QMCF-MD28–32 is an enhancement over the conventional QM/MM-MD approach.26,27 It has been shown that by using an enlarged quantum region, the application of solute–solvent non-Coulombic pair potentials in the QM/MM coupling is not required.29,31,32 Furthermore, the partial charges of all MM atoms surrounding the QM region are included as an external potential into the QM-Hamiltonian to modulate the electron density close to the QM/MM interface:38| ĤCF = ĤQM + V′ | (1) |
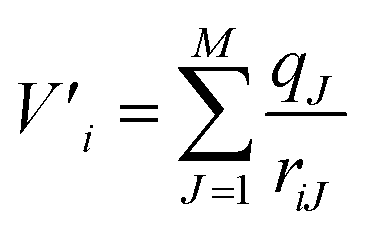 | (2) |
Here V′i is the potential of electron i, qJ are the partial charges of the Jth particle in the MM region29,31 and riJ is the distance between electron i and the point charge J. The partial charges of all atoms within the QM region were obtained via Mulliken population analysis in every simulation step. Further details about the QMCF-MD approach have been published elsewhere.31 To evaluate the structural properties radial distribution functions (RDFs), coordination number distributions (CNDs), and angular distribution functions (ADFs) were employed. To obtain a more detailed depiction of the solvation, radial and angular data are combined into an angular-radial distribution plot (ARD). For the dynamical aspects, mean residence times (MRT) were calculated via the direct method39 as well as vibrational analysis based on the Fourier transform (FT) of the ion–ligand velocity autocorrelation functions (VACFs).
2.1 Simulation protocol
The simulation was performed analogously to the highly successful QMCF-MD simulation of Pd2+ and the topologically similar Pt2+ in aqueous solution.20,40 A canonical NVT ensemble under periodic boundary conditions and minimal image convention was studied in a cubic box with a side length of 33.9 Å consisting of one Pd2+ and 1000 ammonia molecules. The radius of the QM region was set to 6.5 Å. To ensure the continuity of ligand exchanges between QM and MM regions, a smoothing function with a value of 0.2 Å was employed.29–31 To correct the cutoff of the Coulombic interactions, the reaction field41 approach was applied. An Adams–Bashforth predictor–corrector algorithm was used to integrate the equation of motions. A value of 0.5 fs was set as the time step of the simulation enabling explicit hydrogen movements. To keep the temperature of the system constant the Berendsen algorithm42 with a bath relaxation time of 0.1 fs was employed.To select an adequate level of theory in QM/MM MD type simulations, a compromise between the accuracy of results and computational effort has to be sought. Despite its commonly known shortcomings in the description of the correlated motion of the electrons, the application of Hartree–Fock theory in a QMCF-MD simulation study of aqueous Pd2+ resulted in an excellent agreement of the structural data and the experimental results obtained via extended X-ray absorption fine structure (EXAFS) measurements published in the same study.20 For this reason the performance of Hartree–Fock theory as well as the more popular density functional methods BLYP,43 PBE44 and B3LYP45,46 has been benchmarked in energy minimisations of small [Pd-(NH3)n]2+ clusters in the gas phase (n = 1, 2 and 4, a six-fold coordination as observed in the QMCF-MD simulation proved unstable under gas phase conditions) against correlated ab initio methods, namely second order Møller–Plesset perturbation theory (MP2) and Coupled Cluster with Single and Double excitations (CCSD) using the Gaussian09 program.47 The respective results are summarised in Table 1. It can be seen that in the case of the DFT methods the interaction energy per ligand E/n is greatly overestimated, while HF theory agrees well with the correlated ab initio methods, especially upon an increase of the number of ligands n. The same convergence occurs in the case of the average Pd2+–N distance.
| Method | n | r Pd–N | E/n |
|---|---|---|---|
| HF | 1 | 1.97 | –143.02 |
| 2 | 2.06 | –116.24 | |
| 4 | 2.12 | –87.06 | |
| MP2 | 1 | 1.98 | –142.49 |
| 2 | 2.06 | –116.23 | |
| 4 | 2.10 | –86.99 | |
| CCSD | 1 | 2.01 | –142.46 |
| 2 | 2.08 | –116.32 | |
| 4 | 2.12 | –87.16 | |
| BLYP | 1 | 2.02 | –207.94 |
| 2 | 2.11 | –155.06 | |
| 4 | 2.13 | –113.28 | |
| B3LYP | 1 | 1.98 | –194.67 |
| 2 | 2.07 | –147.55 | |
| 4 | 2.11 | –109.36 | |
| PBE | 1 | 1.99 | –211.91 |
| 2 | 2.08 | –158.53 | |
| 4 | 2.10 | –116.93 |
A similar trend has been observed in simulation studies of other highly charged ions48 such as Eu(II),49 Al(III),50 and U(IV)51 which produce data in excellent agreement with the experimental results using Hartree–Fock to describe the interaction in the QM region. Since the observed structural and energetic data of the model cluster systems are in line with the conclusions drawn in the combined theoretical and experimental study of aqueous Pd2+ and the applied simulation protocol in this study is effectively identical,20 the Hartree–Fock method thus provides the best compromise between effort and accuracy. The DZP52 basis was applied to all atoms of ammonia and LANL2DZ53 to the Pd2+ ion.
The potential parameters for the ligand–ligand interaction inside the MM region as well as in the QM–MM coupling were taken from the respective ammonia potential reported by Heinzinger and coworkers54 which has been successfully applied in investigations of a variety of ions in ammonia.55–62 The starting structure was taken from a well equilibrated structure of Ni2+ in liquid ammonia published earlier.55 Afterwards, the system was re-equilibrated for 18 ps after invoking the QMCF-MD potential followed by sampling for 20 ps. All QM calculations were executed using the TURBOMOLE 7.0.1 package63,64 and the trajectory was visualized using VMD.65
3 Results and discussion
Fig. 1a depicts the Pd–N and Pd–H radial distribution functions and the respective integration numbers. Two well-defined solvation spheres are observed, the first one ranging from 1.90 Å to 2.52 Å with maximal values of 2.12 Å and 2.65 Å in the Pd–N and Pd–H case, respectively. The second one emerged in a broad distribution ranging from 2.54 Å to 6.0 Å with maxima found at 4.49 Å and 4.90 Å (see Table 2). A slight shoulder (shown in the inset of Fig. 1a) visible from 2.54 Å to 3.53 Å indicates the presence of axial ligands although the respective peak is much less resolved than in aqueous solution.20 In the latter case this region has been termed extended first shell20 or meso-shell.23 Due to the anisotropic solvation of Pd2+ the definitions of first and second shell are not as straightforward as in the case of an ion exhibiting a spherically isotropic solute–solvent potential. Although the axial ligands are located at longer distances they formally belong to the first contact layer between the ion and the solvent. From this perspective the term extended first shell may be more precise than the designation of meso-shell introduced by considering the location of the respective peak in the Pd–O RDF of the aqueous case.23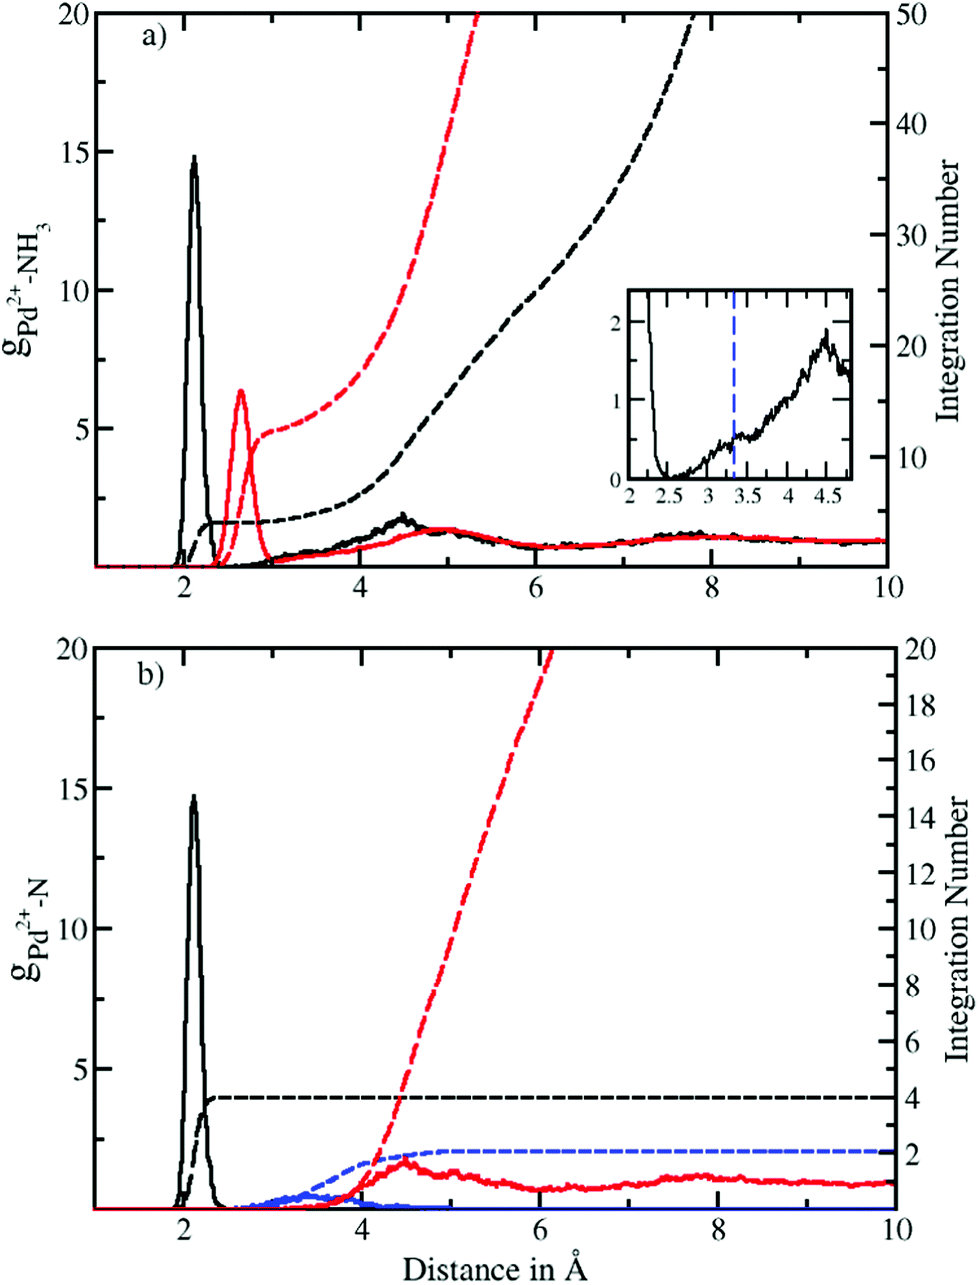 | ||
| Fig. 1 (a) Pd2+–N (black solid) and Pd2+–H (red solid) radial distribution functions (RDFs) and their integration number (dashed line) obtained via QMCF-MD simulation. The inset shows the presence of an extended first shell similar to the aqueous case.20 (b) Decomposition of the Pd–N RDF according to a combined angular-radial criterion (see Fig. 2 and 3) showing the first shell (solid black), extended first shell (solid blue) and second shell plus bulk (solid red) and the associated running integration numbers (dashed). | ||
| Pairs | r M1 | r m1 | r Mext | r mext | r M2 | r m2 | CN1 | CNext | CN2 |
|---|---|---|---|---|---|---|---|---|---|
| Pd2+–N | 2.12 | 2.52 | 3.40 | 5.0 | 4.49 | 6.0 | 4 | 2 | 18.8 |
| Pd2+–H | 2.65 | 3.07 | 3.80 | 5.40 | 4.90 | 6.22 | 12 | 6 | 56.6 |
A zero value between the first and second solvation shell indicates that no exchange of the four equatorial ligands took place during the simulation time, highlighting the rigidity of the square planar structural motif. On the other hand, a non-zero value between the second solvation shell and the bulk indicates the occurrence of the ligand exchange reactions.
According to the solid state structural data obtained from experimental investigations of various NH3-containing compounds (Table 3), the Pd–N bond distance is in the range of 2.03 Å to 2.26 Å. This value compares well with 2.12 Å obtained from the RDFs for Pd2+ in liquid ammonia. The deviation in distance can be attributed to the different environment in the solid-state9–11 (i.e. dielectric properties, proximity of counter ions, etc.) as well as the different nature of the ligands12,13 whereas in our case pure ammonia was employed as the solvent. In comparison with aqueous Pd2+ studied via QMCF-MD and EXAFS20 the Pd-ligand in ammonia showed a longer average distance by about 0.1 Å. The extended first shell in the RDFs also highlights a clear distinction between the first and second solvation shells with its maximal value located at 2.7 Å (see the ESI†). This suggests that the solvation sphere of Pd2+ in ammonia has a higher flexibility than the solvation sphere in water and also indicates a weaker contribution of axial ligands in ammonia.
| Method | d Pd–N | d Pd–O | CN | System | Ref. |
|---|---|---|---|---|---|
| QMCF-MD | 2.12 | 4 (eq) | 1000 ammonia molecules | This work | |
| 3.40 | 2 (ax) | 1000 ammonia molecules | This work | ||
| XRD | 2.038 | 4 | [Pd(NH3)4]MoO4 | 9 | |
| XRD | 2.040 | 4 | [Pd(NH3)4]CrO4 | 10 | |
| XRD | 2.042 | 4 | [Pd(NH3)4]3[Ir(NO2)6]2·H2O | 11 | |
| XRD | 2.03 | 4 | PdCl2(L1)2 | 68 | |
| L 1 = 1-ethyl-5-methyl-3-phenyl-1H-pyrazole | |||||
| XRD | 2.11 | 4 | (κ3-P,N,O-Mor-DalPhos)Pd(Ph)OTf | 12 | |
| XRD | 2.26 | 4 | (κ2-P,N-Mor-DalPhos)Pd(η1-cinnamyl)Cl | 12 | |
| XRD | 2.034 | 4 | [Pd(NH3)4][Rh(NH3)(NO2)5] | 13 | |
| QMCF-MD | 2.07 | 4 (eq) | 499 water molecules | 20 | |
| 2.70 | 2 (ax) | 20 | |||
| EXAFS | 2.01 | 4 (eq) | 40 mmol dm−3 Pd(ClO4)2 solution in 1.0 mmol dm−3 HClO4 | 20 | |
| 2.77 | 2 (ax) | 20 | |||
| MD | 2.01 | 4 (eq) | 23 | ||
| 2.67 | 2 (ax) | 496 TIP4P water molecules | 23 | ||
| CP-D | 2.04 | 4 (eq) | 70 water molecules | 24 | |
| 3.50 | 2 (ax) | 24 |
A difficulty in the structural analysis of the system results from the anisotropic solution characteristics, which can be elegantly probed via angular-radial distributions.32 The nitrogen density is depicted not only in a radial fashion but also takes the angle with respect to the well-known square planar arrangement of the equatorial ligands into account. The respective normal vector was obtained via a three-dimensional least-square fit to the positions of the Pd and the nitrogen atoms of the four planar ligands (see Fig. 2). Since the latter are never replaced along the simulation, this analysis is not influenced by ligand exchange reactions and is thus consistent over the whole trajectory. Fig. 3a and b show the ARD plot of Pd2+ in liquid ammonia in comparison with the aqueous case investigated in an earlier study.20 The dashed green line represents the cone region, which together with a radial interval, is used to separate the extended first and second shells. The extended first shell is located in the cone segment with an angle of 31.88° and a distance of 5.0 Å from the ion in the ammonia case and within an angle of 35.75° and a distance of 4.9 Å in the aqueous case.
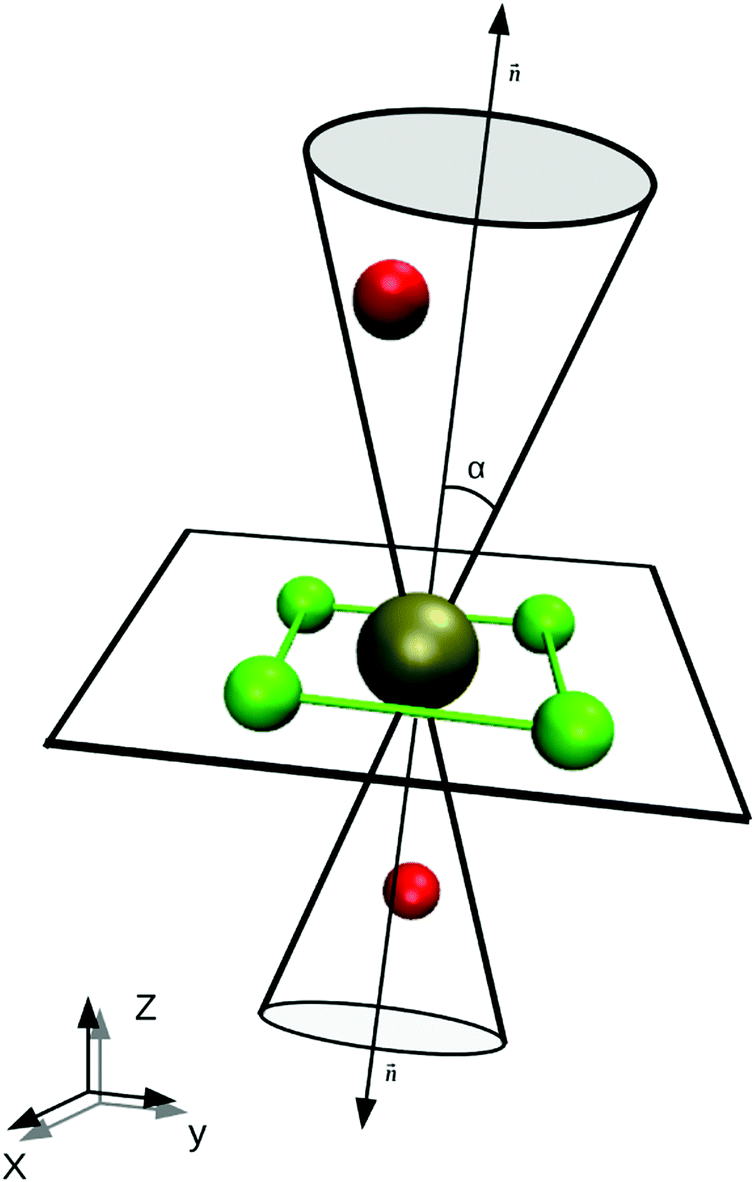 | ||
Fig. 2 Sketch of the definition of the first shell plane and the associated cone region. The normal vector  is obtained via a least-squares fit of the plane to the positions of the Pd2+ and the nitrogen atoms of the four in-plane ligands. is obtained via a least-squares fit of the plane to the positions of the Pd2+ and the nitrogen atoms of the four in-plane ligands. | ||
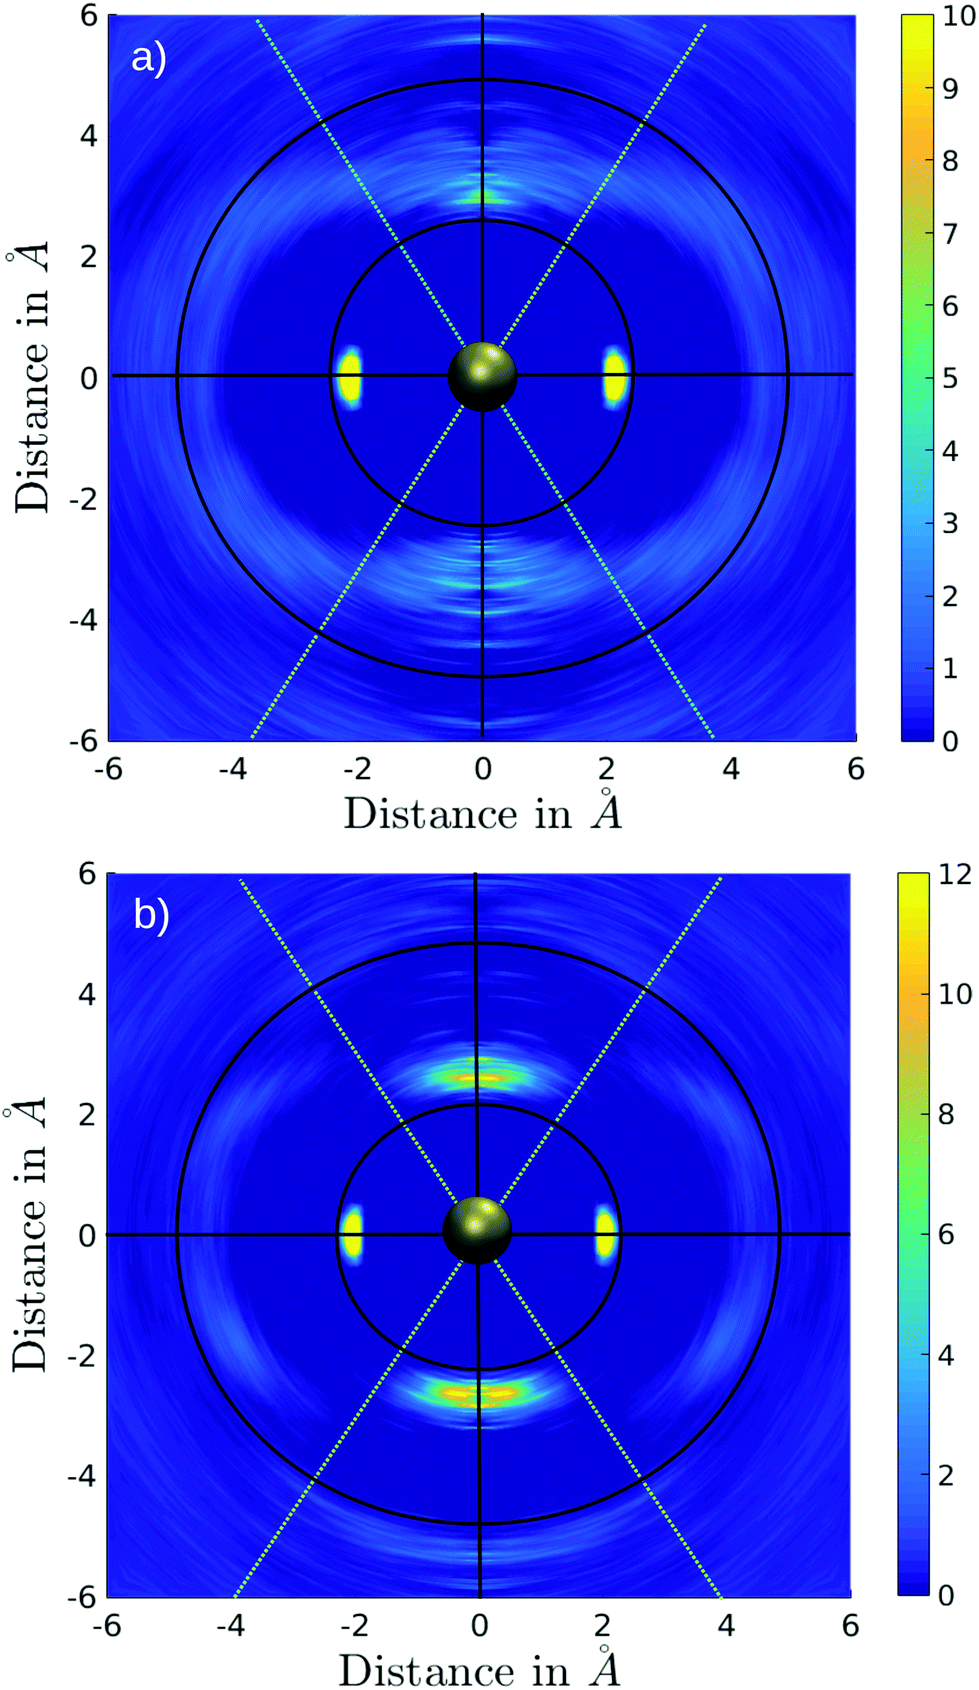 | ||
| Fig. 3 Angular-radial distribution (ARD) of (a) Pd2+–N and (b) Pd2+–O obtained via the QMCF-MD simulations. The green lines represent the cone selection used to define the axial region with respect to the equatorial plane. | ||
According to these depictions the high density along the x-axis indicates the orientation of the four ammonia ligands in square-planar arrangement while the much broader densities centered on the y-axis represent the two highly mobile axial ligands. Fig. 3 also provides information about the ligand exchange pathway: beyond the distributions of the axial ligands a region of zero density is observed (dark blue color at approx. ±5 Å along the y-axis). It can be seen that ligands in the axial position move perpendicularly to the axis when exchanging to/from the second solvation shell. Comparison with the distribution of aqueous Pd2+ shown in Fig. 3b reveals a narrow distribution, especially between the extended first shell and the bulk. As a consequence the respective peak in the pair distribution is more defined and shows little overlap with the second hydration shell (see Fig. S1†).
The definition of the different regions based on combined radial-angular criteria enables a decomposition of the ion–ligand pair distribution depicted in Fig. 1b and S1b† for Pd2+ in ammonia and aqueous solution, respectively. It can be seen that the extended first and second shells are well-separated by introducing the conical selection criteria and only a small region of overlap exists. The maximal values for the extended first and second shells were found at 3.40 Å and 4.49 Å with the respective average coordination numbers 2 and 18.8, respectively.
The associated coordination number distributions (CNDs) for the first, extended first, and second solvation shells are shown in Fig. 4a. For the first solvation shell (black) a value of 100% located at CN 4 indicates that Pd2+ is coordinated by four ligands and shows no exchange events along the simulation. Since, based on the conical selection, molecules were marked upon migration to/from the extended first shell along the simulation, the respective coordination number distribution (red) can be easily obtained. Probabilities of 64%, 18%, 14% were found for coordination numbers 2, 3, and 1 reflecting the rapid exchange dynamics of the extended first shell. This is in line with the broad peak observed in the Pd–N RDF, in which the extended first shell is barely visible and is merged with the peak of the second solvation shell (Fig. 1). A broad distribution ranging from 15 to 23 with a maximum at 19 observed for the second shell (green) also indicates a high rate of ligand exchange with the bulk.
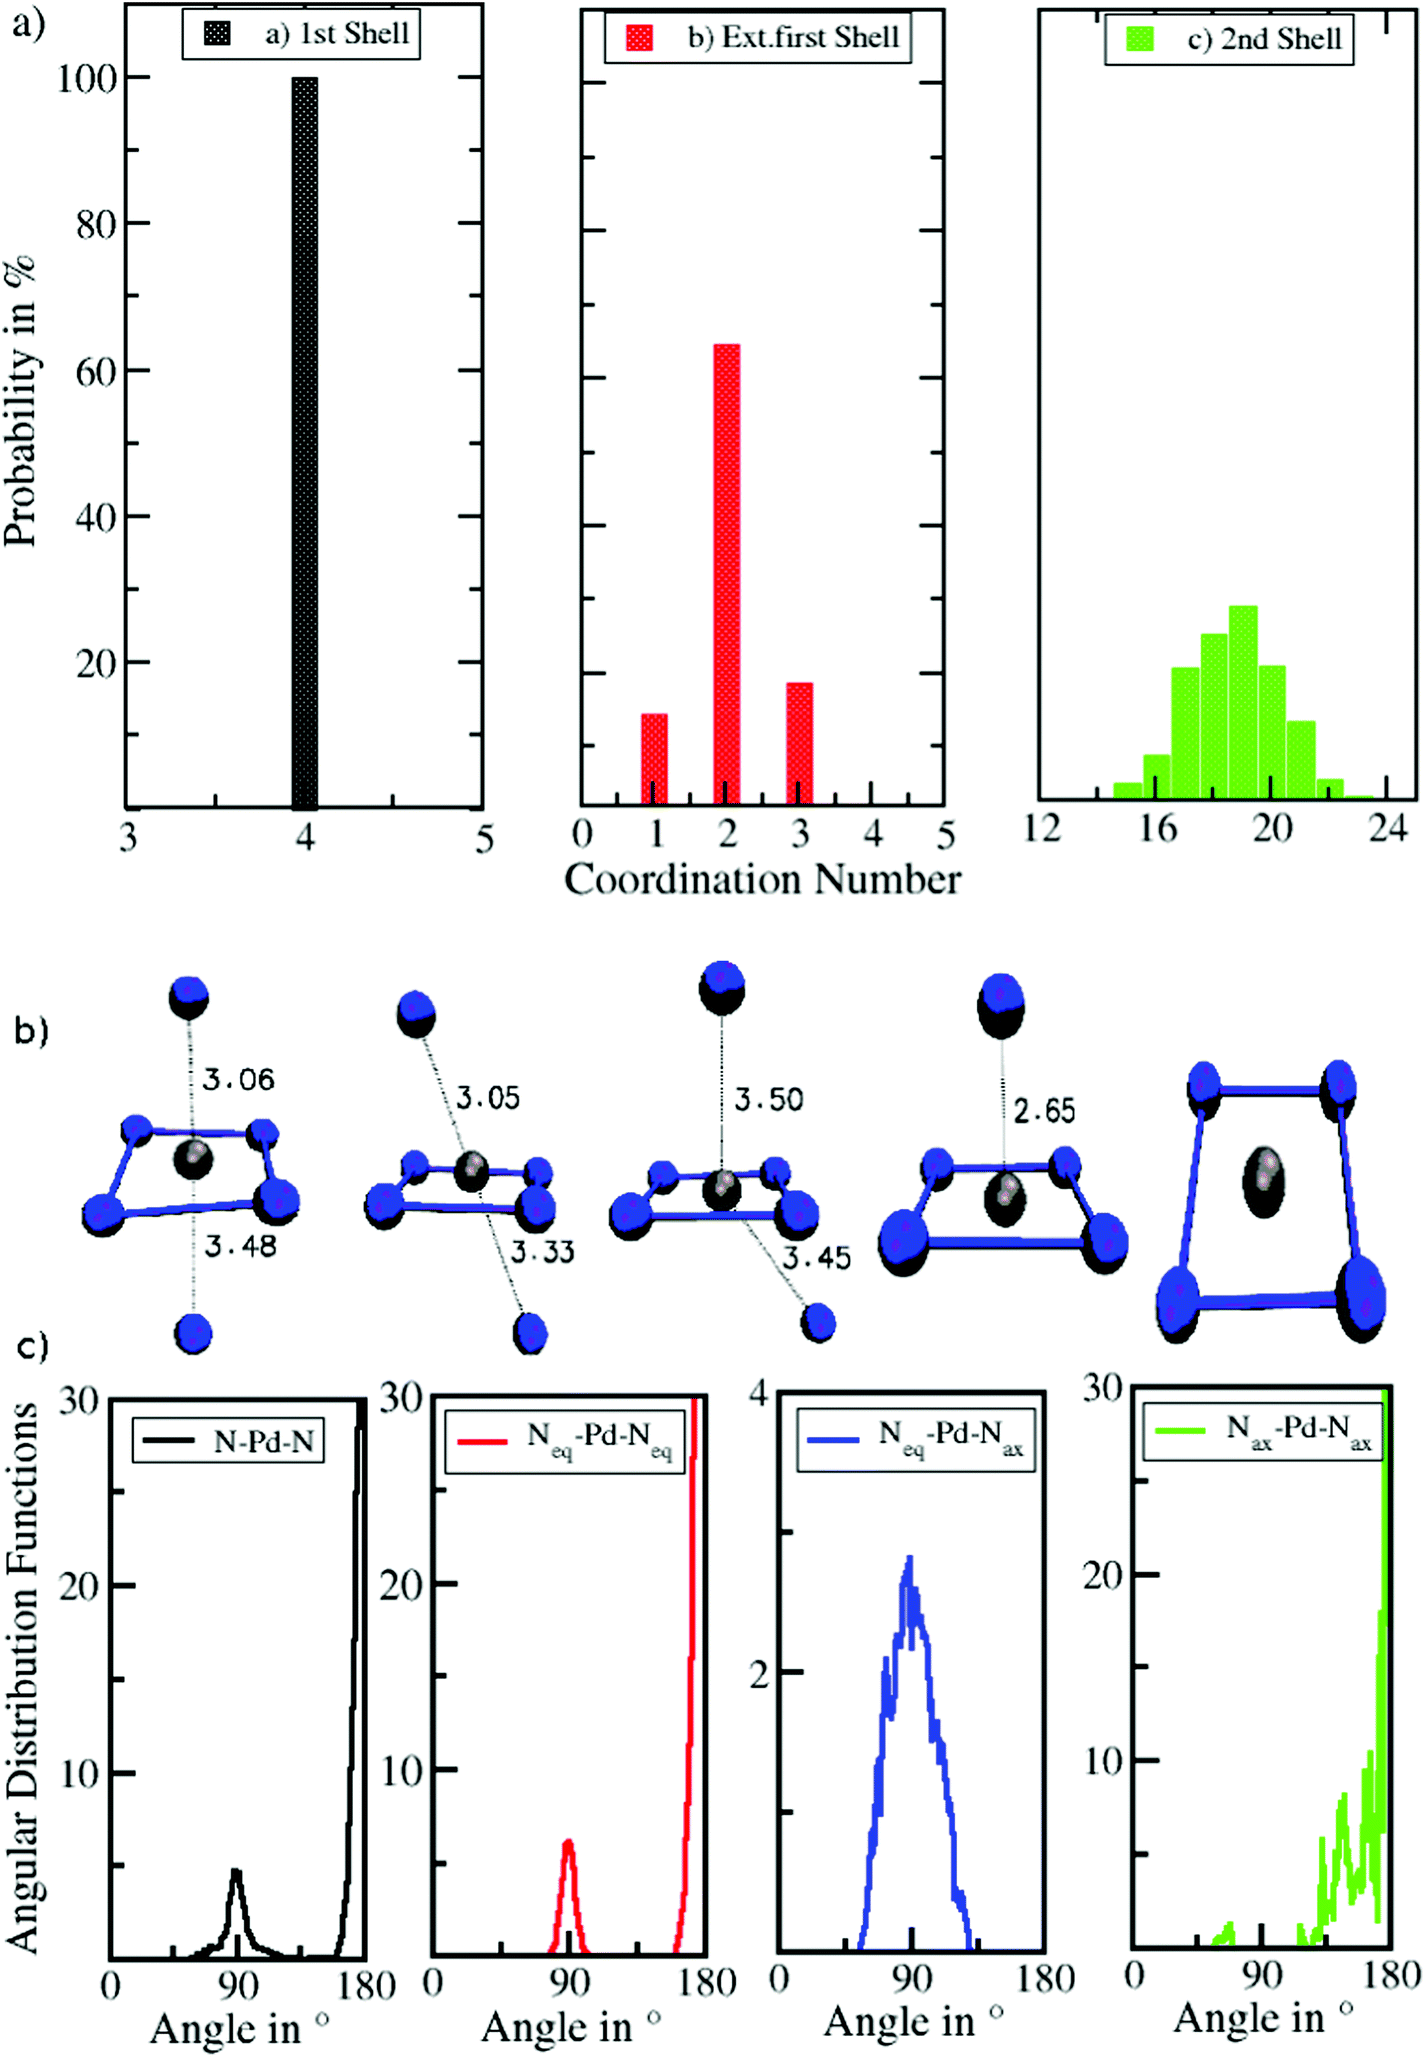 | ||
| Fig. 4 (a) Coordination number distributions (CNDs) of the first, extended first and second solvation shells of Pd2+ in liquid ammonia obtained from QMCF-MD simulation. (b) Different types of arrangements of Pd2+–NH3 in liquid ammonia. (c) Normalized angular distribution functions (ADFs) of different N–Pd–N angles in the first solvation shell. | ||
Fig. 4b and c depict a number of representative snapshots along the simulation and a set of normalized N–Pd–N angular distribution functions. The four different distributions have been obtained via selection of the ligands in the equatorial and axial positions. First, the ADF of all N–Pd–N triples within a radius of 3.53 Å is depicted considering both equatorial as well as axial ligands. Two peaks with maxima located at 88° and 175° occur corresponding to the octahedral coordination polyhedron. Two slight shoulders visible from 60° to 75° and from 105° to 125° indicate the angular motion of ligands in axial positions leading to the distorted octahedral form as depicted in the snapshots in Fig. 4b. Next, the ADF between ligands in the equatorial plane is shown (Neq–Pd–Neq, red). Two narrow peaks located at 90° and 180° result from the rigid square-planar sub-structure. In the third ADF, only triples between ligands in the equatorial plane and the axial position are considered (Neq–Pd–Nax, blue). As can be expected only one distribution near 90° is observed, showing a low intensity accompanied with a broadness in the range of 55° to 125° in line with the conical selection (see Fig. 2 and 3). No abrupt decay is visible at both sides of the peak, indicating that the conical selection is within an appropriate margin. The last ADF shows the normalized ADFs considering only axial ligands (Nax–Pd–Nax, green). Due to the low coordination number and the high mobility of the ligands in the extended first shell the distribution is subject to a large degree of noise, which is in stark contrast to the well-defined distributions of the Neq–Pd–Neq angles. The main peak being located between 115–180° results from the coordinated Nax–Pd–Nax triples, while the small peak in the range 55–70° stems from the simultaneous presence of exchanging ligands in the cone segment. The observed distributions clearly demonstrate the high degree of flexibility of ligands in the axial coordination sites as opposed to the rigidness of the square-planar sub-unit of the coordination structure.
To elucidate the rate of the ligand exchange between the second shell and the bulk, the mean residence time (MRT) was calculated via the direct method, which provides further insight about the reactivities of the ions.39 Since in the first solvation shell no ligand exchange was observed only a lower limit of ≥80 ps can be provided. For the extended first shell 44 successful exchanges of NH3 to/from the second solvation shell have been observed resulting in an MRT value of 0.95 ps. This result is lower than that for aqueous Pd2+ showing an MRT of 3.5 ps based on 8 successful exchange events.20 On the other hand, 162 successful exchanges of NH3 between the second solvation shell and the bulk have been observed resulting in a MRT of 2.5 ps, which is also lower than that for aqueous Pd2+ reported to be 4.6 ps.25 In addition, the associated Rex value measuring how many attempts are required to achieve one lasting change in the solvation shell has been evaluated via
 | (3) |
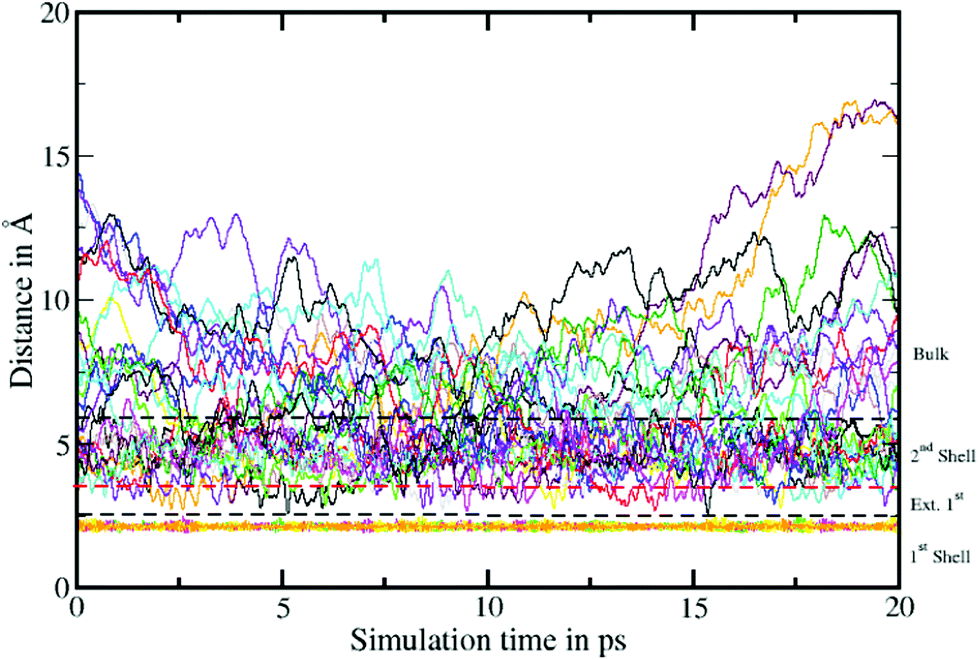 | ||
| Fig. 5 Time evolution of the Pd2+–N distance. The dashed lines represent the boundaries between the first, extended first and second solvation shells as well as the boundary between second solvation shell and the bulk. A large number of ligand exchanges between second solvation shell and the bulk was observed, whereas no ligand exchange occurs in the first solvation shell within the 20 ps of simulation. | ||
The vibrational frequency of the Pd2+–NH3 interactions in liquid ammonia is depicted in Fig. 6. Two peaks at 396 and 411 have been observed with corresponding force constants of 114 and 123 N m−1. These results confirm the weaker interaction of Pd2+ in liquid ammonia than in the aqueous case with a frequency of 398 cm−1 and a force constant of 139 N m−1.25 Investigation by Durig et al.66 on a number of cis and trans Pd2+ of the type Pd(NH3)2Cl2 reported the Pd2+–N stretching frequency in the range from 528 to 436 cm−1. This value compares well with the frequencies obtained for Pd2+ in liquid ammonia considering the different nature of the treated systems.
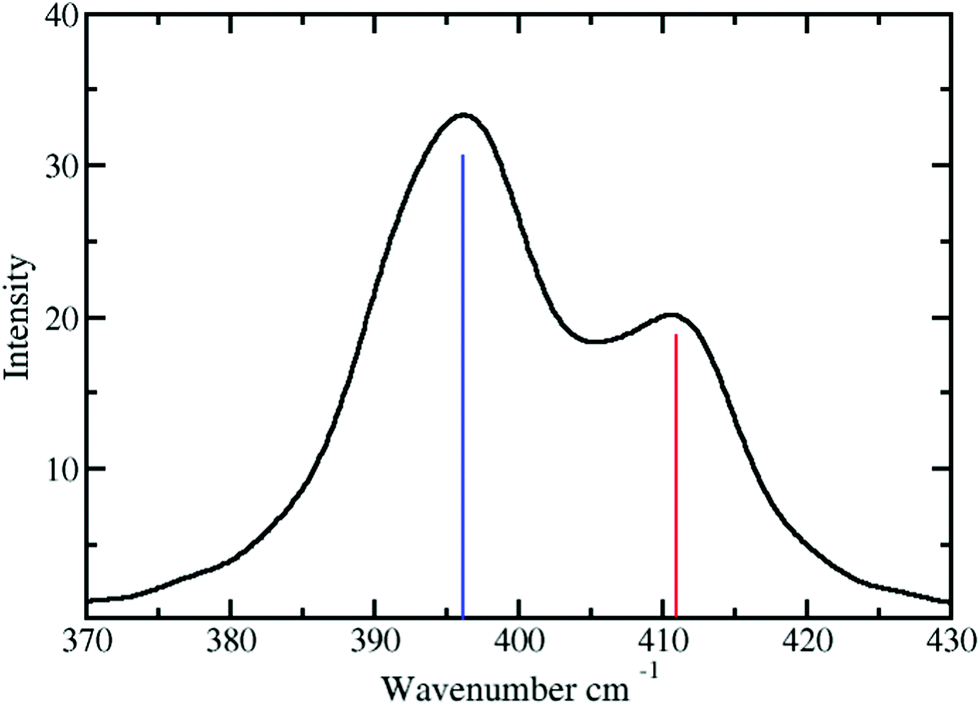 | ||
| Fig. 6 Power spectrum of Pd2+ in liquid ammonia obtained via velocity autocorrelation function (VACF) and subsequent Fourier transform (FT): the solid bar represents the vibrational frequencies of Pd2+–NH3. | ||
4 Conclusion
The QMCF MD simulation provided a detailed picture of the complex solvation structure of Pd2+ in liquid ammonia, which despite being a monoatomic solute, exhibits a spherically anisotropic interaction with the surrounding ligand molecules. The obtained results compare well with the experimental data available in the literature where available. In particular, the good agreement of the vibrational frequencies with those of similar compounds confirms that the chosen level of theory is of similar quality as in those of earlier studies of hydrated Pd2+ and the topologically similar Pt2+, thus enabling a detailed comparison of the different solvation complexes.Based on a combination of angular-radial density information a separation of the pair distribution into individual shells was feasible. A solvation pattern similar to that of the aqueous case showing a tetrahedrally elongated octahedron was observed with four ligands forming the well-known square-planar coordination motif at an average Pd–N distance of 2.12 Å plus another two ligands located at 3.40 Å in an axial position forming an extended first shell. Compared to the corresponding ion–O distance reported as 2.7 to 2.8 Å, the extended first shell is notably shifted towards the second solvation shell in the case of liquid ammonia, highlighting the substantially weaker interaction between Pd2+ and NH3. As a consequence the entire solvation structure is more labile than the Pd2+ aquo-complex leading to a decrease of the mean residence times of the ligands in the extended first and second shells to 0.95 and 2.5 ps. Based on the angular-radial density information an exchange path perpendicular to the molecular plane could be identified.
The presented data highlight the substantial differences in the interaction of Pd2+ with water and ammonia ligands, and thus act as an important reference for future investigations. In particular, since the characteristics of the ligands in the axial position are difficult to measure experimentally due to their weak interaction and exceptionally high exchange rate, theoretical methods prove to be an increasingly reliable alternative route to characterise the structure and dynamics of solvated compounds. The results also provide a valuable reference for an improved force field implementation aimed at the description of transition metal complexes in solution, such as for instance, that by Comba and coworkers.67
Acknowledgements
The authors thank Prof. Ingmar Persson for discussion and supporting data. Special thanks from author Muhammad Saleh to Su Yeung for a lot of help and support. Financial support from the PhD grant from the Austrian Agency for International Cooperation in Education and Research (OeAD-Gmbh) BMWFW within the framework of ASEA-UNINET for Muhammad Saleh is gratefully acknowledged. The computational results presented have been achieved (in part) using the HPC infrastructure LEO of the University of Innsbruck. This work was supported by the ASEAN-European Academic University Network (ASEA Uninet) funded by the Austrian Federal Ministry of Science, Research and Economy (BMWFW).References
- T. V. Choudhary, C. Sivadinarayana and D. Goodman, Catal. Lett., 2001, 72(3–4), 197–201 CrossRef CAS.
- M. Chandra and Q. Xu, J. Power Sources, 2006, 156(2), 190–194 CrossRef CAS.
- M. E. Bluhm, M. G. Bradley, R. Butterick, U. Kusari and L. G. Sneddon, J. Am. Chem. Soc., 2006, 128(24), 7748–7749 CrossRef CAS PubMed.
- R. J. Keaton, J. M. Blacquiere and R. T. Baker, J. Am. Chem. Soc., 2007, 129(7), 1844–1845 CrossRef CAS PubMed.
- J. P. Wolfe, J. Ahman, J. P. Sadighi, R. A. Singer and S. L. Buchwald, Tetrahedron Lett., 1997, 38(36), 6367–6370 CrossRef CAS.
- G. D. Vo and J. F. Hartwig, J. Am. Chem. Soc., 2009, 131(31), 11049–11061 CrossRef CAS PubMed.
- D. S. Surry and S. L. Buchwald, J. Am. Chem. Soc., 2007, 129(34), 10354–10355 CrossRef CAS PubMed.
- R. J. Dawson and G. H. Kelsall, J. Appl. Electrochem., 2007, 37(1), 3–14 CrossRef CAS.
- A. I. Gubanov, E. Y. Filatov, E. Y. Semitut, A. I. Smolentsev, P. V. Snytnikov, D. I. Potemkin and S. V. Korenev, Thermochim. Acta, 2013, 566, 100–104 CrossRef CAS.
- T. Grassl and N. Korber, Acta Crystallogr., Sect. E: Struct. Rep. Online, 2014, E70(7), i32 Search PubMed.
- A. A. Rybinskaya, E. A. Shusharina, P. E. Plyusnin, Y. V. Shubin, S. V. Korenev and S. A. Gromilov, J. Struct. Chem., 2011, 52(4), 816–819 CrossRef CAS.
- P. G. Alsabeh, R. J. Lundgren, R. McDonald, C. C. C. Johansson Seechurn, T. J. Colacot and M. Stradiotto, Chem. – Eur. J., 2013, 19(6), 2131–2141 CrossRef CAS PubMed.
- E. A. Shusharina, A. A. Rybinskaya, P. E. Plyusnin, Y. V. Shubin, S. V. Korenev and S. A. Gromilov, J. Struct. Chem., 2011, 52(3), 621–624 CrossRef CAS.
- L. Rasmussen and K. Jorgensen, Acta Chem. Scand., 1968, 22(7), 2313–2323 CrossRef CAS.
- B. Hellquist, L. A. Bengtsson, B. Holmberg, B. Hedman, I. Persson and L. Elding, Acta Chem. Scand., 1991, 45(5), 449–455 CrossRef CAS.
- F. H. Allen, S. Bellard, M. D. Brice, B. A. Cartwright, A. Doubleday, H. Higgs, T. Hummelink, B. G. Hummelink-Peters, O. Kennard, W. D. S. Motherwell, J. R. Rodgers and D. G. Watson, Acta Crystallogr., Sect. B: Struct. Crystallogr. Cryst. Chem., 1979, 35(10), 2331–2339 CrossRef.
- K. Wieghardt, H. J. Küppers, E. Raabe and C. Krüger, Angew. Chem., Int. Ed. Engl., 1986, 25(12), 1101–1103 CrossRef.
- A. J. Blake, R. O. Gould, A. J. Lavery and M. Schröder, Angew. Chem., Int. Ed. Engl., 1986, 25(3), 274–276 CrossRef.
- G. J. Grant, K. A. Sanders, W. N. Setzer and D. G. VanDerveer, Inorg. Chem., 1991, 30(21), 4053–4056 CrossRef CAS.
- T. S. Hofer, B. R. Randolf, S. A. A. Shah, B. M. Rode and I. Persson, Chem. Phys. Lett., 2007, 445(4), 193–197 CrossRef CAS.
- R. Caminiti, M. Carbone and C. Sadun, J. Mol. Liq., 1998, 75(2), 149–158 CrossRef CAS.
- N. Takeda, D. Shimizu and N. Tokitoh, Inorg. Chem., 2005, 44(23), 8561–8568 CrossRef CAS PubMed.
- J. M. Martínez, F. Torrico, R. R. Pappalardo and E. S. Marcos, J. Phys. Chem. B, 2004, 108(40), 15851–15855 CrossRef.
- E. C. Beret, J. M. Martínez, R. R. Pappalardo, E. S. Marcos, N. L. Doltsinis and D. Marx, J. Chem. Theory Comput., 2008, 4(12), 2108–2121 CrossRef CAS PubMed.
- S. A. A. Shah, T. S. Hofer, M. Q. Fatmi, B. R. Randolf and B. M. Rode, Chem. Phys. Lett., 2006, 426(4), 301–305 CrossRef CAS.
- J. Gao, Acc. Chem. Res., 1996, 29(6), 298–305 CrossRef CAS.
- D. Bakowies and W. Thiel, J. Phys. Chem., 1996, 100(25), 10580–10594 CrossRef CAS.
- B. M. Rode, C. F. Schwenk, T. S. Hofer and B. R. Randolf, Coord. Chem. Rev., 2005, 249(24), 2993–3006 CrossRef CAS.
- B. M. Rode, T. S. Hofer, B. R. Randolf, C. F. Schwenk, D. Xenides and V. Vchirawongkwin, Theor. Chem. Acc., 2006, 115(2–3), 77–85 CrossRef CAS.
- T. S. Hofer, B. M. Rode, A. B. Pribil and B. R. Randolf, Adv. Inorg. Chem., 2010, 62, 143–175 CrossRef CAS.
- T. S. Hofer, A. B. Pribil, B. R. Randolf and B. M. Rode, Adv. Quantum Chem., 2010, 59, 213–246 CrossRef CAS.
- A. K. H. Weiss and T. S. Hofer, RSC Adv., 2013, 3(6), 1606–1635 RSC.
- L. R. Canaval, A. K. H. Weiss and B. M. Rode, Comput. Theor. Chem., 2013, 1022, 94–102 CrossRef CAS.
- A. B. Pribil, T. S. Hofer, B. R. Randolf and B. M. Rode, J. Comput. Chem., 2008, 29(14), 2330–2334 CrossRef CAS PubMed.
- A. K. H. Weiss and T. S. Hofer, Mol. BioSyst., 2013, 9(7), 1864–1876 RSC.
- M. Hitzenberger, T. S. Hofer and A. K. H. Weiss, J. Chem. Phys., 2013, 139(11), 114306 CrossRef PubMed.
- P. P. Passler and B. M. Rode, Chem. Phys. Lett., 2015, 638, 128–132 CrossRef CAS.
- T. S. Hofer, Pure Appl. Chem., 2014, 86(2), 105–117 CrossRef CAS.
- T. S. Hofer, H. T. Tran, C. F. Schwenk and B. M. Rode, J. Comput. Chem., 2004, 25(2), 211–217 CrossRef CAS PubMed.
- T. S. Hofer, B. R. Randolf, B. M. Rode and I. Persson, Dalton Trans., 2009,(9), 1512–1515 RSC.
- D. J. Adams, E. M. Adams and G. J. Hills, Mol. Phys., 1979, 38(2), 387–400 CrossRef CAS.
- H. J. C. Berendsen, J. P. M. Postma, W. F. van Gunsteren, A. DiNola and J. R. Haak, J. Chem. Phys., 1984, 81(8), 3684–3690 CrossRef CAS.
- C. Lee, W. Yang and R. G. Parr, Phys. Rev. B: Condens. Matter, 1988, 37(2), 785 CrossRef CAS.
- J. P. Perdew, K. Burke and M. Ernzerhof, Phys. Rev. Lett., 1996, 77(18), 3865 CrossRef CAS PubMed.
- A. D. Becke, J. Chem. Phys., 1993, 98(7), 5648–5652 CrossRef CAS.
- P. J. Stephens, F. J. Devlin, C. F. Chabalowski and M. J. Frisch, J. Phys. Chem., 1994, 98(45), 11623–11627 CrossRef CAS.
- M. J. Frisch, G. W. Trucks, H. B. Schlegel, G. E. Scuseria, M. A. Robb, J. R. Cheeseman, G. Scalmani, V. Barone, B. Mennucci, G. A. Petersson, H. Nakatsuji, M. Caricato, X. Li, H. P. Hratchian, A. F. Izmaylov, J. Bloino, G. Zheng, J. L. Sonnenberg, M. Hada, M. Ehara, K. Toyota, R. Fukuda, J. Hasegawa, M. Ishida, T. Nakajima, Y. Honda, O. Kitao, H. Nakai, T. Vreven, J. A. Montgomery Jr., J. E. Peralta, F. Ogliaro, M. Bearpark, J. J. Heyd, E. Brothers, K. N. Kudin, V. N. Staroverov, R. Kobayashi, J. Normand, K. Raghavachari, A. Rendell, J. C. Burant, S. S. Iyengar, J. Tomasi, M. Cossi, N. Rega, J. M. Millam, M. Klene, J. E. Knox, J. B. Cross, V. Bakken, C. Adamo, J. Jaramillo, R. Gomperts, R. E. Stratmann, O. Yazyev, A. J. Austin, R. Cammi, C. Pomelli, J. W. Ochterski, R. L. Martin, K. Morokuma, V. G. Zakrzewski, G. A. Voth, P. Salvador, J. J. Dannenberg, S. Dapprich, A. D. Daniels, O. Farkas, J. B. Foresman, J. V. Ortiz, J. Cioslowski and D. J. Fox, Gaussian09 revision e.01, Gaussian Inc., Wallingford, CT, 2009 Search PubMed.
- T. S. Hofer, A. K. H. Weiss, B. R. Randolf and B. M. Rode, Chem. Phys. Lett., 2011, 512(4), 139–145 CrossRef CAS PubMed.
- L. R. Canaval and B. M. Rode, Chem. Phys. Lett., 2015, 618, 78–82 CrossRef CAS.
- T. S. Hofer, B. R. Randolf and B. M. Rode, J. Phys. Chem. B, 2008, 112(37), 11726–11733 CrossRef CAS PubMed.
- R. J. Frick, A. B. Pribil, T. S. Hofer, B. R. Randolf, A. Bhattacharjee and B. M. Rode, Inorg. Chem., 2009, 48(9), 3993–4002 CrossRef CAS PubMed.
- T. H. Dunning Jr., J. Chem. Phys., 1970, 53(7), 2823–2833 CrossRef.
- W. R. Wadt and P. J. Hay, J. Chem. Phys., 1985, 82(1), 284–298 CrossRef CAS.
- S. V. Hannongbua, T. Ishida, E. Spohr and K. Heinzinger, Z. Naturforsch., A: Phys. Sci., 1988, 43(6), 572–582 CrossRef CAS.
- M. Saleh and T. S. Hofer, Chem. Phys. Lett., 2016, 661, 274–278 CrossRef CAS.
- R. Armunanto, C. F. Schwenk and B. M. Rode, J. Am. Chem. Soc., 2004, 126(32), 9934–9935 CrossRef CAS PubMed.
- T. Kerdcharoen, K. R. Liedl and B. M. Rode, Chem. Phys., 1996, 211(1), 313–323 CrossRef CAS.
- N. Prasetyo, L. R. Canaval, K. Wijaya and R. Armunanto, Chem. Phys. Lett., 2015, 619, 158–162 CrossRef CAS.
- A. Tongraar, K. Sagarik and B. M. Rode, Phys. Chem. Chem. Phys., 2002, 4(4), 628–634 RSC.
- R. Armunanto, C. F. Schwenk, B. R. Randolf and B. M. Rode, Chem. Phys., 2004, 305(1), 135–140 CrossRef CAS.
- R. Armunanto, C. F. Schwenk, B. R. Randolf and B. M. Rode, Chem. Phys. Lett., 2004, 388(4), 395–399 CrossRef CAS.
- C. F. Schwenk and B. M. Rode, ChemPhysChem, 2004, 5(3), 342–348 CrossRef CAS PubMed.
- R. Ahlrichs, M. Bär, M. Häser, H. Horn and C. Kölmel, Chem. Phys. Lett., 1989, 162(3), 165–169 CrossRef CAS.
- S. Brode, H. Horn, M. Ehrig, D. Moldrup, J. E. Rice and R. Ahlrichs, J. Comput. Chem., 1993, 14(10), 1142–1148 CrossRef CAS.
- W. Humphrey, A. Dalke and K. Schulten, J. Mol. Graphics, 1996, 14(1), 33–38 CrossRef CAS PubMed.
- J. R. Durig, R. Layton, D. W. Sink and B. R. Mitchell, Spectrochim. Acta, 1965, 21(8), 1367–1378 CrossRef CAS.
- P. Comba, B. Martin and A. Sanyal, J. Comput. Chem., 2013, 34(18), 1598–1608 CrossRef CAS PubMed.
- V. Montoya, J. Pons, X. Solans, M. Font-bardia and J. Ros, Inorg. Chim. Acta, 2005, 358(7), 2312–2318 CrossRef CAS.
Footnote |
| † Electronic supplementary information (ESI) available. See DOI: 10.1039/C7DT01548H |
| This journal is © The Royal Society of Chemistry 2017 |