 Open Access Article
Creative Commons Attribution 3.0 Unported Licence
Primary photochemical processes for Pt(IV) diazido complexes prospective in photodynamic therapy of tumors†
Anton A.
Shushakov
ab,
Ivan P.
Pozdnyakov
ab,
Vjacheslav P.
Grivin
a,
Victor F.
Plyusnin
ab,
Danila B.
Vasilchenko
 cb,
Andrei V.
Zadesenets
cb,
Alexei A.
Melnikov
d,
Sergey V.
Chekalin
d and
Evgeni M.
Glebov
cb,
Andrei V.
Zadesenets
cb,
Alexei A.
Melnikov
d,
Sergey V.
Chekalin
d and
Evgeni M.
Glebov
 *ab
*ab
aVoevodsky Institute of Chemical Kinetics and Combustion, 3 Institutskaya Str., 630090, Novosibirsk, Russian Federation. E-mail: glebov@kinetics.nsc.ru; Fax: +7383 3307350; Tel: +7 383 3309150
bNovosibirsk State University, 2 Pirogova Str., 630090, Novosibirsk, Russian Federation
cNikolaev Institute of Inorganic Chemistry, 3 Lavrentiev Ave., 119333, 630090, Novosibirsk, Russian Federation. E-mail: vasilchenko@niic.nsc.ru
dInstitute of Spectroscopy, Russian Academy of Sciences, 5 Fizicheskaya Str., 119333, Troitsk, Moscow, Russian Federation. E-mail: melnikov@isan.troitsk.ru
First published on 3rd July 2017
Abstract
Diazide diamino complexes of Pt(IV) are considered as prospective prodrugs in oxygen-free photodynamic therapy (PDT). Primary photophysical and photochemical processes for cis,trans,cis-[Pt(N3)2(OH)2(NH3)2] and trans,trans,trans-[Pt(N3)2(OH)2(NH3)2] complexes were studied by means of stationary photolysis, nanosecond laser flash photolysis and ultrafast kinetic spectroscopy. The process of photolysis is multistage. The first stage is the photosubstitution of an azide ligand to a water molecule. This process was shown to be a chain reaction involving redox stages. Pt(IV) and Pt(III) intermediates responsible for the chain propagation were recorded using ultrafast kinetic spectroscopy and nanosecond laser flash photolysis. The mechanism of photosubstitution is proposed.
1. Introduction
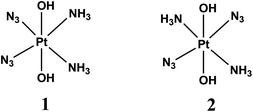
Photodynamic therapy (PDT) involves the selective damage of target tissue by using a photosensitizing drug and light. The scheme of PDT used in clinical practice is based on the formation of singlet oxygen resulted by quenching of triplet states of sensitizers (typically porphyrins) by dissolved oxygen.1,2 The requirement for oxygen is a major drawback as many malignant and most aggressive cancer cells are hypoxic.3 Photoactivated platinum compounds are free of this drawback. Pt(IV) complexes are considered to be prodrugs providing cytotoxic Pt(II) species.2,4–6The first generation of Pt(IV) prodrugs considered as prospective PDT agents were diiodide complexes.7,8 However, the specific feature of these compounds is their instability to thermal reduction by cell thiols, in particular, by glutathione.9 Therefore, the interests in looking for prospective Pt(IV) PDT agents were shifted to the more thermally stable diazide complexes.10–24 Several complexes were studied, the simplest of them were the diazide diamino complexes cis,trans,cis-[Pt(N3)2(OH)2(NH3)2] (1) and trans,trans,trans-[Pt(N3)2(OH)2(NH3)2] (2) (Scheme 1).
Both 1![[thin space (1/6-em)]](https://www.rsc.org/images/entities/char_2009.gif) 10 and 2
10 and 2![[thin space (1/6-em)]](https://www.rsc.org/images/entities/char_2009.gif) 11 are the subjects of reductive cross-linking with nucleotides under the action of light. The reaction can be induced both by UV and visible irradiation. The light-induced cytotoxicity of both complexes is comparable with the cytotoxicity of cisplatin in dark.11 The trans complex 2 is considered as more potent anticancer agent than the cis one,16 mainly because of the red shift of the absorption bands. Note that for complex 2 there is no limitation of trans complex anticancer activity which is characteristic for transplatin. The acting species linking to DNA in the cases of both 1
11 are the subjects of reductive cross-linking with nucleotides under the action of light. The reaction can be induced both by UV and visible irradiation. The light-induced cytotoxicity of both complexes is comparable with the cytotoxicity of cisplatin in dark.11 The trans complex 2 is considered as more potent anticancer agent than the cis one,16 mainly because of the red shift of the absorption bands. Note that for complex 2 there is no limitation of trans complex anticancer activity which is characteristic for transplatin. The acting species linking to DNA in the cases of both 1![[thin space (1/6-em)]](https://www.rsc.org/images/entities/char_2009.gif) 13 and 2
13 and 2![[thin space (1/6-em)]](https://www.rsc.org/images/entities/char_2009.gif) 18 photolysis is the diamino diaqua complex of Pt(II), as in the case of cisplatin. In spite of that, the mechanism of cancer cell damage by photoirradiated complex 1 and 2 is different from the case of cisplatin.12,24 This is probably due to the effect of active transients, such as N3˙ radicals and (or) Pt(IV) nitrenes.13,20
18 photolysis is the diamino diaqua complex of Pt(II), as in the case of cisplatin. In spite of that, the mechanism of cancer cell damage by photoirradiated complex 1 and 2 is different from the case of cisplatin.12,24 This is probably due to the effect of active transients, such as N3˙ radicals and (or) Pt(IV) nitrenes.13,20
Photolysis of 1 and 2 is the multistage process. In this work we are focused on the first stage. It was reported that the mechanism of photolysis is solvent-dependent. Two types of aqueous solutions were examined, namely, slightly acidic aqueous solutions (pH ∼5) and phosphate buffered saline (PBS), pH 7.4. Conclusions concerning the primary photochemical processes were made based on the changes of NMR spectra in the course of irradiation.13,14,18 The results are schematically presented in Scheme 2. In the case of 1 in PBS Phillips et al.14 found that the primary photochemical reaction caused by UVA irradiation is the exchange of the N3− anion to a water molecule or a hydroxide anion (product 1-1 inScheme 2A). In this case the irradiation time was probably small enough to examine the primary stage of photolysis.
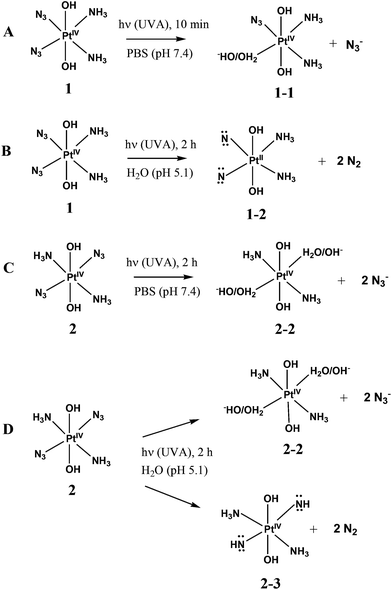 | ||
| Scheme 2 Primary stages of 1 and 2 photolysis according to literature. A – Complex 1 in PBS;14 B – complex 1 in acidic solution;13 C – complex 2 in PBS;18 D – complex 2 in acidic solution.18 | ||
UVA irradiation of 1 in slightly acidic solution was found to result in photoreduction of Pt(IV) to Pt(II) and N2 release.13 Absence of N3− in reaction products and results of trapping experiments allowed authors13 to conclude that photolysis occurs via the formation of nitrenes (which is represented by product 1-2 inScheme 2B). However, it should be noted that irradiation time in experiments13 was rather long (2 h). As a result of prolonged irradiation, azide anions could decay in secondary photochemical processes. In fact, there is no evidence that nitrene 1-2 is the primary product of photolysis.
Photolysis of 2 was reported to demonstrate the similar solvent effect as in the case of 1.18 Primary processes caused by UVA irradiation of 2 in PBS (Scheme 2C) were identified as the exchange of azide anions to water molecules (or hydroxide anions). The results of photolysis in acidic solutions were interpreted in ref. 18 as the parallel reactions of photoaquation and N2 release with the nitrene formation (Scheme 2D). Again, the irradiation time in experiments performed in ref. 18 was rather long, which did not allow one to be sure that the secondary photochemical processes were not involved.
In this paper we describe the case study of the first stage in photochemistry of diazide diamino complexes 1 and 2 by means of stationary photolysis, nanosecond laser flash photolysis and ultrafast kinetic spectroscopy. We present evidence that photolysis of both complexes is started with the chain photoaquation.
2. Experimental
cis,trans,cis-[Pt(N3)2(OH)2(NH3)2] (complex 1) and trans,trans,trans-[Pt(N3)2(OH)2(NH3)2] (complex 2) were synthesized as described in ref. 10 and 11 correspondingly. The solutions were prepared using deionized water. When necessary, the samples were deaerated by saturation with argon. All the experiments were performed at 295 K.pH value was controlled by ion-meter ANION-4100 (LTD Infraspak-Analit, Russia) with combined electrode ESK-10614. The initial pH of the samples was about 7.4; we did not use buffered solutions.
UV absorption spectra were recorded using Agilent 8453 spectrophotometer (Agilent Technologies).
Stationary photolysis was performed using the irradiation of a high-pressure mercury lamp with a set of glass filters for separating necessary wavelengths. In several experiments, excimer XeBr lamp (excilamp) was used as a quasicontinuous source of UV-irradiation at 282 nm (half width of light pulse, 5 nm; pulse duration, 1 μs; frequency, 200 kHz; incident light flux, 2.7 × 10¹⁶ photons per cm2 s).25 To measure the radiation intensity for the quantum yield calculations we used the IrCl62− complex in methanol solutions as a chemical actinometer (quantum yield of photoreduction in air-saturated solutions is 0.1 when initial concentration is less than 10−3 M (ref. 26)).
Nanosecond laser flash photolysis experiments were performed using excitation by radiation of 3rd (355 nm) and 4th (266 nm) harmonics of a YAG laser (Lotis TII, Belarus, 5 ns pulse duration, 10 mJ per pulse energy). Light power meter SOLO 2 (Gentec, Canada) was used to measure the laser pulse energy. The setup was described in detail in ref. 27.
We used pump–probe spectroscopy to study transient absorption of the samples in femto- and picosecond time domains. The experimental setup was described in detail elsewhere.28 The samples were excited by ∼60 fs pulses at ∼400 nm (second harmonic of a Ti:sapphire generator–amplifier system (Tsunami – Spitfire Pro, Spectra Physics)) and by ∼100 fs pulses at ∼320 nm (fourth harmonic of the signal wave of the TOPAS parametric amplifier). The excitation energy in both cases was about 1 μJ per pulse, the pulse repetition rate was 1 kHz. 200 pulses were used to record a single time-resolved spectrum. In order to decrease the magnitude of the so-called “coherent artifact” signal29 we set the angle between electric field vectors of the pump and probe beams at 54.7° (“magic angle”). To do that we rotated the polarization of the pump beam using Berek's variable wave plate. Each kinetic curve contained 110 points (60 points with a 100 fs step, 20 points with a 500 fs step, and 30 points with a 3 ps step). The investigated solutions (total volume of 20 ml) were pumped through a 1 mm thick quartz cell at room temperature to provide uniform irradiation and to avoid possible degradation due to photochemical reactions.
ExciPro program (CDP System Corporation) was used for corrections of the group velocity dispersion. The corrected experimental data were further globally fitted (typically using a three-exponential model).
3. Results and discussion
3.1. UV spectra and photochemistry of complexes 1 and 2
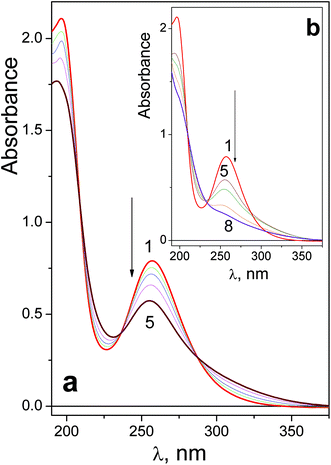
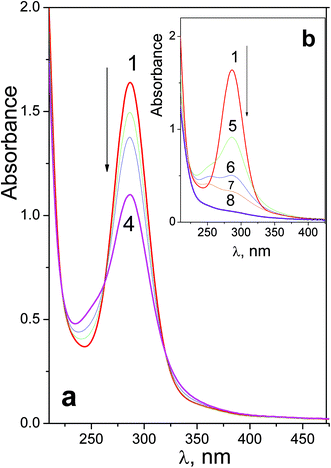
UV spectra of complexes 1 and 2 are shown in Fig. 1a and 2a (curve 1) correspondingly. Absorption in the near UV region observed in the spectra of azide complexes of Pt(IV) was assigned as the N3 → Pt CT band.30,31. Comparing the spectra of 1 and 2, one can see that the N3 → Pt band of trans-complex is red-shifted (λmax = 257 and 286 nm) and more intense (εmax = 13![[thin space (1/6-em)]](https://www.rsc.org/images/entities/char_2009.gif) 200 and 19
200 and 19![[thin space (1/6-em)]](https://www.rsc.org/images/entities/char_2009.gif) 500 M−1 cm−1 correspondingly).
500 M−1 cm−1 correspondingly).
The spectral parameters for 1 and 2 are coincident with the values reported in literature.2,11 Note that the increase in temperature results in the blue shift of the N3− → PtIV LMCT band maximum, which is evident from comparison of spectra of 2 obtained in this work at 295 K and in work of ref. 19 at 310 K (authors11 did not specify the temperature; according to the origin of the spectrum it was about 295 K).
Although the major absorption of 1 and 2 is in the UV region, both complexes exhibit tails which extend out to the visible region. E.g., molar absorption coefficients at 458 nm are 50 and 280 M−1 cm−1 for 1![[thin space (1/6-em)]](https://www.rsc.org/images/entities/char_2009.gif) 2 and 2 (this work) correspondingly. Tails are evidently caused by the LF transitions. LF bands are photoactive; visible light-induced reductive photochemistry was reported both for 1
2 and 2 (this work) correspondingly. Tails are evidently caused by the LF transitions. LF bands are photoactive; visible light-induced reductive photochemistry was reported both for 1![[thin space (1/6-em)]](https://www.rsc.org/images/entities/char_2009.gif) 10 and 2.16 As a result, the use of these compounds in visible light-induced PDT is possible. It is essential that to excite the intense UV bands is experimentally more convenient than to excite weak LF bands. That is why in the mechanistic studies performed in this work we used the irradiation into the N3− → PtIV LMCT band.
10 and 2.16 As a result, the use of these compounds in visible light-induced PDT is possible. It is essential that to excite the intense UV bands is experimentally more convenient than to excite weak LF bands. That is why in the mechanistic studies performed in this work we used the irradiation into the N3− → PtIV LMCT band.
Spectral changes caused by the UV irradiation of 1 are shown in Fig. 1. On the first stage of photolysis (Fig. 1a) three isosbestic points at 209, 237 and 287 nm are conserved. According to ref. 14 the primary photoreaction is the exchange of an azide anion to a water molecule or OH−. It was found that no changes in pH occur at this stage. Therefore, N3− is exchanged to a water molecule (forming product 1-1 ineqn (1)) but not to a hydroxide anion.
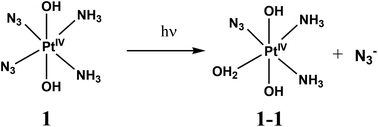 | (1) |
Changes in the UV spectrum caused by prolonged irradiation of 1 are shown in Fig. 1b. No conservation of isosbestic points is observed. According to literature,13,14 several Pt(IV) and Pt(II) products are formed. Further irradiation results in precipitation; the precipitates may arise from multi-nuclear oxygen-bridged platinum complexes.11
First stage of photolysis of complex 2 (Fig. 2a) is similar to the case of 1. Three isosbestic points at 222, 262 and 320 nm are conserved. According to ref. 18 the primary photoreaction is the exchange of an azide anion to a water molecule or OH−. No sufficient changes in pH were detected. Therefore, the first stage of photolysis is photoexchange with the formation of product 1-2 described by eqn (2).
 | (2) |
Deep photolysis (Fig. 2b) is characterized by the absence of isosbestic points. Complete disappearance of absorption in the near UV region (curve 8 in Fig. 2a) corresponds to complete photoreduction of Pt(IV) to Pt(II).
To estimate the quantum yields of the first stage of photolysis one needs to know molar absorption coefficients of products 1-1 and 2-1. In this work we can present brief estimations of these values. From the origin of the spectral changes in the course of photolysis (Fig. 1 and 2) it could be estimated that the molar absorption coefficients of the primary products 1-1 and 2-1 at the wavelengths of the near UV bands maxima of the initial complexes (measured in M−1 cm−1) fall within the ranges 4500 < ε1-1257 nm < 9500 and 6000 < ε2-1286 nm < 11![[thin space (1/6-em)]](https://www.rsc.org/images/entities/char_2009.gif) 000 correspondingly. Taking values in the middle of these ranges we determined that the quantum yields of reactions (1) and (2) corresponding to 282 nm irradiation were φ1282 nm = 0.16 ± 0.07 for complex 1 (initial concentration 6.0 × 10⁻⁵ M) and φ2282 nm = 0.20 ± 0.05 for complex 2 (initial concentration 8.4 × 10⁻⁵ M). Both values rely to photon flux density equal to 8 × 10¹⁵ photons per cm3 s (or 1.3 × 10⁻⁵ moles of photons per s).
000 correspondingly. Taking values in the middle of these ranges we determined that the quantum yields of reactions (1) and (2) corresponding to 282 nm irradiation were φ1282 nm = 0.16 ± 0.07 for complex 1 (initial concentration 6.0 × 10⁻⁵ M) and φ2282 nm = 0.20 ± 0.05 for complex 2 (initial concentration 8.4 × 10⁻⁵ M). Both values rely to photon flux density equal to 8 × 10¹⁵ photons per cm3 s (or 1.3 × 10⁻⁵ moles of photons per s).
The reason to specify the initial concentration and photon flux density when presenting quantum yields comes from the experiments with varied concentrations of complexes. The concentration dependencies of quantum yields for complexes 1 and 2 are presented in Fig. 3. The linear dependence of the quantum yield on the concentration of the initial reagent indicates the chain character of the process. In the case of quadratic chain termination the dependence of the quantum yield for excitation at the wavelength λ (φλ) vs. concentration of the initial reagents (c) could be described by the equation:32
 | (3) |
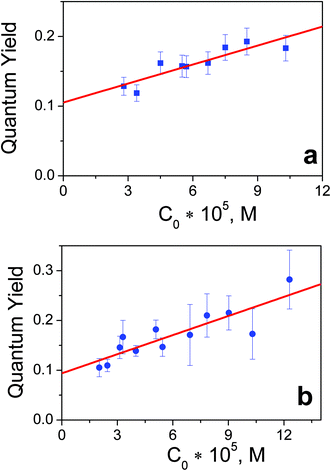 | ||
| Fig. 3 Dependencies of quantum yields of 1 (panel a) and 2 (panel b) photoaquation (λpump = 282 nm, photon flux density 8 × 10¹⁵ photons per cm3 s) vs. concentration of initial complexes. | ||
Chain character of photoaquation reactions (1) and (2) testifies that photochemical reactions involve redox stages with the participation of Pt(III) intermediates. A kinetic analogue could be found in the photochemistry of the PtCl62− complex in water33–35 and acetonitrile.36 For mechanistic study of chain reactions nanosecond laser flash photolysis was applied.
3.2. Nanosecond laser flash photolysis of 1 and 2
Results of laser flash photolysis experiments with complex 1 are demonstrated in Fig. 4. Typical kinetic curves and intermediate absorption spectra are shown in Fig. 4a and b correspondingly. Immediately after the laser pulse the intermediate absorption band with the maximum at 400 nm is formed (curve 1 in Fig. 4b). The amplitude of this absorption is linear vs. laser pulse energy; therefore the intermediate occurs in a one-quantum process. No effect of dissolved oxygen on the intermediate absorption behavior was found. We attribute this band to the intermediate of Pt(III) further marked as Int 1-1. The similar band with maximum in the region of 400 nm was recorded in the course of laser flash photolysis of the PtCl62− complex in aqueous33 and acetonitrile36 solutions.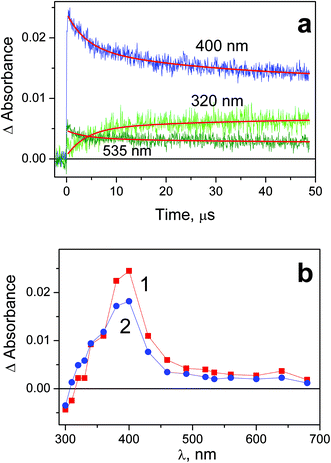 | ||
| Fig. 4 Results of laser flash photolysis (266 nm) experiment with complex 1 in water (pH 7.4; initial concentration 5.8 × 10⁻⁵ M; 1 cm cell; air saturated solutions). a – Characteristic kinetic curves and fits (red lines). Global fit function (4) with parameters: τ1 = 3.9 μs, τ2 = 32 μs. b – Intermediate absorption spectra; curves 1 and 2 correspond to time delays 0.4 and 10 μs after the laser pulse. | ||
In several microseconds the initial intermediate absorption band is transformed into another band with the maximum at 400 nm (curve 2 in Fig. 4b) attributed to another intermediate further marked as Int 1-2. In spite of coincidence of the bands maxima, Int1-1 and Int 1-2 are different species. This is evident from the conservation of the isosbestic point in the region of 340 nm (Fig. 4b). Kinetic curves in the region of 320 and 535 nm (Fig. 4a) demonstrate opposite kinetic behavior in the time range of several microseconds. The corresponding kinetic curves were fitted by two-exponential functions eqn (4) (red lines in Fig. 4b). The characteristic time of Int 1-1 → Int 1-2 transition was determined as τ1 = (3.9 ± 0.7) μs. The decay of Int 1-2 is evident from the kinetic curves at the wavelengths close to the band maximum (see curve corresponding to 400 nm in Fig. 4a). The biexponential fit of kinetic curves in this region resulted in characteristic time of ca. 4 and 32 μs. The first time again corresponds to Int 1-1 → Int 1-2 transition, and the second time τ2 = (32 ± 7) μs corresponds to decay of Int 1-2.
 | (4) |
Photochemical properties of complex 2 and 1 are similar. The two intermediates marked as Int2-1 and Int 2-2 were recorded in the course of laser flash photolysis of 2 (Fig. 5). Again, the amplitude of the intermediate absorption was linear vs. laser pulse energy, and no effect of dissolved oxygen on the intermediate absorption behavior was observed. Opposite to the case of complex 1, no conservation of isosbestic points was observed in the intermediate absorption spectrum (Fig. 5b). In spite of that, conclusion on the existence of the two successive Pt(III) intermediates with the similar absorption spectra was made from the analysis of the kinetic curves (Fig. 5a). Initial intermediate Int 2-1 (curve 1 in Fig. 5b) is transformed to the second intermediate Int 2-2 with the characteristic time τ1 = (2.3 ± 0.3) μs. The decay Int 2-2 is evident from the kinetic curves at the wavelengths close to the band maximum (see curve corresponding to 400 nm in Fig. 5a). The decay time of Int 2-2 (extracted from the biexponential fit of the kinetic curves (4)) is τ2 = (13 ± 2) μs.
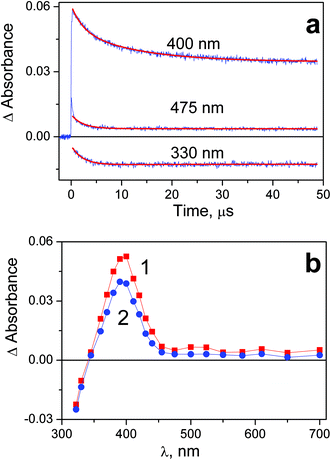 | ||
| Fig. 5 Results of laser flash photolysis (266 nm) experiment with complex 2 in water (pH 7.4; initial concentration 5.3 × 10⁻⁵ M; 1 cm cell; air saturated solutions). a – Characteristic kinetic curves and fits (red lines). Global fit function (4) with parameters: τ1 = 2.3 μs, τ2 = 11 μs. b – Intermediate absorption spectra; curves 1 and 2 correspond to time delays 0.4 and 10 μs after the laser pulse. | ||
Therefore, we can conclude that both for 1 and 2 two successive Pt(III) intermediates are observed. The first intermediates (Int1-1 and Int 2-1) are formed with the characteristic time less that the resolution of the experimental setup (50 ns). The second intermediates (Int 1-2 and Int 2-2) are formed with the characteristic time of several microseconds and decay in time interval of several tens of microseconds. The kinetic law of the second intermediates decay is rather complicated; this is out of the scope of the current study. We believe that the second intermediates are the chain carriers in the mechanisms of chain photoaquation of complexes 1 and 2.
Photochemistry of Pt(IV) azide complexes was studied by Vogler et al.30,37 Based on these works, one could expect that a Pt(III) intermediate is formed as a result of a light-induced electron transfer from an azide anion to the Pt(IV) cation. In this case an azide radical should release. Sadler and co-workers38 have detected by spin-labeling and trapping experiments the presence of azidyl radicals formed upon photolysis of a related diazido-Pt(IV) complex trans,trans,trans-[Pt(N3)2(OH)2(py)2].
The ˙N3 radical exhibits moderate absorption only in the UV range with a sharp maximum at 274 nm, maximal molar absorption coefficient 2025 M−1 cm−1, and the width of spectral band is about 20 nm at half-maximum height.39,40 Therefore, it is a big problem to record its spectrum, especially in a case like ours, when absorption of the radical is masked by absorption of the initial compound.
In this work the UV spectrum of ˙N3 was not recorded because of the experimental difficulties. In spite of that, based on works of Vogler et al.30,37 and Sadler et al.38 we may consider its formation as highly probable. Because of strong oxidative properties of ˙N3![[thin space (1/6-em)]](https://www.rsc.org/images/entities/char_2009.gif) 40 it should be included into the scheme of possible reactions caused by laser irradiation of complexes 1 and 2.
40 it should be included into the scheme of possible reactions caused by laser irradiation of complexes 1 and 2.
Laser flash photolysis experiments were performed both in neutral (Fig. 4 and 5) and slightly acidic (pH 4.5–5) solutions (Fig. S1 and S2 of ESI†). No difference was observed in the framework of the experimental accuracy. It supports our suggestion that the formation of molecular nitrogen (Scheme 2) is presumably the result of prolonged irradiation but not of the primary photochemical processes.
3.3. Possible mechanism of chain photoaquation
Based on the experiments described in items 3.1 and 3.2, we believe that the photoaquation of complexes 1 and 2 is the chain process occurring via the redox reactions. Tentative reaction mechanism is presented by eqn (5)–(11) (because the reactions proposed for complexes 1 and 2 are similar, we do not specify whether the azide anions are in cis- or trans-positions):| PtIII + PtIII → PtIV + PtII | (8) |
| PtIII + N3˙ → PtIV + N3− | (9) |
| PtIV + N3˙ → PtV + N3− | (10) |
| PtIII + PtV → PtIV + PtIV | (11) |
The chain mechanism of photoaquation (5)–(11) is consistent with the concentration dependence of quantum yields obtained in the stationary experiments and with the observation of two successive Pt(III) intermediates (Int1-1, Int1-2 for the case of 1 and Int2-1, Int2-2 for the case of 2) in the laser flash photolysis experiments. Identification of successive intermediates as [PtIII(NH3)2(N3)(OH)2] and [PtIII(NH3)(OH)2]+ complexes requires explanation of similarity in their UV spectra (curves 1 and 2 in Fig. 4b and 5b). It could be possible if the absorption at 400 nm is defined by LMCT transition from the NH3 ligand to Pt(III) cation. If the N3− ligand in the [PtIII(NH3)2(N3)(OH)2] complex is weakly bound to the central cation, its elimination would not much affect the absorption spectrum. As an example, the square-pyramid structure with N3− as the axial ligand could be proposed.
Details of the proposed mechanism (including direct observation of azide radicals) are the subjects of further study.
3.4. Ultrafast kinetic spectroscopy of 1 and 2
Experiments on the ultrafast kinetic spectroscopy for complex 2 were performed with excitation at 320 and 400 nm. The 320 nm excitation falls into the long-wavelength tail of the N3− → PtIV LMCT band (Fig. 2), The 400 nm excitation corresponds to weak (ε = 440 M−1 cm−1) absorption, which is probably caused by the d–d transitions of PtIV. Complex 1 was excited at 320 nm to the N3− → PtIV LMCT band. In this case the 400 nm irradiation was not used because the absorption of 1 at this wavelength is too weak.The time-dependent intermediate absorption spectra were recorded in the range 440–780 nm. Time profiles of the intermediate absorption are shown in Fig. S3–S5 of ESI.† The kinetic curves for different complexes and different excitation wavelengths are shown in Fig. 6a, 7a and 8a. As it was mentioned in the Experimental section, kinetic curves were affected with the coherent solvent artifact.29 For the case of 320 nm excitation the coherent artifact was efficiently decreased (see Experimental); the kinetic curves were corrected for its residuals by subtracting the second derivative of Gaussian function. For the case of the 400 nm excitation the coherent artifact, in spite of the use of magic angle geometry, remained rather large (see Fig. S5 of ESI†). Therefore, for this case the points corresponding to the time delays falling into the range (−500 fs) < τ > (550 fs) were omitted (Fig. 8a).
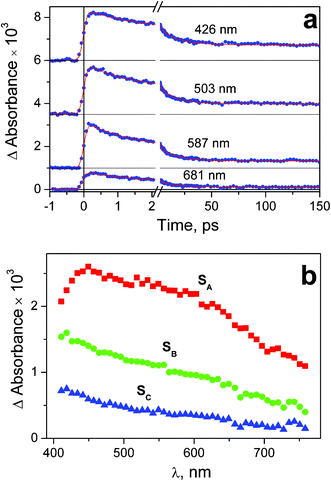 | ||
| Fig. 6 Results of ultrafast kinetic spectroscopy experiment (λpump = 320 nm) with complex 1 in water (pH 7.4; initial concentration 2.5 × 10⁻³ M; 1 mm cell). a – Experimental kinetic curves (dots) and results of global fit calculation using two-exponential function 12 (solid lines); b – the SADS obtained from global fit calculations and formulae (13)–(15). | ||
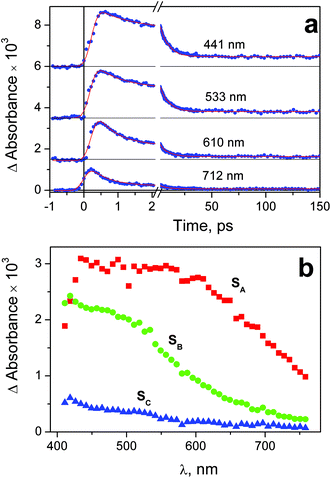 | ||
| Fig. 7 Results of ultrafast kinetic spectroscopy experiments (λpump = 320 nm) with complex 2 in water (pH 7.4; initial concentration 1.2 × 10⁻³ M; 1 mm cell). a – Experimental kinetic curves (dots) and results of global fit calculation using two-exponential function 12 (solid lines); b – the SADS obtained from global fit calculations and formulae (13)–(15). | ||
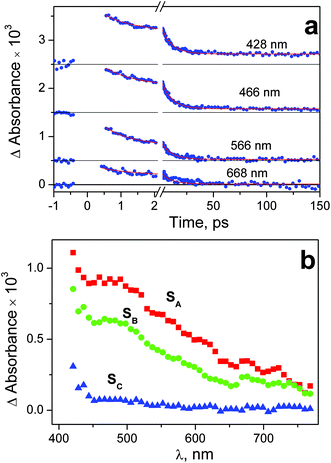 | ||
| Fig. 8 Results of ultrafast kinetic spectroscopy experiments (λpump = 400 nm) with complex 2 in water (pH 7.4; initial concentration 2.75 × 10⁻³ M; 1 mm cell). a – Experimental kinetic curves (dots) and results of global fit calculation using two-exponential function 12 (solid lines). The points from the time interval – 0.42 ps < t < 0.6 ps are omitted because of the coherent artifact; b – the SADS obtained from global fit calculations and formulae (13)–(15). | ||
The kinetic curves obtained in the experiments on the ultrafast pump–probe spectroscopy with the 320 nm excitation were globally fitted using a two-exponential function with the residual absorption (12).
 | (12) |
Fitting curves are shown in Fig. 6a, 7a and 8a as red lines. The extracted characteristic lifetimes are collected in Table 1. The increase in number of exponential functions used for fit from two to three did not result in better fitting quality (see Fig. S6–S8 of ESI†).
| Complex | λ ex, nm | τ 1, ps | Process | τ 2, ps | Process | τ 3, ns | Process |
|---|---|---|---|---|---|---|---|
| 1 | 320 | 1.4 ± 0.3 | FC → LE | 17 ± 3 | LE → RC | 0.1–10 | RC → GS + P |
| 2 | 320 | 0.5 ± 0.1 | 7.4 ± 0.9 | ||||
| 400 | 0.7 ± 0.2 | 9.8 ± 1.5 |
When the kinetic curves are fitted using function (12), the sequential decay of the transient absorption A → B → C is proposed. Here C can include both the ground state of the initial complexes and photolysis products. The species associated difference spectra (SADS) of the individual components were calculated by means of the formulae (13)–(15).42 If the characteristic lifetimes are sufficiently different, the SADS could be presented as sums of corresponding amplitudes Ai(λ).
| SA(λ) = A1(λ) + A2(λ) + A3(λ) | (13) |
 | (14) |
| SC(λ) = A3(λ) | (15) |
The SADS for the studied complexes are shown in Fig. 6b, 7b and 8b.
Immediately after excitation of complex 1 at 320 nm the transient absorption spectrum appears as a wide band with the flat maximum in the region 450–600 nm (SADS SA in Fig. 6b). The similar absorption occurs in the case of complex 2 (SADS SA in Fig. 7b). The initial absorption bands are transformed into other bands with the maxima in the region of 420 nm (SADS SB in Fig. 6b and 7b) with the characteristic lifetimes 0.5–1.4 ps. The second intermediates decay with the characteristic lifetimes 7–17 ps. The disappearance is not complete, but the spectra of the residual absorption (SADS SC in Fig. 6b and 7b) do not differ much of the SADS SB.
In the case of excitation of complex 2 at 400 nm the origin of intermediate absorption is similar to the case of the 320 nm excitation. Nevertheless, the large value of the coherent artifact (see Fig. S8 of ESI†) did not allow us to determine the SADS of the initial intermediate SA correctly. In fact, the SADS SA in Fig. 8b is the superposition of the spectra of first and second intermediates. Correspondingly, the value of its lifetime (0.7 ps, see Table 1) should be considered as estimation.
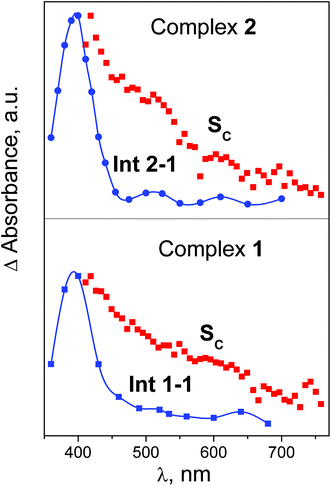
The final SADS SC obtained in experiments on ultrafast kinetic spectroscopy could be compared with the spectra of initial intermediates Int 1-1 and Int 2-1 recorded in the experiments on nanosecond laser flash photolysis. This comparison is presented in Fig. 9. SADS SC refer to the 320 nm excitation, while spectra of Int 1-1 and Int 2-1 refer to the 266 nm excitation. For both complexes excitation wavelengths 266 and 320 nm fall within the same absorption bands (Fig. 1 and 2), therefore one can expect no difference in corresponding photochemical processes. The spectra of SADS SC are clearly different of the spectra of Int 1-1 and Int 2-1 (Fig. 9). It means that the species C in the sequence A![[thin space (1/6-em)]](https://www.rsc.org/images/entities/char_2009.gif) →
→![[thin space (1/6-em)]](https://www.rsc.org/images/entities/char_2009.gif) B
B![[thin space (1/6-em)]](https://www.rsc.org/images/entities/char_2009.gif) →
→![[thin space (1/6-em)]](https://www.rsc.org/images/entities/char_2009.gif) C used for analysis of ultrafast kinetic data do not coincide with the initial intermediates Int 1-1 and Int 2-1 observed in the nanosecond time domain. Therefore, additional reactions C → Int 1-1 and C → Int 2-1 are necessary to fit the results of ultrafast and nanosecond experiments. The characteristic times of these reactions fall within the time interval 0.1–10 ns. These lifetimes were not extracted from analysis of the data on ultrafast kinetic spectroscopy because signal-to-noise ratio was not enough to make a choice between biexponential and three-exponential models (see Fig. S6–S8 of ESI†). In spite of that, we add this reaction to the mechanism of primary processes (Table 1).
C used for analysis of ultrafast kinetic data do not coincide with the initial intermediates Int 1-1 and Int 2-1 observed in the nanosecond time domain. Therefore, additional reactions C → Int 1-1 and C → Int 2-1 are necessary to fit the results of ultrafast and nanosecond experiments. The characteristic times of these reactions fall within the time interval 0.1–10 ns. These lifetimes were not extracted from analysis of the data on ultrafast kinetic spectroscopy because signal-to-noise ratio was not enough to make a choice between biexponential and three-exponential models (see Fig. S6–S8 of ESI†). In spite of that, we add this reaction to the mechanism of primary processes (Table 1).
Our interpretation of the ultrafast spectroscopy data is as follows (Table 1 and Fig. 10). The initial SADS SA corresponds to the spectrum of the Franc-Condon (FC) state. The first observed process with the characteristic time of 0.5–1.5 ps corresponds to the transition of FC to the lowest electronic excited state (LE). This process is probably accompanied by vibrational cooling and solvent relaxation having characteristic lifetimes comparable with the characteristic time of electronic transition. The different processes (e.g., intersystem crossing and vibrational relaxation) could have similar characteristic times and manifest itself as a single, convoluted process.43 The multiplicities of the ground state (GS) and the LE state are most likely different (the electronic configuration of Pt4+ is 5d6. If the geometry of the GS is not very different of octahedral, it should be singlet, while the LE should be triplet). In this case, the lifetime of LE could be 10–20 ps, which is observed in the experiment.
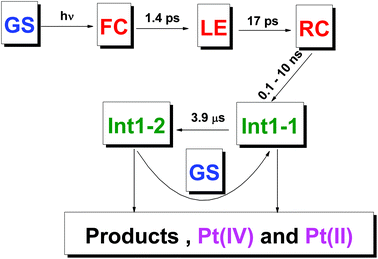 | ||
| Fig. 10 Proposed scheme of primary photophysical and photochemical processes for complex 1. GS – Ground state of the initial complex; FC – Franck Condon state; LE – lowest excited electronic state, RC – radical complex. Colors: blue – initial complex, magenta – stable products, red – intermediates observed in ultrafast kinetic spectroscopy experiments, olive – intermediates observed in laser flash photolysis experiments. Structure of intermediates is shown in Table 2. | ||
As it was discussed earlier, the LE state could not transit directly to the reaction product. We assume that the result of its transformation is the radical complex (further – RC) [PtIII(NH3)2(N3)(OH)2⋯N3˙], which is in fact the ion-radical pair of Pt(III) complex and N3˙ radical situated in the solvent cage. The weakly-bound RC were experimentally observed as intermediates in photochemistry of Cu(II),44 Pt(IV),45 Ir(IV),46 Fe(III).47 Its lifetime in common solvents at room temperature can reach 1 ms.47 Escape of an azide radical from RC into the solution bulk results in formation of intermediates Int 1-1 and Int 2-1 (Table 1 and Fig. 9).
The scheme of processes corresponding to the described tentative model is represented by eqn (16)–(19) (FC and LE are Franck–Condon state and lowest electronic excited state). The block scheme illustrating the mechanism is shown in Fig. 10.
 | (16) |
 | (17) |
 | (18) |
 | (19) |
4. Conclusions
The results obtained in this work have demonstrated that the photolysis of mixed-ligand diazide complexes of Pt(IV), even at the first stage, is rather complicated. The first stage which is a release of an azide anion from the first coordination sphere of Pt(IV), is shown to be the chain process. Several intermediates were recorded both in picosecond an in microsecond time domains. Tentative scheme of processes is proposed. Analyzing the results of time-resolved experiments, we have concluded that the pathway of photoaquation includes at least five different Pt(IV) and Pt(III) intermediates, which are listed in Table 2.For further study of mechanism, it seems attractive to find experimental evidence of the N3˙ radical formation directly in the laser flash photolysis experiments. The approach to solve this problem is to find a proper stable molecule (trap) reacting with N3˙ with the formation of easily detected product. The rate constant of the reaction between an azidyl radical and a trap should be known or measured in a model system. Performing this experiment will allow one to quantify the chain photoaquation mechanism (5)–(11).
The second possible direction of the mechanistic study is to perform experiments in frozen (to 77 K) aqueous salt matrices with the simultaneous registration of intermediates by UV and ESR spectroscopy. This approach can be reasonable if the quantum yield does not drop to zero with decrease in temperature. Probably, in this case the ESR detection of the stabilized radical complex (RC) could be possible.
Acknowledgements
The financial support of the Russian Science Foundation (Grant No. 15-13-10012) is gratefully acknowledged.Notes and references
- S. B. Brown, E. A. Brown and I. Walker, Lancet Oncol., 2004, 5, 497 CrossRef CAS PubMed.
- P. J. Bednarski, F. S. Mackay and P. J. Sadler, Anti-Cancer Agents Med. Chem., 2007, 7, 75 CrossRef CAS PubMed.
- A. L. Harris, Nat. Rev. Cancer, 2002, 2, 38 CrossRef CAS PubMed.
- L. Ronconi and P. J. Sadler, Coord. Chem. Rev., 2007, 251, 1633 CrossRef CAS.
- S. Medici, M. Peana, V. M. Nurchi, J. A. Lachowicz, G. Crisponi and M. A. Zoroddu, Coord. Chem. Rev., 2015, 284, 329 CrossRef CAS.
- T. C. Johnstone, K. Suntharalingam and S. J. Lippard, Chem. Rev., 2016, 116, 3436 CrossRef CAS PubMed.
- N. A. Kratochwill, M. Zabel, K.-J. Range and P. J. Bednarski, J. Med. Chem., 1996, 39, 2499 CrossRef PubMed.
- N. A. Kratochwill, J. A. Parkinson, P. J. Bednarski and P. J. Sadler, Angew. Chem., Int. Ed., 1999, 38, 1460 CrossRef.
- N. A. Kratochwill, Z. Guo, P. del Socorro Murdoch, J. A. Parkinson, P. J. Bednarski and P. J. Sadler, J. Am. Chem. Soc., 1998, 120, 8253 CrossRef.
- P. Muller, B. Schroder, J. A. Parkinson, N. A. Kratochwill, R. A. Coxall, A. Parkin, S. Parsons and P. J. Sadler, Angew. Chem., Int. Ed., 2003, 43, 335 CrossRef PubMed.
- F. S. Mackay, J. A. Woods, H. Moseley, J. Ferguson, A. Dawson, S. Parsons and P. J. Sadler, Chem. – Eur. J., 2006, 12, 3155 CrossRef CAS PubMed.
- P. J. Bednarski, R. Grunert, M. Zielski, A. Wellner, F. S. Mackay and P. J. Sadler, Chem. Biol., 2006, 13, 61 CrossRef CAS PubMed.
- L. Ronconi and P. J. Sadler, Chem. Commun., 2008, 235 RSC.
- H. I. A. Phillips, L. Ronconi and P. J. Sadler, Chem. – Eur. J., 2009, 15, 1588 CrossRef CAS PubMed.
- L. Salassa, H. I. A. Phillips and P. J. Sadler, Phys. Chem. Chem. Phys., 2009, 11, 10311 RSC.
- N. J. Farrer, J. A. Woods, V. P. Munk, F. S. Mackay and P. J. Sadler, Chem. Res. Toxicol., 2010, 23, 413 CrossRef CAS PubMed.
- N. J. Farrer, J. A. Woods, L. Salassa, Y. Zhao, K. S. Robinson, G. Clarkson, F. S. Mackay and P. J. Sadler, Angew. Chem., Int. Ed., 2010, 49, 8905 CrossRef CAS PubMed.
- L. Ronconi and P. J. Sadler, Dalton Trans., 2011, 40, 262 RSC.
- A. F. Westendorf, A. Bodtke and P. J. Bednarski, Dalton Trans., 2011, 40, 5342 RSC.
- A. F. Westendorf, J. A. Woods, K. Korpis, N. J. Farrer, L. Salassa, K. Robinson, V. Appleyard, K. Murray, R. Grunert, A. M. Thompson, P. J. Sadler and P. J. Bednarski, Mol. Cancer Ther., 2012, 11, 1894 CrossRef CAS PubMed.
- J. Pracharova, L. Zerzankova, J. Stepankova, O. Novakova, N. J. Farrer, P. J. Sadler, V. Brabec and J. Kasparkova, Chem. Res. Toxicol., 2012, 25, 1099 CrossRef CAS PubMed.
- Y. Zhao, J. A. Woods, N. J. Farrer, K. S. Robinson, J. Pracharova, J. Kasparkova, O. Novakova, H. Li, L. Salassa, A. M. Pizarro, G. J. Clarkson, L. Song, V. Brabec and P. J. Sadler, Chem. – Eur. J., 2013, 19, 9578 CrossRef CAS PubMed.
- Y. Zhao, N. J. Farrer, H. Li, J. C. Butler, J. C. McQuitty, A. Habtemariam, F. Wang and P. J. Sadler, Angew. Chem., Int. Ed., 2013, 52, 16333 Search PubMed.
- P. J. Bednarski, K. Korpis, A. F. Westendorf, S. Perfahl and R. Grunert, Philos. Trans. R. Soc. London, Ser. A, 2013, 371, 20120118 CrossRef PubMed.
- E. Sosnin, T. Oppenlander and V. Tarasenko, J. Photochem. Photobiol., C., 2006, 7, 145 CrossRef CAS.
- E. M. Glebov, V. F. Plyusnin, N. I. Sorokin, V. P. Grivin, A. B. Venediktov and H. Lemmetyinen, J. Photochem. Photobiol., A, 1995, 90, 31 CrossRef CAS.
- I. P. Pozdnyakov, V. F. Plyusnin, V. P. Grivin, D.Yu. Vorobyev, N. M. Bazhin and E. Vauthey, J. Photochem. Photobiol., A, 2006, 182, 75 CrossRef CAS.
- S. V. Chekalin, Phys. Usp., 2006, 49, 634 CAS.
- L. Palfrey and T. F. Heinz, J. Opt. Soc. Am. B, 1985, 2, 674 CrossRef.
- A. Vogler, A. Kern and J. Huttermann, Angew. Chem., Int. Ed. Engl., 1978, 17, 524 CrossRef.
- A. Vogler and J. Hlavatsch, Angew. Chem., Int. Ed. Engl., 1983, 22, 154 CrossRef.
- K. P. Balashev, V. V. Vasil'ev, A. M. Zimnyakov and G. A. Shagisultanova, Russ. J. Coord. Chem., 1984, 10, 976 CAS (in Russian).
- I. V. Znakovskaya, Yu. A. Sosedova, E. M. Glebov, V. P. Grivin and V. F. Plyusnin, Photochem. Photobiol. Sci., 2005, 4, 897 CAS.
- E. M. Glebov, A. V. Kolomeets, I. P. Pozdnyakov, V. F. Plyusnin, V. P. Grivin, N. V. Tkachenko and H. Lemmetyinen, RSC Adv., 2012, 2, 5768 RSC.
- E. M. Glebov, A. V. Kolomeets, I. P. Pozdnyakov, V. P. Grivin, V. F. Plyusnin, N. V. Tkachenko and H. Lemmetyinen, Russ. Chem. Bull., 2013, 62, 1540 CrossRef CAS.
- S. G. Matveeva, I. P. Pozdnyakov, V. P. Grivin, V. F. Plyusnin, A. S. Mereshchenko, A. A. Melnikov, S. V. Chekalin and E. M. Glebov, J. Photochem. Photobiol., A, 2016, 325, 13 CrossRef CAS.
- A. Vogler, A. Kern, B. Fuseder and J. Huttermann, Z. Naturforsch., B: Anorg. Chem. Org. Chem., 1978, 33, 1352 Search PubMed.
- J. S. Butler, J. A. Woods, N. J. Farrer, M. E. Newton and P. J. Sadler, J. Am. Chem. Soc., 2012, 134, 16508 CrossRef CAS PubMed.
- Z. B. Alfassi and R. H. Shuler, J. Phys. Chem., 1985, 89, 3359 CrossRef CAS.
- P. Neta, R. E. Huie and A. B. Ross, J. Phys. Chem. Ref. Data, 1988, 17, 1027 CrossRef CAS.
- E. M. Glebov, V. P. Grivin, V. F. Plyusnin, A. B. Venediktov and S. V. Korenev, J. Photochem. Photobiol., A, 2010, 214, 181 CrossRef CAS.
- A. S. Rury and R. J. Sension, Chem. Phys., 2013, 422, 220 CrossRef CAS.
- A. Vlcek Jr., Coord. Chem. Rev., 2000, 200–202, 933 CrossRef.
- (a) A. L. Poznyak, High Energy Chem., 1969, 3, 380 CAS, (in Russian); (b) M. Freiberg and D. J. Meyerstein, J. Chem. Soc., Chem. Commun., 1977, 127 RSC; (c) V. F. Plyusnin, N. M. Bazhin and O. M. Kiseleva, High Energy Chem., 1978, 12, 77 Search PubMed, (Engl. Transl.); (d) N. P. Gritsan, O. M. Usov, N. V. Shokhirev, I. V. Khmelinskii, V. F. Plyusnin and N. M. Bazhin, Theor. Exp. Chem., 1986, 22, 32 CAS , (Engl. Transl.).
- (a) V. P. Grivin, I. V. Khmelinski and V. F. Plyusnin, J. Photochem. Photobiol., A, 1990, 51, 379 CrossRef CAS; (b) V. P. Grivin, I. V. Khmelinski and V. F. Plyusnin, J. Photochem. Photobiol., A, 1991, 59, 153 CrossRef CAS; (c) E. M. Glebov, V. F. Plyusnin, A. B. Venediktov and S. V. Korenev, Russ. Chem. Bull. Int. Ed., 2003, 52, 1305 CrossRef CAS , (Engl. Transl.).
- (a) E. M. Glebov, V. F. Plyusnin, V. L. Vyazovkin and A. B. Venediktov, J. Photochem. Photobiol., A, 1997, 107, 93 CrossRef CAS; (b) E. M. Glebov, V. F. Plyusnin and V. L. Vyazovkin, High Energy Chem., 1999, 33, 390 CAS , (Engl. Transl.).
- (a) I. P. Pozdnyakov, O. V. Kel, V. F. Plyusnin, V. P. Grivin and N. M. Bazhin, J. Phys. Chem. A, 2008, 112, 8316 CrossRef CAS PubMed; (b) I. P. Pozdnyakov, E. M. Glebov, V. F. Plyusnin, V. P. Grivin, E. Bunduki, N. V. Goryacheva, V. Gladki and G. G. Duka, High Energy Chem., 2009, 43, 406 CrossRef CAS, (Engl. Transl.); (c) E. M. Glebov, I. P. Pozdnyakov, V. P. Grivin, V. F. Plyusnin, X. Zhang, F. Wu and N. Deng, Photochem. Photobiol. Sci., 2011, 10, 425 RSC.
Footnote |
| † Electronic supplementary information (ESI) available. See DOI: 10.1039/c7dt01529a |
| This journal is © The Royal Society of Chemistry 2017 |

