
 Open Access Article
 This Open Access Article is licensed under a
 Creative Commons Attribution 3.0 Unported Licence
Spectrally-resolved third-harmonic generation and the fundamental role of O–H⋯Cl hydrogen bonding in Oh, Td-cobalt(II) tetraphenylmethane-based coordination polymers†
J. K.
Zaręba
 *a,
J.
Janczak
b,
M.
Samoć
a and
M.
Nyk
a
*a,
J.
Janczak
b,
M.
Samoć
a and
M.
Nyk
a
aAdvanced Materials Engineering and Modelling Group, Faculty of Chemistry, Wrocław University of Science and Technology, Wybrzeże Wyspiańskiego 27, 50-370 Wrocław, Poland. E-mail: jan.zareba@pwr.edu.pl
bInstitute of Low Temperatures and Structure Research, Polish Academy of Sciences, 2 Okólna St, P.O. Box 1410, 50-950 Wrocław, Poland
First published on 14th June 2017
Abstract
The reaction of a phosphonate-diester tetraphenylmethane-based tecton, tetrakis[4-(diethoxyphosphoryl)phenyl]methane, (L) with cobalt(II) chloride afforded a centrosymmetric coordination polymer (CP), [L·2Co(H2O)42+·2CoCl42−]n, 2-Cl, possessing simultaneously octahedral (Oh) and tetrahedral (Td) metal centers. This material served as a model compound for the demonstration of factors influencing the spectral dependence of one of the nonlinear optical (NLO) phenomena, the third-harmonic generation (THG). The spectrally-resolved THG (SR-THG) measurements in the range from 1125 to 1750 nm revealed that a maximum of THG response is obtained when the fundamental beam is around 1300 nm. The SR-THG study was combined with an analysis of the self-absorption effects of pumping and of third-harmonic radiation; based on these results, we put forward a hypothesis that the THG action spectrum is influenced more by the ability of the material to self-absorb the third harmonic rather than by the extent of self-absorption of the pumping radiation. Apart from investigations of NLO properties, we have explored coordination and particularly the supramolecular interactions that build up the 2-Cl CP. Despite the tetrahedral, spatial shape of the ligand L, CP 2-Cl has a two-dimensional net. The structure was found to be strongly supported by O–H⋯Cl hydrogen bonds, since each CoCl42− complex anion is an acceptor of eight of such interactions within a distorted square grid layer of cobalt(II) ions. While coordination and hydrogen-bonded nets are both featuring the sql topology when treated separately, the consideration of both of them as topological paths yields a trinodal 4,4,6-connected net, described by the point symbol (42·84)(45·6)2(46·66·83)2. SR-THG and structural studies of 2-Cl have been also supported by far- and mid-infrared spectroscopy, UV-Vis-NIR solid state absorption analysis, thermogravimetry and preliminary magnetic characterization.
Introduction
Frequency mixing phenomena such as SHG (second-harmonic generation) and THG (third-harmonic generation) are nonlinear optical parametric processes in which the pumping laser radiation is nonresonantly transformed within the material (that is, without participation of photon absorption events by electron levels), as a result producing the radiation at two and three times shorter wavelengths, respectively.1 An important feature of the former phenomenon, arising from the properties of the second-order optical susceptibility χ(2) tensor, is that it can be elicited only in crystalline materials featuring non-centrosymmetric space groups; hence, SHG can be treated as a spectroscopic tool for the determination of the “true” crystal non-centrosymmetry. The THG process, on the other hand, is described by the third-order optical susceptibility tensor χ(3), which, in contrast to χ(2), has non-zero components under all symmetries. Accordingly, frequency tripling is achievable in any crystalline solid, thus in all CPs (coordination polymers). However, while the SHG process has been broadly studied by many research groups in CP materials2–7 over the past few years, the THG phenomenon has not been investigated until recently and to our knowledge there are only a few reports that highlight the THG process in these materials.8,9 An in-depth review of CPs as materials not only for frequency mixing but also for other NLO processes such as two- and multiphoton absorption as well as triplet–triplet upconversion and lasing can be found elsewhere.10In our previous contribution we demonstrated, using the spectrally-resolved SHG (SR-SHG) technique for a series of non-centrosymmetric tetraphosphonate diester (dialkyl) CPs11, that measurements of the SHG response in a broad wavelength range provide an approach which is superior to routinely conducted Kurtz-Perry-type12,13 single-wavelength measurements since they are able to reveal distinct maxima and minima in SHG action spectra, in particular when the CPs of interest possess absorption bands in the Vis-NIR region. We have also shown that it is essential to compare the solid state absorption spectra with the SHG action spectra to understand why at some wavelengths the SHG response is suppressed due to material's self-absorption of laser radiation excitation or its harmonics.
Having this experience in hand we asked ourselves whether those observations are also relevant for the THG action spectra of CPs. In particular, we wished to establish whether the self-absorption of pumping and emitted radiation is also the dominant factor shaping the SR-THG (spectrally resolved third-harmonic generation) action spectra of CPs.
To provide a demonstration of these issues, we prepared a CP, called herein 2-Cl, constructed from tetrakis[4-(diethoxyphosphoryl)phenyl]methane (L) and cobalt(II) ions of both tetrahedral (Td) and octahedral (Oh) geometries. Noteworthily, this CP is a centrosymmetric analogue related to SHG-active phosphonate-ester non-centrosymmetric CPs.11 As a result of its peculiar structure, apart from NLO studies, CP 2-Cl gave us the possibility to investigate unusual for most of the phosphonates14–23 and phosphonate monoester24–28 CPs structural aspects, important from the viewpoint of crystal engineering. It is the moderate strength of dialkylphosphonate binding via phosphoryl (P![[double bond, length as m-dash]](https://www.rsc.org/images/entities/char_e001.gif) O) donor coordination combined with the bulkiness of this functional group that induces monodentate axial binding of metal ions.29–32 Moreover, the lack of the deprotonation process of dialkyl phosphonates, in analogy to complexes with N-donor bases, enforces the creation of halide-metal anions (e.g. CoCl3−, CoCl42−) in order to maintain crystal electroneutrality.11,33,34 Nonetheless, participation of the tri- and tetrahalide complexes of metal ions in framework construction via noncovalent forces such as hydrogen-bonding (HB) is often neglected in favour of coordination analysis, thus in the present paper we place a structural focus on the crucial role of O–H⋯Cl HB bonds in sustaining the 2-Cl network, also highlighting the implications on the topology of the supramolecular framework.
O) donor coordination combined with the bulkiness of this functional group that induces monodentate axial binding of metal ions.29–32 Moreover, the lack of the deprotonation process of dialkyl phosphonates, in analogy to complexes with N-donor bases, enforces the creation of halide-metal anions (e.g. CoCl3−, CoCl42−) in order to maintain crystal electroneutrality.11,33,34 Nonetheless, participation of the tri- and tetrahalide complexes of metal ions in framework construction via noncovalent forces such as hydrogen-bonding (HB) is often neglected in favour of coordination analysis, thus in the present paper we place a structural focus on the crucial role of O–H⋯Cl HB bonds in sustaining the 2-Cl network, also highlighting the implications on the topology of the supramolecular framework.
Results and discussion
Synthesis
In this work, we present the improved synthesis of ligand L, which previously was obtained by us using nickel-catalyzed phosphonylation in boiling tert-butylbenzene.35 Here, mild high yield phosphonylation has been realized at 85 °C using C–P coupling with diethyl phosphite, catalyzed with the generated in situ dppf (1,1′-bis(diphenylphosphino)ferrocene) complex of palladium acetate, adapting Belabassi et al.'s synthetic protocol.36 Moreover, we took advantage of the Kalek et al.37 approach, by adding potassium acetate to the reaction mixture, which has been shown to significantly shorten the reaction time. Indeed, the use of the palladium acetate/dppf/potassium acetate system afforded the ligand L in 84% yield (chromatographic purification), after 14 hours of reaction.The synthesis of 2-Cl follows the diethyl ether vapour diffusion approach, used by us previously to obtain related non-centrosymmetric CPs based on ligand L (Scheme 1). We found that to obtain a pure phase of 2-Cl, free of 1-Cl, a molar excess of metal salt is required (cobalt(II) salt to ligand L ratio equals 6![[thin space (1/6-em)]](https://www.rsc.org/images/entities/char_2009.gif) :1). Addition of chloroform is advantageous, due to the shifting of the equilibrium towards the formation of tetrahedral cobalt(II) species. When a smaller cobalt(II) salt excess is used (4:1), without the addition of chloroform, crystallization of both phases (1-Cl and 2-Cl) is observed, as judged by PXRD (Fig. S1, ESI†).
:1). Addition of chloroform is advantageous, due to the shifting of the equilibrium towards the formation of tetrahedral cobalt(II) species. When a smaller cobalt(II) salt excess is used (4:1), without the addition of chloroform, crystallization of both phases (1-Cl and 2-Cl) is observed, as judged by PXRD (Fig. S1, ESI†).
 | ||
| Scheme 1 The structural formula of ligand L and comparison of preparation routes of the noncentrosymmetric and centrosymmetric CPs from L. | ||
To investigate the influence of the halide counter-ion on spectroscopic and THG properties, we also tried to synthesize 2-Cl analogues using CoBr2 and CoI2 salts; however, we consistently obtained non-centrosymmetric phases (1-Br and 1-I, respectively) instead of isomorphous 2-Br and 2-I. We suppose that larger lengths of Co–Br (2.41–2.43 Å at room temperature)38 and Co–I bonds (2.59–2.62 Å, at 150 K)39 result in a much bigger size of CoBr42− and CoI42− which can induce the mismatch of those anions within the hydrogen-bonded cavity. Moreover, larger ionic radii of Br− and I− compared to Cl−, combined with lower electronegativity may cause O–H⋯Br and O–H⋯I hydrogen bonds to be weaker and therefore will not be strong enough to sustain the structure of 2-Cl (a detailed analysis of hydrogen-bonding below).
Coordination, topology and hydrogen-bonding
The coordination polymer 2-Cl crystallizes in the centrosymmetric space group Ccca of the orthorhombic system (no. 68). The asymmetric unit of 2-Cl comprises one-fourth of the ligand residue, half of the tetrahedral cobalt(II) ion (Co1) with two chloride anions and half of the octahedral cobalt(II) ion (Co2) with three coordination water molecules (Fig. S2, ESI†). The composition of 2-Cl can be described by the formula [L·2Co(H2O)42+·2CoCl42−]n, in which L stands for tetrakis[(diethoxyphosphoryl)phenyl]methane.As shown in Fig. 1a, the tetrahedral cobalt(II) ion (Co1) is coordinated by four chloride anions (Cl1, Cl1′, Cl2, and Cl2′), forming a complex anion CoCl42−. Co–Cl bond distances are almost identical (for Co1–Cl1 and Co1–Cl2 equal to 2.2728(5) Å and 2.2716(6) Å, respectively). The Co1 coordination sphere is not an ideal tetrahedron, since Cl1–Co1–Cl2 and Cl1–Co1–Cl1 angles take values of 106.98(2)° and 111.49(2)°, respectively. The Co2 cation is coordinated by four coordination water molecules (O1W, O1W′, O2W, O3W) in equatorial positions, while the axial positions are occupied by oxygen atoms of phosphoryl groups (O1 and O1′), forming octahedral geometry. Here, the coordination sphere is distorted with respect to both bond lengths and angles. The shortest distance to the oxygen donor equals 2.052(2) Å (Co2–O3W bond), while the longest one is equal to 2.083(2) Å, for the Co2–O1W bond.
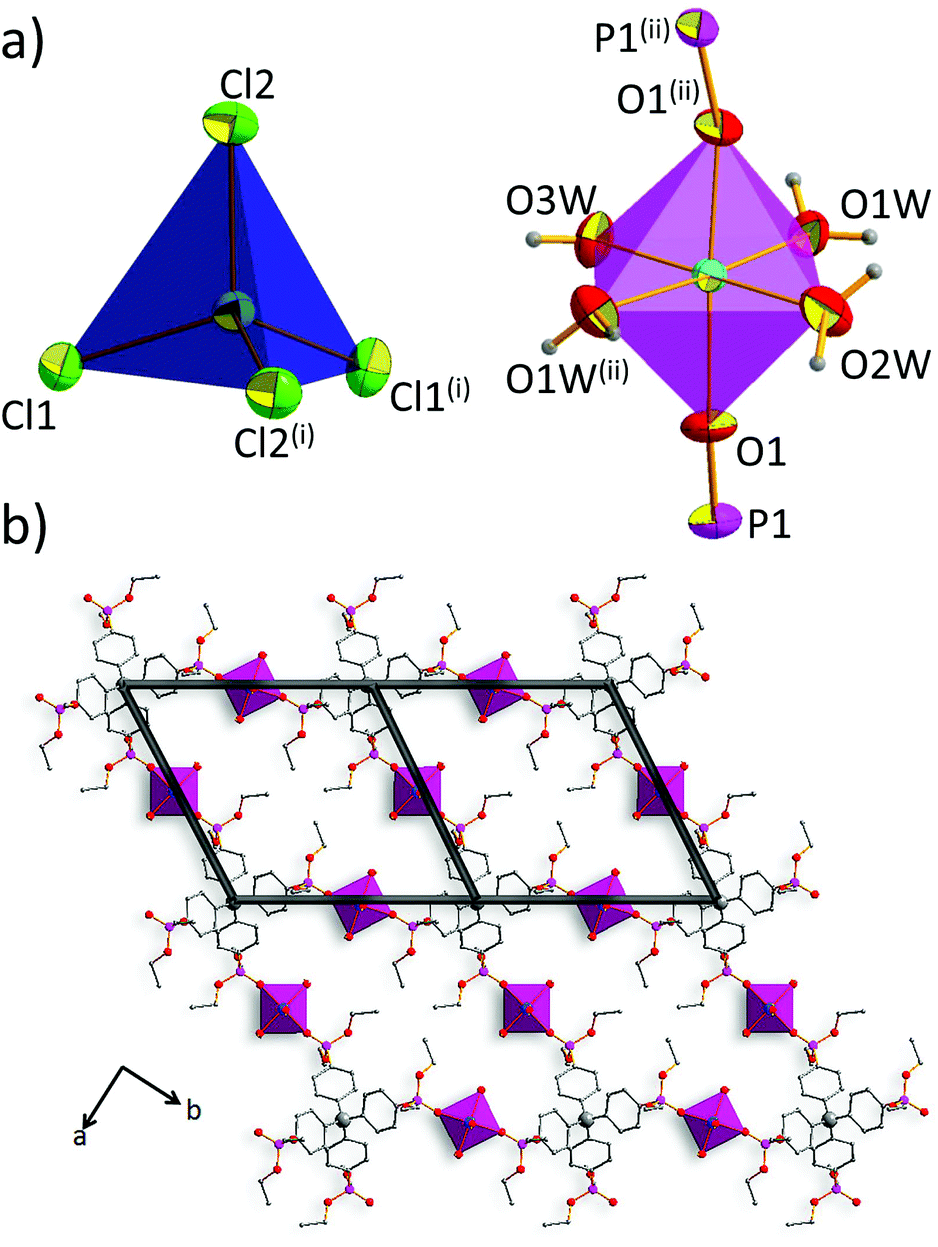 | ||
| Fig. 1 (a) Coordination environments of the Co1 cobalt(II) ion (left), and of the Co2 cobalt(II) ion (dark grey rhombuses). Displacement ellipsoids are drawn at 50% probability level. (b) A coordination layer projected along the c-axis, with overlaid topological representation of the sql net. Symmetry codes: (i) 1 − x, y, 0.5 − z; (ii) 1.5 − x, 1 − y, z. | ||
Each ligand molecule coordinates to four Co2 cations, giving large coordination rings parallel to the ab plane. Recurrence of this motif leads to the formation of a cationic metal–organic corrugated sheet; indeed, a topological simplification40 of the 2-Cl coordination net indicates that this CP is featured by two-periodic sql topology (Fig. 1b), in which the center of the ligand is a four-connected node.
One can distinguish a layer of cobalt(II) ions parallel to the ac plane. Every tetrahedral cobalt(II) ion is surrounded by four octahedral cobalt(II) ions (Fig. 2a) and vice versa. It follows that the CoCl42− anion is an acceptor of eight O–H⋯Cl hydrogen bonds. Among them, four are crystallographically independent (O1W–H1W1⋯Cl2, O1W–H2W1⋯Cl2, O2W–H1W2⋯Cl1, O3W–H2W3⋯Cl1), with bond distances ranging from 3.130 Å to 3.242 Å. An array of O–H⋯Cl hydrogen bonds, according to the graph set notation,41 can be resolved into two basic ring motifs: R22(8), denoted in Fig. 2b as A and A′, which incorporate cobalt(II) ions of both geometries, chloride anions, and water molecules, and R42(8), named B and B′, which involves two water molecules bridged by chloride anions.
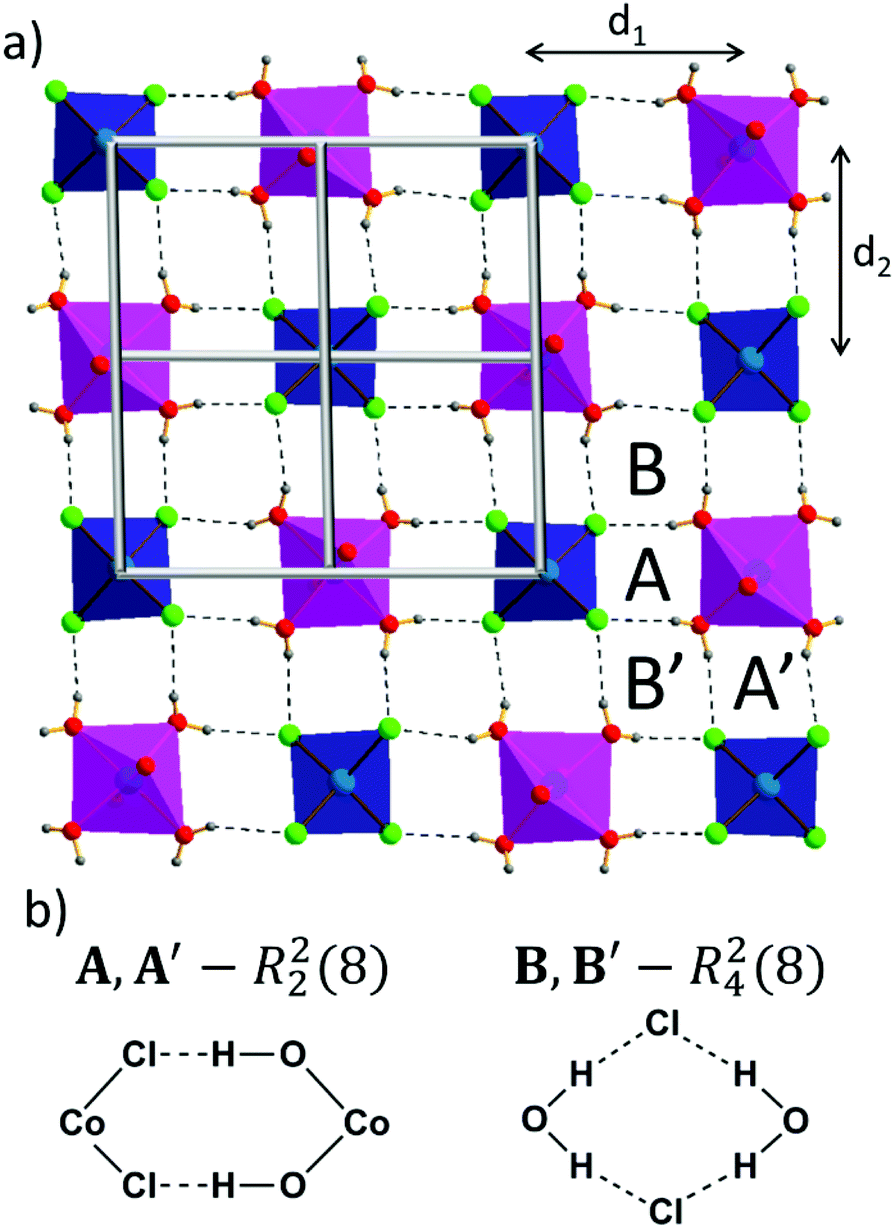 | ||
| Fig. 2 (a) A hydrogen-bonded layer of Co1 and Co2 cobalt(II) ions with shown coordination environments. Topological representation of the sql net is overlaid on that layer (light grey squares). Co1 ions are drawn as dark blue polyhedra, Co2 ions are drawn as purple polyhedra. With letters A, A′, B, B′ are indicated regions of identified hydrogen-bond graph sets. (b) Definitions of graph sets and structural formulae highlighting participating atoms. | ||
It seems that such an extensive O–H⋯Cl hydrogen bonding system, in which CoCl42− resides in supramolecular cavities, is a crucial element for the formation of the CP 2-Cl that provides an explanation for our inability to obtain 2-Br and 2-I isomorphs.
Taking into account the precise geometrical criteria, the obtained supramolecular layer is not an ideal 2D square grid, since one can find two unique Co1⋯Co2 distances: d1 = 5.653(3) Å and d2 = 5.680(3) Å (Fig. 2a). The distance between these metal ion layers, d3, is equal to 12.735 Å (Fig. 3a). Noteworthily, the angle between situated in row Co1–Co2–Co1 ions is lower than 180° (178.3°). The square grid arrangement of cobalt(II) ions translates into the sql topology of the hydrogen-bonded network, with four-connected nodes centered at Co1 and Co2 ions (Fig. 2a).
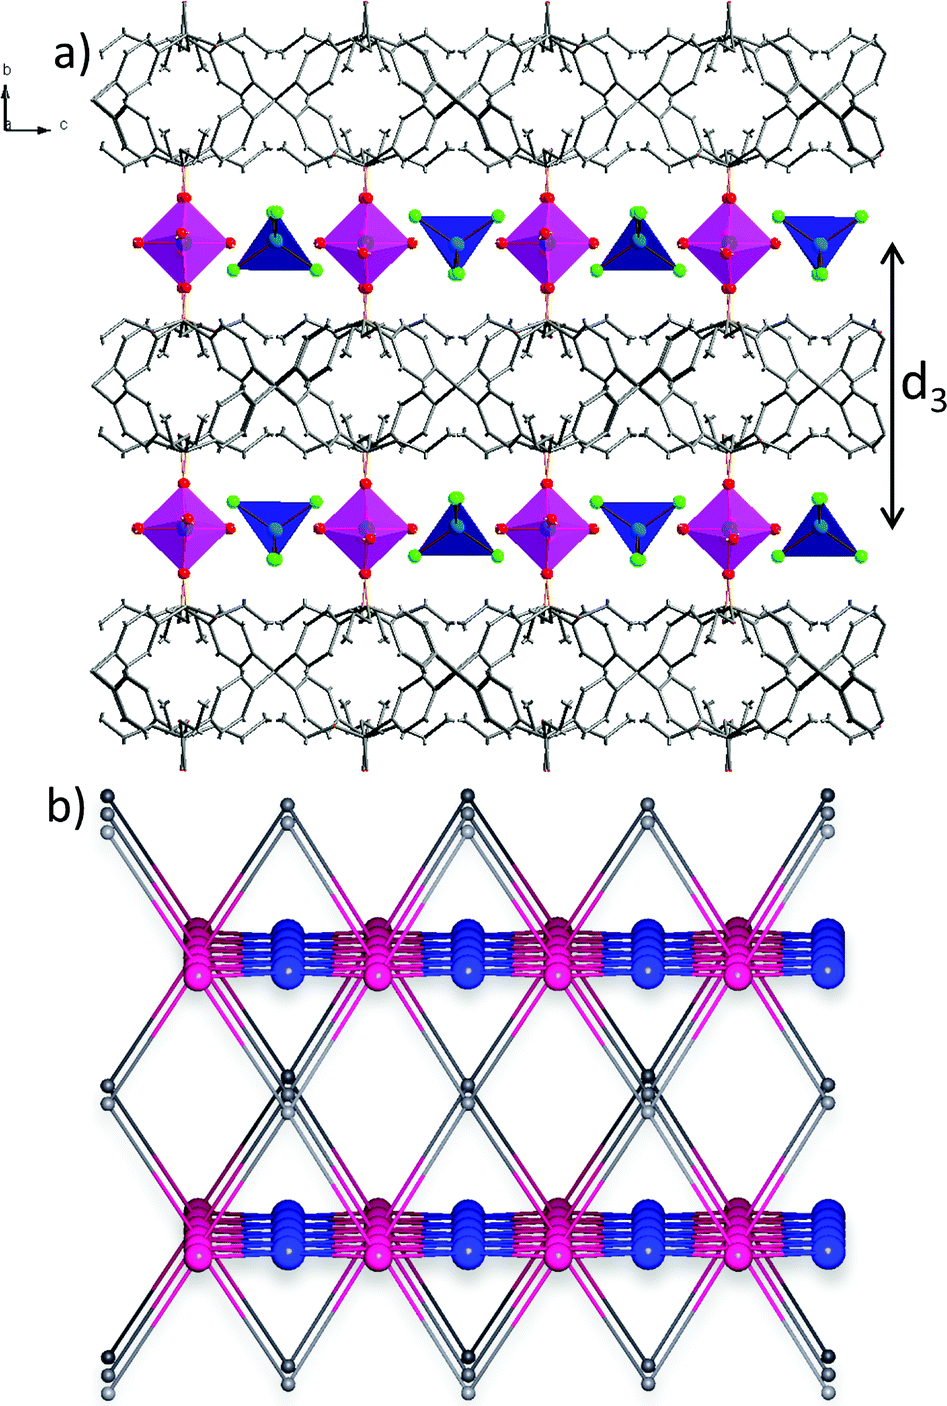 | ||
| Fig. 3 (a) A projection showing the organic and metal ion layers in the structure of 2-Cl, projected along the a-axis. (b) A corresponding topological representation of three-nodal 4,4,6-c net of (42·84)(45·6)2(46·66·83)2 point symbol, projected along the a-axis. | ||
Consideration of both coordination bonds and hydrogen-bonds as topological paths leads to determination of the novel trinodal 4,4,6-c net of point symbol (42·84)(45·6)2(46·66·83)2, in which point symbol notations (42·84), (45·6) and (46·66·83) belong to the center of the ligand, Co1, and Co2, respectively. Graphical representation of this topology is shown in Fig. 3b. While the Co2 node was not a topologically unique node when considering only coordination bonds, here, due to participation in the hydrogen-bonded subnet, it became a six-connected node.
There are known cobalt(II) CPs in which Co2+ ions are located in layers. Within a layer those ions were found to arrange in dimers,42 trimers43 or even can form hexagonal structures.44 An analysis of structures of already known CPs of the square grid type of cobalt(II) arrangement clearly indicates that usually small polytopic ligands were required to obtain such a net, e.g. terephtalic acid,45p-carboxycinnamic acid,46 pyromellitic acid,47 4-(N-imidazolo)benzoic acid,48 or 3,5-dinitrobenzoic acid.49 In this context, the presented 2-Cl distinguishes itself in two respects; on the contrary to the listed above ligands, 2-Cl is constructed from a spatial, bulky ligand. Moreover, 2-Cl is the first CP in which tetrahedral and octahedral ions are placed alternately within layers.
We have shown the importance of the coordination and hydrogen-bonded net, but in the case of tetraphenylmethane-based compounds, phenyl embraces (PEs) have to also be considered as synthon interactions.50–53 PEs are cooperative supramolecular interactions which rely on the multiple edge-to-face C–H⋯π contacts between phenyl groups. In 2-Cl, however, no phenyl embraces can be found. Indeed, the shortest distances between central carbon atoms, d(Ccore⋯Ccore), of tetraphenylmethane moieties are equal to 11.333 Å and 14.948 Å; such values are far beyond the upper limit required for PE (around 7.4 Å).53 The lack of PEs can be attributed to the separation of ligand molecules by octahedral cobalt(II) ions. Also, the relative bulkiness of the diethoxyphosphoryl group needs to be considered. The latter factor, however, does not seem to be a major obstacle since PE analysis of the crystal structure of ligand L, recently published by Perez et al.,54 shows that ligand molecules are themselves capable of forming fourfold PE (4PE, d(Ccore⋯Ccore) = 7.661 Å).
Spectrally-resolved third-harmonic generation
In most reports describing the SHG performance of CPs using the powder Kurtz-Perry method, the SHG response of a powder of a compound is expressed as relative to SHG intensity of a reference material (e.g. KDP, potassium dihydrogen phosphate). In this work, the THG intensities are also expressed as relative values, as a ratio of the integrated THG signal collected from the sample to the integrated THG signal collected from the standard (KDP), normalized to the same integration time. Special care was taken to ensure that geometry of the experimental setup was strictly the same during the measurement of the CP sample and reference at a given wavelength.This way of presenting the spectral dependence of THG avoids problems with normalization or adjusting the power density of the laser to the constant power value throughout the measurement region. Since the parameters influencing the THG intensity of the reference, i.e. χ(3) and the refractive indices are not supposed to vary markedly within the wavelength range of the measurements, the observed wavelength dependence of the relative THG intensity should mostly reflect the variation of the properties of the investigated compound.
Compound 2-Cl is not emissive upon one-photon excitation (investigated range 250–650 nm), which is probably due to the fluorescence quenching abilities of cobalt(II) ions. Nonetheless, in order to exclude two-photon (and multi-photon) induced fluorescence as a possible constituent of emitted radiation, we investigated closely the emission spectra. As presented in Fig. S3, ESI† the only origin of emitted radiation, for both 2-Cl and KDP, appears to be the third harmonic of the fundamental laser radiation (with broadening due to instrumental factors), with no detectable bands of fluorescence.
Additional evidence proved the character of the collected radiation as THG is a measurement of the power dependence of the emitted radiation intensity. Indeed, as seen in Fig. S4, ESI,† varying the laser power from 53 to 84 mW at 1500 nm leads to the slope of the linear regression of the log(IA) = f(log(P)) relationship equal to 3.1, confirming the presence of a THG process.
The relative intensities of THG of 2-Cl expressed versus KDP (SR-THG action spectrum) are presented in Fig. 4. The data were collected in the range from 1125 to 1750 nm. Starting from 1125 nm at which the THG response is the lowest (0.2 that of KDP), the relative THG strength steeply rises to reach the maximum at around 1300 nm (1.1–1.2 that of KDP). For longer wavelengths, up to 1750 nm the relative THG response decreases, at 1750 nm THG of 2-Clvs. KDP is equal to 0.38. Measurements at wavelengths shorter than 1125 nm and longer than 1750 nm were unsuccessful due to either decomposition of the sample upon laser radiation, or due to the inability to capture the THG signal with a reasonable signal-to-noise ratio.
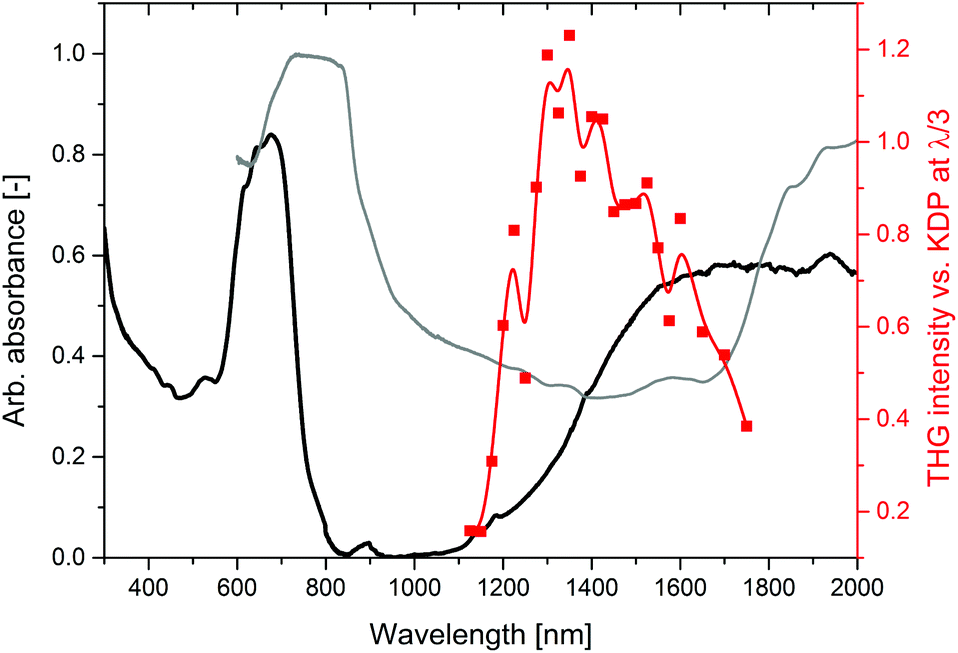 | ||
| Fig. 4 An overlay of the THG action spectrum (red points through which the red line is led, just to guide the eyes) with the solid state absorption spectrum plotted against wavelength (black line) and the solid state absorption spectrum plotted against the tripled wavelength (grey line). | ||
In our recent work, we showed that the SHG action spectra of CPs exhibit a complex structure, with maxima at wavelengths at which the self-absorption of both pumping and emitted radiation by the material is the lowest. Thus, to predict the position of SHG maxima the measurement of the solid-state absorption spectrum is needed. The spectrum of 2-Cl with analysis and assignments of absorption bands is provided in the ESI (Fig. S5†).
It was interesting to know whether a maximum of the THG response can be rationalized in the same manner. Accordingly, using the analogous approach, we compared the obtained THG action spectrum with the solid state absorption spectrum of 2-Cl plotted in a usual manner (vs. λ, black line) and also plotted against a tripled wavelength (vs. 3λ, grey line), as presented in Fig. 4. The absorption spectrum plotted against the wavelength shows the ability of the material to self-absorb the fundamental frequency radiation, while the same absorption spectrum plotted against thrice the wavelength represents the extent of the THG self-absorption. In the case of 2-Cl, an overlay of these absorption spectra in Fig. 4 does not predict the THG response in a quantitative way. For example, at 1100 nm the absorbance of the fundamental is near zero, and the absorbance of the emitted radiation is moderately strong, while at 1400 nm the absorbance values of both the fundamental and the third harmonic are comparable. It might seem intuitive that the THG response should be higher at 1100 nm than at 1400 nm, while the opposite behaviour is observed. This suggests that self-absorption of the emitted radiation may have a more important influence on the THG action spectrum than self-absorption of the fundamental. Indeed, the maximum of the THG response coincides with the minimum of the absorption spectrum plotted vs. 3λ. In the same vein, in our previous work we observed that the presence of an additional absorption band in the UV-blue region in non-centrosymmetric iodide-containing CP (1-I) caused almost complete suppression of SHG activity.11
An important question is thus what might be the physical reasons for bigger importance of the third harmonic self-absorption (per analogy also of second harmonic) compared to that of the fundamental. It is clear that pumping light will penetrate deeply into the specimen, due to relatively low scattering of the long-wavelength radiation (which is proportional to λ−4). On the other hand, the generated third harmonic will experience much higher scattering than the fundamental beam, and, since it will be emitted essentially in all directions, it will also be self-absorbed at longer optical paths than that for the pumping beam. In addition to absorption and scattering, an important factor here is also that of the relatively short coherence length expected for the THG process, which limits the optical paths from which the THG is collected.
Preliminary magnetic characterization
The magnetic measurement was conducted in a constant field (300 Oe) in the 1.7–300 K temperature range. Values of magnetization and of magnetic moment are provided per Co ion. In order to determine the fundamental magnetic parameters of compound 2-Cl, the 1/χM and χMT plots as a function of temperature have been drawn (Fig. 5).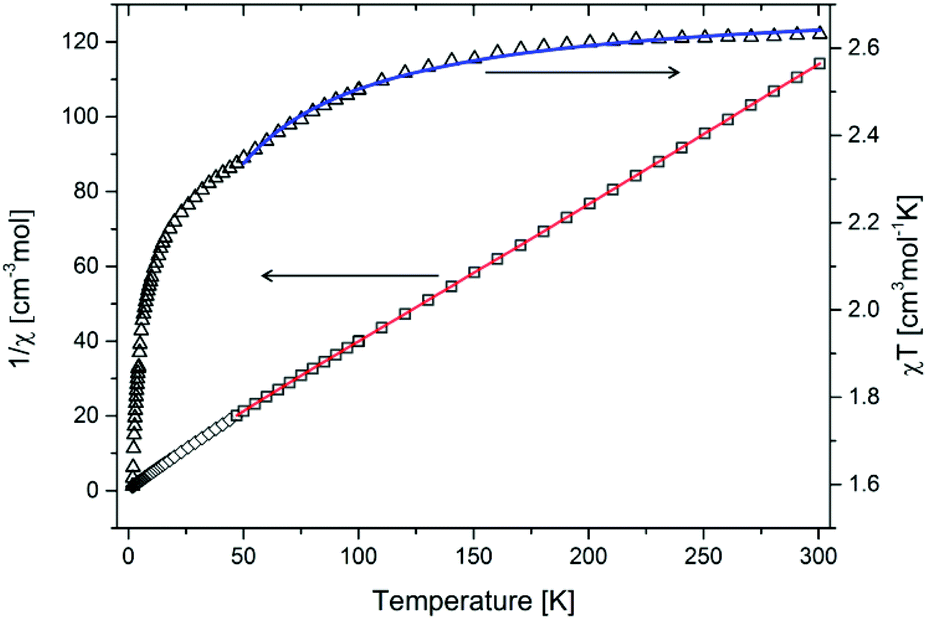 | ||
| Fig. 5 Variation of χT product (triangles) and of χ−1 (squares) with temperature. Red line corresponds to the fit in the 50–300 K temperature range with the Curie–Weiss law, while the blue line corresponds to the fit in the 50–300 K temperature range with eqn (1). | ||
As shown in Fig. 5, the experimental χMT value at room temperature for CP 2-Cl, calculated per cobalt(II) ion is equal to 2.63 cm3 K mol−1. This value decreases by lowering the temperature to 55 K (2.35 cm3 K mol−1), where an inflection point is noticeable. From 45 K one can see a strong decrease of χMT product to 1.8 cm3 K mol−1 at 1.8 K. The χMT value at room temperature is much bigger than that theoretically calculated for the magnetically isolated high-spin (S = 3/2) cobalt(II) ion (1.875 cm3 K mol−1, 3.87 B.M.) for g = 2.0.44
Zero-field splitting as well as the spin-orbital coupling occurring in cobalt(II) ions essentially complicate the interpretation and fitting of the magnetic data of complexes and coordination polymers possessing those ions.55 While the latter phenomenon is present to a lesser extent in the case of tetrahedral geometries (singlet term 4A2)56 it is pronounced in the case of distorted octahedral cobalt(II) complexes. These phenomena are the origin of the abnormally increased χMT product observed for CP 2-Cl. Fitting of the magnetic data in the 50–300 K temperature range with the Curie–Weiss law gives Curie constant C = 2.71 cm3 mol−1 K and Weiss constant θ = −7.83 K, but it should be kept in mind that a negative θ value for cobalt(II) compounds, apart from the occurring antiferromagnetic interaction between metal centers, may have the origin in the strong spin–orbit coupling as well. Thus, to more accurately quantify the strength of the antiferromagnetic exchange, a fitting of the data to the following phenomenological equation57,58 has been conducted:
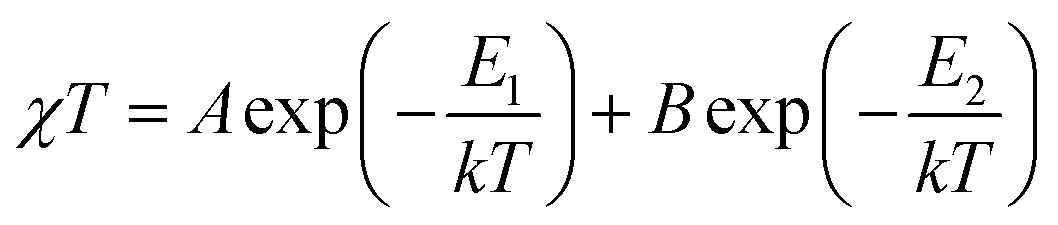 | (1) |
In eqn (1), A + B is equal to the Curie constant, E1/k is the activation energy of spin–orbit coupling, and E2/k stands for the activation energy of the antiferromagnetic exchange.
The best fit in the 50–300 K temperature range gave A + B = 2.70 cm3 mol−1 K, E1/k = 74.60 K, and −E2/k = −6.07 K. A + B value matches well with the Curie constant. The E1/k value is in the range expected for distorted Co(II) magnetic centers, while E2/k confirms small antiferromagnetic interactions. We stress that, due to the presence of cobalt(II) ions of both geometries, the calculated parameters should be treated as intermediate values; in other words these can be viewed as an “average” of magnetic participations of tetrahedral and octahedral cobalt(II) ions. A much more accurate modelling of the magnetic properties of mixed-geometry cobalt(II) systems would require e.g. the use of matrix-diagonalization techniques, as demonstrated elsewhere.33,34,59–61
Experimental
Crystallography
The obtained single crystal of 2-Cl was used for data collection on a four-circle KUMA KM4 diffractometer equipped with a two-dimensional CCD area detector. Graphite monochromatized Mo Kα radiation (λ = 0.71073 Å) and the ω-scan technique (Δω = 1°) were applied, while additional data collection and reduction, along with absorption correction, were performed using the CrysAlis software package.62 The structure was solved by direct methods using SHELXS-201263 revealing the positions of all or almost all non-hydrogen atoms. The remaining atoms were located as a result of subsequent difference Fourier syntheses. The structure was refined using SHELXL-2012 with anisotropic displacement parameters. Hydrogen atoms connected to carbon atoms were constrained as a riding model. The positions of the H atoms of water molecules were located on a difference Fourier map, where possible, and constrained. The collection parameters data, crystallographic data and final agreement parameters are listed in Table 1. Selected geometrical parameters are listed in Table S1.† The hydrogen bonding geometry for 2-Cl is listed in Table S2.† Visualization of the structures was conducted using the Diamond software,64 while a topological simplification of coordination networks was performed with the ToposPro package.40 Geometrical features of intermolecular interactions were determined with the help of Platon software.65
| Formula | C41H72Cl8Co4O20P4 |
| M [g mol−1] | 1528.14 |
| Crystal system | Orthorhombic |
| Space group | Ccca (no. 68) |
| a, b, c [Å] | 15.6558(5), 25.4691(8), 16.3904(5) |
| α, β, γ [°] | 90, 90, 90 |
| V [Å3] | 6535.5(4) |
| Z | 4 |
| Density calc. [g cm−3] | 1.553 |
| μ(MoKα) [mm−1] | 1.485 |
| F(000) | 3128 |
| Crystal size [mm] | 0.22 × 0.28 × 0.32 |
| Temperature [K] | 295 |
| Radiation [Å] | MoKα 0.71073 |
| θ min, θmax [°] | 2.9, 28.5 |
| hkl range | −20:20; −33:34; −20:22 |
| Reflexes measured, independent | 41875, 4134 |
| R int | 0.029 |
| R 1, wR2, S | 0.0290, 0.0742, 1.03 |
| Δρmax, Δρmin [e Å−3] | −0.26, 0.43 |
| CCDC number | 1541606 |
Materials
Starting materials were of reagent grade purity and were obtained from commercial sources and used without further purification, except for dioxane, which was kept over 3 Å Aldrich molecular sieves. Tetrakis(4-bromophenyl)methane was prepared according to a previously known procedure.66Optimized Pd-catalyzed synthesis of tetrakis[4-(diethoxyphosphoryl)phenyl]methane, (L)
Tetrakis(4-bromophenyl)methane (2.50 g, 3.92 mmol) and 40 cm3 dioxane were placed in a two-necked round-bottom flask and heated to 85 °C. Nitrogen was purged via a reaction system for ca. 15 minutes. After purging, anhydrous Pd(OAc)2 (9.7 mg, 0.043 mmol, 1.1 mol%) and dppf (49 mg, 0.088 mmol, 2.2 mol%) were added and stirred at 85 °C until a dark brown coloration of the palladium–phosphine complex appeared. Next, diethyl phosphite (3.03 cm3, 23.52 mmol, 6 eq.), triethylamine (3.28 cm3, 23.52 mmol, 6 eq.), and anhydrous potassium acetate (0.300 g, 3.05 mmol, 0.78 eq.) were added in single portions. Heating continued for 15 hours at that temperature and under a nitrogen atmosphere.The mixture was cooled down to room temperature and a white precipitate of triethylammonium hydrobromide was filtered and discarded. After evaporation of the filtrate under reduced pressure, a slightly viscous solid was purified using column chromatography (silica gel 60 Å (63–200 μm)), a 10:1 v/v mixture of ethyl acetate/ethanol (Rf = 0.04, silica gel on PET foils with fluorescent indicator 254 nm, UV lamp for the visualization). Yield: 2.85 g (84%) mp. (ethyl acetate) 177.1–183.8 °C.
Alternatively, the compound can be purified by recrystallization from an ethyl acetate–cyclohexane mixture,35 but at the expense of lower yield (around 70%). Note that palladium-catalyzed phosphonylation was previously achieved using the unusual Pd(PPh3)4-triisopropyl phosphite system, at 220 °C.17,67
HRMS (ESI): calc. for C41H57O12P4 (M + H+): 865.2800; found: 865.2831 (m/z). 1H NMR (400 MHz, CDCl3) δ 7.69 (dd, 3JP–H = 12.9 Hz, 3JH–H = 8.4 Hz, 2H), 7.28 (dd, 3JH–H = 8.4 Hz, 5JP–H = 3.8 Hz, 2H), 4.21–4.05 (m, 4H), 1.32 (t, 3JH–H = 7.1 Hz, 6H) ppm. 31P{1H} NMR (162 MHz, CDCl3) δ 18.7 (s) ppm. 13C{1H} NMR (151 MHz, CDCl3) δ 149.31, 131.53 (d, 2JP–C = 10.3 Hz), 130.85 (d, 3JP–C = 15.1 Hz), 127.00 (d, 1JP–C = 190.9 Hz), 65.61 (s), 62.43 (d, 2JP–C = 5.6 Hz), 16.44 (d, 3JP–C = 6.3 Hz) ppm. NMR spectra are presented in Fig. S6–S8, ESI.†
Anal. calcd for C41H72Cl8Co4O20P4: C, 32.22; H, 4.74. Found: C, 32.44; H, 4.59 [%]. MIR and FIR spectra are presented in Fig. S9 and S10, ESI,† respectively. IR tentative assignments are given in Table S3, ESI.† Thermogravimetric characterization and discussion are presented in the ESI (Fig. S11†).
Spectrally-resolved third harmonic generation
For the wide-wavelength range THG measurements of 2-Cl powdered samples and KDP with the same particle size (125–177 μm), which was used as a reference material, were placed between microscope glass slides and excited by tunable fs laser pulses from a laser system consisting of a Quantronix Integra-C regenerative amplifier operating as an 800 nm pump and a Quantronix-Palitra-FS BIBO crystal-based optical parametric amplifier. This system delivers wavelength tunable pulses of ∼130 fs length and was operated at a repetition rate of 1 kHz. The incident beam was directed onto the plane of the sample at about 45 degrees while the detector was placed in front of the sample. Laser beam intensity was attenuated by using a Glan laser polarizer and spectra of the THG emission were recorded by using an Ocean Optics 2000 fiber coupled CCD spectrograph for excitation wavelengths in the range from 1125 to 1750 nm. The geometry of the experimental setup and the intensity of the laser beam were exactly the same for the whole experiment and all samples at a given wavelength. Unwanted excitation wavelengths that are usually present in the output of an OPA were removed using color glass filters. After setting the output wavelength (1125–1750 nm, approximately 25 nm step), the intensity of the beam was attenuated, when needed, by using polarizing optics, in order to avoid sample decomposition and white light continuum generated by femtosecond laser pulses. A different integrating time was used for coordination polymers (typically 5000–30000 ms) and for the KDP sample (500–5000 ms) in order to ensure a reliable S/N ratio. The intensity of the signal was normalized to the same time of collection. CAUTION. Work with a high-power laser brings danger to the eyes, especially in the spectral range in which the beam is invisible. Adequate eye protection should be used during measurements.
Other methods
Powder X-ray diffraction (PXRD) patterns of the coordination polymers were obtained on a PANanalytical X'Pert diffractometer equipped with a Cu-Kα radiation source (λ = 1.54182 Å). Elemental analysis was performed using a CE Instruments CHNS 1110 elemental analyzer. Magnetic susceptibility down to 1.7 K at a field of 30 mT was measured with a Quantum Design SQUID magnetometer. Thermogravimetric analysis (TGA) and differential thermal analysis (DTA) were conducted using a Setaram SETSYS 16/18 thermoanalyzer in the range 20–800 °C at a heating rate of 5 °C min−1 under a flowing 80% nitrogen–20% oxygen atmosphere. Diffuse reflectance spectra (DRS) were obtained on a Cary 500 spectrophotometer in the range 200–2000 nm using BaCO3 as a reference. The absorption spectra were calculated from the Kubelka–Munk function: F(R) = (1 − R)2/2R = K/S, where R is the diffuse reflectance, K is the molar absorption coefficient, and S is the scattering coefficient. Mid-infrared (MIR) and far-infrared (FIR) spectra were obtained on a VERTEX 70 V FT-IR spectrometer (Bruker Optik GmbH, Ettlingen, Germany) in attenuated total reflection (ATR) measurement mode at room temperature. 1H, and 31P{1H} NMR spectra were recorded on a Jeol JNM-ECZ 400S Research FT NMR spectrometer (JEOL Ltd, Tokyo, Japan) operating at 400 and 162 MHz, respectively. The 13C{1H} spectrum was recorded with the use of a Bruker Avance 600 spectrometer operating at 151 MHz.Conclusions
The structural, topological and spectrally-resolved THG properties of the centrosymmetric Oh, Td-cobalt(II) tetraphenylmethane-based coordination polymer, belonging to the rare family of diester-phosphonates, have been characterized. Based on the reactivity of ligand L towards cobalt(II) halides as well as on the detailed analysis of coordination and supramolecular interactions, we have shown that O–H⋯Cl HB bonds are fundamental interactions sustaining the structure of the 2-Cl network.By measurements of THG in a broad wavelength range (1125–1750 nm), we determined that the maximum of the THG response is obtained when approximately 1300 nm pumping wavelength radiation is applied. SR-THG was combined with the analysis of the self-absorption effects of pumping and of third-harmonic radiation; based on these results we suggested that the main influence on the THG response is the ability of the material to absorb the third harmonic rather than the extent of self-absorption of the pumping radiation. This demonstrates the importance of further investigations of SR-THG (also SR-SHG) of CPs in which resonant and nonresonant processes may compete.
Acknowledgements
We acknowledge the financial support from the Polish National Science Centre under “Maestro” DEC-2013/10/A/ST4/00114 grant and the Faculty of Chemistry, Wrocław University of Science and Technology. We also gratefully acknowledge the instrumental grant 6221/IA/119/2012 from the Polish Ministry of Science and Higher Education, which supported our Integrated Laboratory of Research and Engineering of Advanced Materials where IR measurements were performed. We thank Dr Agnieszka Wojciechowska for access to a DRS measurement setup and Michał Białek for TGA measurement.Notes and references
- R. W. Boyd, Nonlinear Optics, 2008 Search PubMed.
- M. A. van der Veen, T. Verbiest and D. E. De Vos, Microporous Mesoporous Mater., 2013, 166, 102–108 CrossRef CAS.
- C. Wang, T. Zhang and W. Lin, Chem. Rev., 2012, 112, 1084–1104 CrossRef CAS PubMed.
- O. R. Evans and W. Lin, Acc. Chem. Res., 2002, 35, 511–522 CrossRef CAS PubMed.
- O. R. Evans and W. Lin, Chem. Mater., 2001, 13, 2705–2712 CrossRef CAS.
- O. R. Evans and W. Lin, Chem. Mater., 2001, 13, 3009–3017 CrossRef CAS.
- O. R. Evans, R. G. Xiong, Z. Wang, G. K. Wong and W. Lin, Angew. Chem., Int. Ed., 1999, 38, 536–538 CrossRef CAS.
- M. Liu, H. S. Quah, S. Wen, J. Wang, P. S. Kumar, G. Eda, J. J. Vittal and W. Ji, J. Mater. Chem. C, 2017, 5, 2936–2941 RSC.
- M. Liu, H. S. Quah, S. Wen, Z. Yu, J. J. Vittal and W. Ji, Chem. Mater., 2016, 28, 3385–3390 CrossRef CAS.
- R. Medishetty, J. K. Zaręba, D. Mayer, M. Samoć and R. A. Fischer, Chem. Soc. Rev., 2017 10.1039/C7CS00162B.
- J. K. Zaręba, M. J. Białek, J. Janczak, M. Nyk, J. Zoń and M. Samoć, Inorg. Chem., 2015, 54, 10568–10575 CrossRef PubMed.
- A. Graja, Phys. Status Solidi B, 1968, 27, K93–K97 CrossRef CAS.
- S. K. Kurtz and T. T. Perry, J. Appl. Phys., 1968, 39, 3798–3813 CrossRef CAS.
- X. J. Yang, S. S. Bao, M. Ren, N. Hoshino, T. Akutagawa and L. M. Zheng, Chem. Commun., 2014, 50, 3979–3981 RSC.
- W. X. Nie, S. S. Bao, D. Zeng, L. R. Guo and L. M. Zheng, Chem. Commun., 2014, 50, 10622–10625 RSC.
- A. Bulut, Y. Zorlu, M. Wörle, S. Paşa, H. Kurt, J. Zubieta, J. Beckmann and G. Yücesan, Eur. J. Inorg. Chem., 2016, 2016, 3506–3512 CrossRef CAS.
- A. Bulut, Y. Zorlu, E. Kirpi, A. Çetinkaya, M. Wörle, J. Beckmann and G. Yücesan, Cryst. Growth Des., 2015, 15, 5665–5669 CAS.
- F.-N. Shi, J. C. Almeida, L. A. Helguero, M. H. V. Fernandes, J. C. Knowles and J. Rocha, Inorg. Chem., 2015, 54, 9929–9935 CrossRef CAS PubMed.
- M. Taddei, F. Costantino, F. Marmottini, A. Comotti, P. Sozzani and R. Vivani, Chem. Commun., 2014, 50, 14831–14834 RSC.
- R. M. P. Colodrero, G. K. Angeli, M. Bazaga-Garcia, P. Olivera-Pastor, D. Villemin, E. R. Losilla, E. Q. Martos, G. B. Hix, M. A. G. Aranda, K. D. Demadis and A. Cabeza, Inorg. Chem., 2013, 52, 8770–8783 CrossRef CAS PubMed.
- J.-M. Rueff, O. Perez, A. Pautrat, N. Barrier, G. B. Hix, S. Hernot, H. Couthon-Gourvès and P.-A. Jaffrès, Inorg. Chem., 2012, 51, 10251–10261 CrossRef CAS PubMed.
- M. J. Białek, J. Janczak and J. Zoń, CrystEngComm, 2013, 15, 390–399 RSC.
- Z. Amghouz, S. García-Granda, J. R. García, A. Clearfield and R. Valiente, Cryst. Growth Des., 2011, 11, 5289–5297 CAS.
- B. S. Gelfand, R. P. S. Huynh, R. K. Mah and G. K. H. Shimizu, Angew. Chem., Int. Ed., 2016, 55, 14614–14617 CrossRef CAS PubMed.
- B. S. Gelfand, J. B. Lin and G. K. H. Shimizu, Inorg. Chem., 2015, 54, 1185–1187 CrossRef CAS PubMed.
- J. M. Taylor, R. Vaidhyanathan, S. S. Iremonger and G. K. H. Shimizu, J. Am. Chem. Soc., 2012, 134, 14338–14340 CrossRef CAS PubMed.
- S. S. Iremonger, J. Liang, R. Vaidhyanathan, I. Martens, G. K. H. Shimizu, T. D. Daff, M. Z. Aghaji, S. Yeganegi and T. K. Woo, J. Am. Chem. Soc., 2011, 133, 20048–20051 CrossRef CAS PubMed.
- S. S. Iremonger, J. Liang, R. Vaidhyanathan and G. K. H. Shimizu, Chem. Commun., 2011, 47, 4430–4432 RSC.
- A. Y. Mitrofanov, Y. Rousselin, R. Guilard, S. Brandes, A. G. Bessmertnykh-Lemeune, M. A. Uvarova and S. E. Nefedov, New J. Chem., 2016, 40, 5896–5905 RSC.
- R. I. Zubatyuk, A. A. Sinelshchikova, Y. Y. Enakieva, Y. G. Gorbunova, A. Y. Tsivadze, S. E. Nefedov, A. Bessmertnykh-Lemeune, R. Guilard and O. V. Shishkin, CrystEngComm, 2014, 16, 10428–10438 RSC.
- M. A. Uvarova, A. A. Sinelshchikova, M. A. Golubnichaya, S. E. Nefedov, Y. Yu. Enakieva, Y. G. Gorbunova, A. Yu. Tsivadze, C. Stern, A. Bessmertnykh-Lemeune and R. Guilard, Cryst. Growth Des., 2014, 14, 5976–5984 CAS.
- A. A. Sinelshchikova, S. E. Nefedov, Y. Y. Enakieva, Y. G. Gorbunova, A. Y. Tsivadze, K. M. Kadish, P. Chen, A. Bessmertnykh-Lemeune, C. Stern and R. Guilard, Inorg. Chem., 2013, 52, 999–1008 CrossRef CAS PubMed.
- A. P. Singh Pannu, P. Kapoor, G. Hundal, R. Kapoor, M. Corbella, N. Aliaga-Alcalde and M. Singh Hundal, Dalton Trans., 2011, 40, 12560–12569 RSC.
- P. Kapoor, A. P. S. Pannu, G. Hundal, R. Kapoor, M. Corbella, N. Aliaga-Alcalde and M. S. Hundal, Dalton Trans., 2010, 39, 7951–7959 RSC.
- J. K. Zaręba, M. J. Białek, J. Janczak, J. Zoń and A. Dobosz, Cryst. Growth Des., 2014, 14, 6143–6153 Search PubMed.
- Y. Belabassi, S. Alzghari and J.-L. Montchamp, J. Organomet. Chem., 2008, 693, 3171–3178 CrossRef CAS PubMed.
- M. Kalek, M. Jezowska and J. Stawinski, Adv. Synth. Catal., 2009, 351, 3207–3216 CrossRef CAS.
- A. A. Bardin, H. Akutsu and J.-i. Yamada, Cryst. Growth Des., 2016, 16, 1228–1246 CAS.
- A. Crochet and K. M. Fromm, Z. Anorg. Allg. Chem., 2010, 636, 1484–1496 CrossRef CAS.
- V. A. Blatov, A. P. Shevchenko and D. M. Proserpio, Cryst. Growth Des., 2014, 14, 3576–3586 CAS.
- M. C. Etter, Acc. Chem. Res., 1990, 23, 120–126 CrossRef CAS.
- D. Cave, J.-M. Gascon, A. D. Bond, S. J. Teat and P. T. Wood, Chem. Commun., 2002, 38, 1050–1051 RSC.
- Y.-Z. Zheng, M.-L. Tong, W.-X. Zhang and X.-M. Chen, Chem. Commun., 2006, 42, 165–167 RSC.
- A. Rodriguez-Dieguez, J. Cano, R. Kivekas, A. Debdoubi and E. Colacio, Inorg. Chem., 2007, 46, 2503–2510 CrossRef CAS PubMed.
- M. Kurmoo, H. Kumagai, M. A. Green, B. W. Lovett, S. J. Blundell, A. Ardavan and J. Singleton, J. Solid State Chem., 2001, 159, 343–351 CrossRef CAS.
- H. Kumagai, Y. Oka, K. Inoue and M. Kurmoo, J. Chem. Soc., Dalton Trans., 2002, 31, 3442–3446 RSC.
- O. Fabelo, J. Pasan, L. Canadillas-Delgado, F. S. Delgado, F. Lloret, M. Julve and C. Ruiz-Perez, Inorg. Chem., 2008, 47, 8053–8061 CrossRef CAS PubMed.
- J.-Z. Zhang, W.-R. Cao, J.-X. Pan and Q.-W. Chen, Inorg. Chem. Commun., 2007, 10, 1360–1364 CrossRef CAS.
- S. Roy, I. Oyarzabal, J. Vallejo, J. Cano, E. Colacio, A. Bauza, A. Frontera, A. M. Kirillov, M. G. B. Drew and S. Das, Inorg. Chem., 2016, 55, 8502–8513 CrossRef CAS PubMed.
- I. Dance and M. Scudder, New J. Chem., 1998, 22, 481–492 RSC.
- C. Hasselgren, P. A. W. Dean, M. L. Scudder, D. C. Craig and I. G. Dance, J. Chem. Soc., Dalton Trans., 1997, 26, 2019–2027 RSC.
- I. Dance and M. Scudder, Chem. – Eur. J., 1996, 2, 481–486 CrossRef CAS.
- I. Dance and M. Scudder, J. Chem. Soc., Dalton Trans., 1996, 25, 3755–3769 RSC.
- O. Perez, C. Bloyet, J.-M. Rueff, N. Barrier, V. Caignaert, P.-A. Jaffrès and B. Raveau, Cryst. Growth Des., 2016, 16, 6781–6789 CAS.
- M. Kurmoo, Chem. Soc. Rev., 2009, 38, 1353–1379 RSC.
- O. Kahn, Molecular Magnetism, VCH, New York, 1993 Search PubMed.
- J.-M. Rueff, N. Masciocchi, P. Rabu, A. Sironi and A. Skoulios, Chem. – Eur. J., 2002, 8, 1813–1820 CrossRef CAS.
- J.-M. Rueff, N. Masciocchi, P. Rabu, A. Sironi and A. Skoulios, Eur. J. Inorg. Chem., 2001, 2001, 2843–2848 CrossRef.
- J. S. Maass, M. Zeller, T. M. Breault, B. M. Bartlett, H. Sakiyama and R. L. Luck, Inorg. Chem., 2012, 51, 4903–4905 CrossRef CAS PubMed.
- E. Shurdha, C. E. Moore, A. L. Rheingold and J. S. Miller, Inorg. Chem., 2011, 50, 10546–10548 CrossRef CAS PubMed.
- M.-X. Yao, M.-H. Zeng, H.-H. Zou, Y.-L. Zhou and H. Liang, Dalton Trans., 2008, 37, 2428–2432 RSC.
- CrysAlis CCD and CrysAlis Red program, Oxford Diffraction Poland, Wrocław, Poland, ver. 171.31.8, 2006 Search PubMed.
- G. Sheldrick, Acta Crystallogr., Sect. C: Cryst. Struct. Commun., 2015, 71, 3–8 CrossRef PubMed.
- K. Brandenburg and K. Putz, Diamond, Crystal and Molecular Structure Visualization, University of Bonn, Bonn, Germany, ver. 3.2i, 2012 Search PubMed.
- A. L. Spek, J. Appl. Crystallogr., 2003, 36, 7–13 CrossRef CAS.
- M. C. C. Ng, D. J. Craig, J. B. Harper, L. van-Eijck and J. A. Stride, Chem. – Eur. J., 2009, 15, 6569–6572 CrossRef CAS PubMed.
- A. Bulut, M. Worle, Y. Zorlu, E. Kirpi, H. Kurt, J. Zubieta, S. Grabowsky, J. Beckmann and G. Yucesan, Acta Crystallogr., Sect. B: Struct. Sci., 2017, 73, 296–303 CAS.
Footnote |
| † Electronic supplementary information (ESI) available: PXRD traces, crystallographic tables, additional characterization of the THG process, figures showing the solid state absorption spectrum, 1H, 31P, 13C NMR spectra, IR spectra, TGA/DTA traces and additional discussions. CCDC 1541606. For ESI and crystallographic data in CIF or other electronic format see DOI: 10.1039/c7dt01518f |
| This journal is © The Royal Society of Chemistry 2017 |