 Open Access Article
Creative Commons Attribution 3.0 Unported Licence
The effect of a membrane-mimicking environment on the interactions of Cu2+ with an amyloidogenic fragment of chicken prion protein†
Aleksandra
Hecel
a,
Sara
Draghi
b,
Daniela
Valensin
 *b and
Henryk
Kozlowski
c
aFaculty of Chemistry, University of Wroclaw, F. Joliot-Curie 14., 50-383 Wroclaw, Poland
bDepartment of Biotechnology, Chemistry and Pharmacy, University of Siena, Via A. Moro 2, 53100 Siena, Italy. E-mail: daniela.valensin@unisi.it
cPublic Higher Medical Professional School in Opole, Katowicka 68, 45060 Opole, Poland
First published on 22nd May 2017
Abstract
Prion proteins (PrP) from different species have the ability to tightly bind Cu2+ ions. Copper coordination sites are located in the disordered and flexible N-terminal region which contains several His anchoring sites. Among them, two His residues are found in the so called amyloidogenic PrP region which is believed to play a key role in the process leading to oligomer and fibril formation. Both chicken and human amyloidogenic regions have a hydrophobic C-terminal region rich in Ala and Val amino acids. Recent findings revealed that this domain undergoes random coil to α-helix structuring upon interaction with membrane models. This interaction might strongly impact metal binding abilities either in terms of donor sets or affinity. In this study we investigated Cu2+ interaction with an amyloidogenic fragment, chPrP105–140, derived from chicken prion protein (chPrP), in different solution environments. The behavior of the peptide and its metal complexes was analyzed in water and in the presence of negative and positive charged membrane mimicking environments formed by sodium dodecyl sulfate (SDS) and dodecyl trimethyl ammonium chloride (DTAC) micelles. The metal coordination sphere, the metal binding affinity and stoichiometry were evaluated by combining spectroscopic and potentiometric methods. Finally we compare copper(II) interactions with human and chicken amyloidogenic fragments. Our results indicate that the chicken amyloidogenic fragment is a stronger copper ligand than the human amyloidogenic fragment.
Introduction
Prion proteins (PrPs) have been involved in diverse mammalian-TSEs: human (Creutzfeldt–Jakob disease, CJD) and animal neurodegenerative diseases (bovine spongiform encephalopathy, BSE). Their biological functions are still not well understood, nevertheless prion proteins may play an important role in copper homeostasis/transport and antioxidant activity in the brain.1,2 Prion disorders are associated with conformational changes of the cellular prion protein (PrPC) into a pathogenic, insoluble, protease-resistant and β-sheet rich isoform (Scrapie PrP or PrPSc), whose biological function is still under debate.3–8 PrPC–PrPSc conversion is characterized by the formation of neurotoxic oligomers and amyloid fibrils.It is well accepted that Cu2+ ions bind to the cellular form of human PrP (hPrPC) in vivo.9 Four Cu2+ ions are bound within the His-containing sequence, –PHGGGWGQ– that is repeated four times between residues 60–91.10–16 Two additional copper binding sites are located at His96 and His111, outside the octarepeat domain.17–25 This region, encompassing residues from 91 to 127 in hPrPC, seems to be essential for amyloid formation and infectivity of prion disease.26,27 Prion is not only a characteristic protein for mammals, it is also found in many other species including avians, fishes, reptiles and amphibians. Chicken prion protein (chPrP) was extracted from the brain of domestic fowl as a homolog of hPrP.28 chPrP shows around 30% identity with mammalian prion proteins but exhibits a very similar 3D structure.29 Despite low sequence homology, the essential features of mammalian prion proteins are also conserved in avian PrP.30
chPrP is able to interact with Cu2+ through the tandem hexapeptide (residues 53–94) and amyloidogenic (residues 105–140) regions. The repeats consist of –PHNPGY– sequences which anchor copper via His imidazoles.10,31–38 The amyloidogenic domain of chPrP shares several common features with hPrP91–127:39,40
i. They both have two His residues spaced by almost the same number of amino acids. In chPrP they correspond to His110 and His124 (Scheme 1).
ii. They have an identical hydrophobic tail (residues 113–127 and 126–140, in hPrP and chPrP respectively) of 15 amino acids rich in Ala and Gly residues (Scheme 1).
iii. They both bind two copper ions at each His residue. Either 3N1O or 4N complexes are formed at physiological pH. The formation of 3N {Nim, 2N−} or 4N {Nim, 3N−} copper species is strongly dependent on the pH value and the analyzed peptide sequences. Generally, it is well accepted that an equilibrium between 3N1O and 4N complexes is present at neutral pH for the hPrP91–127 system.17,18,41,42 In contrast, for chPrP105–140 at physiological pH, 4N species only are detected.39
It is well known that the hydrophobic 112–125 region of hPrP undergoes random coil to α-helix transition in the presence of membrane like environments (surfactant or lipid micelles) and structuring solvents.43–47 Similarly to what happens to other amyloidogenic proteins, like Aβ and αS, this structural rearrangement strongly impacts Cu2+ binding modes in terms of both donor atoms and affinity.47,48 As we recently demonstrated, the interaction of hPrP91–127 with anionic micelles facilitates simultaneous copper coordination to both His96 and His111, which on the other hand behaves as separate metal anchoring sites in the absence of micelle environment.47 Since chPrP105–140 contains the same C-terminal tail (Scheme 1) analogous structural changes are expected when this fragment interacts with micelles. In addition, this behaviour might affect Cu2+ interaction with chPrP105–140 as well.
In this work we have investigated Cu2+ binding features of the chPrP fragment spanning residues 105–140 in the presence of micelles formed by anionic sodium dodecyl sulfate (SDS) and cationic dodecyl trimethyl ammonium chloride (DTAC) surfactants. We focused on exploring the impact of the hydrophobic tail on conformation, Cu2+ binding affinity and tertiary structure of Cu2+ complexes with the amyloidogenic chPrP fragment. Copper coordination to human and avian systems was compared as well.
Experimental
Peptide synthesis and purification
The peptide was synthesized on an Activotec Activo-P11 automated peptide synthesizer with Fmoc-protected amino acids using 9-fluorenylmethoxycarbonyl (Fmoc) chemistry.49 We used a Rink-Amide resin as a solid support so that the obtained peptides are amidated at the C-terminus. The N-terminus was acetylated with a solution of 1.0 M acetic anhydride and 0.4 M diisopropylethylamine (DIEA) in N,N-dimethylformamide (DMF). Cleavage from the resin was performed by using a 90% trifluoroacetic acid (TFA) solution containing 5% thioanisole, 2% anisole and 3% ethanedithiol for 120 min. The cleaved peptide was precipitated with cold diethyl ether, dissolved in water and lyophilized. The solid was then dissolved in 10% acetic acid and purified by high-performance liquid chromatography (HPLC) on a preparative C18 column (Varian Pursuit VRs C 18) by using Varian Prostar HPLC. Peptide purification was performed with a semi-linear gradient of 0.1% TFA in water to 0.1% TFA in 9![[thin space (1/6-em)]](https://www.rsc.org/images/entities/char_2009.gif) :
:![[thin space (1/6-em)]](https://www.rsc.org/images/entities/char_2009.gif) 1 CH3CN–H2O over 45 min. Electrospray ionization mass spectrometry (ESI-MS) was used to verify the molecular mass of the synthesized peptide.
1 CH3CN–H2O over 45 min. Electrospray ionization mass spectrometry (ESI-MS) was used to verify the molecular mass of the synthesized peptide.
Potentiometric measurements
Potentiometric measurements were performed at 298 K under an argon atmosphere using a MOLSPIN pH-meter. Stability constants for both protons and Cu2+ complexes were calculated from titrations carried out over the pH range of 2–11. A total volume of 1.5 ml was used for each measurement. NaOH additions were performed by means of a 0.5 ml micrometer syringe. Before each measurement, the electrode was calibrated by titrating HCl (4.0 mM) in 40 mM SDS, 100 mM DTAC or 100 mM KCl ionic strength respectively, with a strong base.The preparation of surfactant solutions should be performed carefully. It is very important to not shake and stir the solution during dissolution in order to avoid foaming of the solution. The dissolving process of surfactants was performed by using Ultrasonic Baths at around 60 °C. The stock solution (1 M SDS or 1 M DTAC) in water was prepared and only a few microliters were added to the samples in order to achieve a final concentration of 40 mM SDS or 100 mM DTAC.
Ligand and metal complex titrations were carried out in 4.0 mM HCl water solutions containing 0.1 M KCl or 40 mM SDS or 100 mM DTAC ionic strength. During potentiometric measurements an appropriate stirring speed (medium or low) was selected to avoid foaming of the samples. For measurements in water we used a Mettler Toledo InLab semi-micro electrode. The same electrode was not employed for solutions containing SDS and DTAC, since they both form insoluble salts with K+ ions. For these reasons the KCl electrolyte in the calomel electrode was exchanged for NaCl.47,50 The ligand concentration was 0.5 mM and the Cu2+ to ligand molar ratio was 1![[thin space (1/6-em)]](https://www.rsc.org/images/entities/char_2009.gif) :
:![[thin space (1/6-em)]](https://www.rsc.org/images/entities/char_2009.gif) 1.2. The SUPERQUAD program was used for stability constant calculations.51 Reported log
1.2. The SUPERQUAD program was used for stability constant calculations.51 Reported log![[thin space (1/6-em)]](https://www.rsc.org/images/entities/char_2009.gif) β values refer to the overall equilibria:
β values refer to the overall equilibria:
| pCu + qH + rL ↔ CupHqLr | (1) |
 | (2) |
![[thin space (1/6-em)]](https://www.rsc.org/images/entities/char_2009.gif) Kstep values refer to the protonation process:
Kstep values refer to the protonation process:| CupHq−1Lr + H ↔ CupHqLr | (3) |
UV-Vis measurements
The absorption spectra were recorded on a Cary 300 Bio spectrophotometer in the 800–200 nm range. Measurements were performed on a 3.0 ml sample in a quartz cell of 1 cm path length. The final peptide concentration was 1.0 mM, the metal to ligand molar ratio was 1![[thin space (1/6-em)]](https://www.rsc.org/images/entities/char_2009.gif) :
:![[thin space (1/6-em)]](https://www.rsc.org/images/entities/char_2009.gif) 1.2. The samples were prepared in 4.0 mM HCl water solutions containing 0.1 M KCl or 40 mM SDS or 100 mM DTAC ionic strength. Data were processed using Origin 7.0.
1.2. The samples were prepared in 4.0 mM HCl water solutions containing 0.1 M KCl or 40 mM SDS or 100 mM DTAC ionic strength. Data were processed using Origin 7.0.
Circular dichroism measurements
Circular dichroism (CD) spectroscopy experiments were performed on a spectropolarimeter Jasco J-715 at 298 K in a 0.1 cm and 1 cm quartz cell. The spectral range was 185–300 and 200–800 nm, respectively. The samples were prepared in 4.0 mM HCl water solutions containing 0.1 M KCl or 40 mM SDS or 100 mM DTAC ionic strength. Ligand concentration was 1.0 mM and Cu2+ to ligand molar ratio was 1![[thin space (1/6-em)]](https://www.rsc.org/images/entities/char_2009.gif) :
:![[thin space (1/6-em)]](https://www.rsc.org/images/entities/char_2009.gif) 1.2. The direct CD measurements (θ) were converted to mean residue molar ellipticity (Δε) using Jasco SpectraManager.
1.2. The direct CD measurements (θ) were converted to mean residue molar ellipticity (Δε) using Jasco SpectraManager.
EPR spectroscopy
The EPR spectra were recorded in liquid nitrogen on a Bruker ELEXSYS E500 CW-EPR spectrometer at X-band frequency (9.5 GHz) and equipped with an ER 036TM NMR Teslameter and E41 FC frequency counter. The ligand concentration was 1 mM and the Cu2+ to ligand molar ratio was 1![[thin space (1/6-em)]](https://www.rsc.org/images/entities/char_2009.gif) :
:![[thin space (1/6-em)]](https://www.rsc.org/images/entities/char_2009.gif) 1.2. Ethylene glycol (25%) was used as a cryoprotectant for EPR measurements in water solution. The EPR parameters were obtained by simulation of plots using the Bruker WinEPR SimFonia program.
1.2. Ethylene glycol (25%) was used as a cryoprotectant for EPR measurements in water solution. The EPR parameters were obtained by simulation of plots using the Bruker WinEPR SimFonia program.
NMR measurements
NMR experiments were carried out at 298 K using a 600 MHz Bruker Advance spectrometer. NMR spectra were processed with TopSpin 3.6 software and analyzed with the program CARA.53 The suppression of the residual water signal was achieved by excitation sculpting,54 using a selective 2 ms long square pulse on water. Proton resonance assignment of chPrP105–140 was achieved by 2D NMR analysis, 1H–1H TOCSY and NOESY. The peptide was dissolved in 20 mM phosphate buffer at pH 7.4 with 10% of D2O and 40 mM SDS. The final peptide concentration was 0.8 mM. The desired concentrations of Cu2+ ions and SDS were obtained by using stock solutions of Cu(NO3)2 and deuterated SDS (Sigma Chemical Co.) in D2O.Structure calculation
NOE cross peaks in 2D 1H–1H NOESY spectra acquired on apo chPrP105–140 at 298 K were integrated with the CARA program and converted into an inter-nuclear distance list with the routine CALIBA of the program package DYANA.55 An ensemble of 300 structures were obtained by the standard protocol of simulated annealing in torsion angle space implemented in DYANA (using 10![[thin space (1/6-em)]](https://www.rsc.org/images/entities/char_2009.gif) 000 steps). No dihedral angle restraints and no hydrogen bond restraints were applied. The final structures were analyzed using the program MOLMOL.56
000 steps). No dihedral angle restraints and no hydrogen bond restraints were applied. The final structures were analyzed using the program MOLMOL.56
Results and discussion
Thermodynamic stability constants of Cu2+–chPrP complexes
The thermodynamic parameters for chPrP105–140 protonation in water, SDS and DTAC solutions are collected in Table 1. The obtained data indicate that chPrP105–140 behaves as H7L acid. The seven protonation constants correspond to consecutive proton binding to ε-amino groups of four Lys (Lys113, Lys116, Lys119 and Lys123), the phenolic group of Tyr109 and imidazole nitrogens of His110 and His124.log![[thin space (1/6-em)]](https://www.rsc.org/images/entities/char_2009.gif) β β |
log![[thin space (1/6-em)]](https://www.rsc.org/images/entities/char_2009.gif) K K |
log![[thin space (1/6-em)]](https://www.rsc.org/images/entities/char_2009.gif) β* β* |
|
|---|---|---|---|
| A | |||
| HL | 10.99(2) | 10.99 | |
| H2L | 21.49(1) | 10.50 | |
| H3L | 31.56(2) | 10.07 | |
| H4L | 41.30(1) | 9.74 | |
| H5L | 50.45(2) | 9.15 | |
| H6L | 56.94(2) | 6.49 | |
| H7L | 62.62(3) | 5.72 | |
| B | |||
| H2L | 22.97(5) | ||
| H3L | 33.99(2) | 11.02 | |
| H4L | 44.86(3) | 10.87 | |
| H5L | 54.27(3) | 9.41 | |
| H6L | 62.14(4) | 7.87 | |
| H7L | 69.07(4) | 6.93 | |
| C | |||
| HL | 10.75(2) | 10.75 | |
| H2L | 20.57(2) | 9.82 | |
| H3L | 30.43(3) | 9.86 | |
| H4L | 39.95(1) | 9.52 | |
| H5L | 48.95(3) | 9.00 | |
| H6L | 55.35(3) | 6.40 | |
| H7L | 61.04(4) | 5.69 | |
Potentiometric titrations of Cu2+–chPrP complexes in water and in the presence of SDS and DTAC micelles were carried out to evaluate the corresponding complex formation constants and the distribution diagrams (Table 2, Fig. 1). The data shown in Table 2 indicate that the same species are formed independently in the investigated environment. On the other hand, stability constants distinctly differ. CuH6L species results from His imidazole deprotonation. The difference between log![[thin space (1/6-em)]](https://www.rsc.org/images/entities/char_2009.gif) K* values (log
K* values (log![[thin space (1/6-em)]](https://www.rsc.org/images/entities/char_2009.gif) β*CuH6L − log
β*CuH6L − log![[thin space (1/6-em)]](https://www.rsc.org/images/entities/char_2009.gif) β*H6L) measured in water (4.41), SDS (5.36) and DTAC (3.87) is explained by the fact that the imidazole nitrogen atoms are more and less basic in SDS and in DTAC solutions, respectively. In addition, imidazole protonation constants greatly differ when metal bound and free peptides are compared. This behavior supports His binding to Cu2+ in all three cases. Further deprotonation results in the formation of CuH5L species in which two imidazole nitrogen atoms of His residues are deprotonated. The most significant differences are observed for log
β*H6L) measured in water (4.41), SDS (5.36) and DTAC (3.87) is explained by the fact that the imidazole nitrogen atoms are more and less basic in SDS and in DTAC solutions, respectively. In addition, imidazole protonation constants greatly differ when metal bound and free peptides are compared. This behavior supports His binding to Cu2+ in all three cases. Further deprotonation results in the formation of CuH5L species in which two imidazole nitrogen atoms of His residues are deprotonated. The most significant differences are observed for log![[thin space (1/6-em)]](https://www.rsc.org/images/entities/char_2009.gif) β* values. log
β* values. log![[thin space (1/6-em)]](https://www.rsc.org/images/entities/char_2009.gif) β* of CuH6L (5.36) and CuH5L (7.44) in SDS (Table 2B) differs by more than two units, while they are much closer for water and DTAC systems. These values strongly indicate that the Cu2+ ion coordinates to both imidazoles in the case of SDS, while only one His is bound to copper in water and DTAC solutions.
β* of CuH6L (5.36) and CuH5L (7.44) in SDS (Table 2B) differs by more than two units, while they are much closer for water and DTAC systems. These values strongly indicate that the Cu2+ ion coordinates to both imidazoles in the case of SDS, while only one His is bound to copper in water and DTAC solutions.
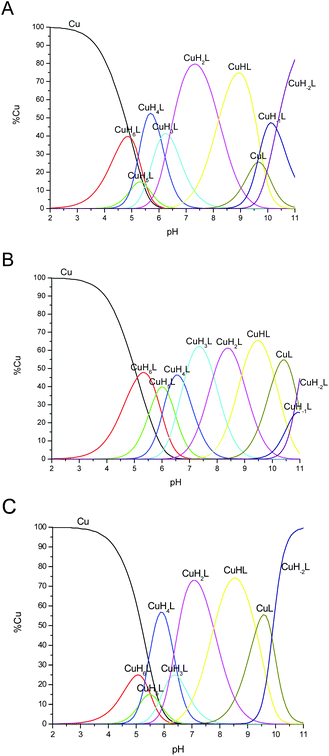 | ||
Fig. 1 Species distribution diagram for Cu2+–chPrP105–140 complexes (A) in water, (B) SDS and (C) DTAC solution at 1![[thin space (1/6-em)]](https://www.rsc.org/images/entities/char_2009.gif) : :![[thin space (1/6-em)]](https://www.rsc.org/images/entities/char_2009.gif) 1.2 Cu2+/peptide ratio; T = 298.2; cpeptide = 5 × 10⁻⁴ M. 1.2 Cu2+/peptide ratio; T = 298.2; cpeptide = 5 × 10⁻⁴ M. | ||
log![[thin space (1/6-em)]](https://www.rsc.org/images/entities/char_2009.gif) β β |
log![[thin space (1/6-em)]](https://www.rsc.org/images/entities/char_2009.gif) K K |
log![[thin space (1/6-em)]](https://www.rsc.org/images/entities/char_2009.gif) β*a β*a |
|
|---|---|---|---|
a A log![[thin space (1/6-em)]](https://www.rsc.org/images/entities/char_2009.gif) β* = log β* = log![[thin space (1/6-em)]](https://www.rsc.org/images/entities/char_2009.gif) β(CuHjL) − log β(CuHjL) − log![[thin space (1/6-em)]](https://www.rsc.org/images/entities/char_2009.gif) β(HnL) (where the index j corresponds to the number of protons in the coordinated ligand to the metal ion and n corresponds to the number of protons coordinated to the ligand). β(HnL) (where the index j corresponds to the number of protons in the coordinated ligand to the metal ion and n corresponds to the number of protons coordinated to the ligand).
|
|||
| A | |||
| CuH6L | 61.35(5) | 4.41 | |
| CuH5L | 55.81(7) | 5.51 | 5.36 |
| CuH4L | 50.87(4) | 4.94 | |
| CuH3L | 44.81(4) | 6.06 | |
| CuH2L | 38.42(5) | 6.39 | |
| CuHL | 30.22(8) | 8.20 | |
| CuL | 20.38(11) | 9.84 | |
| CuH−1L | 10.76(9) | 9.62 | |
| CuH−2L | 0.44(11) | 10.32 | |
| B | |||
| CuH6L | 67.50(4) | 5.36 | |
| CuH5L | 61.71(3) | 5.79 | 7.44 |
| CuH4L | 55.50(4) | 6.21 | |
| CuH3L | 48.71(4) | 6.79 | |
| CuH2L | 40.84(6) | 7.87 | |
| CuHL | 31.95(7) | 8.89 | |
| CuL | 21.88(8) | 10.07 | |
| CuH−1L | 10.86(9) | 11.02 | |
| CuH−2L | 0.10(10) | 10.76 | |
| C | |||
| CuH6L | 59.22(9) | 3.87 | |
| CuH5L | 53.71(9) | 5.51 | 4.76 |
| CuH4L | 48.60(5) | 5.11 | |
| CuH3L | 42.10(6) | 6.50 | |
| CuH2L | 35.90(5) | 6.20 | |
| CuHL | 28.12(8) | 7.78 | |
| CuL | 18.82(9) | 9.30 | |
| CuH−2L | −0.92(10) | ||
In addition, the distribution diagrams reported in Fig. 1 clearly show that:
(i) the pH values at which CuH4L, CuH3L, CuH2L and CuHL predominates are the highest ones in the presence of SDS micelles;
(ii) CuH5L exists as main species at pH 6.0 for SDS systems only and
(iii) DTAC micelles do not significantly influence the speciation profiles observed in water in the pH range of 4.0–9.0.
Influence of SDS and DTAC micelles on chPrP105–140 conformation
In water solution, apo and Cu2+ bound chPrP105–140 systems have CD spectra characterized by a strong negative absorption band centered around 197–200 nm, typical of random coil conformation (Fig. 1S†). In the presence of SDS micelles, CD spectra have two strong negative absorption bands at 207 and 222 nm, respectively, strongly indicating α-helix structuring of the peptide backbone (Fig. 2).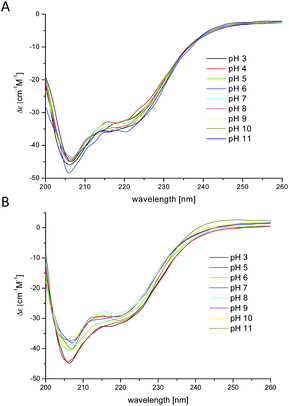 | ||
Fig. 2 CD spectra of (A) chPrP105–140 and (B) Cu2+–chPrP105–140 in 40 mM SDS solutions. 0.1 cm quartz cell, T = 298.2 K; concentration of peptide = 1 × 10⁻⁴ M, 1![[thin space (1/6-em)]](https://www.rsc.org/images/entities/char_2009.gif) : :![[thin space (1/6-em)]](https://www.rsc.org/images/entities/char_2009.gif) 1.2 Cu2+/peptide ratio. 1.2 Cu2+/peptide ratio. | ||
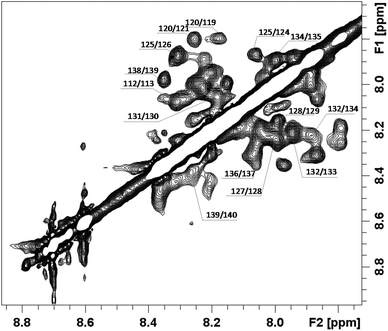
In order to better investigate the conformational behavior of the chPrP105–140 fragment in the presence of SDS, NMR studies were carried out with the final aim to determine the 3D structure. As expected, no trivial correlations were detected in NOESY spectra, strongly demonstrating the presence of an α-helix structure (Fig. 3). A structural preliminary analysis was performed by evaluating the set of inter proton distances calculated from NOEs which clearly anticipates α-helix elements between residues 120–131 (Fig. 2S†).
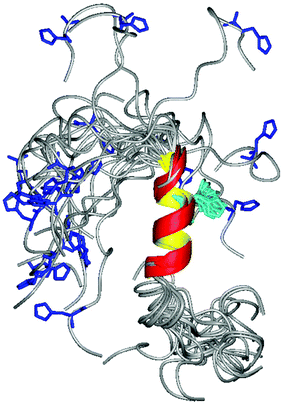
The obtained distances were then used as constraints for simulated annealing calculations by using the DYANA program. The best 20 structures are shown in Fig. 4. As expected residues 120–131 adopt a nice α helical conformation, while, the N-terminal part is still flexible and disordered. Similarly to what happened for hPrP, these structural changes strongly affect His positions as well: His110 (shown in blue) has a completely random rearrangement, while His124 (cyan) being inside the α-helix has its own defined orientation.
By considering that hPrP and chPrP amyloidogenic domains share the same hydrophobic tail and taking into account that this region is responsible for the α-helix structuring upon interaction with SDS, we expected that the two peptides possess very similar structures. However, their comparison indicates that the α-helix in chPrP includes His124 as well, while it starts immediately after His111 in hPrP. This could be due to the presence of two point mutations. In fact, the two Met present in hPrP are substituted by Phe and Val residues in chPrP (Scheme 1). Besides that, the two α-helixes are very similar (Fig. 3S†).
The effect of DTAC micelles was also investigated. Both chPrP105–140 and its copper complexes (Fig. 4S†) show prevalent random coil conformation in the pH range of 3–8. Starting from acid pH to pH 8.7 we observed a gradual shift of the CD band at 197 nm to a longer wavelength (203 nm). At pH 9.2, CD spectra begin to change dramatically to assume typical features of α-helix spectra at pH higher than 10. As shown by potentiometric measurements (see Table 1C), the deprotonation of lysine and tyrosine residues occurs at pH around 9. This may strongly impact peptide interaction with positive charged DTAC micelles, which in turn causes the observed conformational changes.
Spectroscopic features of chPrP105–140 and Cu2+–chPrP105–140 in the presence of SDS and DTAC micelles
All spectroscopic data including CD and UV-Vis experiments are presented in Table 3.![[thin space (1/6-em)]](https://www.rsc.org/images/entities/char_2009.gif) :
:![[thin space (1/6-em)]](https://www.rsc.org/images/entities/char_2009.gif) 1.2. [Cu2+] = 0001 M
1.2. [Cu2+] = 0001 M
| Species | UV-Vis | CD | ||
|---|---|---|---|---|
| λ [nm] | ε [cm−1 M−1] | λ [nm] | Δε [cm−1 M−1] | |
| H 2 O | ||||
| CuH6L | ||||
| CuH5L | 581 | 39.76 | 590 | −3.67 |
| 501 | 1.46 | |||
| 337.5 | 9.25 | |||
| 305 | −9.90 | |||
| CuH4L | 566 | 59.13 | 591 | −5.66 |
| 501.5 | 1.50 | |||
| 334.5 | 9.02 | |||
| 304 | −8.16 | |||
| CuH3L | 563 | 72.68 | 718.5 | 2.25 |
| 569 | −5.34 | |||
| 328.5 | 9.38 | |||
| 304.5 | −2.51 | |||
| CuH2L | 554 | 91.63 | 643.5 | 13.31 |
| 532.5 | −15.29 | |||
| 320.5 | 17.07 | |||
| CuHL | 549 | 106.78 | 639.5 | 18.36 |
| 534 | −19.68 | |||
| 320 | 20.92 | |||
| CuL | 540 | 118.49 | 639 | 19.82 |
| 530 | −20.61 | |||
| 321.5 | 22.37 | |||
| CuH−1L | 535 | 139.82 | 642 | 20.95 |
| 534 | −22.11 | |||
| 318.5 | 23.03 | |||
| CuH−2L | 529 | 141.69 | 641 | 21.40 |
| 533.5 | −23.48 | |||
| 318 | 22.02 | |||
| SDS | ||||
| CuH6L | ||||
| CuH5L | ||||
| CuH4L | 577 | 55.42 | 596 | −3.41 |
| 478 | 1.17 | |||
| 335.5 | 13.95 | |||
| CuH3L | 555 | 97.44 | 586 | −6.87 |
| 487 | 1.73 | |||
| 337 | 18.60 | |||
| CuH2L | 550 | 116.04 | 566 | −9.36 |
| 487 | 2.69 | |||
| 328 | 15.06 | |||
| CuHL | 538 | 144.68 | 653 | 8.27 |
| 548 | −15.47 | |||
| 324 | 19.40 | |||
| CuL | 529 | 150.55 | 649 | 12.99 |
| 543 | −18.86 | |||
| 323 | 22.64 | |||
| CuH−1L | 648.5 | 15.85 | ||
| 543 | −22.96 | |||
| 321.5 | 22.47 | |||
| CuH−2L | ||||
| DTAC | ||||
| CuH6L | ||||
| CuH5L | 565 | 32.60 | 595.5 | −4.62 |
| 338 | 7,0 | |||
| 304 | −11.03 | |||
| CuH4L | 567 | 50.48 | 589 | −7.37 |
| 502 | 0.50 | |||
| 334.5 | 8.47 | |||
| 304.5 | −11.04 | |||
| CuH3L | 563 | 66.82 | 701 | 1.12 |
| 568.5 | −6.93 | |||
| 331 | 8.49 | |||
| 305.5 | −5.30 | |||
| CuH2L | 559 | 74.64 | 658 | 5.91 |
| 547.5 | −10.20 | |||
| 326 | 11.61 | |||
| CuHL | 545 | 88.83 | 643 | 17.33 |
| 537.5 | −21.24 | |||
| 322 | 20.01 | |||
| CuL | 544 | 93.73 | 638.5 | 17.99 |
| 537 | −22.77 | |||
| 323 | 21.23 | |||
| CuH−2L | 542 | 90.54 | 634.5 | 17.89 |
| 535.5 | −22.28 | |||
| 324 | 22.22 | |||
The results obtained by spectroscopic studies (UV-Vis and CD spectra) of chPrP105–140 in water, SDS and DTAC solutions are shown in Fig. 5 and 6, respectively. The first absorptions in the UV-Vis and CD spectra appear at different pH values according to the investigated system. In particular, the first band at 580 nm is observed at pH 5.5 in the case of water and DTAC solutions, while in the presence of SDS, a pH increase of about 0.5–1.0 unit is necessary to observe the first band. This behavior is in agreement with potentiometric data showing that the pK values for the complex formed in SDS solutions are higher than those found for the analogues species in water and DTAC solutions.
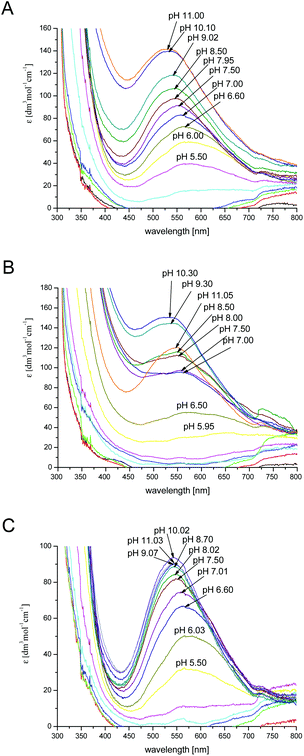 | ||
Fig. 5 UV-Vis spectra of Cu2+–chPrP105–140 in water (A), SDS (B) and DTAC (C) solutions in a 1 cm quartz cell. 1![[thin space (1/6-em)]](https://www.rsc.org/images/entities/char_2009.gif) : :![[thin space (1/6-em)]](https://www.rsc.org/images/entities/char_2009.gif) 1.2 Cu2+/peptide ratio; T = 298.2; cpeptide = 1 × 10⁻³ M. 1.2 Cu2+/peptide ratio; T = 298.2; cpeptide = 1 × 10⁻³ M. | ||
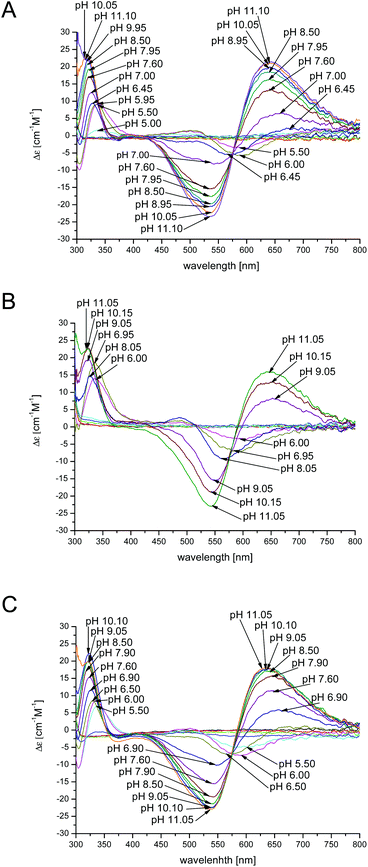 | ||
Fig. 6 CD spectra for Cu2+ complexes of the chPrP105–140 in (A) water, (B) SDS and (C) DTAC solutions in a 1 cm quartz cell. 1![[thin space (1/6-em)]](https://www.rsc.org/images/entities/char_2009.gif) : :![[thin space (1/6-em)]](https://www.rsc.org/images/entities/char_2009.gif) 1.2 Cu2+/peptide ratio; T = 298.2; cpeptide = 1 × 10⁻³ M. 1.2 Cu2+/peptide ratio; T = 298.2; cpeptide = 1 × 10⁻³ M. | ||
In water and DTAC solutions, a UV-Vis band at 580 nm (Fig. 5A and C) is visible at pH around 5.50 (CuH4L is the main species). At this pH, on the CD spectra, we also observed d–d bands at 503 and 580 nm, respectively (Fig. 6A and C). These values support a 3N donor set {1Nim, 2N−}. The involvement of imidazole and amide nitrogens is also confirmed by the characteristic charge transfer transitions detected in CD spectra (Fig. 6A and C) which are in the 310–315 nm range for N− → Cu2+ (ligand to metal charge transfer LMCT transitions originating from amide nitrogens to Cu2+) or in the 280–345 nm for Nim → Cu2+ (one LMCT transition originating from the π1 orbital of the imidazole ring to Cu2+) absorptions.57–62 The CuH3L species, which dominates at pH around 6.2 (Fig. 1A and C), has a {1Nim, 2N−} copper binding mode as well, in fact we do not observe any significant changes on the CD and UV-Vis spectra. In water and DTAC solutions, CuH2L complexes are the main species at physiological pH (Fig. 1A and C). Spectrophotometric data recorded at that pH show the shift of the d–d band from 580 to 558 nm (Fig. 5A and C), strongly supporting a {Nim, 3N−} binding mode.17,18,25,63,64 At physiological pH, the CD d–d bands at 534 and 644 nm (Fig. 6A and C) indicate additional amide coordination. This coordination mode is also conserved at higher pH (8–11), where the UV-Vis d–d bands at 550–530 nm support a 4N donor set. Additionally, the distribution of d–d bands on CD spectra does not change (Fig. 6A and C) confirming the {1Nim, 3N−} binding mode.
On the other hand, in the case of SDS, the CuH3L is the dominant species at physiological pH (Fig. 1B). At pH 7, CD spectra have (i) a positive band in a 300–360 nm range which is commonly assigned to charge transfer transitions, like N− → Cu2+ and Nim → Cu2+ and (ii) positive and negative transition bands at 490 and 590 nm, respectively (Fig. 6B). A different distribution of the d–d band is also observed in UV-Vis spectra compared to the one recorded in water and DTAC solutions (Fig. 5B). This behavior is consistent with different donor sets, which takes into account the involvement of both His imidazole nitrogens.
In order to obtain more information on the copper(II)–chPrP105–140 coordination mode at physiological pH, we also carried out EPR experiments. The results obtained from EPR spectra are in agreement with those derived from potentiometric titrations, UV-Vis and CD spectroscopy. At physiological pH, the copper coordination sphere consists of four nitrogen atoms either in water (AII = 197.5, gII = 2.20) (Fig. 7A) or DTAC solutions (AII = 200, gII = 2.20) (Fig. 7C), as indicated by the EPR parameters. In the case of SDS, EPR spectra is broadened, probably due to the effect of the detergent, nevertheless it was possible to define EPR parameters. In SDS solutions, at pH 7.20, the copper ion is anchored by two imidazole nitrogen atoms from histidine residues and one backbone amide nitrogen forming a 3N binding mode (Fig. 7B). Above pH 8, additional amide is bound causing the formation of the 4N complex {2Nim, 2N−} (Fig. 7B). Interestingly, the EPR spectrum for the complex in SDS at pH 7.20 shows the presence of two different species. One is predominant and was described above (3N binding mode), but it was also possible to determine EPR parameters for the second (AII = 157.5, gII = 2.28), which indicate a 2N coordination sphere (less nitrogen content in the equatorial coordination shell). This might represent a Cu2+ ion bound to the two His residues, one of them being one (H111) inserted in the α-helical structure. The distribution diagram (Fig. 1B) clearly shows that at pH 7.20 two species occur (CuH3L and CuH2L), but the predominant one is CuH3L, which indicates that three nitrogen atoms are involved in the copper coordination sphere (3N).
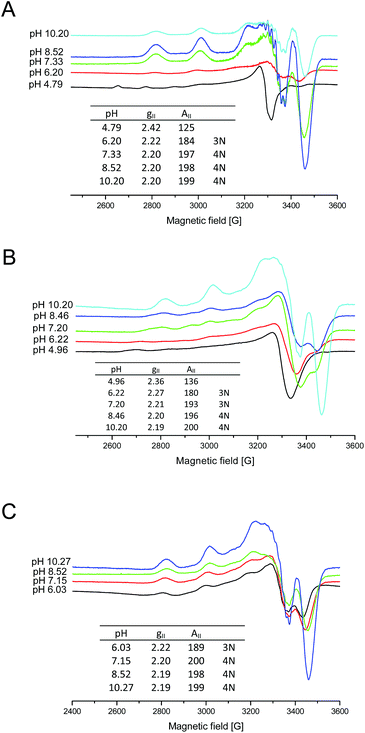 | ||
Fig. 7 X-band EPR spectra of 1![[thin space (1/6-em)]](https://www.rsc.org/images/entities/char_2009.gif) : :![[thin space (1/6-em)]](https://www.rsc.org/images/entities/char_2009.gif) 1.2 Cu2+–chPrP105–140 frozen (A) water, (B) SDS and (C) DTAC solutions. cpeptide = 1 × 10⁻³ M. 1.2 Cu2+–chPrP105–140 frozen (A) water, (B) SDS and (C) DTAC solutions. cpeptide = 1 × 10⁻³ M. | ||
The progressive decrease of hyperfine splitting passing from EPR spectra in water, DTAC and SDS solutions supports a major involvement of amide nitrogen atoms in water and DTAC compared to SDS, where the binding of His imidazole is preferred. Nevertheless, comparing the EPR spectra at physiological pH (Fig. 5S†), we noticed that SDS micelles cause the simultaneous presence of different metal bound species. Additionally, in all of the EPR measurement range (0–5000 G), we do not observe any dimeric and bis-complex species.
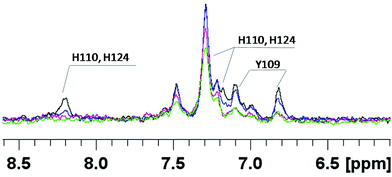
In order to get more details of copper coordination to chPrP in the presence of SDS micelles, the induced copper line broadening effects on NMR spectra were analyzed as well. 1H titration experiments, recorded by increasing metal concentration, show that the most affected signals belong to both His (His110 and His124) and Tyr109 residues (Fig. 8). Upon the addition of 0.2 Cu2+ eq., their intensities decrease and completely vanish in the presence of a higher amount of the paramagnetic ions. Similar results are evident by comparing the 1H–1H TOCSY spectra of chPrP105–140 in the absence and in the presence of Cu2+ ions (Fig. 9). The cross-peaks belonging to Tyr109 and His110 are so broadened and can hardly be observed. Effects on Trp115 and His124 are visible as well. These findings strongly support metal binding to both His imidazoles. In addition the effects detected on the Tyr109 aromatic ring suggest its stabilizing role on copper complexation, similarly to what was observed in water solutions.39,65
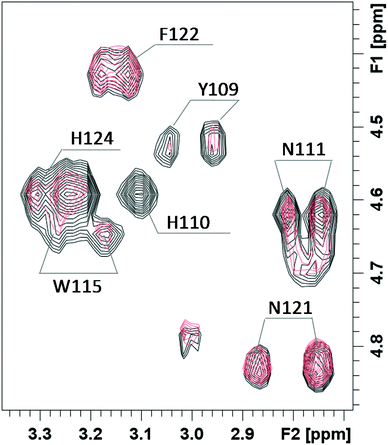 | ||
| Fig. 9 Selected region of 1H–1H TOCSY spectra of chPrP105–140 0.5 mM pH = 7.5, SDS 40 mM, T = 298, before (black) and after the addition of 0.2 equivalents of Cu2+ (pink). | ||
Cu2+ binding to chPrp105–133 in water was extensively investigated some years ago,39 the reported results indicated that the main copper binding site at physiological pH is located at His110 and it has a {Nim, 3N−} donor set. Our findings are in good agreement with this study. However, the comparison of the thermodynamic parameters obtained for the two copper complexes points out that the longest peptide, chPrP105–140, is a stronger ligand for Cu2+ in all of the pH range (Fig. 10), suggesting that the hydrophobic tail plays some stabilization effect on metal ion binding. Finally we compared the copper binding ability of human (hPrP91–127)47 and chicken (chPrP105–140) systems. Our findings indicate that chPrP105–140 is a better copper ligand than hPrP91–127 both in water and SDS solutions (Fig. 11). The chPrP105–140 fragment binds about 70% of Cu2+ at physiological pH. This behavior is possibly due to copper interaction with the aromatic ring of Tyr109, absent in the human PrP amyloidogenic sequence.
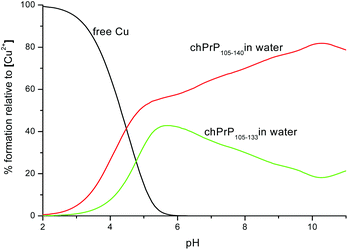 | ||
| Fig. 10 Competition diagram between Cu2+–chPrP105–140 and Cu2+–chPrP105–133 complexes. [Cu2+] = [chPrP105–140] = [chPrP105–133] = 1 × 10⁻³ M. | ||
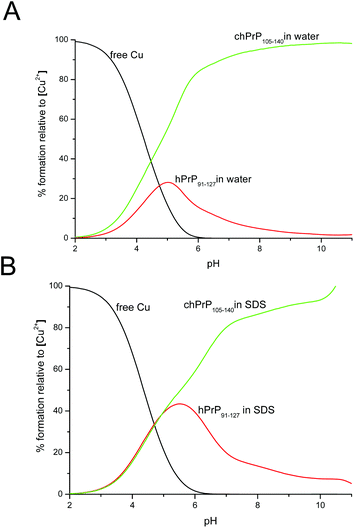 | ||
| Fig. 11 Competition diagram between Cu2+–chPrP105–140 and Cu2+–hPrP91–127 complexes in (A) H2O solution and (B) SDS micelles. [Cu2+] = [chPrP105–140] = [hPrP91–127] = 1 × 10⁻³ M. | ||
Conclusions
Prion proteins do not only occur in mammalian species. They are present in avians, fishes, reptiles and amphibians. Both hPrP91–127 and chPrP105–140 amyloidogenic regions strongly bind Cu2+ ions. For both systems His residues act as independent anchoring sites for metal coordination. The two binding modes are differently populated, being the N-terminal and C-terminal imidazoles the preferred binding domain for avian and human PrP respectively.17,39,40 On the other hand, we recently investigated that both His residues are contemporaneously coordinated to Cu2+ ions when hPrP91–127 interacts with SDS micelles.47In the present paper, we have studied copper(II) binding to the chPrP105–140 fragment to clarify the role played by the two His residues (H110 and H124) in the presence of anionic and cationic micelles. In fact, the metal binding mode observed at the N-terminal site (His110) might not be perturbed by SDS interaction at the C-terminal region. However, our findings clearly indicate that, for hPrP91–127, simultaneous or independent Cu2+ coordination His is strongly dependent on the α-helix conformation of the amyloidogenic PrP regions. At physiological pH, CD and UV-Vis absorption spectroscopy strongly support a {Nim, 3N−} binding mode in water and DTAC solutions (random coil) while a {2Nim, 2N−} copper donor set is suggested in SDS solutions (α-helix). The main chain nitrogens bound to copper belong to residues close to His110 imidazole, like His110 and Tyr109 amides. In fact, the rigid α-helix rearrangement around His124, probably hampers the binding of amide nitrogens which require the formation of five membered macrochelate rings.
In SDS micelles, near UV CD spectra and NMR analysis show nice helicoidal structuring of the peptide backbone (elements between residues 120–131), while in water solution, chPrP105–140 systems have CD spectra characterized by random coil conformation. The same results were observed for human analogues. Additionally, cationic micelles also cause the formation of the α-helix structure but at pH above 9.
One of the visible differences between human and chicken amyloidogenic sequences is the presence of a tyrosine residue in the chPrP105–140 fragment (Scheme 1). Our NMR findings point out that the most affected signals belong to both His (His110 and His124) and Tyr109 residues. The effects observed on the Tyr109 aromatic ring suggest its stabilizing role on copper ion binding and might explain the higher stability of chicken protein fragment complexes detected at pH higher than 5.5 (Fig. 11).
By bearing in mind that (i) the hPrP amyloidogenic region, considered critical for PrPC–PrPSc conformational transition, is highly conserved in chPrP and (ii) copper binding to the His111 site of the hPrP amyloidogenic region reduces the natural tendency of apo peptides to adopt β-sheet conformation, which on the contrary is stabilized by multi His binding,66 we might hypothesize a different impact of Cu2+ on hPrP and chPrP aggregation propensities according to the protein environment. Upon SDS interaction, Cu2+ coordination to both His sites might lead to the formation of a hairpin structure in both peptides, which in turn might stabilize the β-sheet structure. On the other hand, the different preferred His anchoring points found in hPrP and chPrP water solutions might result in different effects.39 The close proximity of the His binding site to the hydrophobic region in hPrP only, might induce different conformational changes in the two proteins, favoring or disfavoring the formation of fibrillar structures.
Interestingly, a comparison between the thermodynamic parameters obtained for the two copper complexes of chPrP105–133 and chPrP105–140 respectively, reveal that the longest peptide is a stronger ligand for Cu2+ for the whole pH range. This suggests that the hydrophobic tail may play some stabilization effect on metal ion binding.
Acknowledgements
This work was supported by the Italian MIUR, through the PRIN (Programmi di Ricerca di Rilevante Interesse Nazionale) projects, 2010 M2JARJ_004 and 2015 T778JW_003, by MNiSW (Ministerstwo Nauki i Szkolnictwa Wyższego) project 0420/1859/16. The CIRMMP and CIRCMSB are also gratefully acknowledged.References
- E. Gaggelli, H. Kozlowski, D. Valensin and G. Valensin, Chem. Rev., 2006, 106, 1995–2044 CrossRef CAS PubMed.
- H. Kozlowski, M. Luczkowski and M. Remelli, Dalton Trans., 2010, 39, 6371–6385 RSC.
- S. B. Prusiner, Science, 1982, 216, 136–144 CAS.
- A. Aguzzi and M. Heikenwalder, Nature, 2003, 423, 127–129 CrossRef CAS PubMed.
- C. Weissmann, Nature, 1991, 352, 679–683 CrossRef CAS PubMed.
- B. Oesch, D. Westaway, M. Walchli, M. P. McKinley, S. B. H. Kent, R. Aebersold, R. A. Barry, P. Tempst, D. B. Teplow, L. E. Hood, S. B. Prusiner and C. Weissmann, Cell, 1985, 40, 735–746 CrossRef CAS PubMed.
- D. R. Borchelt, M. Scott, A. Taraboulos, N. Stahl and S. B. Prusiner, J. Cell Biol., 1990, 110, 743–752 CrossRef CAS PubMed.
- D. R. Borchelt, A. Taraboulos and S. B. Prusiner, J. Biol. Chem., 1992, 267, 16188–16199 CAS.
- D. R. Brown, K. F. Qin, J. W. Herms, A. Madlung, J. Manson, R. Strome, P. E. Fraser, T. Kruck, A. vonBohlen, W. SchulzSchaeffer, A. Giese, D. Westaway and H. Kretzschmar, Nature, 1997, 390, 684–687 CrossRef CAS PubMed.
- M. P. Hornshaw, J. R. McDermott, J. M. Candy and J. H. Lakey, Biochem. Biophys. Res. Commun., 1995, 214, 993–999 CrossRef CAS PubMed.
- J. Stockel, J. Safar, A. C. Wallace, F. E. Cohen and S. B. Prusiner, Biochemistry, 1998, 37, 7185–7193 CrossRef CAS PubMed.
- J. H. Viles, F. E. Cohen, S. B. Prusiner, D. B. Goodin, P. E. Wright and H. J. Dyson, Proc. Natl. Acad. Sci. U. S. A., 1999, 96, 2042–2047 CrossRef CAS.
- K. F. Qin, D. S. Yang, Y. Yang, M. A. Chishti, L. J. Meng, H. A. Kretzschmar, C. M. Yip, P. E. Fraser and D. Westaway, J. Biol. Chem., 2000, 275, 19121–19131 CrossRef CAS PubMed.
- E. Aronoff-Spencer, C. S. Burns, N. I. Avdievich, G. J. Gerfen, J. Peisach, W. E. Antholine, H. L. Ball, F. E. Cohen, S. B. Prusiner and G. L. Millhauser, Biochemistry, 2000, 39, 13760–13771 CrossRef CAS PubMed.
- G. S. Jackson, I. Murray, L. L. P. Hosszu, N. Gibbs, J. P. Waltho, A. R. Clarke and J. Collinge, Proc. Natl. Acad. Sci. U. S. A., 2001, 98, 8531–8535 CrossRef CAS PubMed.
- C. S. Burns, E. Aronoff-Spencer, G. Legname, S. B. Prusiner, W. E. Antholine, G. J. Gerfen, J. Peisach and G. L. Millhauser, Biochemistry, 2003, 42, 6794–6803 CrossRef CAS PubMed.
- E. Gralka, D. Valensin, E. Porciatti, C. Gajda, E. Gaggelli, G. Valensin, W. Kamysz, R. Nadolny, R. Guerrini, D. Bacco, M. Remelli and H. Kozlowski, Dalton Trans., 2008, 5207–5219 RSC.
- F. Berti, E. Gaggelli, R. Guerrini, A. Janicka, H. Kozlowski, A. Legowska, H. Miecznikowska, C. Migliorini, R. Pogni, M. Remelli, K. Rolka, D. Valensin and G. Valensin, Chem. – Eur. J., 2007, 13, 1991–2001 CrossRef CAS PubMed.
- C. E. Jones, S. R. Abdelraheim, D. R. Brown and J. H. Viles, J. Biol. Chem., 2004, 279, 32018–32027 CrossRef CAS PubMed.
- M. Klewpatinond and J. H. Viles, Biochem. J., 2007, 404, 393–402 CrossRef CAS PubMed.
- G. Di Natale, G. Grasso, G. Impellizzeri, D. La Mendola, G. Micera, N. Mihala, Z. Nagy, K. Osz, G. Pappalardo, V. Rigo, E. Rizzarelli, D. Sanna and I. Sovago, Inorg. Chem., 2005, 44, 7214–7225 CrossRef CAS PubMed.
- M. Klewpatinond, P. Davies, S. Bowen, D. R. Brown and J. H. Viles, J. Biol. Chem., 2008, 283, 1870–1881 CrossRef CAS PubMed.
- R. Srikanth, J. Wilson, C. S. Burns and R. W. Vachet, Biochemistry, 2008, 47, 9258–9268 CrossRef CAS PubMed.
- G. L. Millhauser, in Annual Review of Physical Chemistry, Annual Reviews, Palo Alto, 2007, vol. 58, pp. 299–320 Search PubMed.
- K. Osz, Z. Nagy, G. Pappalardo, G. Di Natale, D. Sanna, G. Micera, E. Rizzarelli and I. Sovago, Chem. – Eur. J., 2007, 13, 7129–7143 CrossRef PubMed.
- P. Walsh, K. Simonetti and S. Sharpe, Structure, 2009, 17, 417–426 CrossRef CAS PubMed.
- V. Bonetto, T. Massignan, R. Chiesa, M. Morbin, G. Mazzoleni, L. Diomede, N. Angeretti, L. Colombo, G. Forloni, F. Tagliavini and M. Salmona, J. Biol. Chem., 2002, 277, 31327–31334 CrossRef CAS PubMed.
- D. A. Harris, D. L. Falls, F. A. Johnson and G. D. Fischbach, Proc. Natl. Acad. Sci. U. S. A., 1991, 88, 7664–7668 CrossRef CAS.
- L. Calzolai, D. A. Lysek, D. R. Perez, P. Guntert and K. Wuthrich, Proc. Natl. Acad. Sci. U. S. A., 2005, 102, 651–655 CrossRef CAS PubMed.
- E. M. Marcotte and D. Eisenberg, Biochemistry, 1999, 38, 667–676 CrossRef CAS PubMed.
- A. P. Garnett and J. H. Viles, J. Biol. Chem., 2003, 278, 6795–6802 CrossRef CAS PubMed.
- M. P. Hornshaw, J. R. McDermott and J. M. Candy, Biochem. Biophys. Res. Commun., 1995, 207, 621–629 CrossRef CAS PubMed.
- P. Stanczak, P. Juszczyk, Z. Grzonka and H. Kozlowski, FEBS Lett., 2007, 581, 4544–4548 CrossRef CAS PubMed.
- S. B. Shields and S. J. Franklin, J. Inorg. Biochem., 2007, 101, 783–788 CrossRef CAS PubMed.
- P. Stanczak, D. Valensin, P. Juszczyk, Z. Grzonka, C. Migliorini, E. Molteni, G. Valensin, E. Gaggelli and H. Kozlowski, Biochemistry, 2005, 44, 12940–12954 CrossRef CAS PubMed.
- P. Stanczak, D. Valensin, P. Juszczyk, Z. Grzonka, G. Valensin, F. Bernardi, E. Molteni, E. Gaggelli and H. Kozlowski, Chem. Commun., 2005, 3298–3300 RSC.
- D. La Mendola, R. P. Bonomo, G. Impellizzeri, G. Maccarrone, G. Pappalardo, A. Pietropaolo, E. Rizzarelli and V. Zito, J. Biol. Inorg. Chem., 2005, 10, 463–475 CrossRef CAS PubMed.
- L. Redecke, W. Meyer-Klaucke, M. Koker, J. Clos, D. Georgieva, N. Genov, H. Echner, H. Kalbacher, M. Perbandt, R. Bredehorst, W. Voelter and C. Betzel, J. Biol. Chem., 2005, 280, 13987–13992 CrossRef CAS PubMed.
- E. Gralka, D. Valensin, K. Gajda, D. Bacco, L. Szyrwiel, M. Remelli, G. Valensin, W. Kamasz, W. Baranska-Rybak and H. Kozlowski, Mol. BioSyst., 2009, 5, 497–510 RSC.
- C. Migliorini, E. Porciatti, M. Luczkowski and D. Valensin, Coord. Chem. Rev., 2012, 256, 352–368 CrossRef CAS.
- L. Rivillas-Acevedo, R. Grande-Aztatzi, I. Lomeli, J. E. Garcia, E. Barrios, S. Teloxa, A. Vela and L. Quintanar, Inorg. Chem., 2011, 50, 1956–1971 CrossRef CAS PubMed.
- C. Hureau, L. Charlet, P. Dorlet, F. Gonnet, L. Spadini, E. Anxolabehere-Mallart and J. J. Gierd, J. Biol. Inorg. Chem., 2006, 11, 735–744 CrossRef CAS PubMed.
- E. Ragg, F. Tagliavini, P. Malesani, L. Monticelli, O. Bugiani, G. Forloni and M. Salmona, Eur. J. Biochem., 1999, 266, 1192–1201 CrossRef CAS PubMed.
- S. Sauve, D. Buijs, G. Gingras and Y. Aubin, J. Biol. Chem., 2012, 287, 1915–1922 CrossRef CAS PubMed.
- G. Di Natale, G. Impellizzeri and G. Pappalardo, Org. Biomol. Chem., 2005, 3, 490–497 CAS.
- M. Inayathullah, K. S. Satheeshkumar, A. V. Malkovskiy, A. L. Carre, S. Sivanesan, J. O. Hardesty and J. Rajadas, PLoS One, 2013, 8, 12 Search PubMed.
- A. Hecel, C. Migliorini, D. Valensin, M. Luczkowski and H. Kozlowski, Dalton Trans., 2015, 44, 13125–13132 RSC.
- A. Hecel, R. DeRicco and D. Valensin, Coord. Chem. Rev., 2016, 327–328, 8–19 CrossRef CAS.
- G. B. Fields and R. L. Noble, Int. J. Pept. Protein Res., 1990, 35, 161–214 CrossRef CAS PubMed.
- W. Bal, H. Kozlowski, M. Lisowski, L. Pettit, R. Robbins and A. Safavi, J. Inorg. Biochem., 1994, 55, 41–52 CrossRef CAS PubMed.
- P. Gans, A. Sabatini and A. Vacca, J. Chem. Soc., Dalton Trans., 1985, 1195–1200 RSC.
- L. Alderighi, P. Gans, A. Ienco, D. Peters, A. Sabatini and A. Vacca, Coord. Chem. Rev., 1999, 184, 311–318 CrossRef CAS.
- R. W. K. Keller, http://www.nmr.ch.
- T. L. Hwang and A. J. Shaka, J. Magn. Reson., 1998, 135, 280–287 CrossRef CAS PubMed.
- P. Guntert, C. Mumenthaler and K. Wuthrich, J. Mol. Biol., 1997, 273, 283–298 CrossRef CAS PubMed.
- R. Koradi, M. Billeter and K. Wuthrich, Journal of Molecular Graphics, 1996, 14, 51–55 CrossRef CAS PubMed.
- T. G. Fawcett, E. E. Bernaducci, K. Krogh-Jespersen and H. J. Schugar, Journal American Chemical Society, 1980, 102, 2598–2604 CrossRef CAS.
- E. E. Bernaducci, W. F. Schwindinger, J. L. Hughey Iv, K. Krogh-Jespersen and H. J. Schugar, Journal American Chemical Society, 1981, 103, 1686–1691 CrossRef.
- B. Belosi, E. Gaggelli, R. Guerrini, H. Kozlowski, M. Luczkowski, F. M. Mancini, M. Remelli, D. Valensin and G. Valensin, ChemBioChem, 2004, 5, 349–359 CrossRef CAS PubMed.
- G. Pappalardo, G. Impellizzeri, R. P. Bonomo, T. Campagna, G. Grasso and M. G. Saita, New J. Chem., 2002, 26, 593–600 RSC.
- P. G. Daniele, E. Prenesti and G. Ostacoli, J. Chem. Soc., Dalton Trans., 1996,(15), 3269–3275 RSC.
- T. Kowalik-Jankowska, H. Kozlowski, E. Farkas and I. Sovago, Nickel Ion Complexes of Amino Acids and Peptides, in Metal Ions in Life Sciences, ed. A. Sigel, H. Sigel and R. K. O. Sigel, Wiley & Sons, Chichester, U.K., 2007, vol. 2, pp. 63–108 Search PubMed.
- M. Remelli, D. Valensin, D. Bacco, E. Gralka, R. Guerrini, C. Migliorini and H. Kozlowski, New J. Chem., 2009, 33, 2300–2310 RSC.
- M. Remelli, D. Valensin, L. Toso, E. Gralka, R. Guerrini, E. Marzola and H. Kozlowski, Metallomics, 2012, 4, 794–806 RSC.
- D. Valensin, K. Gajda, E. Gralka, G. Valensin, W. Kamysz and H. Kozlowski, J. Inorg. Biochem., 2010, 104, 71–78 CrossRef CAS PubMed.
- C. Migliorini, A. Sinicropi, H. Kozlowski, M. Luczkowski and D. Valensin, J. Biol. Inorg. Chem., 2014, 19, 635–645 CrossRef CAS PubMed.
Footnote |
| † Electronic supplementary information (ESI) available: CD spectra of chPrP105–140 and Cu2+–chPrP105–140 in water solutions, CD spectra of chPrP105–140 and Cu2+–chPrP105–140 in DTAC solutions, survey of the NMR derived proton–proton constraints characterizing the chPrP105–140 fragment in SDS micelles, comparison of the NMR structure of human and chicken PrP amyloidogenic fragments in SDS micelles. See DOI: 10.1039/c7dt01069a |
| This journal is © The Royal Society of Chemistry 2017 |


