
 Open Access Article
 This Open Access Article is licensed under a Creative Commons Attribution-Non Commercial 3.0 Unported Licence
Ruthenium(II) p-cymene complexes of a benzimidazole-based ligand capable of VEGFR2 inhibition: hydrolysis, reactivity and cytotoxicity studies†
Sudipta
Bhattacharyya
 ,
Kallol
Purkait
and
Arindam
Mukherjee
*
,
Kallol
Purkait
and
Arindam
Mukherjee
*
Department of Chemical Sciences, Indian Institute of Science Education and Research Kolkata, Mohanpur Campus, Mohanpur, Nadia-741246, West Bengal, India. E-mail: a.mukherjee@iiserkol.ac.in
First published on 5th June 2017
Abstract
The design of Ru or other metal-based anticancer agents may achieve better and faster optimization if the ligands used are also designed to have standalone functions. In this scenario, even after dissociation from the metal complex under adverse conditions, the ligand would have anti-cancer properties. In our work, we have generated a bispyrazole-containing benzimidazole ligand with potency against vascular endothelial growth factor receptor 2 (VEGFR2), which is known to have roles in vasculogenesis/angiogenesis. This ligand was used to obtain ternary Ru(II) p-cymene complexes with the formulations [(η6-p-cymene)Ru(HL)(Cl)](Cl) (1), [(η6-p-cymene)Ru(HL)(Br)](Br) (2) and [(η6-p-cymene)Ru(HL)(I)](I) (3). 1H NMR data supports that hydrolysis of the complex is governed by halide substitution, and the extent of hydrolysis followed the trend 3 > 1 > 2. All the complexes have low affinity towards DNA bases (average Kb ∼ 103 M−1 for CT DNA); however, all the complexes are cytotoxic in nature, with IC50 values less than 15 μM. The presence of excess glutathione (GSH) liberates HL from the complexes in solution. The ability of the Ru complex to impair mitochondrial function and reduce the cellular GSH pool is thought to be the reason that it retains activity in the presence of GSH despite the ability of GSH to degrade the complexes. The chloride analogue 1 shows the best in vitro cytotoxicity against a prostate cancer cell line (LNCaP), with an IC50 of 6.4 μM. The complexes show anti-proliferative activity by the mitochondria-mediated intrinsic apoptotic pathway. Docking studies showed that HL has high affinity towards vascular endothelial growth factor receptor 2 (VEGFR2). The complexes show anti-metastatic activity (in vitro) at almost non-toxic dosages, and the effect is sustained even 48 h after removal of the complexes from the culture media.
Introduction
RuII complexes are well-investigated anticancer agents whose mechanism of action is being probed.1 Research on Ru(II/III) complexes has disseminated much important information regarding the cytotoxicity of these complexes, viz. (i) interference of Ru with Fe metabolism,2–4 (ii) availability of different oxidation states, (iii) slow kinetics of various RuII/III complexes with different biological targets (viz. DNA, protein, etc.), and (iv) tuning of reactivity and mechanistic pathways by varying the bidentate ligands, arenes and halides. A few Ru(III) compounds, [ImH]trans-[RuCl4(Im)(dmso-S)] (NAMI-A, Im = imidazole), [IndH]trans-[RuCl4(Ind)2] (KP1019, Ind = 1H-indazole), and [Na]trans-[RuCl4(Ind)2] (NKP1339), have progressed to clinical trials.5–10 The ruthenium arene PTA (RAPTA) complexes (where PTA = 1,3,5-triaza-7-phosphatricyclo-[3.3.1.1]decane) are a potent class of complexes that have been studied in detail and exhibit excellent activity against metastasis and angiogenesis.11–13 Among other Ru(II) organometallic half-sandwich ternary complexes, Ru(II)-p-cymene complexes are targeted by many research groups because of their high cytotoxicity, photoactivity, and resistance to glutathione (GSH);8,11,14–34 also, these compounds enable the introduction of new bidentate ligands while retaining a labile halide attached to the metal centre. In addition, in few cases, changing the halide also alters the pathway of action.35,36Thus, the design of a bidentate ligand that would promote therapeutic effects may be of great benefit for better and quicker optimization of such compounds. In addition, even if the complex dissociates in the cell under adverse conditions, the ligand would exhibit the potential to open up multiple pathways of action against cancer.37–39 From this standpoint, we investigated bispyrazole-benzimidazole-based ligands to design a ligand that would inhibit vascular endothelial growth factor receptor 2 (VEGFR2).
Cancer becomes a greater threat when it spreads from its origin to various areas of the body by the lymph system or the bloodstream (metastasis). The spread is followed by the growth and development of blood and lymphatic vessels, known as vasculogenesis/angiogenesis. Vascular endothelial growth factors (VEGFs) stimulate vasculogenesis/angiogenesis. VEGFs bind to three types of VEGF receptors (VEGFR1-3) in their tyrosine kinase domains. Among these, inhibition of VEGFR2 is a prime target to inhibit angiogenesis; a successful clinical drug in this regard is axitinib. There are many molecules in clinical trials, viz. Rumacinib (NCT00627042), Foretinib (NCT00725764) and Lucitanib (NCT02109016), with the same mechanism.
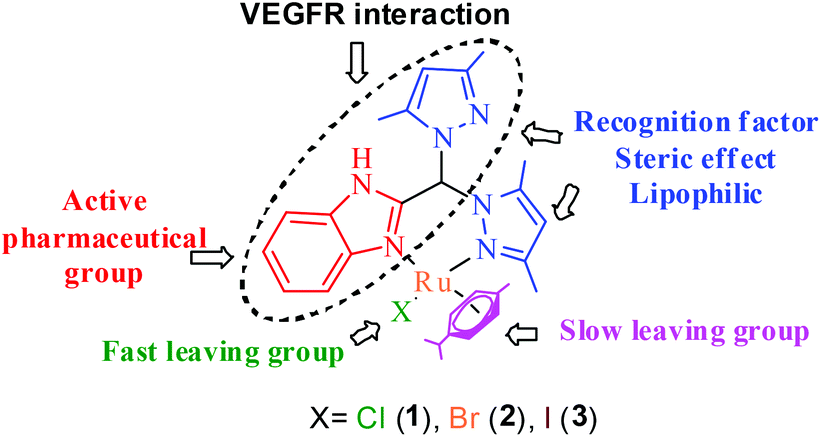
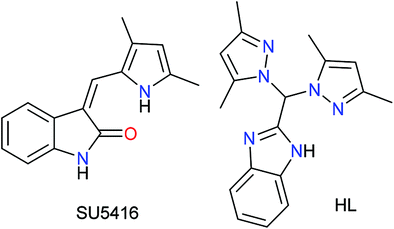
The above idea provided us with the impetus to design Ru(II) complexes (Chart 1) with the formulations [(η6-p-cymene)Ru(HL)(Cl)](Cl) (1), [(η6-p-cymene)Ru(HL)(Br)](Br) (2) and [(η6-p-cymene)Ru(HL)(I)](I) (3) using a bispyrazole-benzimidazole ligand (HL) with potential to inhibit VEGFR2. The design of the benzimidazole-containing bispyrazole ligand (HL) was inspired by the known VEGFR2 inhibitor SU5416,40 as demonstrated in Scheme 1. Bis-pyrazole Ru(II) complexes are seldom studied for their anticancer activity. Recent studies have shown their potential against topoisomerase-II41 and demonstrated their cytotoxicity against cancer.42 Ru(II) p-cymene complexes of benzimidazole-containing ligands are active anti-cancer agents.28,29,43–48 However, the detailed mechanism of action has been probed for only a few Ru(II) p-cymene complexes bearing benzimidazole ligands.28,48–51 The well-characterized complexes (1–3) were studied for their hydrolytic behaviour, the effects of their halides, and their reactivities in the presence and absence of glutathione. The cytotoxicities and the pathways of action of the complexes were probed.
 | ||
| Chart 1 A general representation of the design of Ru(II) metal complexes. | ||
 | ||
| Scheme 1 Representative structure of SU5416 and our ligand (HL). | ||
Results and discussion
Syntheses
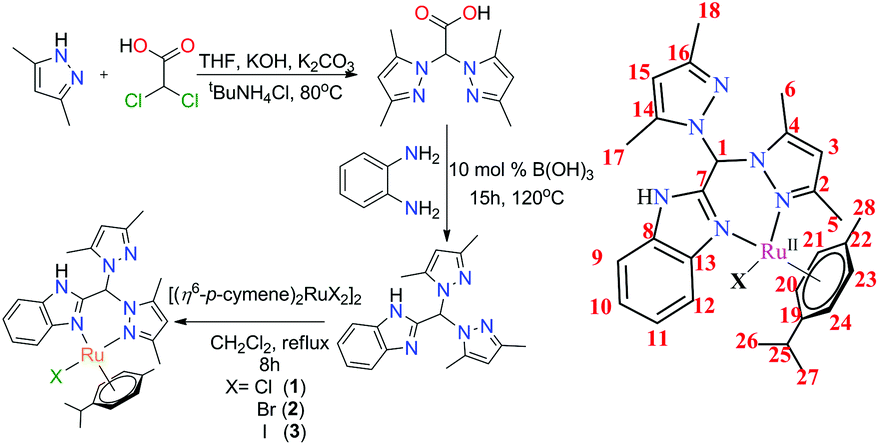
The benzimidazole-based ligand (HL) was synthesized using a literature procedure.52 Because o-phenylenediamine is one of the synthetic precursors, special care was taken to protect it from photo-degradation. It must be noted that during the last step of ligand synthesis, while extracting the ligand from excess hexane containing toluene, the ligand adhered to the surface of the vessel; however, allowing the mixture to stand for an hour with stirring allowed the microcrystalline compound to be readily isolated. After that, further washing with hexane followed by vacuum drying afforded ligand that was sufficiently pure for the syntheses of the complexes and other analytical purposes.The Ru(II) complexes were prepared from HL using different halide-based Ru(II)(p-cymene) salts prepared from the [(η6-p-cymene)2RuCl2]2 precursor (Scheme 2).18 The reactions were performed in dry dichloromethane under reflux conditions with ligand and metal precursor in a 1![[thin space (1/6-em)]](https://www.rsc.org/images/entities/char_2009.gif) :1 mole ratio. The respective obtained complexes were dried and washed successively with hexane and diethyl ether to eliminate any excess ligand. The complexes were then re-dissolved in DCM and again precipitated by addition of hexane. The microcrystalline complexes thus obtained were pure enough for all studies, as per the characterization data. Hence, in the respective complexes, the coordinated halide and the counter anion are the same.
:1 mole ratio. The respective obtained complexes were dried and washed successively with hexane and diethyl ether to eliminate any excess ligand. The complexes were then re-dissolved in DCM and again precipitated by addition of hexane. The microcrystalline complexes thus obtained were pure enough for all studies, as per the characterization data. Hence, in the respective complexes, the coordinated halide and the counter anion are the same.
 | ||
| Scheme 2 Synthetic scheme of the ligand and its metal complexes. | ||
Characterizations
The ligand (HL) and the metal complexes (1–3) were analysed extensively using 1H and 13C NMR experiments (Fig. S1–S11†). The change in chemical environment upon complexation was evident from their chemical shift values (tabulated in Tables S1 and S2† for 1–3). A significant change in the chemical shift of the proton signal of the non-coordinated benzimidazole –NH was found upon complexation because the –NH proton is deshielded due to the coordination of the neighbouring nitrogen with Ru(II). The complexation with Ru(II) and the difference in proximity of the p-cymene moiety to the ring protons of benzimidazole and pyrazole altered the symmetry of HL. This was evident from the new 1H signals arising from the benzene and pyrazole rings. The C5 methyl protons of the pyrazole ring appeared to be more deshielded than the C6 methyl protons due to their proximity to Ru(II) (Table S1†). Asymmetry in the complex is reflected in the proton signals of the p-cymene aromatic –CH protons, which appeared as four doublets.53 Apart from that, the downfield shift of the aromatic pyrazole –CH (H3, H15) protons suggests a decrease in electron density upon coordination. The appearance of H3 at a lower ppm is indicative of coordinated pyrazole in the metal complexes (Fig. 1). Aromatic H10 and H11 share almost equal electron density; therefore, they appear in the same position with their respective multiplicities. The effect of metal coordination is again evident from the lower field shift of H12 and is in proximity to the bound nitrogen of the benzimidazole ring. The H9 of the aromatic ring is involved in H-bonding with the counter halide; thus, it shows halide dependency in its chemical shift. The decrease in the electronegativity of the halide on moving from 1 to 3 resulted in upfield shifts of the p-cymene aromatic –CH protons. The shift of the –CH proton of H1 seems quite ambiguous because from 1 to 2, the peak shifts to a low field but suddenly moves upfield again in the case of 3. This phenomenon may be explained by both the stereoelectronic and H-bonding factors governing the geometry of the complexes. The twisting of the –CH proton at C1 is basically driven by the extent of electron donation from the ruthenium centre and the twisting around C1. Therefore, we observed a upfield peak shift of H1 from 8.01 to 7.91 ppm from 1 to 2; however, in the case of 3, there is an almost negligible downfield shift from 2 due to this twisting and the electronegativity of iodide (Tables S1, S4 and S8†).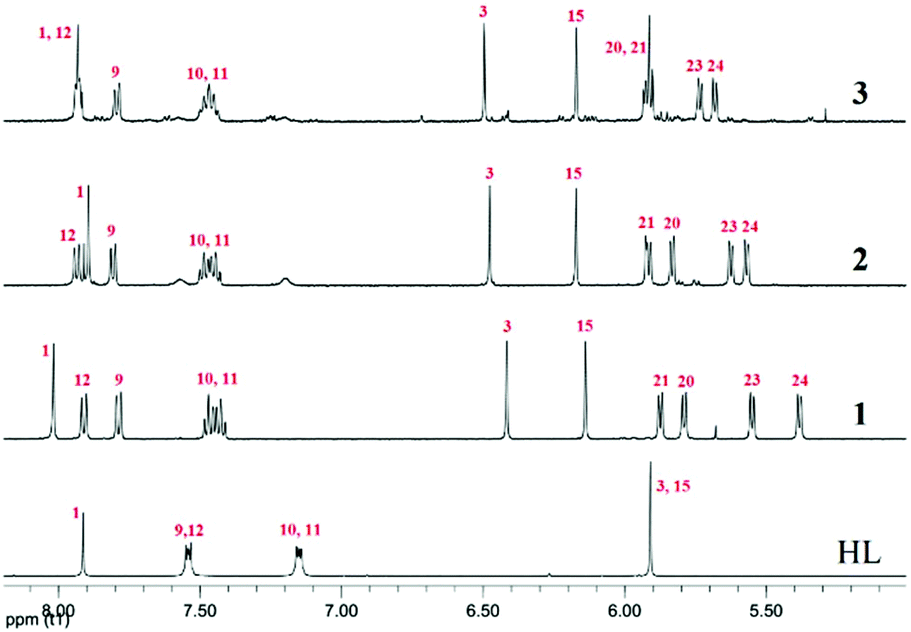 | ||
| Fig. 1 Comparison of the 1H NMR spectral traces in DMSO-d6, showing the changes in chemical shifts in HL and 1–3. The aromatic regions of the spectra show the effects of halide coordination on the metal complexes. Numbering refers to the drawing in Scheme 2. | ||
Both the ligand and the metal complexes were characterized by other analytical techniques to check their purity (see the Experimental section). The ligand in ESI (+ve) appeared as [M + Na]+ along with one pyrazole-removed species; this speciation has been previously reported in similar compounds (Fig. S12†).54 For the metal complexes, the molecular ion and halide-free complexes were observed in all cases (Fig. S13–15†). The electronic spectra of 1–3 in methanol were interesting, where the metal-centered band at ca. 430 nm red shifted by ca. 36 nm as the halides changed from Cl− to I− (Fig. S16†). This may be attributed to the increase in electron density on Ru(II) upon changes in electronegativity and to the Ru–X (X = halide) bond distances.
X-ray crystallography
Single crystals suitable for X-ray diffraction were obtained by layering hexane over dichloromethane solutions of the compounds for HL, 1 and 2. ORTEP diagrams with 50% probability thermal ellipsoids are shown in Fig. 2, and selected crystallographic parameters are tabulated in the ESI (Table S3†). HL, 1 and 2 crystallize as monoclinic crystal systems in C2/c (HL) and P21/n, respectively. The diffraction data showed the expected increases of the Ru–X bond distance by ca. 0.13 Å when the coordinated halide changed from –Cl to –Br. The chelating coordination was satisfied by one nitrogen from the benzimidazole and another from a pyrazole of the heteroscorpionate (Scheme 2). | ||
| Fig. 2 ORTEP diagrams for HL, 1 and 2 with selective labelling. Hydrogen atoms and counter anions have been omitted for clarity. Thermal ellipsoids are shown at 50% probability. | ||
In 1 and 2, the counter anion Cl−/Br− formed hydrogen bonds with the benzimidazole –NH within the same asymmetric unit (2.99(2) Å for 1, 3.14(2) Å for 2). The ligand HL exhibited both intra- and inter-molecular H-bonding involving the benzimidazole –NH and pyrazole nitrogen. It was found from single crystal X-ray data that in HL, intramolecular H-bonding occurs between –Nε–H⋯Npz. However, the ∠ –Nε–H⋯Npz is 117.48(6)°, showing that although the bond distance between the donor and acceptor is only 2.778 Å, the angular nature weakens the H-bonding. In complex 1 and 2, ∠ –Nε–H⋯X− (X = Cl, Br) is ca. 160°, although the distance ranges from 2.994 Å in 1 to 3.145 Å in 2. The p-cymene group is connected to the Ru(II) centre by distances ranging from 2.173 Å to 2.238 Å through η6 bonding. The coordination of the ligand induces a change in the torsion angle of C7–C1–N2–N1 (HL = 42.35°, 1 = 45.29°, 2 = 43.67°) due to binding of the metal with N1. The bond angle of N(1)–N(2)–C(1) also increases from 120.27° in HL to 123.2 (2)° and 123.6 (2)° in 1 and 2, respectively. Selected bond angles and distances in HL, 1 and 2 have been tabulated in Table S4.†
Solution stability
It was necessary to check the stability and retention of the parent species in 1–3 before we studied the cytotoxicities of these complexes. Because the stock solutions of the complexes for cytotoxicity tests are made in DMSO, the integrities of the complexes were checked for 2 h in DMSO (by 1H NMR) (Fig. S18†); all the metal complexes were found to be stable.55 However, the stock solutions for cellular studies were freshly made and were utilized within 10 min.The ligand (HL) was found to be stable up to 48 h in DMSO–PBS (2:8 v/v) containing 4 mM NaCl, pD = 7.4 (Fig. S17†); beyond this time, the stability was not monitored. The metal complexes were examined for 24 h in a 2:8 v/v DMSO–PBS mixture by 1H NMR. Complex 1 and 3 readily hydrolysed (denoted by ‘*’, Fig. 3) in a DMSO–PBS (2:8 v/v) mixture containing 4 mM NaCl, pD = 7.4, upon immediate dissolution; this effect was less in the case of 2. However, in the cases of 2 and 3, we observed exchanges of chloride from the buffer solution to replace bromide and iodide (denoted by ‘o’, Fig. 3) in 2 and 3. The extent of halide exchange is greater in 3 compared to 2, which is expected due to the weaker Ru–I bond in 3 and is well known in the literature.38 The rate of aquation is also higher for 3 (iodide complex) in comparison to 1 (chloride complex); however, for 2, the rate of aquation is lower even than that of 1. This may be because the rate of aquation of 2 is competitive with that of the chloride exchange. Thus, the hydrolysis of the complexes is also regulated by the halide exchange in solution. Over a period of 24 h, 2 allowed only ca. 30% halide exchange to form the chloro species (1); remarkably, it became stable in the 4 mM NaCl environment, unlike 1. The above result suggests that the halide exchange may be governed by an equilibrium which inhibits the hydrolysis of the complex in that environment. It is worth mentioning here that halide exchange in all Ru(II) complexes does not necessarily follow a common trend.38,56
 | ||
| Fig. 3 Stability of 1–3 in DMSO-d6 and PBS containing 4 mM NaCl in D2O (2:8 v/v), pD = 7.4, monitored by 1H NMR. Spectra recorded after 24 h at 25 °C, where ‘*’ is hydrolysed; ‘o’ is chloride exchange; ‘@’ is free p-cymene; ‘‡’ is [Ru2(η6-p-cymene)2(OH)3]+ (ii) and ‘†’ is [Ru2(η6-p-cymene)2(HL)2Cl]+ (iii) peaks in solution. | ||
In contrast to the NMR data, upon injecting an aliquot of the NMR sample, after necessary dilution with methanol, no m/z peak was observed in the ESI-MS for the halide-exchanged species in 2 and 3. Only the dehalogenated species [(η6-p-cymene)RuII(L)]+ was found as the major peak in ESI-MS (obs. m/z = 555.18; calcd 555.18) for all three complexes. The relative intensity showed that the m/z peak of 555.18 became more intense compared to the native complex peak (1, obs. m/z = 591.16; calcd 591.16, 2, obs. m/z = 635.11; calcd 635.10, 3, obs. m/z = 683.09; calcd 683.09) in one-day-old solution when compared with fresh solution (Fig. S19–S21†). The stability order of the complexes is 2 > 1 > 3. All of the possible speciations found by ESI-MS initially and after 24 h are tabulated in Table S5.†
During the NMR hydrolysis studies, it was observed that all the complexes immediately showed ca. 2% to 3% free p-cymene (2.18, 1.15 and 7.22 ppm), even in recrystallized complex solutions (Fig. 3). However, there was no further ligand dissociation during the next 24 h, which suggests that the miniscule initial dissociation may be due to a temperature change during solution mixing. However, this is not completely understood. EPR studies of 1 mM solutions of 1 and 3 in MeCN–H2O (1:1 v/v) suggest that we may exclude the formation of any Ru(III) (data not shown). The ESI-MS data also does not show any m/z that matches well with any Ru(III) species. Hence, the contribution towards the spectral broadening is due to the 4 mM NaCl phosphate buffer (pH 7.4). The 1H NMR data of the iodo complex 3 initially showed the formation of a minute amount of ruthenium(II) hydroxo dimer ([Ru2(p-cymene)2(OH)3]+) (iii in Scheme 3, ‘†’ in Fig. 3), displaying two signature peaks at 5.1 and 5.5 ppm for two different aromatic protons.57 Another set of peaks was observed in the spectra that may be assigned to the formation of a dimer bearing the ligand and p-cymene by binding of the N-donor site of non-coordinated pyrazole with another metal centre via replacement of chloride (ii in Scheme 3), ([Ru2(HL)2(p-cymene)2Cl]+, denoted by ‘‡’ in Scheme 3). Complex 3 also shows a higher degree of aquation (denoted by ‘ ’).57 The dimer of the formulation [Ru2(HL)2(p-cymene)2Cl]+ was also found by ESI-MS using the same solution from the NMR studies; it shows a peak at m/z 1145.33 (calc. 1145.33), and the isotopic distribution for this m/z matches well with the simulated distribution (Fig. S22†). The NMR data supported that dimer formation is favoured only in the iodo complex (3). Unlike the 1H NMR spectra, in ESI-MS, dimer formation occurred for all three complexes (Fig. S22†); this suggests that dimers may also form during MS.
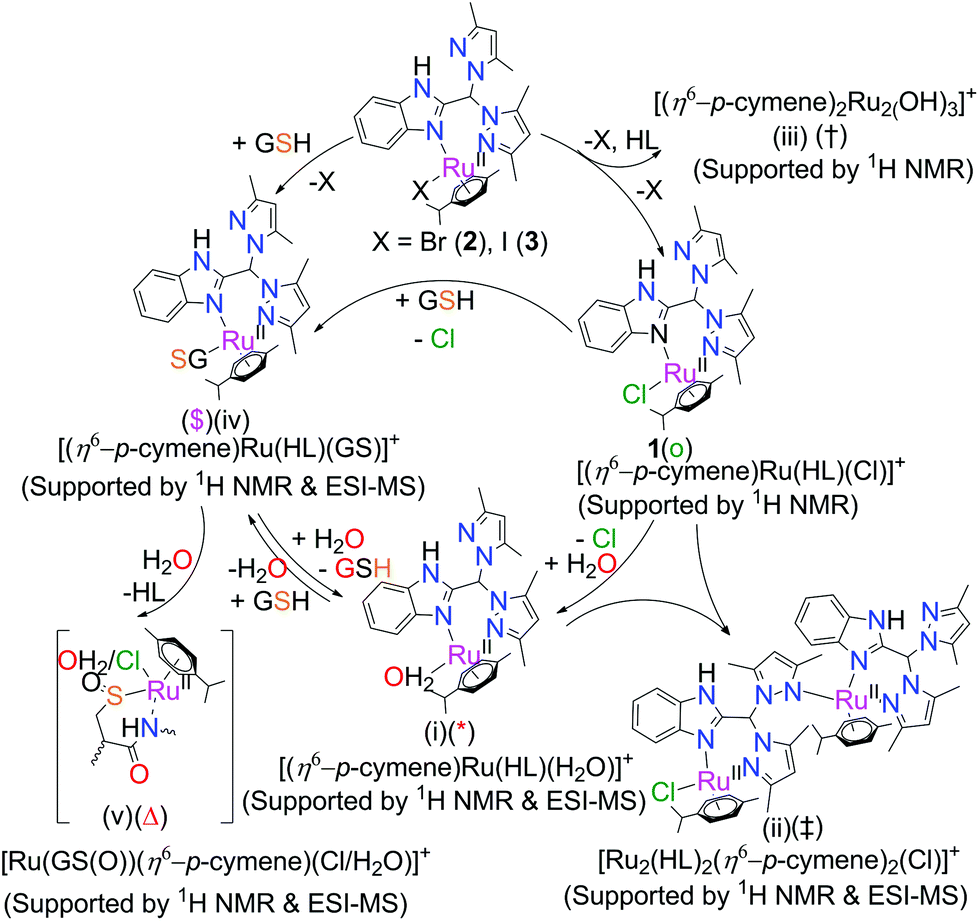 | ||
| Scheme 3 Interaction of complexes with DMSO and GSH in a DMSO–phosphate buffer (2:8, v/v) solution mixture. | ||
We also performed conductivity studies on the complexes to support our hydrolysis/halide exchange results. In a 1:1 acetonitrile–water mixture, 1 mM solutions of all the complexes show an increase in conductance over time up to 6 h; after, almost no change is observed up to 24 h (Fig. S23†). This indicates that there may be an equilibrium in solution after this period of time. The initial increase in conductivity is attributed to both the liberation of halide and coordination to water. Hydrolysis of the complexes increases their positive charge, thus increasing their ionic mobility.58 In 4 mM NaCl, the rate of increase in the conductance value was relatively slow (Fig. S23†). This may be because the 4 mM chloride ion concentration favours halide exchange, leading to coordination of a chloride and liberation of a bromide and, hence, a relatively low increase in conductance. The saturation point was reached on average after ca. 4 h for 2 and 3; however, 1 required more time because of the common anion present in solution. It must be noted here that aquation means the (partial or complete) exchange of chloride with water. The rate of change in conductance follows the trend of 3 > 2 > 1. Therefore, 3 is less stable with respect to the other complexes. Hence, the conductivity experiments show that complex 3 is the least stable and that 2 undergoes halide exchange in the presence of 4 mM chloride solution.
Interaction with glutathione and model nucleobase 9-ethylguanine
Glutathione is a major detoxifying agent in the presence of glutathione S-transferase (GST)40 in cells. Many cancer cells become resistant to different drugs by increasing their cellular glutathione levels.59 Therefore, the stabilities of the complexes were studied in the presence of excess (10 eq.) glutathione (GSH) by 1H NMR spectroscopy. The experimental conditions were similar to those used for solution stability studies of 1–3 by 1H NMR. It was found that the compounds lost their integrity in the presence of glutathione (Fig. 4). A similar phenomenon is known for many Ru(II) complexes when interacting with sulphur-rich amino acids (viz. cysteine).60,611–3 began to dissociate upon addition of 10 eq. of GSH. After 24 h, more than 60% ligand dissociation occurred in all the metal complexes (ca. 63% in 1, 72% in 2 and 84% in 3 after 24 h). The entire hydrolyzed and intact complexes rapidly bind to GSH, forming GSH adducts, through sulphur coordination by replacement of a halide or water from the intact or aquated species, respectively. We continued the kinetic studies up to 24 h. For 1, all the intact and hydrolyzed peaks shifted towards lower ppm upon coordination with GSH. The 1H peaks corresponding to glutathione protons also showed chemical shifts, indicating strong binding of GSH to the metal complex. The GSH peak at 2.70 ppm for Cys-CH2 shifted to 2.76 ppm. The proton integration of that peak over time suggested the degradation of GSH to form [Ru(η6-p-cymene)(H2O)(GS(O))](v) and oxidized glutathione (GSSG) (Scheme 3).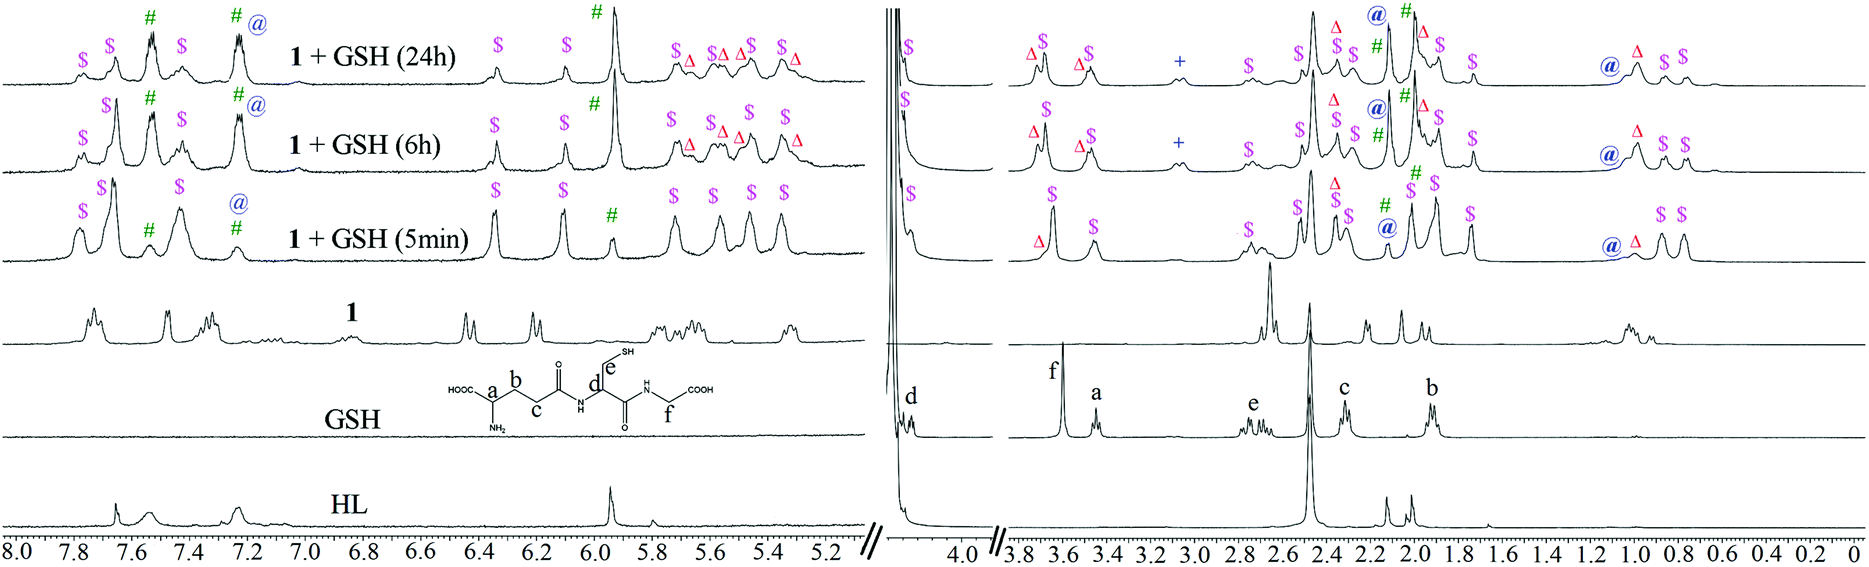 | ||
| Fig. 4 Stability and interaction of 1 with GSH (10 eq.) in 2:8 (v/v) DMSO-d6 and 10 mM phosphate buffer containing 4 mM NaCl (pD = 7.4) by 1H NMR at 25 °C. ‘$’ is GSH-bound complex; ‘#’ is free ligand; ‘@’ is free p-cymene; ‘+’ is GSSG and ‘Δ’ is [Ru(η6-p-cymene)(H2O)(GS(O))](v) peaks in solution. | ||
The binding of GSH is supported by the downfield shift (Δδ) of the Gly-CH2 and Cys-CH protons by 0.08 and ca. 0.05 ppm.62 The chemical shift of the Cys-CH proton merges with the residual water peak; hence, we could not obtain the exact chemical shift. Other peaks of GSH (Glu-CH, Glu-(β)CH2 and Glu-(γ)CH2) do not show significant shifts over time for binding (Fig. 4). Following binding, ligand ( HL) dissociation from the GSH-bound complex is observed (indicated by ‘#’) (also observed by ESI-MS, obs. m/z = 321.26, calcd 321.26), while the GSH may have undergone chelated binding with Ru(II) with the aid of another Gly-NH. It must be noted here that the binding mode cannot be confirmed; a formulation is proposed from the ESI-MS data (Fig. 4 and Fig. S24†) to explain the 1H NMR chemical shifts. The GSH adduct formation gave a peak at m/z = 862.27 (calc. 862.26), as shown in Fig. S24 and S25.† ESI-MS also supported the formation of halide and ligand-eliminated glutathione sulfenate-bound ruthenium (v in Scheme 3) adduct ([Ru(η6-p-cymene)(H2O/Cl)(GS(O))]) in solution. The sulfenate adduct peaks continued to increase with time in the 1H NMR spectrum. The sulfenate adduct (v) species was stable up to 24 h and was also identified under mass spectral conditions ([Ru(η6-p-cymene)(H2O)(GS(O))]); obs. m/z = 592.17, calc. 592.16) (Fig. S24 and S25†). In the ESI-MS after 24 h, the major species observed were the free ligand and GSSG. The possible speciations of GSH interaction, as obtained by ESI-MS, are tabulated in Table S6.† This observation is indicative of the operation of a concerted associative mechanism during GSH interaction. 1H NMR studies of the interaction of the model nucleobase 9-ethylguanine (9-EtG) with the metal complexes showed an insignificant downfield shift ca. 0.01 ppm of H8 (9-EtG) with respect to free 9-EtG alone. We did not observe any new peak for the p-cymene aromatic protons, which confirms that no direct coordination of the metal centre occurs with N7 of 9-EtG.38,44,46 However, a newly generated peak was immediately observed at 6.3 ppm for the aromatic C–H of non-coordinated pyrazole (around 20% to 30%) along with the original peak at 6.2 ppm (Fig. 5). This indicates that the free pyrazole ring may be involved in C–H⋯π interaction with the six-membered ring of 9-EtG. This C–H⋯π interaction causes the pyrazole C–H to appear at 6.3 ppm. On the other side, where the benzimidazole –NH proton interacts with guanine N7, the close proximity of the N–H of benzimidazole with the lone pair of N7 of 9-EtG causes an upfield shift in the benzimidazole aromatic protons (Δδ = 0.06 ppm). Simultaneously, due to the decrease in electron density over the guanine N7, a new guanine H8 signal appears at 7.87 ppm.
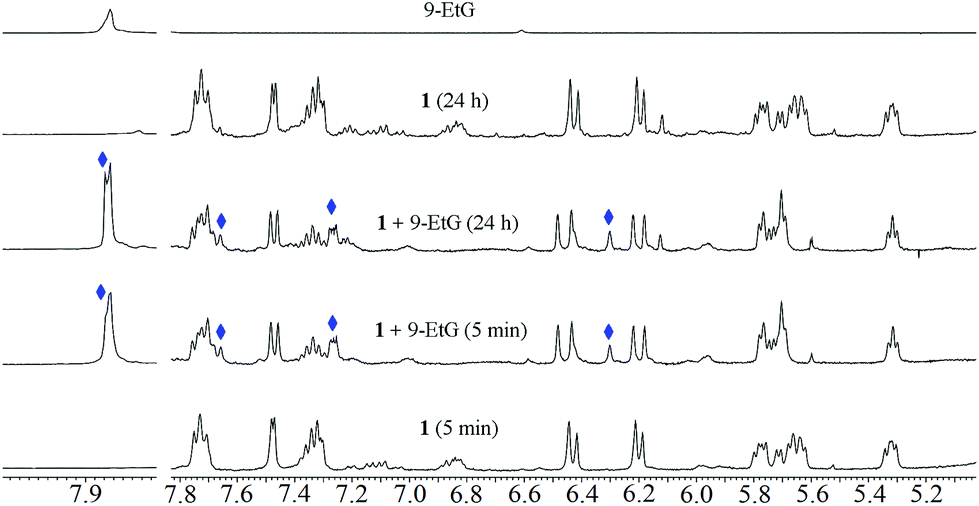 | ||
| Fig. 5 Interaction of 1 with 9-EtG in DMSO-d6 and 10 mM phosphate buffer containing 4 mM NaCl (pD = 7.4) 2:8 (v/v) by 1H NMR at 25 °C. Only the guanine interaction peaks are assigned. Peaks with blue diamonds are formed on interaction between 9-EtG and the complex. | ||
We also observed that hydrolysis of the complexes is significantly suppressed in the presence of 9-EtG. However, two new peaks (in addition to the hydrolysis and native compound peaks) at 6.48 and 6.24 ppm for the two pyrazole C–H protons appeared; this may be due to a change in the conformation of the free pyrazole, which is in equilibrium with the native conformation, but cannot be assigned definitely. After 24 h of reaction, we did not observe any significant changes in the spectra compared to the initial spectra, which indicates that the reaction may be in equilibrium.
The model nucleobase 9-EtG did not show any strong interaction with the complexes as per the NMR data, and the CT DNA binding constant is also low (103 M−1 for 1–3, Table S7†). The binding constant values are in agreement with the trend of hydrolysis in solution: 1 > 3 > 2. However, we observed retardation of pBR322 plasmid DNA upon incubation of 1 with various ratios of complex:DNA (with respect to base pairs) starting from rb = 0 to 1.66 within 4 h (Fig. 6 and Fig. S26†). This signifies that the complexes have the potential to bind with DNA, although the binding is weak.
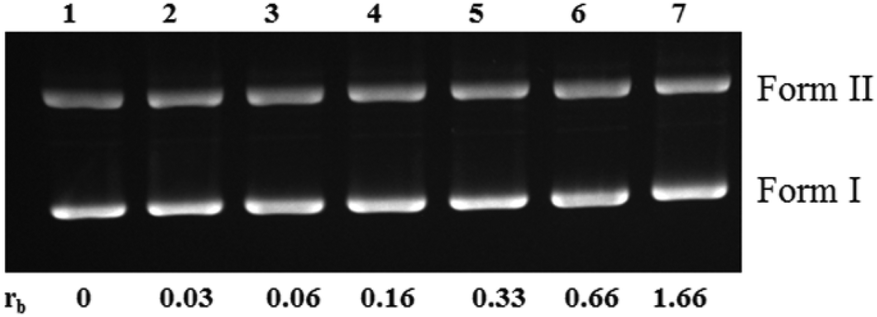 | ||
| Fig. 6 Agarose gel electrophoresis bands of pBR322 plasmid DNA showing unwinding; incubation time = 4 h at 37 °C in the dark, [DNA] = 30 μM (base pair concentration); DNA was incubated with 1 with rb = 0 to 1.66 (lanes 1–7, respectively). | ||
Theoretical studies
The energy-optimised structures of all the metal complexes and ligand showed good agreement with their single crystal X-ray structures (Fig. S27 and Table S8†). From calculations, it was found that the increments of metal halide distance were in parity with the electronegativity and stability. There was an increase in electron density on the metal centre on moving from 1 to 3. This may be a contributing factor to their susceptibility to potential nucleophiles, viz. water, DMSO and GSH. There was a decrease in the HOMO–LUMO energy gap from 1 to 3, which suggests increased reactivity moving from 1 to 3 (Fig. S28†). The HOMO stability order is 1 > 2 > 3. The FMO energy ordering of 1 to 3 suggests that there is a possibility of halide exchange to form the chloro complex first in the cases of 2 and 3, which is followed by aquation. The aqua complex shows a lower HOMO energy in comparison to all the complexes. The decrease in LUMO energy from 1 to 3 indicates more facile nucleophilic attack on the metal centre as we move from chloro to the iodo complex.In vitro cytotoxicity
The in vitro cytotoxicities of HL and 1–3 were probed against a selected panel of cell lines, viz. MCF-7 (human breast carcinoma), LNCaP (human metastatic prostate carcinoma), MIA PaCa-2 (human pancreatic carcinoma), HepG2 (human hepatocarcinoma), and human foreskin fibroblast (HFF-1). The ligand alone has relatively poor solubility, and the solubility increases upon complexation. 1 is the most active complex of the three, while the ligand itself does not show any toxicity up to 50 μM. The IC50 ranges of all the complexes are within 15 μM. The cytotoxicities of the complexes showed minimal or no effects upon changing the halide in the studied cell lines. In HepG2, the IC50 values were 10.6 ± 0.9 for 1, 9.8 ± 1.4 for 2, and 11.0 ± 1.6 for 3. The cytotoxicities of 1 and 2 were very similar in MCF-7 (6.9 ± 1.0 for 1 and 7.8 ± 1.0 for 2) and MIA PaCa-2 (11.7 ± 1.2 for 1 and 12.3 ± 1.4 for 2). All the complexes show comparable cytotoxicities against the primary cell line HFF-1 (Table 1).| MCF-7 | MIA PaCa-2 | LNCaP | HepG2 | HFF-1 | MCF-7 + GSHb | |
|---|---|---|---|---|---|---|
| a The data reported are the mean of at least two independent experiments. b GSH = reduced glutathione (1 mM); the statistical significances (p value) of all data reported are ≤0.05. | ||||||
| HL | >50 | >50 | >50 | >50 | >50 | >50 |
| 1 | 6.9 ± 1.0 | 11.7 ± 1.2 | 6.4 ± 0.8 | 10.6 ± 0.9 | 6.6 ± 0.5 | 7.9 ± 0.8 |
| 2 | 7.8 ± 1.0 | 12.3 ± 1.4 | 9.5 ± 1.0 | 9.8 ± 1.4 | 7.2 ± 0.2 | 9.0 ± 0.9 |
| 3 | 10.5 ± 2.0 | 15.1 ± 1.2 | 10.9 ± 1.8 | 11.0 ± 1.6 | 7.4 ± 0.2 | 11.0 ± 2.0 |
| Cis-platin | 12.0 ± 2.0 | 31.8 ± 4.8 | 5.1 ± 1.5 | 14.3 ± 1.0 | 9.7 ± 0.4 | 29.0 ± 1.1 |
The solvation/dissociation differed greatly for 1 and 2; however, this trend was not reflected to a similar order of magnitude in their toxicity profiles.63 In the cases of 2 and 3, the formation of 1 occurs by halide exchange. This exchange is followed by hydrolysis of the compounds. Therefore, 1 shows higher toxicity than 2, as the latter exchanged halides slowly. In the case of 3, the halide exchange is faster than that of bromide; however, the cytotoxicity decreases due to formation of some amounts of inactive side products [viz. ([Ru2(p-cymene)2(OH)3]+)] (Table 1).
All the complexes show loss of activity in the presence of externally added GSH in the culture media; however, the deactivation is low. This may be explained in two ways: (i) the Ru complexes may have higher affinity to serum albumin, which is well known.64,65 Hence, the albumin binds to the Ru(II) complexes, protecting them from deactivation by GSH and aiding their delivery to the target site; (ii) the GSH reacts competitively with oxygen; hence, the deactivation of the Ru(II) complexes is low. In intracellular conditions, the amount of metal complex that interacts with GSH dissociates. The intracellular concentration of GSH in the probed cells would not be high enough to deactivate all the complex delivered; hence, the cytotoxicity pattern does not change greatly. We also found that the complexes have the ability to reduce the intracellular GSH pool by impairing mitochondrial function, as discussed later.
Inductively coupled plasma mass spectrometry (ICP-MS) analysis of the Ru(II) complexes showed that the cellular Ru accumulation trend was 1 > 2 > 3 (Fig. 7). However, the difference between 1 and 2 is small. The accumulation correlates with the hydrolysis trend. Due to more side reactions and the formation of dimeric adducts, 3 accumulates less inside the cells. This accumulation trend is also in harmony with the cytotoxicity profiles (Fig. 7).
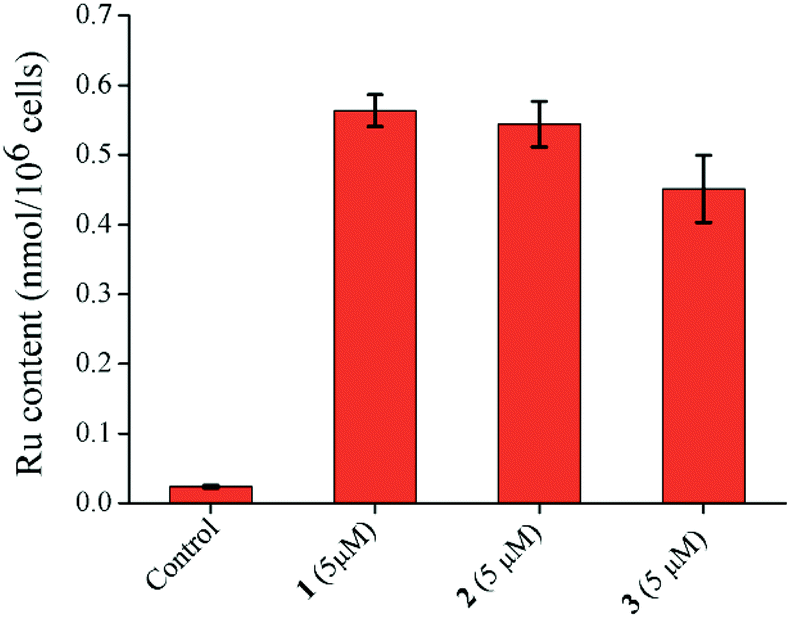 | ||
| Fig. 7 Ruthenium content inside MCF-7 cells treated with 1–3 (5 μM) for 24 h. Data obtained from ICP-MS analysis. Error bar shows the standard error of the data. | ||
The ruthenium anti-cancer agent NKP1339 is in clinical trials against different solid tumors,66 whereas NAMI-A is known to interfere with metastasis (cell migration) of cancer cells.6 The excellent toxicity profile against metastatic cancer cells (LNcaP) (Table 1) led us to probe the anti-metastatic activity against MCF-7 monolayer using the wound healing (scratch) assay. It was found that 1–3 can prevent healing of wounds, i.e. they are effective against cell migration activity even at 500 nM concentration, although the complexes did not exhibit any detectable cell toxicity at 500 nM concentration (Fig. 8). Encouragingly, this antimigratory activity was retained even 48 h after removal of the complexes from the cell culture. These preliminary experiments are highly encouraging in demonstrating the anti-metastatic effects (Fig. S29†) of the complexes.
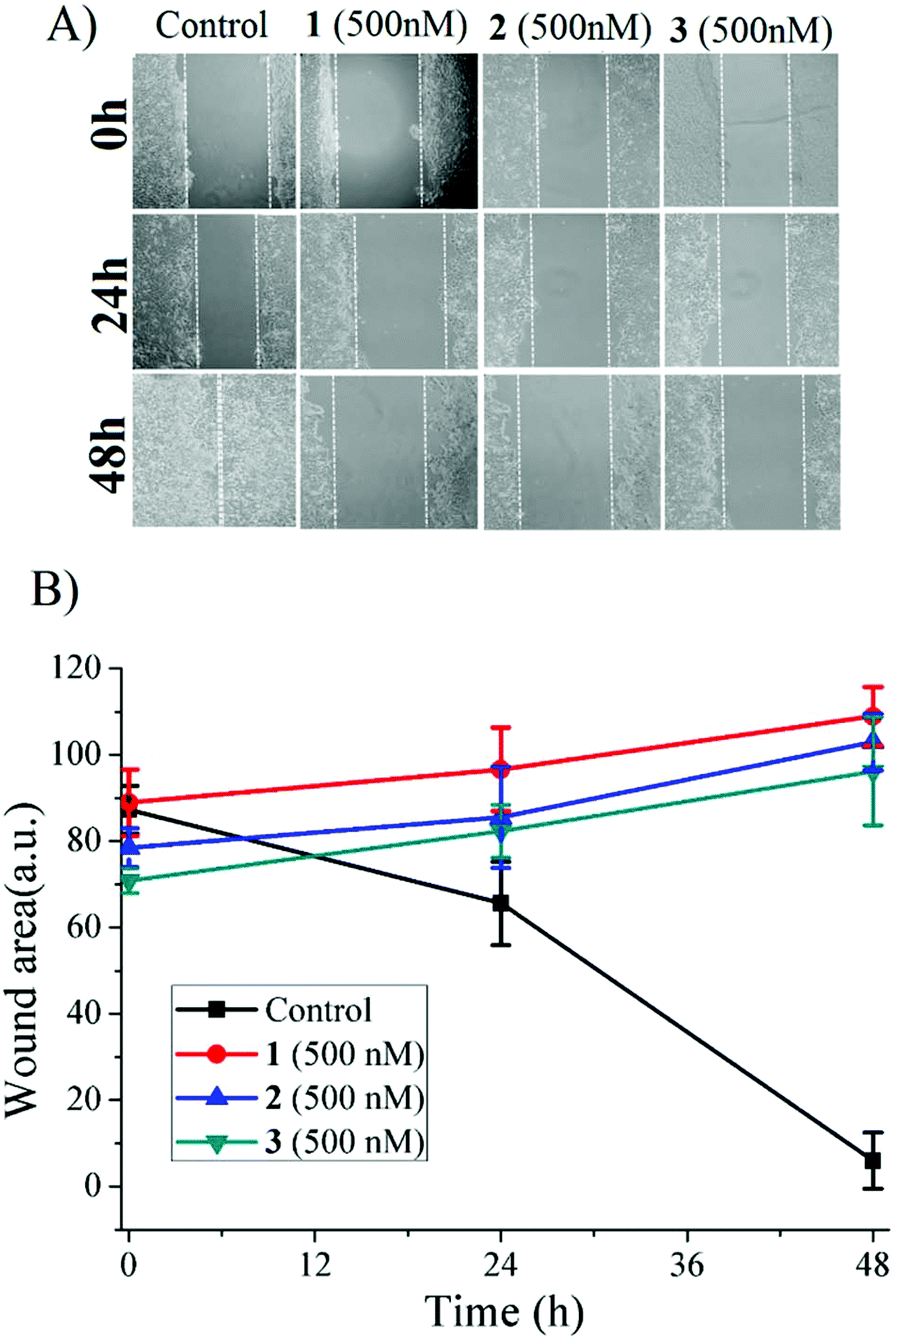 | ||
| Fig. 8 Wound healing (scratch) assay (A) showing the effects of 1–3 on the healing of artificial wounds on monolayers of treated MCF-7 cells for 48 h with sub-micromolar concentrations (500 nM) of the complexes; (B) quantitative data showing the healing trends of the wound areas. The white dashed lines indicate the edges of the monolayers. | ||
Possible mechanism of in vitro cytotoxicity
The in vitro cytotoxicity and the results from the speciation studies were encouraging; thus, we proceeded to check the possible mechanisms of action of the metal complexes (1–3). The possibility of ROS involvement in cytotoxicity was determined by DCFH-DA assay using both FACS and fluorescence-based multi-well assays. It was found that although complex 1 was the most potent (Fig. S30 and S31†), all the complexes were effective in producing ROS. The ROS experiments were performed in MCF-7, and the trend of ROS generation followed the trend of the IC50 values of the complexes against MCF-7.The generation of ROS gave us an impetus to study the mitochondrial health inside the cells. It was found that the complexes were able to change the mitochondrial transmembrane potential (MMP), as evident from JC-1 staining data (Fig. S31†). This can help explain our cytotoxicity data in the presence of GSH despite the fact that GSH degrades our complexes. The ability of the complexes to change the mitochondrial membrane potential signifies that the mitochondria would malfunction, and this would lead to less production of cellular GSH67 and hence to less deactivation of the complexes.
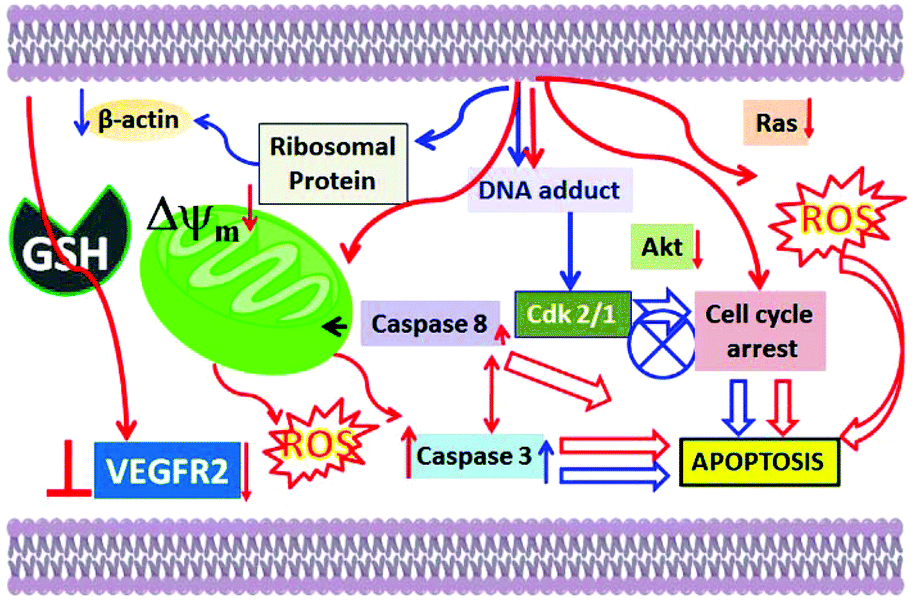
There was evidence of sub G1 phase arrest for all the complexes (1–3) upon flow cytometric analysis of MCF-7 cells treated with 1–3 at two different concentrations (for 24 h). In addition, concentration-dependent S phase arrest was observed in 1. However, in complexes 2 and 3, the growth arrest was mostly observed in G2/M phase but was also concentration dependent (Fig. S32†). Hence, the cell cycle arrest differs between the chloro complex (1) and the other two complexes (2, 3); this signifies that different pathways of action may be reasons for the above. Similar results are rare for Ru(II) complexes; however, this is known to occur due to variations in halides, as reported by Sadler et al.35,36 They found that the change in the mechanism of action is due to changes in the rate of hydrolysis and in the mechanism of transport inside the cells.35,36 In our case, the difference is caspase 8 activation for 1–3, in comparison to caspase 7; this suggests that the complexes may operate through multiple pathways initially, but after caspase 8 activation, they follow the mitochondria-mediated intrinsic pathway of apoptosis.35,68,69
For earlier reported Ru(II) p-cymene benzimidazole-based complexes where detailed mechanistic studies have been explored in the literature, most studies suggest that DNA binding is the major cause of cell death through cell cycle arrest, mostly in G2/M phase28,29,47,48 and S phase.43,47 These Ru(II) complexes are known to inhibit cyclin-dependent kinases (cdk1/cdk2)28,44 and downregulate ribosomal proteins (RPS21) and cytokines, such as β-actin.70 However, for complexes 1–3, the model nucleobase studies using 9-EtG and the DNA binding studies suggest that DNA binding is not the major pathway of action. Hence, the inhibition of the cell cycle at S-phase and G2/M phase may occur through interactions with proteins responsible for proper propagation and completion of these phases.
Apoptotic cell death is supported for 1–3 because the formation of fragmented bands of the isolated genomic DNA of the metal complex-treated MCF-7 cells (DNA ladder; Fig. S33†) was observed.71 Involvement of caspase 7 was found, which further confirmed the apoptotic pathway of cell death for 1–3. The highest amount of caspase 7 was activated by 1, and the order is 1 > 2 > 3 (Fig. S34†). One point to note here is that the activation of caspase 8 was lower for all the complexes. The change in the mitochondrial membrane potential and the lower activation of caspase 8 suggested that a mostly intrinsic pathway of apoptosis may be favoured compared to an extrinsic pathway. One point to note here is that despite the caspase 8 activation, the intrinsic mitochondria-mediated pathway of apoptosis may still be favoured.72,73 Hence, our proposed mechanism of action is depicted in Scheme 4.
 | ||
| Scheme 4 Plausible cellular pathways of the anti-cancer activities of benzimidazole-based Ru(II) p-cymene complexes available in the literature (blue arrows) and our complexes (red arrows). | ||
Molecular docking with VEGFR2
The ligand was docked against VEGFR2 to investigate its ability to inhibit the tyrosine kinase domain of VEGFR2. The docking score, which is an indication of the efficiency, was compared against the clinical inhibitor axitinib and the inhibitor that inspired our design, i.e. SU5416.74 We obtained the crystal structure of 1YWN from the PDB database because it is widely used for this purpose. 1YWN contains an inhibitor crystallized with VEGFR2, which was removed before performing our docking studies.75In one method, upon removal of the native inhibitor, we docked the clinically used axitinib, SU5416, HL and complexes 1–3 with the protein. In another method, the protein structure was optimized after removal of the native inhibitor using the OPLS2005 force field, and the resulting optimized structure was used for further docking studies with HL, 1–3, axitinib and SU5416. The docking results gave better GOLD score values with the native structure. However, the optimized protein structure gave better docking scores with SU5416 and the clinical inhibitor axitinib; hence, to remove bias, we present the results obtained from both docking studies because it was felt that this would provide a better representation (Table 2 and Table S9†). A higher GOLD score was taken as a better fit because this is known to indicate better binding interactions. Both the methods show that axitinib (IC50 = 0.1 to 0.3 nM) is the best molecule against VEGFR2 (58.67); after that, the affinity of HL is the second highest (50.87), even better than that of SU5416 (41.25) and close to that of axitinib. The complexes are moderate inhibitors of VEGFR2 in their native [(η6-p-cymene)RuII(HL)(X)]+ and aquated [(η6-p-cymene)RuII(HL)(H2O)]+ forms. The docking score of [(η6-p-cymene)RuII(HL)(H2O)]+ is close to that of SU5416 when docked against the native structure (Table 2) and less when the docking is performed with the optimized protein structure.
| Inhibitor-extracted structure | Native structure | |||
|---|---|---|---|---|
| GOLD score | RMSD | GOLD score | RMSD | |
| a All structures were optimized using the OPLS2005 force field in Schrodinger Suite 2016-1. | ||||
| 1 | 34.27 | 5.2 | 44.37 | 6.7 |
| 2 | 40.54 | 6.4 | 43.49 | 6.8 |
| 3 | 38.78 | 5.2 | 44.85 | 5.9 |
| Aqua complex | 32.35 | 6.1 | 41.57 | 6.4 |
| HL | 50.87 | 4.7 | 50.40 | 2.6 |
| Axitinib | 58.67 | 0.3 | 56.03 | 0.3 |
| SU5416 | 41.25 | 3.34 | 37.59 | 6.2 |
It is known that Glu883 and Asp1044 are the common residues that bind effectively with potential inhibitors in the kinase binding active site, which causes VEGFR2 to lose its activity.75,76 As per the docking studies presented here with the optimized structure, the best molecule, axitinib, showed H-bonding interactions with Phe843, Lys866, Glu883, and Asp1044; also, the two terminals of axitinib are in hydrophobic pockets consisting of Leu838, Val846, Ala864, Ile866, Glu883, Cys1043 and His1024 (Fig. 9F). For SU5416, Glu883 and Asp 1044 formed H-bonding interactions. However, the hydrophobic interactions are fewer (Fig. 9G). In the case of the Ru(II) complexes, 2 and 3, the halides were found to interact with Val846 by the formation of strong H-bonds [2, Val846 C–H⋯Br (ca. 3.25 Å, ∠ 154.86°)] and [3, Val846 C–H⋯I (ca. 3.26 Å, ∠ 116.31°)]; this was absent in 1 (Fig. 9B and C). Other than Val846 in the case of 3, Lys866 forms a more potent bond with the halide [Lys866 C–H⋯I (ca. 3.66 Å, ∠ 160.93°)]. In the case of 1 and the aqua complex, the interactions are relatively fewer (Fig. 9A and D). For the ligand (HL), we found similar interactions to axitinib. HL forms strong H-bonds with Glu883 and Asp1044, which enables the molecule to fit into the cavity where axitinib sits (Fig. 9E and I). It was found that Glu883 forms H-bonds with the metal complexes and axitinib. Additionally, Asp1044, Cys1043, Asn1031, Arg1030, and Val846 are involved in either H-bonding or hydrophobic interactions with axitinib, 2 and 3. Val846 is H-bonded with coordinated halides/water except in the case of 1. Hence, many of the interacting residues were same for the complexes, axitinib or SU 5416 (Table S9†). The docking results using the native PDB structure, after removal of the inhibitor, showed even better results with our complexes than what is discussed above (see comparisons of the docking scores in Table 2, Fig. S35 and Table S10†).
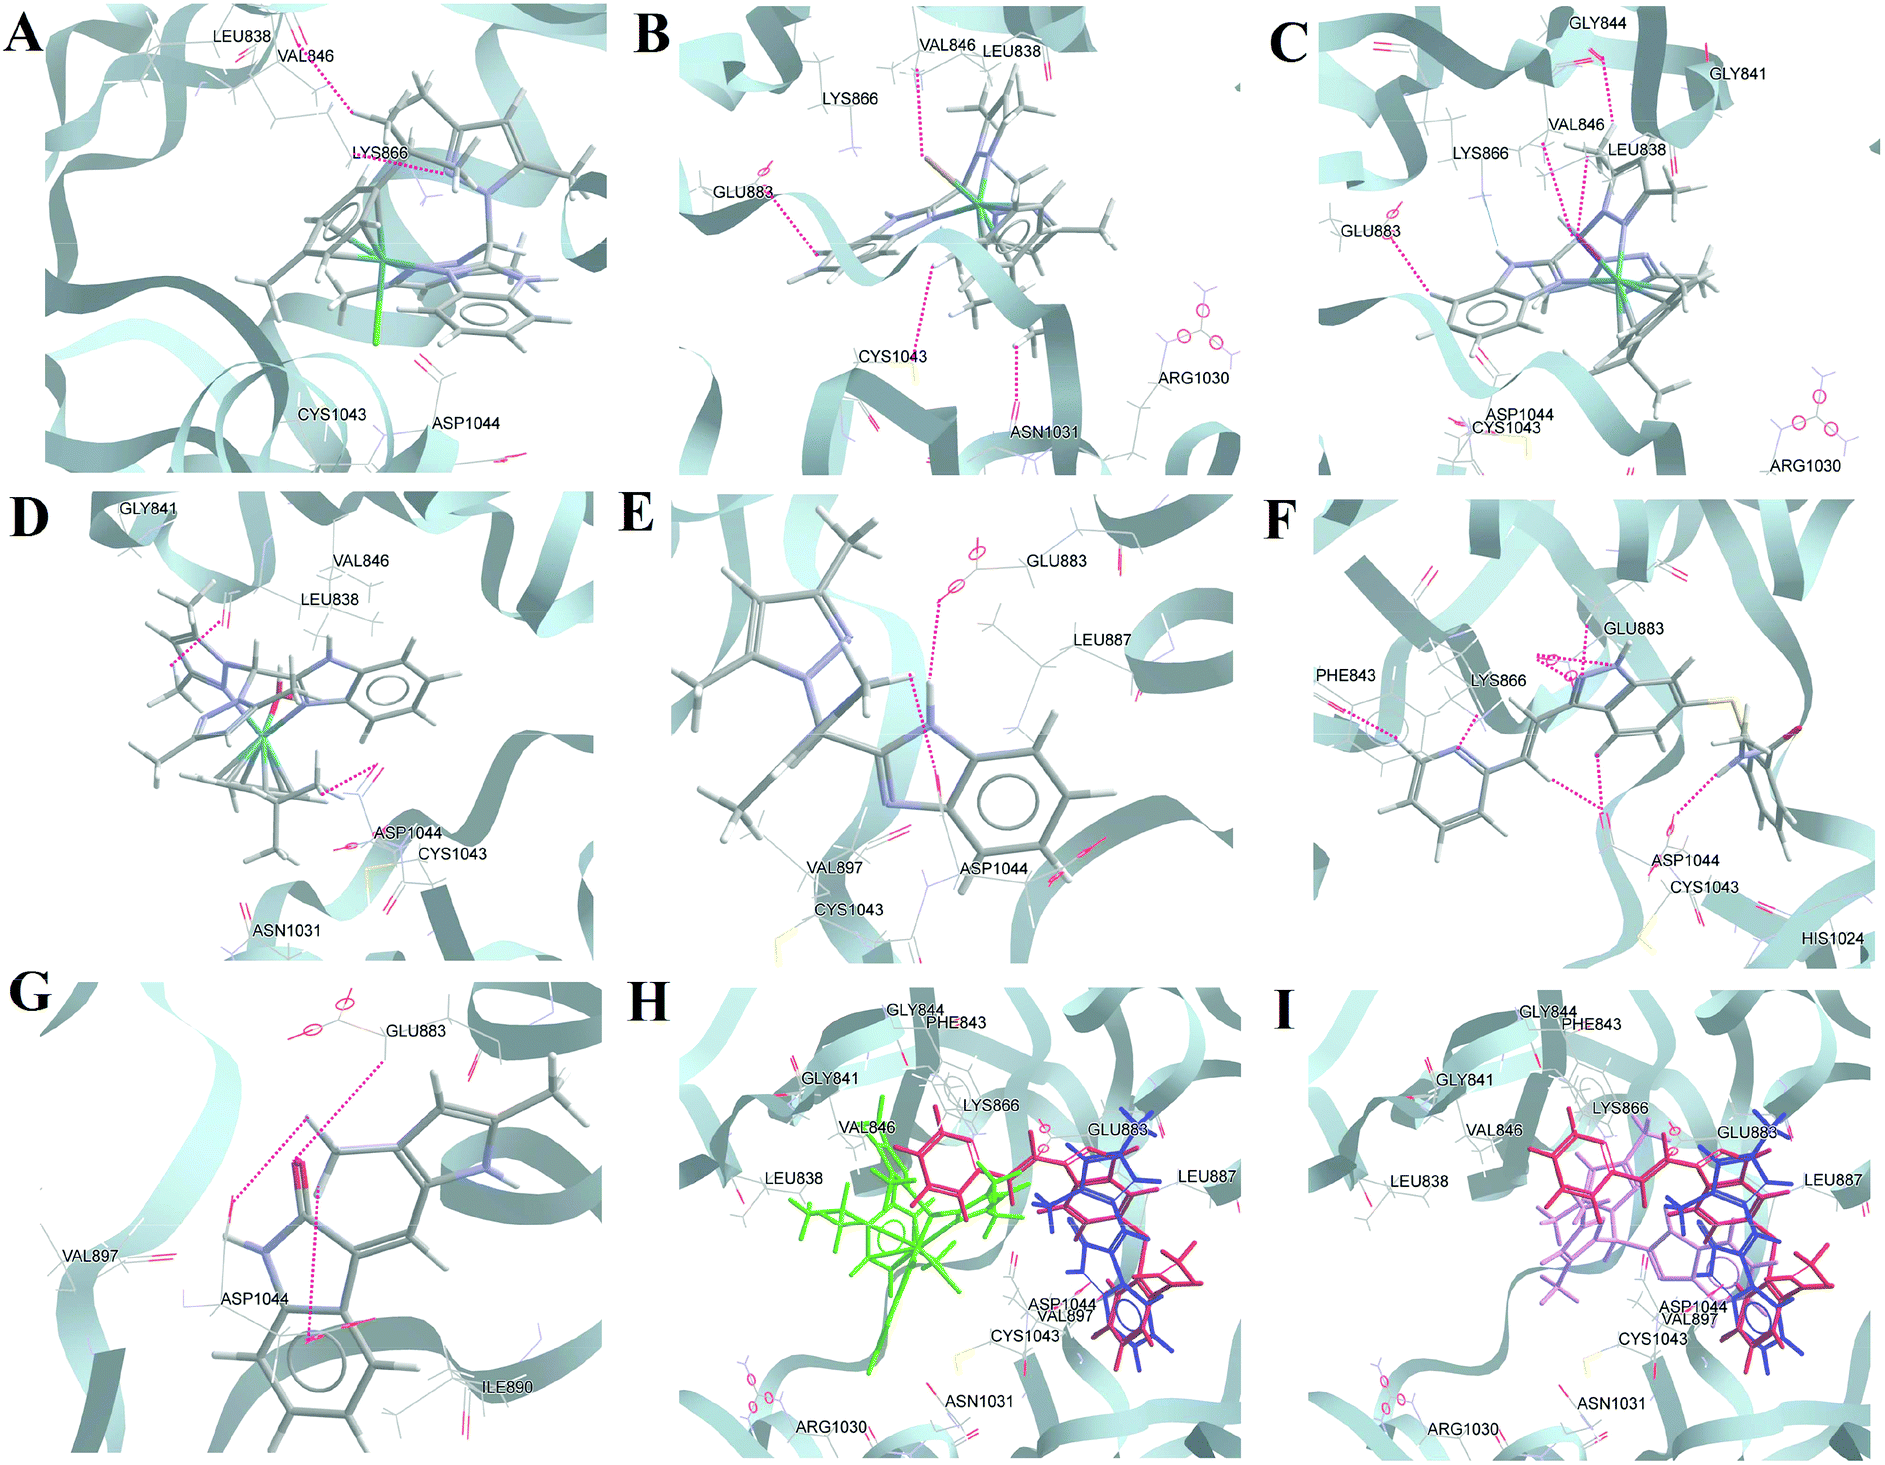 | ||
| Fig. 9 Representative docking interactions of compounds in the tyrosine kinase binding domain of VEGFR2 (PDB ID: 1YWN, inhibitor-extracted structure). (A–C) 1–3, (D) aqua complex, (E) HL, (F) axitinib, (G) SU5416, and cumulative docking structures: (H) 1 (green), axitinib (red), SU5416 (blue); (i) 1 (green), aqua complex (orange), HL (violet), axitinib (red). | ||
Western blot analysis
In order to probe the effects of HL and the complexes on VEGFR2, we performed western blotting analysis with HepG2. HepG2 and LNCaP are known to have good expression of VEGFR2.77,78 The experiments were performed with two different concentrations of HL and 1 to probe the effects. It was found that both the ligand and 1 have the ability to decrease Ras. The decrease of Ras was greater in cells treated with 1. There was a 1.5-fold decrease in Akt using 10 μM of 1 and a ca. 1.3-fold decrease for 50 μM of HL. However, in addition to the VEGFR2 inhibition predicted by molecular docking, we also observed a 1.5 to 2.5-fold decrease of VEGFR2 using HL (30 μM) and 1 (10 μM) (Fig. 10). The in vitro cytotoxicity data in the cancer cell lines are in good agreement with the known expression levels of VEGFR2 for the probed cell lines.79 LNCaP and HepG2 have high levels of VEGFR2 expression,77 whereas it is relatively less in MIA PaCa-2.80,81 However, VEGFR2 is not the sole target, because VEGFR2 decreased and the complexes are equally cytotoxic to the primary cell line HFF-1. Encouragingly, an in ovo assay to probe the abilities of HL and 1 to reduce newer blood vessel formation shows that treatment with 30 ng of HL or 1 exhibits a decrease in new blood vessel formation (Fig. S36†). The above result is suggestive of the anti-vascular properties of the ligand and the complexes.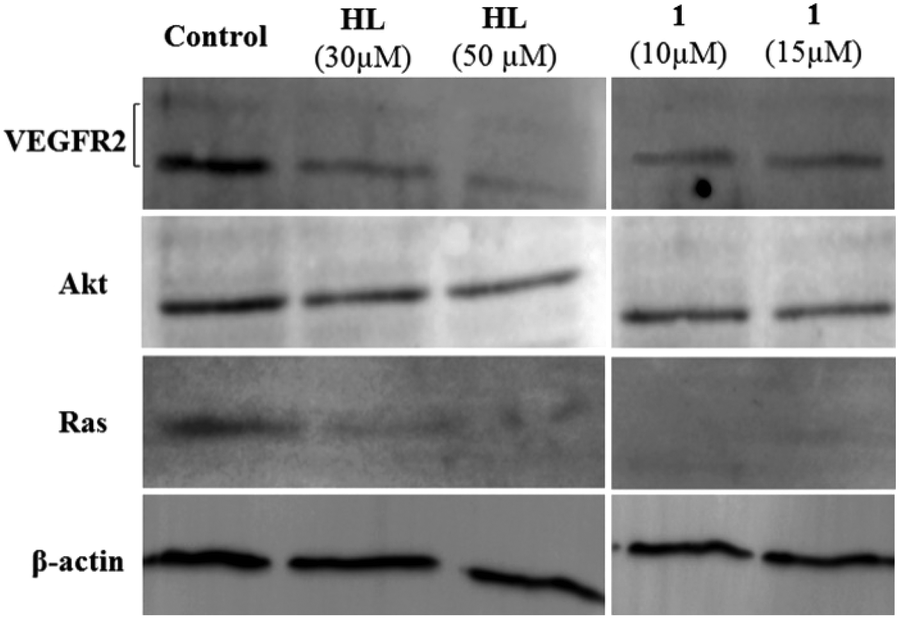 | ||
| Fig. 10 Effects of ligand and 1 on VEGFR2, Akt and Ras expression in HepG2 cells (western blot). β-Actin was used as the loading standard. All normalisations were performed with respect to β-actin. | ||
Conclusions
In summary, ternary benzimidazole-based Ru(II) p-cymene complexes with different halide co-ligands showed that varying the halide exchange rate and aquation by changing the halides influences the pathways of cytotoxicity and the stabilities of the complexes. The hydrolysis of 2 was slower and competed with halide exchange. Complex 2 showed the least caspase 8 activation and 3 showed the most caspase 8 activation, suggesting that the pathways of action are different for 1–3. The changes in mitochondrial membrane potential for 1–3 suggest that although the caspase 8 activation pathways may be different, the complexes ultimately lead to intrinsic pathways of apoptosis involving the mitochondria. The intact or aquated complexes are moderate inhibitors of the tyrosine kinase domain of VEGFR2; however, the ligand is a better inhibitor, as suggested by comparative docking studies. The complexes are less stable in the presence of excess GSH. Complex 1 and HL also have the ability to downregulate VEGFR2. The abilities of the complexes to impair mitochondrial function by changing the transmembrane potential may lower cellular GSH production, thus preventing massive deactivation by intracellular GSH. The complexes show excellent anti-cell migratory activities and anti-vascular properties at almost non-toxic dosages in vitro.Experimental
General
All chemicals and solvents were purchased from commercial sources. Solvents were distilled and dried prior to use by standard procedures.82 The starting material [(η6-p-cymene)RuCl2]2 was prepared by the reaction of RuCl3·xH2O with α-phellandrene,17 and the corresponding bromo and iododimers were synthesized from [(η6-p-cymene)RuCl2]2 with excess KBr or KI.18 All the solvents were degassed, and the reactions were carried out under an atmosphere of dry nitrogen by following standard Schlenk techniques. MTT [(3-(4,5-dimethylthiazol-2-yl)-2,5-diphenyltetrazolium bromide)] (USB) and all cell growth media and their supplements were purchased from Gibco. All the solvents used for spectroscopy and lipophilicity measurements were of spectroscopy grade and were purchased from Merck. The melting points of the compounds were measured in triplicate with one-end sealed capillaries using a SECOR (India) melting point apparatus, and the uncorrected values are reported. UV-Visible measurements were performed using either an Agilent Technologies Cary 300 Bio or PerkinElmer Lambda 35 spectrophotometer. FT-IR spectra were recorded using a PerkinElmer SPECTRUM RX I spectrometer in KBr pellets. NMR spectra were recorded using either a JEOL ECS 400 MHz or Bruker Avance III 500 MHz spectrometer at ambient temperature and were calibrated using residual undeuterated solvents as an internal reference. All 13C spectra reported are proton decoupled. The chemical shifts (δ) are reported in parts per million (ppm). Elemental analyses were performed on a PerkinElmer CHN analyzer (Model 2400). Electro-spray ionization mass spectra of the complexes (+ve mode electrospray ionization) were obtained from Maxis Impact UHR (Bruker Daltonics); for the ligand, a Q-Tof Micro (WATERS) mass spectrometer was used. EPR spectra were recorded on a Bruker Biospin EMXmicro X-band ESR spectrometer at room temperature. The ruthenium content was analysed on a Thermo Scientific XSERIES 2 ICP-MS instrument. The synthetic yields are reported for the isolated analytically pure compounds. The synthesized ligands and complexes were dried in vacuum and stored in a desiccator. Human blood was collected from a volunteer, and all work was performed following institute ethical guidelines.Synthesis and characterization
Syntheses of 1–3
All the complexes were prepared using the same procedure. The metal precursors for the different halide co-ordinations were prepared following a previously reported literature procedure. [(η6-p-Cymene)2Ru(Cl)2] for 1, [(η6-p-cymene)2Ru(Br)2] for 2 and [(η6-p-cymene)2Ru(I)2] for 3 were used. In general, HL (1.0 mmol) was first dissolved in dry dichloromethane solution, and the solution was maintained under N2 atmosphere after degassing. Then, the respective ruthenium(II) precursors were dissolved in the same solvent and added dropwise to the ligand solution. The resulting solution was then allowed to stir at high speed for an additional 8 h. After that, the whole solution was filtered, and the filtrate was evaporated to dryness. The dried mass was washed with hexane and diethyl ether several times. Further purification was performed by layering between DCM–hexane solvent mixtures. This purification step afforded pure, shiny crystals of the respective metal complexes (1–3).Caution! All the compounds reported in this work are suspected cancer-causing agents. Care should be exercised while handling them.
:1; 10−3 M): 40 S cm2 mol−1. Anal. calcd for C28H34Cl2N6Ru: C, 53.67; H, 5.47; N, 13.41. Found: C 53.40; H 5.51; N 13.22. FT-IR (KBr Pellet): 3432br, 3074m, 2979sh, 2923s, 2862, 2676m, 2415bs, 1728w, 1631m, 1556m, 1446sh, 1322sh, 1219sh, 1116m, 1061sh, 1026m, 889sh, 855m, 793w, 750s. UV-vis in CH3OH [λmax/nm (ε/dm3 mol−1 cm−1)]: 430 (560), 322 (1100), 282 (16300), 273 (17300). 1H NMR (500 MHz, DMSO-d6) δ 14.26 (bs, 1H, –NH), 8.02 (s, 1H, H1, –CH), 7.91 (d, J = 8.11 Hz, 1H, H12, Ar), 7.79(d, J = 8.12 Hz, 1H, H9, Ar), 7.48–7.41 (m, 2H, H10, H11, Ar), 6.41 (s, 1H, H3, –CHpz), 6.14 (s, 1H, H15, –CHpz), 5.87 (d, J = 6.08 Hz, 1H, H21, p-cym), 5.79 (d, J = 6.08 Hz, 1H, H20, p-cym), 5.55 (d, J = 5.98 Hz, 1H, H23, p-cym), 5.38 (d, J = 6.0 Hz, 1H, H24, p-cym), 2.66 (s, 3H, H5, –CH3pz), 2.52 (s, 3H, H17, –CH3pz), 2.24–2.15 (m, 1H, H25, p-cym), 2.13 (s, 3H, 3H28, p-cym), 1.95 (s, 3H, H6, –CH3.Pz), 1.93 (s, 3H, H18, –CH3pz), 1.04 (d, J = 6.85 Hz, 3H, H26, p-cym), 0.97 (d, J = 6.85 Hz, 1H, H27, p-cym). 13C NMR (500 MHz, DMSO-d6) δ 157.18 (C13), 148.18 (C16), 147.29 (C4), 144.06 (C7), 141.35 (C14), 140.50 (C2), 132.17 (C8), 125.04 (C10), 123.40 (C11), 120.29 (C12), 113.51 (C9), 109.64 (C3), 109.21 (C15), 104.60 (C19), 101.68 (C22), 83.44 (C21), 83.27 (C20), 82.26 (C23), 81.90 (C24), 64.07 (C1), 30.10 (C25), 22.48 (C27), 22.17 (C26), 17.66 (C18), 16.58 (C5), 13.04 (C28), 11.81 (C17), 10.65 (C6). ESI-MS (CH3OH) (m/z): 591.1632 [M]+ (calcd 591.1577).
:water, 1:1; 10−3 M): 44 S cm2 mol−1. Anal. calcd for C28H34Br2N6Ru: C, 47.00; H, 4.79; N, 11.75. Found: C 47.14; H 4.82; N 11.80. FT-IR (KBr Pellet): 3432br, 3061w, 2972s, 2923s, 2869s, 2697bs, 2614s, 2367sh, 2339m, 1624m, 1563m, 1435bs, 1322sh, 1274sh, 1212sh, 1109sh, 1082w, 1058sh, 1027sh, 924w, 896w, 868s, 807sh, 752sh. UV-vis in CH3OH [λmax/nm (ε/dm3 mol−1 cm−1)]: 448 (575), 324 (1280), 282 (14600), 272 (15700). 1H NMR (500 MHz, DMSO-d6) δ 13.98 (bs, 1H, –NH), 7.94 (d, J = 7.95 Hz, 1H, H12, Ar), 7.91 (s, 1H, H1, –CH), 7.81(d, J = 7.71 Hz, 1H, H9, Ar), 7.47 (td, J = 15.12, 7.10 Hz, 2H, H10, H11, Ar), 6.48 (s, 1H, H3, –CHpz), 6.17 (s, 1H, H15, –CHpz), 5.92 (d, J = 6.21 Hz, 1H, H21, p-cym), 5.83 (d, J = 6.09 Hz, 1H, H20, p-cym), 5.63 (d, J = 6.37 Hz, 1H, H23, p-cym), 5.57 (d, J = 6.01 Hz, 1H, H24, p-cym), 2.68 (s, 3H, H5, –CH3pz), 2.17–2.12 (m, 1H, H25, p-cym), 2.12 (s, 3H, H28, p-cym), 1.99 (s, 3H, H6, –CH3Pz), 1.95 (s, 3H, H18, –CH3pz), 1.04 (d, J = 6.85 Hz, 3H, H26, p-cym), 0.88 (d, J = 6.85 Hz, 1H, H27, p-cym). 13C NMR (500 MHz, DMSO-d6) δ 158.02 (C13), 148.45 (C16), 147.59 (C4), 144.02 (C7), 142.24 (C14), 140.66 (C2), 125.17 (C10), 123.36 (C11), 121.04 (C12), 113.67 (C9), 110.01 (C3), 109.20 (C15), 106.65 (C8), 105.63 (C19), 101.32 (C22), 83.22 (C20), 82.82 (C21), 82.56 (C23, C24), 64.35 (C1), 30.15 (C25), 22.51 (C27), 22.09 (C26), 17.89 (C18), 17.71 (C5), 13.42 (C28), 11.84 (C17), 10.54 (C6), ESI-MS (CH3OH) (m/z): 635.1130 [M]+ (calcd 635.1072).
:water, 1:1; 10−3 M): 54 S cm2 mol−1. Anal. calcd for C28H34I2N6Ru: C, 41.55; H, 4.23; N, 10.38. Found: C 41.70; H 4.21; N 10.29. FT-IR (KBr Pellet): 3436br, 3054s, 2965s, 2962s, 2948s, 2914s, 2614w, 2367w, 1621m, 1535, 1453sh, 1413sh, 1378s, 1322sh, 1272sh, 1212sh, 1164w, 1109sh, 1061sh, 1031sh, 924w, 868sh, 807sh, 751sh. UV-vis in CH3OH [λmax/nm (ε/dm3 mol−1 cm−1)]: 466 (760), 282 (10890), 272 (11090). 1H NMR (500 MHz, DMSO-d6) δ 13.94 (bs, 1H, –NH), 7.94–7.91 (m, 2H, H1, –CH & H12, Ar), 7.79 (d, J = 8.22 Hz, 1H, H9, Ar), 7.52–7.42 (m, 2H, H10 & H11, Ar), 6.49 (s, 1H, H3, –CHpz), 6.17 (s, 1H, H15, –CHpz), 5.92 (dd, J = 4.90, 8.11 Hz, 2H, H21 & H20, p-cym), 5.73 (d, J = 5.87 Hz, 1H, H23, p-cym), 5.68 (d, J = 6.11 Hz, 1H, H24, p-cym), 2.67 (s, 3H, H5, –CH3pz), 2.18–2.15 (m, 1H, H25, p-cym), 2.12 (s, 3H, H28, p-cym), 2.09 (s, 3H, H18, –CH3pz), 1.98 (s, 3H, H6, –CH3Pz), 1.05 (d, J = 6.91 Hz, 3H, H26, p-cym), 0.81 (d, J = 6.84 Hz, 1H, H27, p-cym). 13C NMR (500 MHz, DMSO-d6) δ 158.92 (C13), 148.55 (C16), 147.80 (C4), 143.86 (C7), 143.41 (C14), 140.63 (C2), 125.18 (C10), 123.09 (C11), 122.23 (C12), 113.62 (C9), 110.17 (C3), 109.02 (C15), 107.38 (C8), 106.66 (C19), 100.84 (C22), 83.23 (C20), 83.12 (C21), 83.09 (C23), 82.00 (C24), 64.31 (C1), 30.21 (C25), 22.85 (C27), 22.70 (C26), 19.65 (C5), 18.50 (C18), 13.16 (C28), 11.84 (C17), 10.53 (C6). ESI-MS (CH3OH) (m/z): 683.1010 [M]+ (calcd 683.0933).
X-ray crystal structure determination
Single crystals of HL, 1 and 2 were obtained by layering a dichloromethane solution with hexane and were mounted using loops on the goniometer head. The crystal structure of 1 was determined using a Bruker Apex Kappa II diffractometer and HL; the structure of 2 was determined using SuperNova, Dual, Mo at zero, Eos diffractometer. The crystal was maintained at 100.01(11) K during data collection, and a Mo-Kα radiation source was used. Appropriate software packages were used to solve the crystal structures with ShelXS84,85 using Direct Methods, and the structures were refined with the ShelXL85 refinement package using Least Squares minimisation. The crystallographic data for the structures have been deposited at the Cambridge Crystallographic Data Centre as a supplementary publication: CCDC 1507224 (HL), 1507225 (1), 1507226 (2).†Computational details
Theoretical calculations were performed using the Gaussian09 programme.86 Geometry-optimised structures of HL and 1–3 were derived by density functional theory (DFT) using the B3LYP function87 with the Stuttgart/Dresden (SDD) effective core potential (ECP) basis set for the Ru(II) centre88 and 6-31G(d,p) for carbon and nitrogen. For the chloro and bromo analogues (1 and 2), 6-31G (2d,p) was used, and for the iodo analogue (3), the SDD basis set was used. The higher order basis sets were used to compute the pseudopotentials on the metal. In each calculation, methanol was used as the solvent with a conductor-like polarizable continuum model (CPCM).89–91Solution stabilities of the compounds
The stabilities of the compounds in solution were determined using both UV-vis and 1H NMR spectroscopy. The solutions were degassed prior to use and adjusted to the desired pD using DCl or NaOD. The pD values reported in the current study are uncorrected.92 The phosphate buffer solutions (PBS) used for stability studies had the following composition: 8 mM Na2HPO4 and 1.5 mM KH2PO4 in either H2O or D2O. Sodium chloride was added as necessary, and the pH/pD was adjusted to 7.4. The buffered solutions were degassed after the final pD adjustment.Compound interactions with glutathione and 9-ethylguanine
The interactions of the compounds with reduced glutathione (GSH) were monitored using 1H NMR spectroscopy in DMSO-d6–PBS (2:8 v/v) containing 4 mM NaCl, pD = 7.4. Excess GSH (10 eq.) was first dissolved in phosphate-buffered solution in D2O and was added to the DMSO-d6 solution of the complex to maintain the desired solvent ratio. Data recording was started after immediate addition and mixing with GSH. The spectra were recorded at room temperature and plotted over time. In the case of 9-ethylguanine (9-EtG), a similar protocol for the solvent mixture was followed; however, only 2.5 equivalents of 9-EtG were added. In all cases, the spectra were recorded up to 24 h.
Statistical analysis
The cytotoxicity data are presented as statistical mean ± SD (standard deviation). The cutoff p value for significance was set at p = 0.05. Hence, *p ≤ 0.05 and **p ≤ 0.005 were considered to be statistically significant. The statistical comparison analysis was performed using the one sample t-test. GraphPad Prism® V5.04 was used to perform all statistical analysis.Molecular docking
Molecular modelling for prediction of the possible modes of binding of the complexes was carried out using the GOLD (Genetic Optimization for Ligand Docking) Suite (Version 5.4.1).93 GOLD generally adopts the genetic algorithm to dock flexible molecules (ligands) into protein (macromolecule) sites. The GOLD Score was used as a search algorithmic function for more effective complexes; it has been reported to give superior results to Chemscore in GOLD.94 A higher GOLD Score fitness value indicates a better binding interaction in the binding site. Inhibitor-bound vascular endothelial growth factor receptor-2 (VEGFR2) (PDB entry 1YWN)93 was used to dock our metal complexes. All the metal complexes (see the previous section for the methods), axitinib and SU5416 were optimized by Gaussian09 using water as the solvent in the CPCM model. Axitinib and SU5416 were optimized at the DFT level of theory using the B3LYP/6-31G method. The PDB structure was optimized after removing the bound inhibitor and processed by applying the OPLS 2005 force field by the protein preparation utility in Maestro Suite 2016-1 in Maestro (Schrödinger Suite 2016-1 Protein Preparation Wizard; Epik, Schrödinger, LLC, New York, NY, 2016; Impact, Schrödinger, LLC, New York, NY, 2016; Prime, Schrödinger, LLC, New York, NY, 2016). The binding site for the protein was also determined using the SiteMap utility in the same software (Schrödinger Release 2016-1: SiteMap, Schrödinger, LLC, New York, NY, 2016). The coordinates of the best site (score 1.082) are as follows: X = 1.75, Y = 39.49, Z = 15.87. Then, the optimized protein structures were used in the GOLD docking wizard to add necessary hydrogens. Water molecules that were not involved in binding interactions with the inhibitor or the active site were eliminated. The binding site was defined by centering the predicted site coordinates and the binding sphere, defined as a sphere containing the active site residues within 6 Å from the centre. The binding sphere was large enough to cover the ATP binding site. GOLD Score was selected as the scoring function, leaving other parameters as the defaults.GOLD score:
| Fitness = S(hbext) + 1.3750 × S(vdWext) + Sint + Sintcor |
The fitness score is the negative of all the energy terms in the equation.40 Therefore, a more positive score indicates superior affinity of the entry.
For validation of the docking, we used the native PDB structure. In that case, the docking site was chosen as 6 Å within the bound inhibitor after extraction.
Acknowledgements
We sincerely acknowledge SERB-India for financial support (vide project no. SB/S1/IC-02/2014). We are also thankful to IISER Kolkata for infrastructural support. S. B. wishes to thank CSIR-India and K. P. wishes to thank UGC-India for providing research fellowships.Notes and references
- M. J. Clarke, Coord. Chem. Rev., 2003, 236, 209–233 CrossRef CAS.
- W. H. Ang and P. J. Dyson, Eur. J. Inorg. Chem., 2006, 4003–4018 CrossRef CAS.
- M. A. Jakupec, M. Galanski, V. B. Arion, C. G. Hartinger and B. K. Keppler, Dalton Trans., 2008, 183–194 RSC.
- C. S. Allardyce and P. J. Dyson, Platinum Metals Rev., 2001, 45, 62–69 CAS.
- I. Bratsos, S. Jedner, T. Gianferrara and E. Alessio, Chimia, 2007, 61, 692–697 CrossRef CAS.
- J. M. Rademaker-Lakhai, D. Van Den Bongard, D. Pluim, J. H. Beijnen and J. H. M. Schellens, Clin. Cancer Res., 2004, 10, 3717–3727 CrossRef CAS PubMed.
- F. Lentz, A. Drescher, A. Lindauer, M. Henke, R. A. Hilger, C. G. Hartinger, M. E. Scheulen, C. Dittrich, B. K. Keppler and U. Jaehde, Anti-Cancer Drugs, 2009, 20, 97–103 CrossRef CAS PubMed.
- C. G. Hartinger, S. Zorbas-Seifried, M. A. Jakupec, B. Kynast, H. Zorbas and B. K. Keppler, J. Inorg. Biochem., 2006, 100, 891–904 CrossRef CAS PubMed.
- T. Gianferrara, I. Bratsos and E. Alessio, Dalton Trans., 2009, 7588–7598 RSC.
- R. Trondl, P. Heffeter, C. R. Kowol, M. A. Jakupec, W. Berger and B. K. Keppler, Chem. Sci., 2014, 5, 2925–2932 RSC.
- C. Scolaro, A. Bergamo, L. Brescacin, R. Delfino, M. Cocchietto, G. Laurenczy, T. J. Geldbach, G. Sava and P. J. Dyson, J. Med. Chem., 2005, 48, 4161–4171 CrossRef CAS PubMed.
- A. Bergamo, A. Masi, P. J. Dyson and G. Sava, Int. J. Oncol., 2008, 33, 1281–1289 CAS.
- A. Weiss, R. H. Berndsen, M. Dubois, C. Muller, R. Schibli, A. W. Griffioen, P. J. Dyson and P. Nowak-Sliwinska, Chem. Sci., 2014, 5, 4742–4748 RSC.
- Y. K. Yan, M. Melchart, A. Habtemariam and P. J. Sadler, Chem. Commun., 2005, 4764–4776 RSC.
- S. J. Dougan, M. Melchart, A. Habtemariam, S. Parsons and P. J. Sadler, Inorg. Chem., 2006, 45, 10882–10894 CrossRef CAS PubMed.
- S. W. Magennis, A. Habtemariam, O. Novakova, J. B. Henry, S. Meier, S. Parsons, I. D. H. Oswald, V. Brabec and P. J. Sadler, Inorg. Chem., 2007, 46, 5059–5068 CrossRef CAS PubMed.
- A. Habtemariam, M. Melchart, R. Fernandez, S. Parsons, I. D. H. Oswald, A. Parkin, F. P. A. Fabbiani, J. E. Davidson, A. Dawson, R. E. Aird, D. I. Jodrell and P. J. Sadler, J. Med. Chem., 2006, 49, 6858–6868 CrossRef CAS PubMed.
- S. J. Dougan, A. Habtemariam, S. E. McHale, S. Parsons and P. J. Sadler, Proc. Natl. Acad. Sci. U. S. A., 2008, 105, 11628–11633 CrossRef CAS PubMed.
- F. Barragan, P. Lopez-Senin, L. Salassa, S. Betanzos-Lara, A. Habtemariam, V. Moreno, P. J. Sadler and V. Marchan, J. Am. Chem. Soc., 2011, 133, 14098–14108 CrossRef CAS PubMed.
- W. H. Ang, A. De Luca, C. Chapuis-Bernasconi, L. Juillerat-Jeanneret, M. Lo Bello and P. J. Dyson, ChemMedChem, 2007, 2, 1799–1806 CrossRef CAS PubMed.
- S. Betanzos-Lara, L. Salassa, A. Habtemariam, O. Novakova, A. M. Pizarro, G. J. Clarkson, B. Liskova, V. Brabec and P. J. Sadler, Organometallics, 2012, 31, 3466–3479 CrossRef CAS.
- F. Schmitt, P. Govindaswamy, G. Suess-Fink, W. H. Ang, P. J. Dyson, L. Juillerat-Jeanneret and B. Therrien, J. Med. Chem., 2008, 51, 1811–1816 CrossRef CAS PubMed.
- W. H. Ang, L. J. Parker, A. De Luca, L. Juillerat-Jeanneret, C. J. Morton, M. Lo Bello, M. W. Parker and P. J. Dyson, Angew. Chem., Int. Ed., 2009, 48, 3854–3857 CrossRef CAS PubMed.
- W. F. Schmid, R. O. John, V. B. Arion, M. A. Jakupec and B. K. Keppler, Organometallics, 2007, 26, 6643–6652 CrossRef CAS.
- R. Schuecker, R. O. John, M. A. Jakupec, V. B. Arion and B. K. Keppler, Organometallics, 2008, 27, 6587–6595 CrossRef CAS.
- A. K. Renfrew, A. D. Phillips, A. E. Egger, C. G. Hartinger, S. S. Bosquain, A. A. Nazarov, B. K. Keppler, L. Gonsalvi, M. Peruzzini and P. J. Dyson, Organometallics, 2009, 28, 1165–1172 CrossRef CAS.
- I. N. Stepanenko, A. Casini, F. Edafe, M. S. Novak, V. B. Arion, P. J. Dyson, M. A. Jakupec and B. K. Keppler, Inorg. Chem., 2011, 50, 12669–12679 CrossRef CAS PubMed.
- I. N. Stepanenko, M. S. Novak, G. Muehlgassner, A. Roller, M. Hejl, V. B. Arion, M. A. Jakupec and B. K. Keppler, Inorg. Chem., 2011, 50, 11715–11728 CrossRef CAS PubMed.
- W. Ginzinger, G. Muehlgassner, V. B. Arion, M. A. Jakupec, A. Roller, M. Galanski, M. Reithofer, W. Berger and B. K. Keppler, J. Med. Chem., 2012, 55, 3398–3413 CrossRef CAS PubMed.
- M. A. Jakupec, M. Galanski, V. B. Arion, C. G. Hartinger and B. K. Keppler, Dalton Trans., 2008, 183–194 RSC.
- J. Kljun, A. K. Bytzek, W. Kandioller, C. Bartel, M. A. Jakupec, C. G. Hartinger, B. K. Keppler and I. Turel, Organometallics, 2011, 30, 2506–2512 CrossRef CAS PubMed.
- F. Aman, M. Hanif, W. A. Siddiqui, A. Ashraf, L. K. Filak, J. Reynisson, T. Sohnel, S. M. F. Jamieson and C. G. Hartinger, Organometallics, 2014, 33, 5546–5553 CrossRef CAS.
- K. Purkait, S. Karmakar, S. Bhattacharyya, S. Chatterjee, S. K. Dey and A. Mukherjee, Dalton Trans., 2015, 44, 5969–5973 RSC.
- K. Purkait, S. Chatterjee, S. Karmakar and A. Mukherjee, Dalton Trans., 2016, 45, 8541–8555 RSC.
- I. Romero-Canelon, A. M. Pizarro, A. Habtemariam and P. J. Sadler, Metallomics, 2012, 4, 1271–1279 RSC.
- I. Romero-Canelon, L. Salassa and P. J. Sadler, J. Med. Chem., 2013, 56, 1291–1300 CrossRef CAS PubMed.
- J. X. Ong, C. W. Yap and W. H. Ang, Inorg. Chem., 2012, 51, 12483–12492 CrossRef CAS PubMed.
- F. Wang, A. Habtemariam, E. P. L. van der Geer, R. Fernandez, M. Melchart, R. J. Deeth, R. Aird, S. Guichard, F. P. A. Fabbiani, P. Lozano-Casal, I. D. H. Oswald, D. I. Jodrell, S. Parsons and P. J. Sadler, Proc. Natl. Acad. Sci. U. S. A., 2005, 102, 18269–18274 CrossRef CAS PubMed.
- Z. Adhireksan, G. E. Davey, P. Campomanes, M. Groessl, C. M. Clavel, H. Yu, A. A. Nazarov, C. H. F. Yeo, W. H. Ang, P. Dröge, U. Rothlisberger, P. J. Dyson and C. A. Davey, Nat. Commun., 2014, 5, 3462 Search PubMed.
- D. M. Townsend and K. D. Tew, Oncogene, 2003, 22, 7369–7375 CrossRef CAS PubMed.
- R. A. Khan, F. Arjmand, S. Tabassum, M. Monari, F. Marchetti and C. Pettinari, J. Organomet. Chem., 2014, 771, 47–58 CrossRef CAS.
- S. K. Tripathy, R. K. Surada, R. K. Manne, S. M. Mobin, M. K. Santra and S. Patra, Dalton Trans., 2013, 42, 14081–14091 RSC.
- G. S. Yellol, A. Donaire, J. G. Yellol, V. Vasylyeva, C. Janiak and J. Ruiz, Chem. Commun., 2013, 49, 11533–11535 RSC.
- M. Martinez-Alonso, N. Busto, F. A. Jalon, B. R. Manzano, J. M. Leal, A. M. Rodriguez, B. Garcia and G. Espino, Inorg. Chem., 2014, 53, 11274–11288 CrossRef CAS PubMed.
- R. Mitra and A. G. Samuelson, Eur. J. Inorg. Chem., 2014, 2014, 3536–3546 CrossRef CAS.
- A. Kumar, A. Kumar, R. K. Gupta, R. P. Paitandi, K. B. Singh, S. K. Trigun, M. S. Hundal and D. S. Pandey, J. Organomet. Chem., 2016, 801, 68–79 CrossRef CAS.
- S. Nikolic, L. Rangasamy, N. Gligorijevic, S. Arandjelovic, S. Radulovic, G. Gasser and S. Grguric-Sipka, J. Inorg. Biochem., 2016, 160, 156–165 CrossRef CAS PubMed.
- J. Yellol, S. A. Perez, A. Buceta, G. Yellol, A. Donaire, P. Szumlas, P. J. Bednarski, G. Makhloufi, C. Janiak, A. Espinosa and J. Ruiz, J. Med. Chem., 2015, 58, 7310–7327 CrossRef CAS PubMed.
- B. Y. Tay, C. Wang, P. H. Phua, L. P. Stubbs and H. V. Huynh, Dalton Trans., 2016, 45, 3558–3563 RSC.
- J. M. Meinig and B. R. Peterson, ACS Chem. Biol., 2015, 10, 570–576 CrossRef CAS PubMed.
- T. Yang, M.-H. Li, J. Liu, N. Huang, N. Li, S.-N. Liu, Y. Liu, T. Zhang, Q. Zou and H. Li, Oncol. Rep., 2014, 31, 2743–2750 CAS.
- N. Maraš and M. Kočevar, Helv. Chim. Acta, 2011, 94, 1860–1874 CrossRef.
- W. Kandioller, C. G. Hartinger, A. A. Nazarov, J. Kasser, R. John, M. A. Jakupec, V. B. Arion, P. J. Dyson and B. K. Keppler, J. Organomet. Chem., 2009, 694, 922–929 CrossRef CAS.
- E. Hübner, T. Haas and N. Burzlaff, Eur. J. Inorg. Chem., 2006, 2006, 4989–4997 CrossRef.
- M. Patra, T. Joshi, V. Pierroz, K. Ingram, M. Kaiser, S. Ferrari, B. Spingler, J. Keiser and G. Gasser, Chem. – Eur. J, 2013, 19, 14768–14772 CrossRef CAS PubMed.
- J. M. Cross, N. Gallagher, J. H. Gill, M. Jain, A. W. McNeillis, K. L. Rockley, F. H. Tscherny, N. J. Wirszycz, D. S. Yufit and J. W. Walton, Dalton Trans., 2016, 45, 12807–12813 RSC.
- M. Schmidlehner, V. Pichler, A. Roller, M. A. Jakupec, W. Kandioller and B. K. Keppler, J. Organomet. Chem., 2015, 782, 69–76 CrossRef CAS.
- W. J. Geary, Coord. Chem. Rev., 1971, 7, 81–122 CrossRef CAS.
- B. G. Campling, K. Baer, H. M. Baker, Y. M. Lam and S. P. Cole, Br. J. Cancer, 1993, 68, 327–335 CrossRef CAS PubMed.
- M. Kubanik, H. Holtkamp, T. Sohnel, S. M. F. Jamieson and C. G. Hartinger, Organometallics, 2015, 34, 5658–5668 CrossRef CAS.
- W. Kandioller, C. G. Hartinger, A. A. Nazarov, C. Bartel, M. Skocic, M. A. Jakupec, V. B. Arion and B. K. Keppler, Chem. – Eur. J., 2009, 15, 12283–12291 CrossRef CAS PubMed.
- F. Wang, J. Xu, A. Habtemariam, J. Bella and P. J. Sadler, J. Am. Chem. Soc., 2005, 127, 17734–17743 CrossRef CAS PubMed.
- R. E. Morris, R. E. Aird, P. d. S. Murdoch, H. Chen, J. Cummings, N. D. Hughes, S. Parsons, A. Parkin, G. Boyd, D. I. Jodrell and P. J. Sadler, J. Med. Chem., 2001, 44, 3616–3621 CrossRef CAS PubMed.
- J. C. Pessoa and I. Tomaz, Curr. Med. Chem., 2010, 17, 3701–3738 CrossRef CAS PubMed.
- A. Levina, A. Mitra and P. A. Lay, Metallomics, 2009, 1, 458–470 RSC.
- L. S. Flocke, R. Trondl, M. A. Jakupec and B. K. Keppler, Invest. New Drugs, 2016, 34, 261–268 CrossRef CAS PubMed.
- M. Mari, A. Morales, A. Colell, C. Garcia-Ruiz and J. C. Fernandez-Checa, Antioxid. Redox Signaling, 2009, 11, 2685–2700 CrossRef CAS PubMed.
- S. W. G. Tait and D. R. Green, Nat. Rev. Mol. Cell Biol., 2010, 11, 621–632 CrossRef CAS PubMed.
- A. Ashkenazi, Nat. Rev. Drug Discovery, 2008, 7, 1001–1012 CrossRef CAS PubMed.
- P. Elumalai, Y. J. Jeong, D. W. Park, D. H. Kim, H. Kim, S. C. Kang and K.-W. Chi, Dalton Trans., 2016, 45, 6667–6673 RSC.
- A. H. Wyllie, Nature, 1980, 284, 555–556 CrossRef CAS PubMed.
- S. Fulda and K. M. Debatin, Oncogene, 2006, 25, 4798–4811 CrossRef CAS PubMed.
- S. P. Cullen and S. J. Martin, Cell Death Differ., 2009, 16, 935–938 CrossRef CAS PubMed.
- T. A. T. Fong, L. K. Shawver, L. Sun, C. Tang, H. App, T. J. Powell, Y. H. Kim, R. Schreck, X. Wang, W. Risau, A. Ullrich, K. P. Hirth and G. McMahon, Cancer Res., 1999, 59, 99–106 CAS.
- Y. Miyazaki, S. Matsunaga, J. Tang, Y. Maeda, M. Nakano, R. J. Philippe, M. Shibahara, W. Liu, H. Sato, L. Wang and R. T. Nolte, Bioorg. Med. Chem. Lett., 2005, 15, 2203–2207 CrossRef CAS PubMed.
- M. McTigue, B. W. Murray, J. H. Chen, Y.-L. Deng, J. Solowiej and R. S. Kania, Proc. Natl. Acad. Sci. U. S. A., 2012, 109, 18281–18289 CrossRef CAS PubMed.
- W. M. Stadler, D. Cao, N. J. Vogelzang, C. W. Ryan, K. Hoving, R. Wright, T. Karrison and E. E. Vokes, Clin. Cancer Res., 2004, 10, 3365–3370 CrossRef CAS PubMed.
- S. Peng, Y. Wang, H. Peng, D. Chen, S. Shen, B. Peng, M. Chen, R. Lencioni and M. Kuang, Hepatology, 2014, 60, 1264–1277 CrossRef CAS PubMed.
- S. Guo, L. S. Colbert, M. Fuller, Y. Zhang and R. R. Gonzalez-Perez, Biochim. Biophys. Acta, Rev. Cancer, 2010, 1806, 108–121 CrossRef CAS PubMed.
- M. Li, H. Yang, H. Chai, W. E. Fisher, X. Wang, F. C. Brunicardi, Q. Yao and C. Chen, Cancer, 2004, 101, 2341–2350 CrossRef CAS PubMed.
- K. J. Higgins, M. Abdelrahim, S. Liu, K. Yoon and S. Safe, Biochem. Biophys. Res. Commun., 2006, 345, 292–301 CrossRef CAS PubMed.
- W. L. F. Armarego and D. D. Perrin, Purification of Laboratory Chemicals, 4th edn, 1997 Search PubMed.
- N. Burzlaff, I. Hegelmann and B. Weibert, J. Organomet. Chem., 2001, 626, 16–23 CrossRef CAS.
- O. V. Dolomanov, L. J. Bourhis, R. J. Gildea, J. A. K. Howard and H. Puschmann, J. Appl. Crystallogr., 2009, 42, 339–341 CrossRef CAS.
- G. M. Sheldrick, Acta Crystallogr., Sect. A: Fundam. Crystallogr., 2008, 64, 112–122 CrossRef CAS PubMed.
- M. J. Frisch, G. W. Trucks, H. B. Schlegel, G. E. Scuseria, M. A. Robb, J. R. Cheeseman, G. Scalmani, V. Barone, B. Mennucci, G. A. Petersson, H. Nakatsuji, M. Caricato, X. Li, H. P. Hratchian, A. F. Izmaylov, J. Bloino, G. Zheng, J. L. Sonnenberg, M. Hada, M. Ehara, K. Toyota, R. Fukuda, J. Hasegawa, M. Ishida, T. Nakajima, Y. Honda, O. Kitao, H. Nakai, T. Vreven, J. A. Montgomery Jr., J. E. Peralta, F. Ogliaro, M. J. Bearpark, J. Heyd, E. N. Brothers, K. N. Kudin, V. N. Staroverov, R. Kobayashi, J. Normand, K. Raghavachari, A. P. Rendell, J. C. Burant, S. S. Iyengar, J. Tomasi, M. Cossi, N. Rega, N. J. Millam, M. Klene, J. E. Knox, J. B. Cross, V. Bakken, C. Adamo, J. Jaramillo, R. Gomperts, R. E. Stratmann, O. Yazyev, A. J. Austin, R. Cammi, C. Pomelli, J. W. Ochterski, R. L. Martin, K. Morokuma, V. G. Zakrzewski, G. A. Voth, P. Salvador, J. J. Dannenberg, S. Dapprich, A. D. Daniels, Ö. Farkas, J. B. Foresman, J. V. Ortiz, J. Cioslowski and D. J. Fox, Gaussian, Inc., Wallingford, CT, USA, 2009.
- C. Lee, W. Yang and R. G. Parr, Phys. Rev. B: Condens. Matter Mater. Phys., 1988, 37, 785–789 CrossRef CAS.
- M. Dolg, U. Wedig, H. Stoll and H. Preuss, J. Chem. Phys., 1987, 86, 866–872 CrossRef CAS.
- E. V. Stefanovich and T. N. Truong, Chem. Phys. Lett., 1995, 244, 65–74 CrossRef CAS.
- M. A. Aguilar and F. J. Olivares del Valle, Chem. Phys., 1989, 129, 439–450 CrossRef CAS.
- A. A. Rashin and K. Namboodiri, J. Phys. Chem., 1987, 91, 6003–6012 CrossRef CAS.
- A. K. Covington, M. Paabo, R. A. Robinson and R. G. Bates, Anal. Chem., 1968, 40, 700–706 CrossRef CAS.
- C.-J. Yao, H.-J. Nie, W.-W. Yang, J. Yao and Y.-W. Zhong, Inorg. Chem., 2015, 54, 4688–4698 CrossRef CAS PubMed.
- M. L. Verdonk, J. C. Cole, M. J. Hartshorn, C. W. Murray and R. D. Taylor, Proteins: Struct., Funct., Genet., 2003, 52, 609–623 CrossRef CAS PubMed.
Footnote |
| † Electronic supplementary information (ESI) available: Experimental details of interaction with CT DNA, plasmid DNA interaction, cell lines and culture conditions, cell viability assay (MTT), determination of intracellular reactive oxygen species (ROS), DNA ladder assay for apoptosis detection, detection of Caspase activation, ruthenium accumulation inside cancer cells by ICP-MS analysis, in ovo assay, western blotting, selected bond angle and bond distances of HL, 1 and 2 obtained from X-ray crystallography, NMR characterization spectra (1H, 13C, HMQC), UV-vis and 1H NMR spectra showing solution stability of complexes, detailed procedure of biological experiments. CCDC 1507224–1507226. For ESI and crystallographic data in CIF or other electronic format see DOI: 10.1039/c7dt00938k |
| This journal is © The Royal Society of Chemistry 2017 |