
 Open Access Article
 This Open Access Article is licensed under a
 Creative Commons Attribution 3.0 Unported Licence
{Ru(CO)x}-Core complexes with benzimidazole ligands: synthesis, X-ray structure and evaluation of anticancer activity in vivo†
Gabriella
Tamasi
*a,
Antonello
Merlino
 bc,
Federica
Scaletti‡
d,
Petra
Heffeter
ef,
Anton A.
Legin
g,
Michael A.
Jakupec
fg,
Walter
Berger
ef,
Luigi
Messori
d,
Bernhard K.
Keppler
*fg and
Renzo
Cini
a
bc,
Federica
Scaletti‡
d,
Petra
Heffeter
ef,
Anton A.
Legin
g,
Michael A.
Jakupec
fg,
Walter
Berger
ef,
Luigi
Messori
d,
Bernhard K.
Keppler
*fg and
Renzo
Cini
a
aDepartment of Biotechnology, Chemistry and Pharmacy, University of Siena, Via Aldo Moro 2, 53100 Siena, Italy. E-mail: tamasi@unisi.it
bDepartment of Chemical Sciences, University of Naples Federico II, Via Cintia, 80126, Napoli, Italy
cInstitute of Biostructure and Bioimaging, CNR, Via Mezzocannone 16, 80120, Napoli, Italy
dDepartment of Chemistry, University of Florence, Via della Lastruccia 3-13, 50019 Sesto Fiorentino, Florence, Italy
eInstitute of Cancer Research, Department of Medicine I, Medical University of Vienna, Borschkegasse 8a, 1090 Vienna, Austria
fResearch Platform “Translational Cancer Therapy Research”, University of Vienna, Währinger Straße 42, 1090 Vienna, Austria
gInstitute of Inorganic Chemistry, University of Vienna, Währinger Straße 42, 1090 Vienna, Austria. E-mail: bernhard.keppler@univie.ac.at
First published on 16th February 2017
Abstract
The reaction of [RuII2(CO)6Cl2], 1, with ![[N with combining low line]](https://www.rsc.org/images/entities/i_char_004e_0332.gif) 3-methylbenzimidazole (MBI) and 5,6-dimethylbenzimidazole (DMBI) afforded two new complexes with the general formula fac-[RuII(CO)3Cl2L], L = MBI (2) or DMBI (4). Crystals of cis,trans-[RuII(CO)2Cl2(3-MBI)2], 3, were also obtained from the mother liquor that produced 2. In the presence of water, the dissociation of Ru–N, Ru–Cl and Ru–CO bonds occurred as a function of time, water content and pH. Density functional theory structure simulations/optimizations were carried out at the Becke3LYP level of theory for evaluating the relative stability of possible conformers. ESI-MS studies revealed the ability of the complexes to link model proteins, such as lysozyme, bovine pancreatic ribonuclease and cytochrome c, with the partial release of the heteroaromatic base, chlorido and carbonyl ligands. X-ray diffraction studies on crystals grown from a solution of HEWL and 2 showed the partial removal of chloride and CO. Cytotoxicity tests yielded two-digit micromolar IC50 values in CH1/PA-1 and SW480 cancer cells. In contrast to CORM-3 and 2, a significantly reduced tumor growth was observed with 4 in the murine colon cancer CT-26 model in vivo.
3-methylbenzimidazole (MBI) and 5,6-dimethylbenzimidazole (DMBI) afforded two new complexes with the general formula fac-[RuII(CO)3Cl2L], L = MBI (2) or DMBI (4). Crystals of cis,trans-[RuII(CO)2Cl2(3-MBI)2], 3, were also obtained from the mother liquor that produced 2. In the presence of water, the dissociation of Ru–N, Ru–Cl and Ru–CO bonds occurred as a function of time, water content and pH. Density functional theory structure simulations/optimizations were carried out at the Becke3LYP level of theory for evaluating the relative stability of possible conformers. ESI-MS studies revealed the ability of the complexes to link model proteins, such as lysozyme, bovine pancreatic ribonuclease and cytochrome c, with the partial release of the heteroaromatic base, chlorido and carbonyl ligands. X-ray diffraction studies on crystals grown from a solution of HEWL and 2 showed the partial removal of chloride and CO. Cytotoxicity tests yielded two-digit micromolar IC50 values in CH1/PA-1 and SW480 cancer cells. In contrast to CORM-3 and 2, a significantly reduced tumor growth was observed with 4 in the murine colon cancer CT-26 model in vivo.
Introduction
Ruthenium complexes are attracting increasing interest because of their biological activities, which make them suitable candidates for biomedical applications. As reported recently by us, the rationale for studies on fac-{RuII(CO)3}2+ core complexes of azoles is specifically based on the following: (i) the anticancer activity of this class of complexes; (ii) the activity as CO-releasing materials (CORMs) (Motterlini et al.,1 Santos-Silva et al.,2 Tamasi et al.3 and references therein). fac-[RuII(CO)3Cl2(THZ)] (THZ = thiazole) was first prepared, studied and reported by some of us,4 and proved to be an interesting CORM able to react with amyloid molecules.5 (iii) Benzimidazoles (Scheme 1) have singular biological roles that can be exemplified by the presence of 5,6-dimethylbenzimidazole, DMBI, in cyanocobalamin, methylcobalamin, and other forms of the B12 cofactor where the base acts as a ligand to the cobalt center; these molecules are important for preventing or treating pernicious anemia, peripheral neuropathies, and diabetic neuropathies.6–9 Furthermore, benzimidazole is used as a fungicide, e.g., against eyespot in wheat and in sclerotinia of oilseed rape.10,11 (iv) Finally, benzimidazole molecules are reminiscent of indazole – a ligand that proved to be suitable for ruthenium complexes that are active against cancer cells both in vitro and in vivo. Thus, the compounds combine features of different classes of ruthenium compounds with well-studied biological activities: [RuIII(azole)2Cl4]− complexes, with KP1019 and NKP-133912 as prototypic representatives, on the one hand, and CO-releasing ruthenium(II) complexes, such as CORM-3, [RuII(CO)3Cl(glycinate)],13 and [RuII(CO)3Cl2L] type species with a variety of ligands,14,15 on the other. The former compounds proved to be well tolerated anticancer agents with promising activity in phase I/II clinical trials, most remarkably NKP-1339 in gastrointestinal neuroendocrine tumors.16 In contrast, CO-releasing ruthenium(II) complexes were primarily explored as anti-inflammatory agents,17e.g., in models of arthritis,18 colitis19 or peritonitis-induced sepsis20 and (due to the vasodilating effects of CO) for treatment of ischemic conditions such as myocardial infarction,21 stroke,22 diabetes-associated peripheral vascular dysfunction23 or ischemia-induced acute renal failure.24 However, very little is known about their anticancer properties. In contrast to KP1019 or KP1339, the carbonyl ligands stabilize ruthenium in the oxidation state +II, and, therefore, the complexes do not require activation by reduction.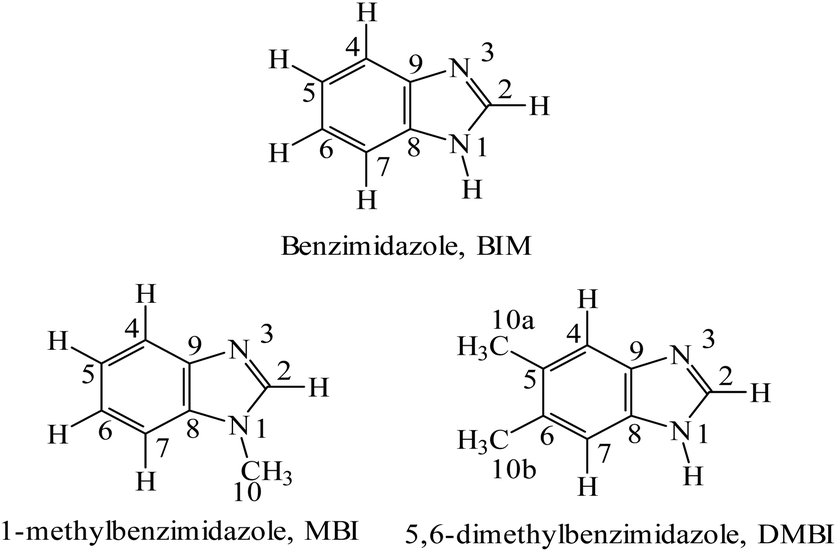 | ||
| Scheme 1 Structural formulas and numbering schemes for the ligands used for the synthesis of the fac-[RuII(CO)3Cl2L] complexes. | ||
In this work, the synthesis and characterization (including X-ray diffraction (XRD) studies) of two new compounds of the series fac-[RuII(CO)3Cl2L], with L = N-methylbenzimidazole (2) and 5,6-dimethylbenzimidazole (4), is reported. Theoretical studies on fac-[RuII(CO)3Cl2(BIM)] (BIM, benzimidazole) as a model compound for this class of complexes were performed to assess comparatively the stability of the different conformers. Interactions with model proteins were studied by ESI-MS. Furthermore, the compounds were investigated for their cytotoxic potency in human cancer cell lines in vitro as well as for their anticancer activity in a murine colon carcinoma model in vivo. Finally, the reactivity of compound 2 with the model protein hen egg-white lysozyme (HEWL) was investigated by XRD.
Experimental
Materials
fac,anti-[Ru(CO)3Cl2]2, 1, CORM-2 (Scheme 2a) (Strem Chemicals, Newburyport, MA, USA), N-methylbenzimidazole (MBI, Sigma-Aldrich), 5,6-dimethylbenzimidazole (DMBI, Sigma-Aldrich), methanol (CH3OH, J. T. Baker), chloroform (CHCl3, J. T. Baker), deuterated methanol (99.8% D, CD3OD, Acros Organics), and deuterated chloroform (99.8% D, CDCl3, Acros Organics) were used as purchased without any further treatment. Horse heart cytochrome c (Cyt c, C7752), bovine pancreatic ribonuclease type XII-A (RNase A, 055 K7695), chicken hen egg white lysozyme (HEWL, L7651) as well as all the chemicals for the various buffer solutions were purchased from Sigma-Aldrich. All the chemicals and proteins were used as received without further purification, and the solutions were prepared with deionized water produced by a Millipore system.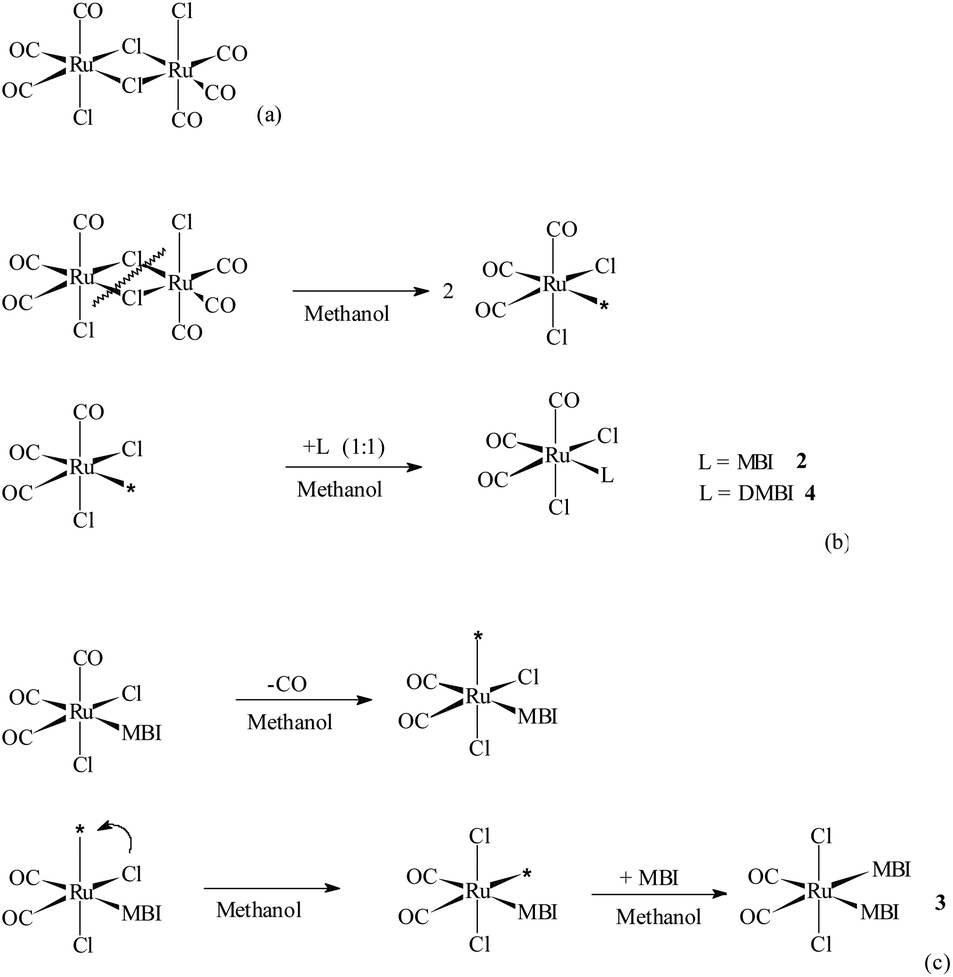 | ||
| Scheme 2 (a) Structural formula of fac,anti-[RuII(CO)3Cl2]2, 1, CORM-2; (b) schematic reaction of CORM-2 and MBI or DMBI in methanol that brings about 2 or 4; (c) schematic reaction that brings about 3. Possible penta/hexa-co-ordinate intermediates marked with * could not be isolated. | ||
Synthesis
![[N with combining low line]](https://www.rsc.org/images/entities/b_i_char_004e_0332.gif) 3-MBI)], 2, and cis,trans-[RuII(CO)2Cl2(3-MBI)2], 3.
Hundred milligrams (0.20 mmol) of a fine powder of fac,anti-[Ru(CO)3Cl2]2, 1, CORM-2, were mixed with 4 mL methanol. The solution was stirred at 25 °C up to complete dissolution. To this solution, MBI (Scheme 1, 53 mg, 0.40 mol) was added and the mixture was heated up to 55 °C. After 30 min an abundant precipitate formed and the mixture was cooled down (25 °C). After 12 h of storage, the solid was filtered off, rinsed with small portions of methanol (1 mL each) and then stored at 5 °C in the refrigerator. Yield, 120 mg, 79%. C11H8Cl2N2O3Ru (Mw 388.2). Calcd C 34.04, H 2.08, N 7.22%. Found. C 33.95, H 1.90, N 7.55%. Compound 2 shows scarce solubility in water, but is soluble in ethanol, acetone, dichloromethane, dimethylsulfoxide and in mixtures of solvents. The UV spectrum from MeOH: 253, 265, 271 and 279 (shoulder) nm. Upon 10% (v/v) H2O addition (4 h incubation), a significant decrease in the absorbance occurred. Selected IR data from the KBr matrix: 3119 cm−1 (medium = m, sharp = sh), 2133 (strong = s), 2060 (s), 2037 (s, broad = br), 1540 (sh, s), 1483 (s, sh), 1283 (s, sh), 1213 (m, sh), 773 (s, sh), 627 (s, sh), 600 (m, sh), 500 (m, sh), 483 (weak = w, sh), 460 (w, sh). Selected 1H NMR data from 2 × 10⁻² M in CDCl3 (301 K): 8.66 ppm (H2, singlet, 1H), 7.40–7.70 ppm (H4–H7, multiplet, 4H), 3.90 ppm (H(NCH3), singlet, 3H). The crystalline powder also contained colorless single crystals suitable for XRD studies. The mother solution was stored in the dark at 5 °C, and after ca. three weeks pink parallelepiped shaped crystals formed in very low yield (<3%), but proved suitable for XRD studies. Owing to the paucity of the crystals, just XRD and IR studies could be performed that allowed solving the crystal and molecular structures. The complex molecules could be formulated as cis,trans-[RuII(CO)2Cl2(L)2], 3, L = MBI. Selected IR bands were: 3143 cm−1 (w, br), 2064 (s, sh), 2008 (s, sh), 1546 (m, sh), 1518 (m, sh), 1283 (m, sh), 760 (m, sh), 663 (w, sh), 635 (w, wh), 563 (w, sh), 511 (w, sh), 455 (w, sh). The colorless powder of 2 was also subjected to re-crystallization and crystal growth procedures. Colorless crystals that formed from chloroform appeared suitable for XRD under the polarizing microscope, and one of them was used for data collection in order to get the determination of cell constants. The constants turned out to be the same as those found from the crystal obtained from methanol, within the estimated standard deviations.
3-DMBI)], 4.
Hundred milligrams (0.20 mmol) of a fine powder of fac-[Ru(CO)3Cl2]2, 1, CORM-2, were added to 4 mL of anhydrous ethanol. The suspension was kept under stirring at 25 °C up to the complete dissolution of the starting complex. Then 58 mg DMBI (0.40 mmol) were added to the clear solution. Subsequently, the suspension was heated up to 55 °C under stirring and kept in the dark for 2 h. Then the solution was concentrated via flushing ultrapure nitrogen in order to reduce the solvent volume. Finally, the flask was stored in the refrigerator at 5 °C. A colorless crystalline precipitate formed, which was filtered off and then rinsed twice with 1 mL each of cold methanol. Yield, 39%, 62 mg. C12H10Cl2N2O3Ru (Mw 402.2). Calcd C 35.84, H 2.51, N 6.97%. Found. C 35.89, H 2.44, N 7.31%. Compound 4 shows scarce solubility in water, but is soluble in ethanol, acetone, dichloromethane, dimethylsulfoxide and in mixtures of solvents. The UV spectrum from MeOH: 248, 276 and 284 nm. Upon 10% (v/v) H2O addition (4 h incubation), a significant decrease in the absorbance occurred. Selected IR bands were: 3310 cm−1 (m, br), 3182 (w), 2138 (s, sh), 2083 (s, sh), 2063 (s, br), 1542 (m, sh), 1517 (m, sh), 1310 (w, sh), 1283 (m, sh), 1200 (w, sh), 621 (m, sh), 607 (m, sh), 524 (w, sh), 469 (w, sh). The selected 1H-NMR signals from (2 × 10⁻² M) in CDCl3 (301 K) were 10.42 ppm from TMS (H1, singlet, 1H), 8.40 (H2, singlet, 1H), 7.35 (H4, singlet, 1H), 6.84 (H7, singlet, 1H), 2.28 (H(CH3-C5), singlet, 3H), 2.12 (H(CH3-C6), singlet, 3H). Colorless single crystals suitable for XRD studies also formed directly from the mother solutions stored in the refrigerator. They were collected after filtration and rinsing, by using steel needles.
3-MBI)], 2, and cis,trans-[RuII(CO)2Cl2(3-MBI)2], 3.
Hundred milligrams (0.20 mmol) of a fine powder of fac,anti-[Ru(CO)3Cl2]2, 1, CORM-2, were mixed with 4 mL methanol. The solution was stirred at 25 °C up to complete dissolution. To this solution, MBI (Scheme 1, 53 mg, 0.40 mol) was added and the mixture was heated up to 55 °C. After 30 min an abundant precipitate formed and the mixture was cooled down (25 °C). After 12 h of storage, the solid was filtered off, rinsed with small portions of methanol (1 mL each) and then stored at 5 °C in the refrigerator. Yield, 120 mg, 79%. C11H8Cl2N2O3Ru (Mw 388.2). Calcd C 34.04, H 2.08, N 7.22%. Found. C 33.95, H 1.90, N 7.55%. Compound 2 shows scarce solubility in water, but is soluble in ethanol, acetone, dichloromethane, dimethylsulfoxide and in mixtures of solvents. The UV spectrum from MeOH: 253, 265, 271 and 279 (shoulder) nm. Upon 10% (v/v) H2O addition (4 h incubation), a significant decrease in the absorbance occurred. Selected IR data from the KBr matrix: 3119 cm−1 (medium = m, sharp = sh), 2133 (strong = s), 2060 (s), 2037 (s, broad = br), 1540 (sh, s), 1483 (s, sh), 1283 (s, sh), 1213 (m, sh), 773 (s, sh), 627 (s, sh), 600 (m, sh), 500 (m, sh), 483 (weak = w, sh), 460 (w, sh). Selected 1H NMR data from 2 × 10⁻² M in CDCl3 (301 K): 8.66 ppm (H2, singlet, 1H), 7.40–7.70 ppm (H4–H7, multiplet, 4H), 3.90 ppm (H(NCH3), singlet, 3H). The crystalline powder also contained colorless single crystals suitable for XRD studies. The mother solution was stored in the dark at 5 °C, and after ca. three weeks pink parallelepiped shaped crystals formed in very low yield (<3%), but proved suitable for XRD studies. Owing to the paucity of the crystals, just XRD and IR studies could be performed that allowed solving the crystal and molecular structures. The complex molecules could be formulated as cis,trans-[RuII(CO)2Cl2(L)2], 3, L = MBI. Selected IR bands were: 3143 cm−1 (w, br), 2064 (s, sh), 2008 (s, sh), 1546 (m, sh), 1518 (m, sh), 1283 (m, sh), 760 (m, sh), 663 (w, sh), 635 (w, wh), 563 (w, sh), 511 (w, sh), 455 (w, sh). The colorless powder of 2 was also subjected to re-crystallization and crystal growth procedures. Colorless crystals that formed from chloroform appeared suitable for XRD under the polarizing microscope, and one of them was used for data collection in order to get the determination of cell constants. The constants turned out to be the same as those found from the crystal obtained from methanol, within the estimated standard deviations.
3-DMBI)], 4.
Hundred milligrams (0.20 mmol) of a fine powder of fac-[Ru(CO)3Cl2]2, 1, CORM-2, were added to 4 mL of anhydrous ethanol. The suspension was kept under stirring at 25 °C up to the complete dissolution of the starting complex. Then 58 mg DMBI (0.40 mmol) were added to the clear solution. Subsequently, the suspension was heated up to 55 °C under stirring and kept in the dark for 2 h. Then the solution was concentrated via flushing ultrapure nitrogen in order to reduce the solvent volume. Finally, the flask was stored in the refrigerator at 5 °C. A colorless crystalline precipitate formed, which was filtered off and then rinsed twice with 1 mL each of cold methanol. Yield, 39%, 62 mg. C12H10Cl2N2O3Ru (Mw 402.2). Calcd C 35.84, H 2.51, N 6.97%. Found. C 35.89, H 2.44, N 7.31%. Compound 4 shows scarce solubility in water, but is soluble in ethanol, acetone, dichloromethane, dimethylsulfoxide and in mixtures of solvents. The UV spectrum from MeOH: 248, 276 and 284 nm. Upon 10% (v/v) H2O addition (4 h incubation), a significant decrease in the absorbance occurred. Selected IR bands were: 3310 cm−1 (m, br), 3182 (w), 2138 (s, sh), 2083 (s, sh), 2063 (s, br), 1542 (m, sh), 1517 (m, sh), 1310 (w, sh), 1283 (m, sh), 1200 (w, sh), 621 (m, sh), 607 (m, sh), 524 (w, sh), 469 (w, sh). The selected 1H-NMR signals from (2 × 10⁻² M) in CDCl3 (301 K) were 10.42 ppm from TMS (H1, singlet, 1H), 8.40 (H2, singlet, 1H), 7.35 (H4, singlet, 1H), 6.84 (H7, singlet, 1H), 2.28 (H(CH3-C5), singlet, 3H), 2.12 (H(CH3-C6), singlet, 3H). Colorless single crystals suitable for XRD studies also formed directly from the mother solutions stored in the refrigerator. They were collected after filtration and rinsing, by using steel needles.
Spectroscopy
X-ray crystallography
Selected crystallographic parameters are reported in Table 1. Data from crystals of fac-[RuII(CO)3Cl2(3-MBI)], 2, cis,trans-[RuII(CO)2Cl2(3-MBI)2], 3, and fac-[RuII(CO)3Cl2(3-DMBI)], 4, were collected with an Xcalibur™-S-Oxford diffraction instrument equipped with CrysAlisPRO software. The machine was equipped with a Kappa geometry goniometer, a CCD EOS 92 mm detector, a graphite crystal monochromator and an Enhance™ X-ray source. The temperature for crystal data determinations and collections of full data sets was 293 ± 2 K, and the radiation was λ = 0.71073 Å for all the compounds. The crystals of 2 and 4 were colorless and needle and parallelepiped shaped with dimensions of 0.40 × 0.05 × 0.05 mm and 0.30 × 0.02 × 0.02 mm, respectively. The crystal of 3 was pink and parallelepiped shaped with dimensions of 0.30 × 0.20 × 0.10 mm. The structures were solved through direct methods implemented in SHELXS-86/9725,26 and the refinements were carried out by using the standard least-squares methods of SHELXL-97.27 On refinement of the structure of 3 the benzo ring B was restrained to an idealized hexagon where C–C distances were fixed at 1.390 Å through the AFIX option of SHELXL-97. In all the structural analysis, the non-hydrogen atoms were treated as anisotropic, whereas the hydrogen atoms were treated as isotropic and let free to ride on the atoms to which they are linked. The thermal parameters for hydrogen atoms were fixed at 1.2 or 1.5 times the Ueq. value for the atoms to which they are attached. The analyses of geometrical parameters and molecular graphics were performed by using PARST,28 ORTEP-32,29 and Mercury.30 SHELXS/L, PARST and ORTEP software subroutines were implemented in the WinGX package.31 All the software packages resided in Pentium IV machines.
3-MBI)], 2, cis,trans-[Ru(CO)2Cl2(3-MBI)2], 3, and fac-[Ru(CO)3Cl2(3-DMBI)], 4. The temperature for data collection was 293 ± 2 K, X-ray wavelength was λ = 0.71073 Å, and refinement method was least-squares on F2 for all compounds
| 2 | 3 | 4 | |
|---|---|---|---|
| a [I ≥ 2σ(I)]. b R 1 = ∑‖Fo| − |Fc‖/∑|Fo|, wR2 = [∑w(Fo2 − Fc2)2/∑wFo4]1/2. | |||
| Formula | C11H8Cl2N2O3Ru | C18H16Cl2N4O2Ru | C12H10Cl2N2O3Ru |
| Molecular weight | 388.20 | 492.32 | 402.19 |
| Crystal system | Monoclinic | Monoclinic | Orthorhombic |
| Space group | P21/c | P21/c | P212121 |
| a (Å) | 7.4138(9) | 12.818(5) | 10.4194(3) |
| b (Å) | 20.935(3) | 11.653(5) | 10.4212(4) |
| c (Å) | 9.771(1) | 13.918(5) | 14.7120(5) |
| α (°) | 90 | 90 | 90 |
| β (°) | 109.94(1) | 105.766(5) | 90 |
| γ (°) | 90 | 90 | 90 |
| Cell volume (Å3) | 1425.7(3) | 2001(1) | 1597.5(1) |
| Z | 4 | 4 | 4 |
| D calc. (Mg m3) | 2.261 | 1.634 | 1.672 |
| M(Mo-Kα) (mm−1) | 1.846 | 1.071 | 1.321 |
| F(000) | 950 | 984 | 792 |
| Crystal size (mm) | 0.40 × 0.05 × 0.05 | 0.30 × 0.20 × 0.20 | 0.25 × 0.25 × 0.20 |
| 2θ range (°) | 4.84–58.36 | 4.64–58.26 | 4.78–58.46 |
| Index range | −9 ≤ h ≤ 10 | −17 ≤ h ≤ 10 | −13 ≤ h ≤ 11 |
| −28 ≤ k ≤ 27 | −14 ≤ k ≤ 14 | −14 ≤ k ≤ 14 | |
| −13 ≤ l ≤ 12 | −17 ≤ l ≤ 18 | −12 ≤ l ≤ 18 | |
| No. refls collected | 14![[thin space (1/6-em)]](https://www.rsc.org/images/entities/char_2009.gif) 918 918 |
8991 | 7473 |
| No. unique refls | 3483 | 4565 | 3526 |
| Data/restraints/parameters | 3483/0/204 | 4565/0/223 | 3526/0/181 |
|
R
1a, % |
2.98 | 4.87 | 2.95 |
| wR2b, % |
6.12 | 8.33 | 5.79 |
| R 1 % (all data)a | 6.21 | 15.15 | 4.20 |
| Flack parameter | -0.0385 | ||
| GOF on F2 | 0.841 | 0.689 | 0.874 |
| Δρmax,min (e Å3) | 0.41, −0.54 | 0.50, −0.44 | 0.41, −0.32 |
Crystallization, X-ray diffraction data collection, structure solution and refinement for Ru-protein systems
Hen egg-white lysozyme (HEWL) was incubated for 2 h in the presence of fac-[RuII(CO)3Cl2(3-MBI)], 2, in a 1:10 protein to metal compound ratio at 20 °C. The adduct for the HEWL/fac-[RuII(CO)3Cl2(3-MBI)] system (hereafter, HEWL-RuMBI) was then crystallized by using the hanging drop vapor diffusion method.
Drops of 1 μL were prepared at room temperature by mixing 0.5 μL of the HEWL-RuMBI adduct at a concentration of 15 mg mL−1 with an equal amount of a reservoir constituted by 1.1 M NaCl and 0.1 M acetate buffer, pH 4.0. Crystals of the adduct grew within 24–48 h.
X-ray diffraction data of these crystals were collected at 100 K, without using a cryoprotectant, at the CNR Institute of Biostructures and Bioimaging, with a Rigaku Micromax007 HF rotating anode generator. The crystals diffracted at a 2.25 Å resolution. Data were indexed, integrated and scaled using HKL200032 in the P4(3)2(1)2 space group (a = b = 78.50, c = 36.31 Å) with an overall completeness of 99.4% (100%), Rmerge of 0.085 (0.44), multiplicity of 6.2 (6.3) and average I/σ(I) of 12.9 (5.0). Values in parentheses correspond to the last resolution shell (2.29–2.25 Å) (Table S1†).
The structure of HEWL-RuMBI was solved with Phaser33 using the coordinates of the Protein Data Bank (PDB) entry 193L,34 without ligands, as the starting model and refined using Refmac5.35 Several cycles of restrained refinement followed by visual inspection in Coot36 were performed in order to improve the model.
The final model of HEWL-RuMBI, which includes 159 water molecules, a fragment of cis,trans-[RuII(CO)3Cl2(3-MBI)], 3 Cl− ions and 1 Na+ ion was refined to an R-factor of 15.2% (R-free of 23.7%). Statistics of the refinement are also reported in Table S1.†
Structure validation has been carried out by using Procheck.37 99.1% of the residues lie in favored regions of the Ramachandran plot, and there are no outliers. Rms deviations for bond distances and angles have the expected values regarding the structure resolution (0.020 Å and 1.93°, respectively). The coordinates and structure factors have been deposited in PDB with accession number 5E9R.
Computational methods
3-BIM/MBI)]. The levels of theory used to compute the structures of the complexes were B3LYP/(Lanl2DZ,ClRu;6-31G,CHNO), BS1; B3LYP/(Lanl2DZ,Ru;6-31G**,CHClNO), BS2, and B3LYP/(Lanl2DZ,Ru;6-311++G**,CHClNO), BS3 levels of theory39 and the structure optimization was continued up to the threshold values implemented in Gaussian 0938 (maximum force 0.000450 mdyn, root-mean-square (rms) force 0.000300 mdyn, maximum displacement 0.001800 Å, rms displacement 0.001200 Å). The analysis of the Hessian showed no negative frequency for the selected optimized structures. Molecular drawings were obtained with the package GaussView03.40
Spectrophotometric studies on RuII complexes and protein systems
To assess the compound stability and interactions with proteins, spectrophotometric studies were performed by using a Varian Cary 50 Bio UV-Vis spectrophotometer. Small amounts of freshly prepared concentrated solutions of the individual compounds in DMSO were diluted in phosphate buffer (PB, 10 mM phosphate without NaCl and KCl, pH 7.4). The concentration of each compound in the final sample was 3 × 10⁻⁵ M. The resulting solutions were monitored by a collection of the electronic spectra for 72 h at room temperature. Similar spectrophotometric studies were conducted in the presence of three selected model proteins, i.e., HEWL, Cyt c, and RNase A. Electronic spectra of the compounds at 3 × 10⁻⁵ M were recorded before and after the addition of each model protein at a stoichiometric ratio of 3:1 (metal to protein) for 72 h at room temperature in 10 mM phosphate buffer, pH 7.4.
Preparation of the metallo-drug–protein samples and ESI-MS studies
Metal complex–protein adducts were prepared starting from a solution of each model protein at a concentration of 10−4 M in 20 mM ammonium acetate buffer, pH 7.4. Then, the ruthenium complex was added (3:1 metal-to-protein ratio) to the solution and the mixture was incubated at 37 °C for 72 h, by using a Thermoblock (Falc, TD15093). After a 20-fold dilution with water, ESI-MS spectra were recorded by direct introduction of the sample at a flow rate of 5 μL min−1 into an Orbitrap high-resolution mass spectrometer (Thermo Scientific, San Jose, CA, USA) equipped with a conventional ESI source. The working conditions were as follows: spray voltage 3.1 kV, capillary voltage 45 V, and capillary temperature 220 °C. The sheath and the auxiliary gasses were set at 17 (arbitrary units) and 1 (arbitrary unit), respectively. For acquisition, Xcalibur 2.0 (Thermo Scientific) was used and monoisotopic and average deconvoluted masses were obtained by using the integrated Xtract tool. For spectrum acquisition, a nominal resolution (at m/z 400) of 100000 was used.
Cell lines and culture conditions
CH1 (provided by Lloyd R. Kelland, CRC Centre for Cancer Therapeutics, Institute of Cancer Research, Sutton, UK; identified by STR profiling as PA-1 ovarian teratocarcinoma cells by Multiplexion, Heidelberg, Germany; compare Korch et al.41), SW480 (colon carcinoma; from ATCC) and A549 (non-small cell lung cancer; from ATCC) cells were grown as adherent monolayer cultures in 75 cm2 culture flasks (Starlab, UK) in minimal essential medium (MEM) supplemented with 10% heat-inactivated fetal bovine serum, 1 mM sodium pyruvate, 4 mM L-glutamine, and a 1% nonessential amino acid solution (all purchased from Sigma-Aldrich Austria). The murine colon cancer cell line CT-26 (from ATCC) was grown in DMEM/F12 medium (Sigma-Aldrich) supplemented with 10% heat-inactivated fetal bovine serum. Cell cultures were incubated at 37 °C under a moist atmosphere containing 5% CO2 in air.Cytotoxicity tests
Cytotoxicity was determined by the colorimetric MTT assay (MTT = 3-(4,5-dimethyl-2-thiazolyl)-2,5-diphenyl-2H-tetrazolium bromide). For this purpose, cells were harvested from culture flasks by trypsinization, seeded in 100 μL aliquots into 96-well microculture plates (Starlab, UK) in densities of 1 × 10³ cells per well (CH1/PA-1), 2.5 × 10³ cells per well (SW480) and 3 × 10³ cells per well (A549), and incubated for 24 h before exposure to test compounds. Stock solutions of each complex were prepared in DMSO or DMF, diluted in MEM (not exceeding a final content of 0.5% v/v of the organic solvent), and serial dilutions were added in aliquots of 100 μL per well. After continuous exposure for 96 h, drug solutions were replaced with 100 μL medium/MTT mixtures [6 parts of RPMI 1640 medium supplemented with 10% heat-inactivated fetal bovine serum and 2 mM L-glutamine; 1 part of MTT solution in phosphate-buffered saline (5 mg mL−1)]. After incubation for 4 h, medium/MTT mixtures were removed, and the produced formazan crystals were dissolved in 150 μL DMSO per well. Optical densities at 550 nm were measured spectrophotometrically (ELx808 Absorbance Microplate Reader, Bio-Tek, Winooski, VT, USA) by using a reference wavelength of 690 nm to correct for unspecific absorption. 50% inhibitory concentrations (IC50) were calculated from concentration–effect curves by interpolation, based on at least three independent experiments, each comprising triplicates per concentration level.Animal experiments
All animal experiments were approved by the local ethics commission and carried out according to the Austrian and FELASA guidelines for animal care and protection. Six- to eight-week-old female Balb/c mice (weighing ∼20 g) were purchased from Harlan Laboratories, San Pietro al Natisone, Italy. The animals were kept in a pathogen-free environment, and every procedure was done in a laminar airflow cabinet. Murine CT-26 cells (5 × 10⁵) were injected subcutaneously into the right flank of female Balb/c mice. The animals were treated with the drug intraperitoneally (2.5 mg kg−1; solutions freshly prepared in 20% propylene glycol, with the exception of CORM-3 which was dissolved in water) on days 4, 5, 7, 8, 11, 12, 14 and 15. The animals were controlled for distress development every day, and the tumor size was assessed regularly by caliper measurement. The tumor volume was calculated using the formula: length × width2/2.Results and discussion
Compounds 2, 3 and 4 were obtained through the dissociation of bridging Ru–Cl–Ru bonds in 1, CORM-2 (Scheme 2a) and by the direct linkage of MBI and DMBI to RuII centers leading to the formation of the respective mononuclear species (Scheme 2b–c). For experimental details regarding conceivable procedures for the preparation of 3 in a higher yield compare ref. 4 that treats the analogous species cis,trans-[RuII(CO)2Cl2(THZ)2], THZ = 1,3-thiazole.X-ray crystallography
3-MBI)], 2, and fac-[RuII(CO)3Cl2(3-DMBI)], 4.
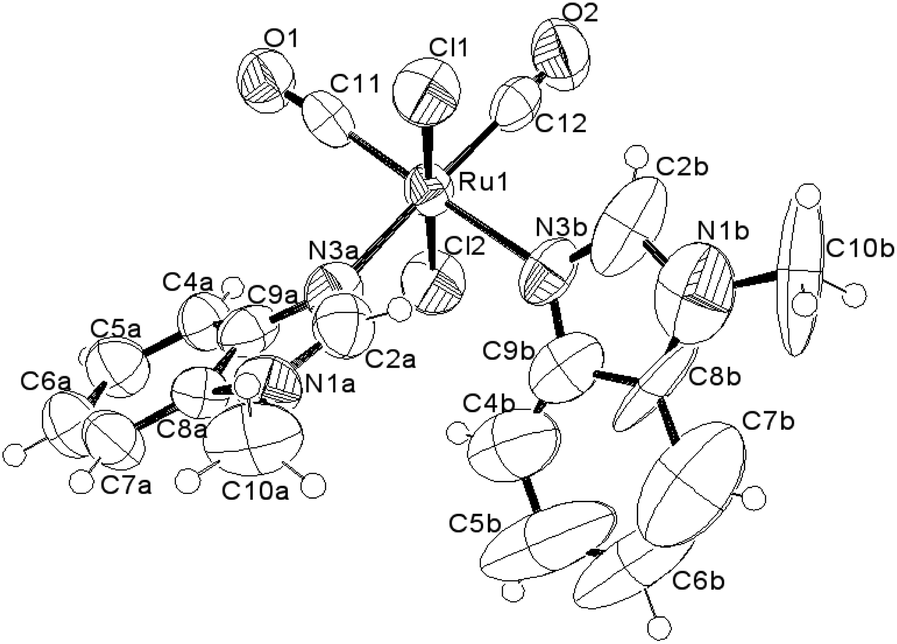
The molecular structures for 2 and 4 are pictured in Fig. 1 and 2, respectively, whereas selected bond distances and angles are listed in Table 2 (and Table S2†). The coordination arrangement is similar to that previously described for analogous THZ derivatives.3,4 It has to be noticed that the orientation of the MBI and DMBI planes with respect to the equatorial cis-{RuII(CO)2Cl2} plane around the Ru–N vector can be described as type-A (Scheme 3). Thus, the projection of the MBI and DMBI planes is almost bisecting the Cl–Ru–Cl and OC–Ru–CO bond angles. Therefore, this arrangement is different with respect to that found for IM and MIM derivatives.3 The N3A–C2A and N3A–C9A bond distances did not change significantly upon the ligation to the metal (from 1.315(8)42 to 1.320(3) Å, and from 1.390(7)42 to 1.396(3) Å, respectively, for MBI, 2). The corresponding parameters for 4 are 1.324(4) and 1.335(4) Å. The Ru–N3A–C2A and Ru–N3A–C9A bond angles are 124.0(2) and 130.0(2)° (2) and 123.4(2) and 131.1(2)° (4), in agreement with a hindrance by the benzo ring and the equatorial plane and data for IM and MIM derivatives.3 The bond parameters for 4 agree well with those relevant to the structure for 5,6-dimethyl-l-(α-D-ribofuranosyl)benzimidazole, the analogous benzimidazole that is present in vitamin B12.43
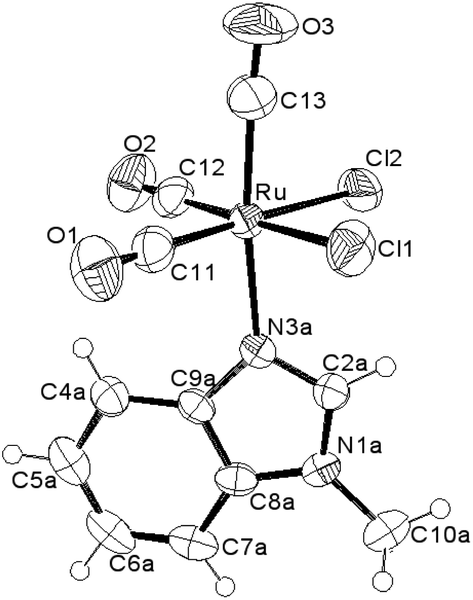 | ||
| Fig. 1 ORTEP-style diagram for the molecular structure of fac-[RuII(CO)3Cl2(3-MBI)], 2. Ellipsoids enclose 50% probability. | ||
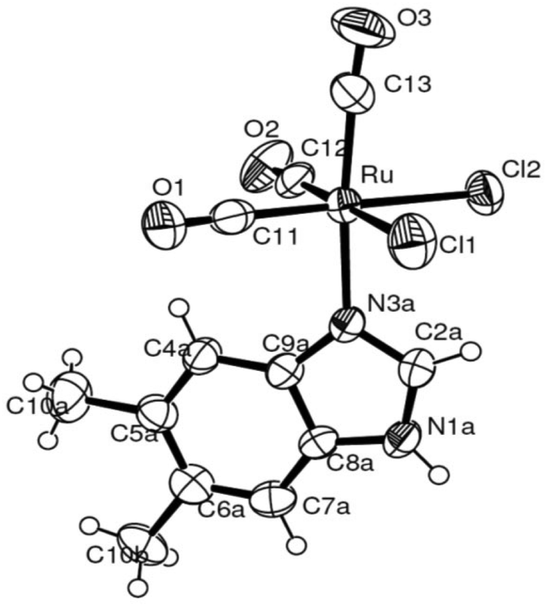 | ||
| Fig. 2 ORTEP-style diagram for the molecular structure of fac-[RuII(CO)3Cl2(3-DMBI)], 4. Ellipsoids enclose 50% probability. | ||
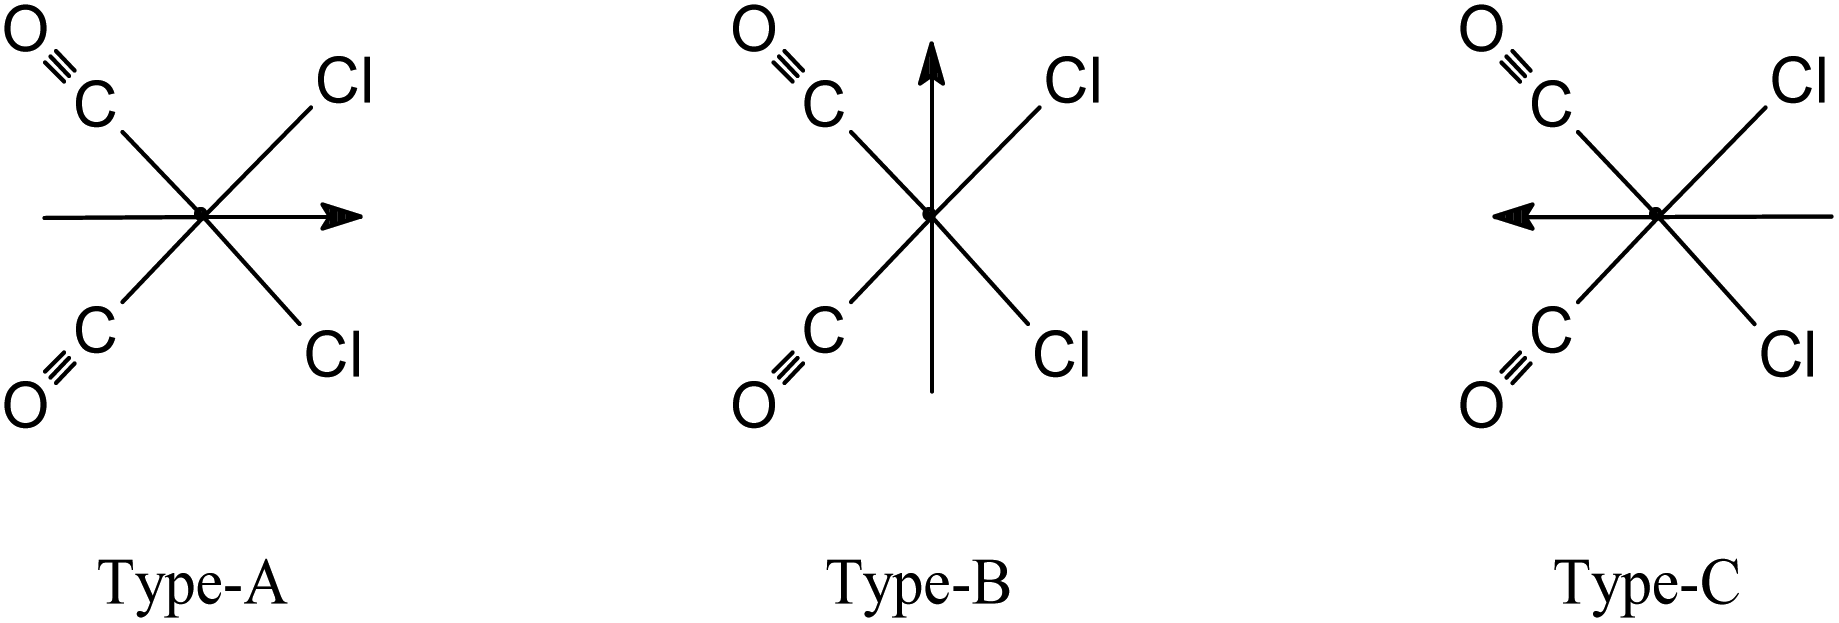 | ||
| Scheme 3 View of a general fac-[RuII(CO)3Cl2L] complex molecule along the OC–Ru–N vector from up to down for type-A, -B and -C rotamers. Ligand L (= BIM, MBI or DMBI) is represented by an arrow. The arrow is oriented parallel to the C2–H2 bond vector. | ||
3-MBI)], 2, cis,trans-[RuII(CO)2Cl2(3-MBI)2], 3, and fac-[RuII(CO)3Cl2(3-DMBI)], 4
| Vector | Length | |||
|---|---|---|---|---|
| 2 | 3A | 3B | 4 | |
| Ru1–Cl1 | 2.4056(9) | 2.399(2) | 2.400(1) | |
| Ru1–Cl2 | 2.4005(8) | 2.403(2) | 2.415(1) | |
| Ru1–N3A | 2.108(2) | 2.125(4) | 2.128(5) | 2.105(2) |
| Ru1–C11 | 1.907(3) | 1.868(7) | 1.900(6) | 1.891(4) |
| Ru1–C12 | 1.885(3) | 1.887(4) | ||
| Ru1–C13 | 1.911(3) | 1.931(4) | ||
| O1–C11 | 1.126(3) | 1.119(6) | 1.134(4) | |
| O2–C12 | 1.132(3) | 1.064(5) | 1.136(4) | |
| O3–C13 | 1.113(3) | 1.111(4) | ||
| N3A–C2A | 1.320(3) | 1.370(6) | 1.372(9) | 1.324(4) |
| N1A–C2A | 1.340(3) | 1.307(6) | 1.300(8) | 1.335(4) |
| N3A–C9A | 1.396(3) | 1.355(7) | 1.329(5) | 1.399(4) |
| N1A–C8A | 1.375(3) | 1.430(7) | 1.352(8) | 1.372(4) |
| N1A–C10A | 1.451(4) | 1.435(7) | 1.550(9) | |
| Vectors | Angle | |||
|---|---|---|---|---|
| 2 | 3A | 3B | 4 | |
| Cl2 Ru1 Cl1 | 91.75(3) | 178.0(6) | 89.3(3) | |
| N3A–Ru1–Cl1 | 88.97(6) | 86.6(1) | 87.9(2) | 88.8(1) |
| C11–Ru1–Cl1 | 85.76(9) | 90.9(2) | 87.6(1) | |
| C12–Ru1–Cl1 | 178.40(9) | 91.2(2) | 179.7(1) | |
| C13–Ru1–Cl1 | 87.34(11) | 88.8(1) | ||
| N3A–Ru1–Cl2 | 87.92(6) | 92.3(1) | 90.3(1) | 90.8(3) |
| C11–Ru1–Cl2 | 177.34(9) | 90.9(2) | 176.9(1) | |
| C12–Ru1–Cl2 | 87.33(9) | 89.2(2) | 90.7(1) | |
| C13–Ru1–Cl2 | 85.73(10) | 87.2(2) | 87.4(1) | |
| C11–Ru1–N3A | 91.09(10) | 93.1(2) | 177.8(2) | 90.1(1) |
| C12–Ru1–N3A | 92.29(10) | 176.3(2) | 89.8(2) | 90.8(1) |
| C13–Ru1–N3A | 172.55(11) | 174.6(2) | ||
| C12–Ru1–C11 | 95.18(12) | 89.9(2) | 92.4(2) | |
| C11–Ru1–C13 | 95.09(14) | 92.6(2) | ||
| C12–Ru1–C13 | 91.30(14) | 91.6(2) | ||
| C2A–N3A–Ru1 | 124.04(17) | 123.6(4) | 121.5(5) | 123.4(2) |
| C9A–N3A–Ru1 | 129.97(17) | 131.9(4) | 132.7(4) | 131.1(2) |
| O1–C11–Ru1 | 177.8(3) | 176.6(5) | 177.9(3) | |
| O2–C12–Ru1 | 178.8(3) | 177.3(5) | 179.3(3) | |
| O3–C13–Ru1 | 175.5(3) | 175.7(4) | ||
| N3A–C2A–N1A | 112.5(2) | 113.0(6) | 110.6(9) | 111.9(3) |
| C2A–N3A–C9A | 105.9(2) | 104.2(5) | 105.7(5) | 105.4(3) |
| C4A–C9A–N3A | 131.2(2) | 130.7(6) | 131.0(3) | 131.6(3) |
| C8A–C9A–N3A | 107.9(2) | 112.0(6) | 109.0(3) | 108.6(3) |
The Ru–Cl bond distances average 2.407(1) Å and are in agreement with the values from 2 and 3 and similar structures.3 It is worth noting that C2A–N3A–C9A for 4 is 105.4(3)°, which differs by 3.8° from the corresponding value for the HDMBI+Cl− salt44 but is in perfect agreement with the computed value for the neutral and not metal bound DMBI molecule (104.8°). This comparative analysis shows that the linkage to the RuII center has less dramatic effects than protonation at N3. In fact, the computations for the HDMBI+ cation at the same level of theory gave 109.6°, which was in perfect agreement with the experimental value for HDMBI+Cl−.44
Hydrogen bond-type interactions (HBTIs) and stacking interactions. Selected HBTIs, and the analysis of selected planes and stacking interactions (also related to DNA double helix stacking interactions) for 2, 3 and 4 are listed in the ESI (see ref. 45 and Fig. S1 and S2, and Table S3†).
3-MBI)2], 3.
The molecular structure and the crystal structure of cis,trans-[RuII(CO)2Cl2(3-MBI)2], 3, are reported in Fig. 3 and S3, S4,† respectively, whereas the selected bond distances and bond angles are listed in Table 2 (and Table S2†). The coordination arrangement is pseudo octahedral, and the Ru(II) ion is linked to two CO ligands (cis to each other), to two chlorido ligands (trans to each other) and to two N3 atoms from the two MBI ligands. It is noteworthy that the two MBI ligands have the head-to-head (HH) disposition (Scheme 4). In other words, the two C2–H2 vectors point toward the same side of the plane defined by the two C donors and the two N donors. Notably, this arrangement type is related to cis-PtA2 (A, amine ligand) residues linked to two guanine residues of DNA.46
 | ||
| Fig. 3 ORTEP-style diagram for the molecular structure of cis,trans-[RuII(CO)2Cl2(3-MBI)2], 3. Ellipsoids enclose 50% probability. | ||
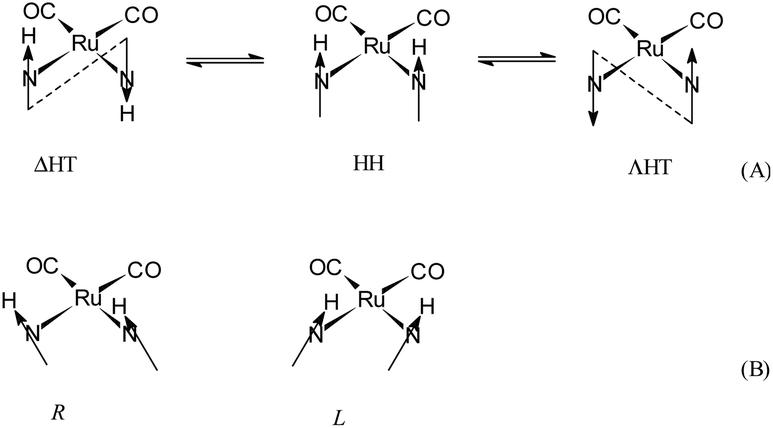 | ||
| Scheme 4 Schematic drawing of the cis,cis-[RuII(CO)2(3-MBI)2] entity as viewed (A) almost along the Cl–Ru–Cl axis of 3. Possible conformers (head-to-head, HH, and head-to-tail, HT) for complexes with two cis untethered guanine ligands, and (B) of R and L canting of the nucleobases. | ||
As shown in Fig. 3, the arrangement for the two MBI ligands in the solid state belongs to the HH-L conformer (HH-R also present owing to the symmetry operation). The HH arrangement for two cis purine-like ligands has a scarce frequency at least for a cis-PtIIA2(purine)2 planar species. It could be interesting and innovative to see if octahedral cis-{RuII(CO)2}-core entities are able to interact with intra-strand and cis-(purine-like) residues in model complexes and DNA fragments.
The endo-cyclic atoms of the two benzimidazole systems define two good least-squares planes, the dihedral angle between them being 58.4(5)°. The canting angles between the plane defined by the two C donors and the two N donors are 42.0(3)° and 47.0(6)° for A and B MBI ligands, respectively. The C4B–H4B vector points towards the C9A atom H4B⋯C9A 3.30(3) Å, Ĥ4B 131(1)° and that is reminiscent of a hydrogen bond type interaction (HBTI) or of a C–H⋯π interaction.47 The Ru-N3B line and the plane defined by heavy endo-cyclic atoms of the MBI-B are tilted by ca. 5(1)°, and the benzo ring points towards the MBI-A system, confirming an attractive interaction between the two MBI systems. Inter-molecular stacking interactions are represented in Fig. S5.†
Spectroscopy
| fac-[RuII(CO)3L3]2+ + OH− → [(HOOC)RuII(CO)2L3]+ | (1) |
| [(HOOC)RuII(CO)2L3]+ → [HRuII(CO)2L3]+ + CO2 | (2) |
Finally, the spectra in the solid state for 3 and 4 are in agreement with other studies44,51,52 (Table S4, and Fig. S8, S12, S13†).
3-MBI)], 2 and fac-[Ru(CO)3Cl2(3-DMBI)], 4, dissolved in CDCl3 (200 MHz machine) and DMSO-D6 (500 MHz machine). The solubility in CD3OD was too low for NMR studies. The spectrum of 2 in CDCl3 (Fig. S14a†) showed a singlet at 8.66 ppm relevant to the H2 proton and a multiplet (7.40–7.70 ppm) relevant to the four protons from the benzo-ring hydrogen atoms (H4–H7). The signals for protons from the NCH3 grouping were also identified at 3.90 ppm. The pattern recorded for complex 4 in CDCl3 (Fig. S14b†) showed peaks as sharp singlets (one proton: 8.40 ppm, H2; 7.35 ppm, H4; 6.84 ppm, H7; three protons: 2.28 ppm, CH3(C5); 2.12 ppm, CH3(C6)), and a broad singlet (one proton, 10.42 ppm, H1). The pattern was stable for several days (at least five, 20 °C).
Spectra recorded from DMSO-D6 solutions revealed that the MBI and DMBI derivatives were sensitive to different extents (Fig. S15 and S16†). After dissolution, the derivatives showed a dissociation of the azoles. A significant replacement (larger than 50%) required not less than 4 h and 24 h for 2 and 4, respectively. It is reasonable to assume that the full dissociation in a solution obtained from freshly prepared DMSO + water/aqueous buffer takes longer. This dissociation effect has to be compared to the dissociations of other Ru complexes reported by other authors.53
Similarly, the spectra recorded in DMF-D7 revealed that the MBI and DMBI derivatives show different stabilities (Fig. S17 and S18†). As regards 2, the peak patterns in the aromatic proton region 7.5–9.0 ppm did not change appreciably within 16.5 h from the dissolution of the complex in DMF-D7. Instead, the peak pattern for 4 in the aromatic proton region 7.0–14.0 ppm showed the occurrence of new peaks attributable to the dissociation of ligands already after 2.5 h from the dissolution of the complex. After 17.5 h from dissolution, the decomposition of the original complex could be estimated as ca. 10–15%. The faster sensitivity of 4 compared to 2 could be tentatively explained with the presence of a polar N–H function in 4, which in 2 is replaced by a non-polar N–CH3 group.
High performance liquid chromatography (HPLC)
The chromatograms for 2, 3 and 4 are depicted in Fig. S19.† They were obtained by injecting an aliquot of 20 μL of solutions of the respective compounds (0.5 mg mL−1) in CH3CN and then eluting with the same solvent. The UV detector was set to 250 nm. The retention times were 3.48 (2), 3.61 (3) and 3.65 (4) min, respectively, for a C18-A 5μ HPLC column (Varian Polaris, 250 × 4.6 mm) at a flux of 0.75 mL min−1. The chromatograms for 2 and 4 revealed very high purity for the complexes; only the chromatogram for 3 showed some negligible impurities.DFT and semi-empirical computations
Details of results from DFT (BS1, BS2, BS3 levels of theory) and semiempirical (ZINDO1) calculations are presented in the ESI (Table S5† for computed ligands). We wish to summarize here the following:The computed enthalpy of formation at 298.15 K for the isomer fac,anti-[RuII2(CO)6Cl4] is ca. 6.5 kcal mol−1 more favorable than that for fac,syn-[RuII2(CO)6Cl4], confirming that the material described by other authors48 and used as the starting material in the present work is the fac,anti isomer (see Fig. S20a† for the computed structure and Table S5† for selected structural parameters). The dimeric molecule fac,anti-[RuII2(CO)6Cl4] was also preliminarily investigated regarding the reactivity with a water molecule and with a hydroxide anion in the gas phase. On optimizing an adduct that consisted of [RuII2(CO)6Cl4]⋯H2O (where the water molecule was set arbitrarily in a position so as to donate a hydrogen to a terminal chlorido and to donate a second hydrogen to a bridging chlorido ligand), the adduct went to full convergence as represented in Fig. 4a.
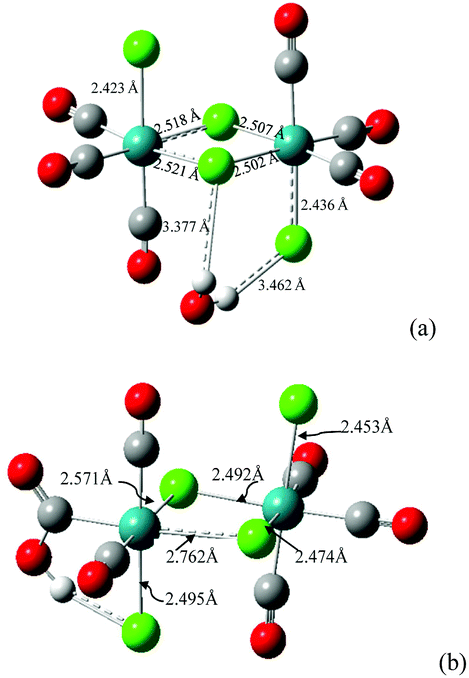 | ||
| Fig. 4 (a) Optimized structure of the adduct fac,anti-[RuII2(CO)6Cl4]⋯H2O. The hydrogen bond type interactions and the weakened Ru⋯Cl interactions are depicted as dashed lines. (b) Optimized structure obtained by starting from an fac,anti-[RuII2(CO)6Cl4]⋯OH− adduct that had the hydroxide anion as donating to a Ru–Cl function and midway from the two halves of the dimer. The hydrogen bond type interactions and the weakened Ru⋯Clb interactions are depicted as dashed lines. The selected bond distances are also represented. | ||
The effect on structural parameters of the dimer is small but in agreement with a breakage of the dimer, bringing about a free chloride and a fac-{*RuII(CO)3Cl2} residue, a possible precursor for fac-[RuII(CO)3Cl2(L)]. A second residue of the type fac-{**RuII(CO)3Cl} can reasonably produce fac-[RuII(CO)3-Cl2(L) or -Cl(L)2] (charge has been omitted for the last hypothesis). A subsequent computation of fac,anti-[RuII2(CO)6Cl4] with a hydroxide anion was performed, and a structure that had the OH− donating to a Clb (O⋯Cl 2.568 Å, Ĥ 119.0°) was optimized. Interestingly, the final structure (Fig. 4b) had changed to a fac-[RuII(CO)2(η1-![[C with combining low line]](https://www.rsc.org/images/entities/i_char_0043_0332.gif) -COOH)Cl(μ-Cl)2RuII(CO)3Cl]− anionic complex molecule. These data suggest that the dimer entity is about to break, and a coordinatively unsaturated particle cis,cis-{**RuII(CO)2(η1--COOH)Cl}− is a possible product. This is reminiscent of the particle type [(HOOC)RuII(CO)2L3]+ invoked in ref. 50 and discussed above in the analysis of IR data.
-COOH)Cl(μ-Cl)2RuII(CO)3Cl]− anionic complex molecule. These data suggest that the dimer entity is about to break, and a coordinatively unsaturated particle cis,cis-{**RuII(CO)2(η1--COOH)Cl}− is a possible product. This is reminiscent of the particle type [(HOOC)RuII(CO)2L3]+ invoked in ref. 50 and discussed above in the analysis of IR data.
In summary, these DFT computations confirm the hypothesis previously reported by others and in this work on the fate of fac,anti-[RuII2(CO)6Cl4] and fac-[RuII(CO)3Cl2(L)] species when treated with water and/or hydroxide. Finally, fully optimized structures for fac-[RuII(CO)3Cl2(3-MBI)] and fac-[RuII(CO)3Cl2(3-BIM)] (Fig. 5, Tables 3 and S6†) confirm that the conformation around the Ru–N(BIM) vector is staggered with respect to the two Ru–Cl bonds, and the projection of the heterocyclic base on the equatorial coordination plane is type-A (Scheme 3). The structures for complexes fac-[RuII(CO)3Cl2(3-BIM)] and fac-[RuII(CO)3Cl2(3-MBI)] were optimized even at the semiempirical level ZINDO/1 (see Fig. S21a and b†). For both complexes, the type-A conformer was the most stable (by ca. 5 and 7 kcal mol−1 when compared to type-B and type-C, respectively), in agreement with the findings from DFT. Both derivatives have HOMOs consisting of atomic orbitals from all the atoms of the molecules.
 | ||
| Fig. 5 Computed structures of: (a) fac-[RuIICl2(CO)3(3-MBI)] conformer type-A, (b) conformer type-B, (c) conformer type-C; and (d) fac-[RuIICl2(CO)3(3-BIM)] conformer type-A, (e) conformer type-B, (f) conformer type-C as obtained at B3LYP/(Lanl2DZ,Ru;6-311++G**,CHClNO), BS3, level of theory. | ||
3-MBI)] at (BS1) [BS2], and {BS3} levels of theory. See also Table S6 and Table 2 for X-ray values
| [RuII(CO)3Cl2(MBI)] | |||
|---|---|---|---|
| Type-A | Type-B | Type-C | |
| Ru–Cl1 | (2.491) [2.453] {2.456} | {2.446} | {2.455} |
| Ru–Cl2 | (2.491) [2.453] {2.456} | {2.464} | {2.455} |
| Ru–C12(trans Cl1) | (1.916) [1.931] {1.932} | {1.932} | {1.929} |
| Ru–C11(trans Cl2) | (1.916) [1.931] {1.932} | {1.927} | {1.929} |
| Ru–C13(trans N3) | (1.937) [1.943] {1.944} | {1.942} | {1.940} |
| Ru–N3 | (2.118) [2.150] {2.159} | {2.180} | {2.188} |
| Cl1–Ru–Cl2 | (91.8) [91.5] {91.5} | {92.7} | {93.7} |
| Cl1–Ru–N3 | (87.4) [87.2] {87.2} | {88.4} | {89.8} |
| Cl2–Ru–N3 | (87.4) [87.2] {87.2} | {87.8} | {89.8} |
| C12–Ru–N3 | (92.0) [92.1] {92.2} | {91.2} | {90.7} |
| C11–Ru–N3 | (92.0) [92.1] {92.2} | {93.9} | {90.7} |
| C13–Ru–N3 | (169.8) [170.5] {171.3} | {171.2} | {173.3} |
Instead, LUMOs are composed by atomic orbitals from Ru, carbonyl and chlorido ligands. In other words, the excitations from HOMO to LUMO transfer electronic charge from the benzimidazole moiety to the metal and to CO and Cl− ligands.
Solution behavior
Before studying the interactions with proteins, the solution behavior of these ruthenium complexes was monitored under well-controlled experimental conditions. UV-Vis absorption spectroscopy was chosen as the reference method to monitor continuously the behavior of the studied compounds under physiological-like conditions (10 mM phosphate buffer, pH 7.4). The UV-Vis spectrum of a freshly prepared solution of 2 showed four peaks at 253.0, 265.5, 271.0 and 279.5 nm (Fig. 6A), while for compound 4 an absorption spectrum with maxima at 280 and 286 nm was detected (Fig. 6B). Overall, both compounds manifested an appreciable stability when monitored for 72 h at room temperature, as documented by the substantial invariance of their absorption spectra. | ||
| Fig. 6 Time-course UV-Vis spectra of fac-[RuII(CO)3Cl2(3-MBI)], 2 (A), and fac-[RuII(CO)3Cl2(3-DMBI)], 4 (B), dissolved in 10 mM phosphate buffer (PB), pH 7.4 over 72 h incubation. Each solution contained 30 μM Ru. | ||
Reactions with model proteins
The interactions of 2 and 4 with the three model proteins (HEWL, RNase A and Cyt c) were subsequently explored by UV-Vis spectrophotometric analysis (Fig. 7 and S22,† respectively), according to previously reported procedures.54 Both compounds showed a similar behavior upon interaction with the selected model proteins. Fig. 7 shows the time-course UV-Vis spectra of 2 after the addition of HEWL, RNase A or Cyt c over 72 h. It is apparent that the addition of the protein does not affect the behavior of the ruthenium compound. However, in the case of Cyt c (Fig. 7), the absorption spectra are dominated by the intense visible bands associated with the heme group of Cyt c. It is well known that Cyt c, in its oxidized form, exhibits an intense Soret band at approximately 405 nm and weaker Q bands in the 500–560 nm region.55 The analysis of the temporal evolution of the spectra revealed progressive changes of the characteristic Cyt c features. In particular, the progressive appearance, with time, of Q bands typical of reduced Cyt c was noticed, indicative of the occurrence of partial reduction at the heme iron center. These spectral changes are specifically induced by the addition of the ruthenium complex under study; such a behavior is in agreement with literature data concerning the well-known ruthenium complex NAMI-A.56 It is hypothesized that Cyt c reduction is the consequence of ruthenium binding to a specific protein site, capable of modulating the redox properties of the heme center.56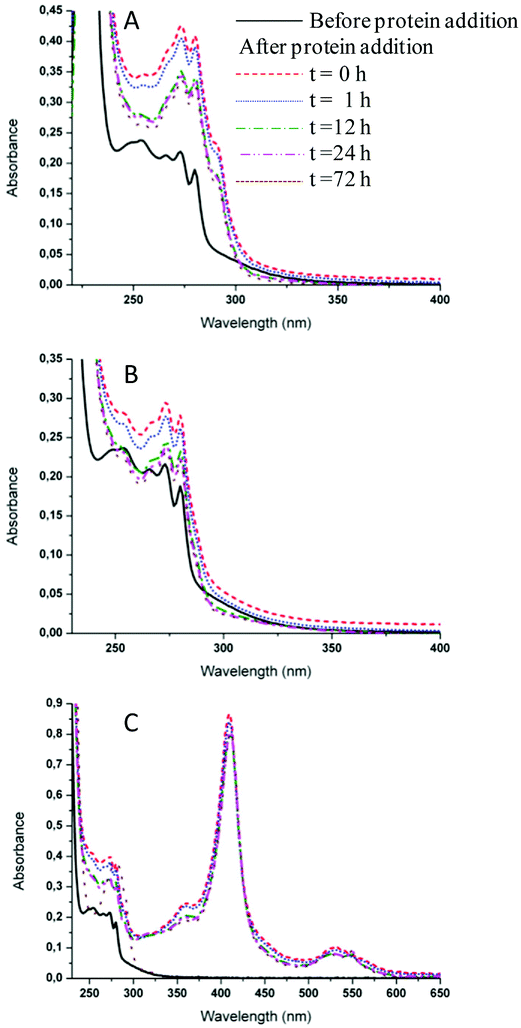 | ||
| Fig. 7 Time-course UV-Vis spectra of fac-[RuII(CO)3Cl2(3-MBI)], 2, dissolved in 10 mM phosphate buffer (PB), pH 7.4 in the presence of HEWL (A), RNase A (B), Cyt c (C). Each solution contained 30 μM Ru and 10 μM protein. | ||
ESI-MS of metallo-drug–protein samples
ESI-MS is a very powerful tool to characterize metallo-drug–protein interactions at the molecular level.57 In fact, ESI-MS analysis of the samples allowed the identification and characterization of metal–protein adducts. In particular, ESI-MS measurements permitted determining the nature of protein-bound metallic fragments and their binding stoichiometry, providing indirect mechanistic insight into the metalation processes as reported in the literature.57Fig. 8 and S23† report the ESI-MS spectra of 2 and 4, respectively, interacting with HEWL (A), RNase A (B) and Cyt c (C). It is evident that, in all cases, the ruthenium compounds are prone to losing their heterocyclic ligands as well as the two chlorides bonded to Ru(II). The two compounds roughly manifested a similar reactivity with the three model proteins. However, somewhat different situations were encountered depending on the nature of the protein. For this reason, the various cases will be illustrated separately.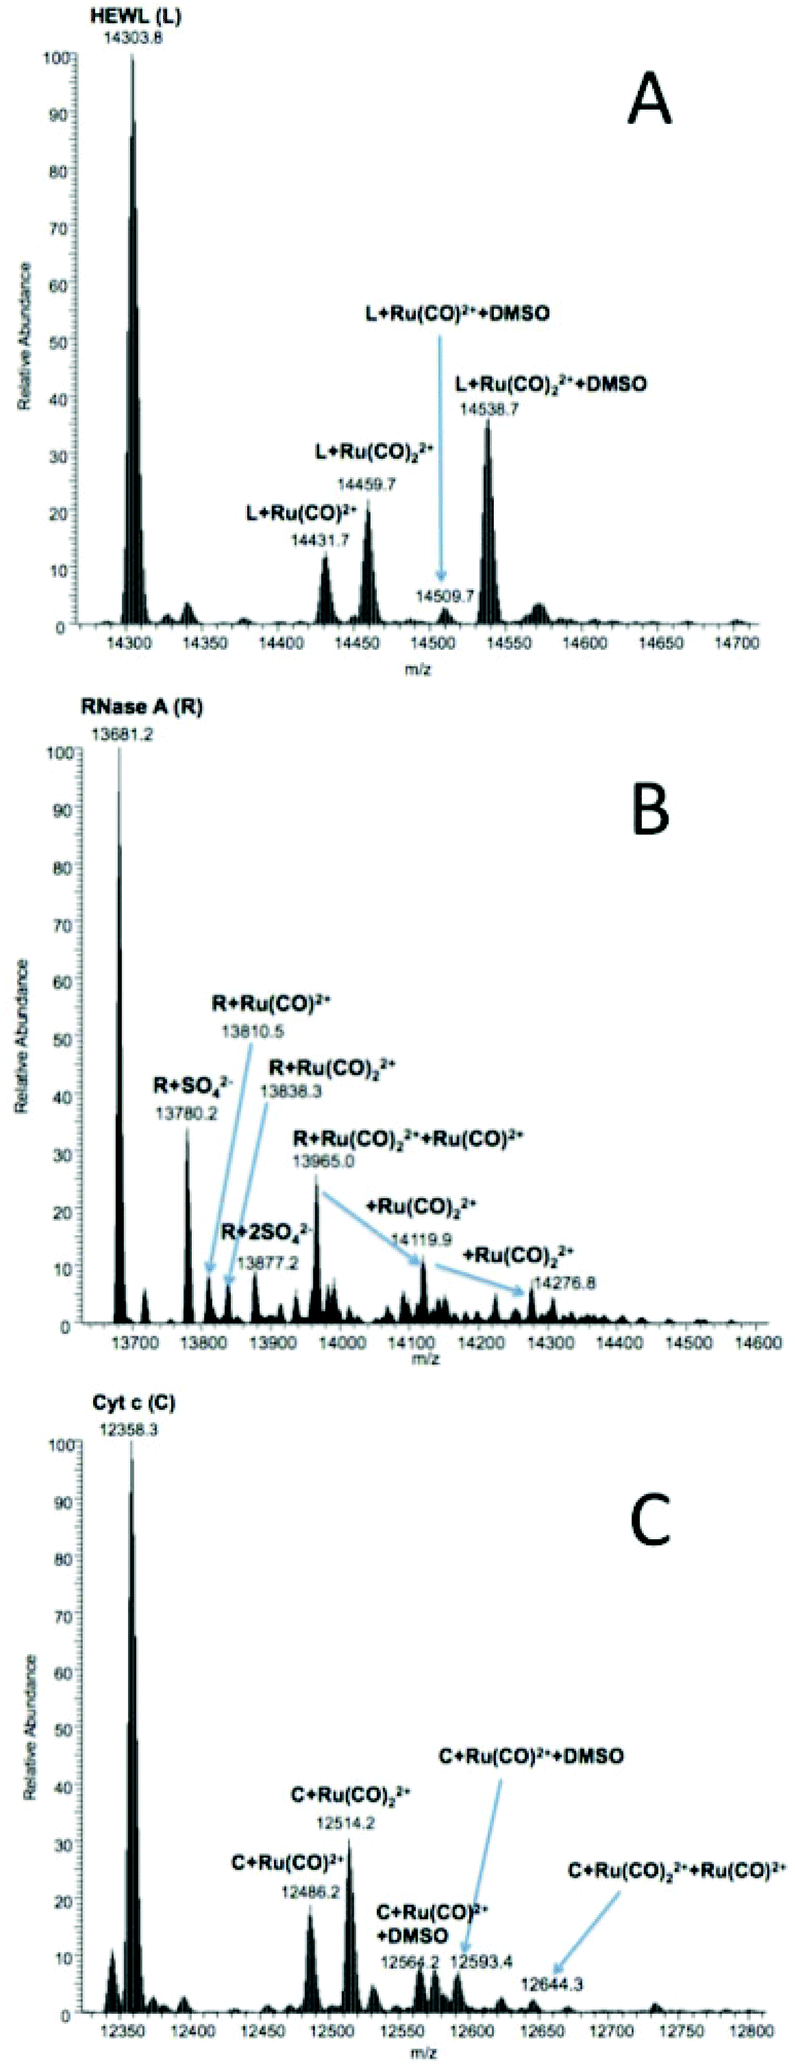 | ||
| Fig. 8 LTQ Orbitrap ESI mass spectra of fac-[RuII(CO)3Cl2(3-MBI)], 2, dissolved in 20 mM ammonium acetate buffer, pH 7.4, in the presence of HEWL (A), RNase A (B) or Cyt c (C) after 72 h of incubation at 37 °C. The protein concentration was 10−4 M (with a metal complex to protein molar ratio of 3:1). | ||
431.7), {RuII(CO)2}2+ (m/z 14459.7), {RuII(CO)}2+ plus DMSO; {RuII(CO)2}2+. Contrary to what is reported for similar compounds interacting with HEWL,3 the simultaneous binding of {RuII(CO)}2+ and {RuII(CO)2}2+ was not detected for these compounds.
810.5) or two (m/z 13838.3) CO groups (i.e., fragments {RuII(CO)}2+ and {RuII(CO)2}2+), as reported for HEWL, are detected. The three major peaks are attributed to RNase A simultaneously bearing {RuII(CO)}2+ and one (m/z 13965.0), two (m/z 14119.9) or three (m/z 14276.8) {RuII(CO)2}2+ fragments. Compound 4 manifested a lower reactivity with RNase A than compound 2. However, tiny amounts of the following adducts were detected (Fig. S23B†): RNase A + {RuII(CO)}2+m/z 13810.5, and RNase A + {RuII(CO)2}2+m/z 13838.4.
486.2 and m/z 12514.2, and the analogs coordinated to one molecule of DMSO (m/z 12564.2 and 12593.4, respectively). In the case of the interaction with Cyt c, the main difference in the behavior between the present compounds and similar compounds reported in the literature3 is that the heterocyclic moiety is never retained, implying that the reactivity of the present compounds is slightly different. Visible spectra do not offer evidence for iron(III) reduction upon interaction with Ru(II) compounds; this suggests that the redox chemistry of the type earlier described by Gray and coworkers does not occur in this case.58,59
X-ray crystallography for HEWL/fac-[RuII(CO)3Cl2(![[N with combining low line]](https://www.rsc.org/images/entities/h3_i_char_004e_0332.gif) 3-MBI)] system (HEWL-RuMBI)
3-MBI)] system (HEWL-RuMBI)
The atomic model of fac-[RuII(CO)2(H2O)2(-His15)Cl]+⋯CO (HEWL-RuMBI, Fig. 9) is very similar to that of the native protein: the secondary and tertiary structures are virtually identical. The root mean square deviation of the carbon alpha atom of the protein complexed with Ru(II) when compared to the native enzyme in the starting model is 0.22 Å. The binding of the Ru moiety to HEWL was investigated by inspection of difference Fourier analysis. In particular, both residual Fo–Fc (Fig. 10) and anomalous electron density maps (Fig. 9) were inspected. A large positive peak was easily identified close to the side chain of His15. This represents a very favorable site for Ru complexes, since it was already observed in the adducts formed in the reaction between other Ru compounds and HEWL.2,60–62 The Ru fragment binds close to the His15 side chain adopting the usual octahedral geometry. The distance of the imidazole N atom (ND1) of His15 from the Ru center is 2.3 Å. The coordination sphere of Ru is completed by one Cl− ion, two CO ligands, and two aqua ligands (Fig. 10).
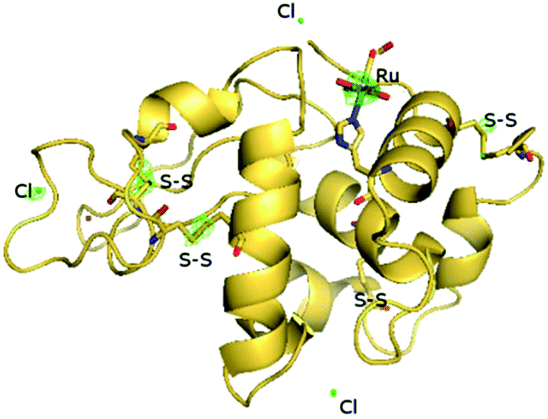 | ||
| Fig. 9 Overall structure of cis,trans-[RuII(CO)2(H2O)2(-His15)Cl]+⋯CO, as obtained by soaking fac-[RuII(CO)3Cl2(3-MBI)], 2, in a solution of HEWL protein (abbreviated HEWL-RuMBI). The coordination fragment bound to His15, the three chloride ions included in the model and the disulphide bridges of the protein are also depicted. Anomalous electron density maps are contoured at 2.5σ and colored in green. The Ru coordination moiety is depicted as a stick. Pictures have been prepared by using Pymol. | ||
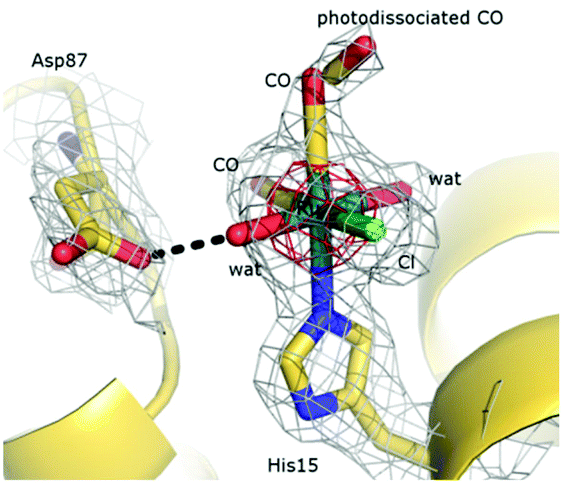 | ||
| Fig. 10
cis,trans-[RuII(CO)2(H2O)2(-His15)Cl]+⋯CO fragment. The RuII center is covalently bound to the HEWL His15 side chain. Ru adopts the usual octahedral geometry. The 2Fo–Fc electron density map is contoured at 1.0σ (grey) and 4.0σ (red). Electron density associated with the CO ligand can be described as a tube extending from the metal for about 4 Å. This electron density has been interpreted as due to two alternative conformations of the CO ligand: in the former, CO is bound to Ru, whereas in the latter the OC–Ru bond is photodissociated. | ||
The Cl− ligand forms a strong hydrogen bond with the side chain of Arg14. The two aqua ligands interact with the side chain of Asp87 and with a free water molecule, respectively. The oxygen atom of the CO ligand on the equatorial plane is hydrogen bonded to the N atom of Ile88, whereas the oxygen atom of the CO ligand trans to the imidazole of His15 is bound to a water molecule that in turn is in contact with a coordination residue of a symmetry related molecule.
These data unambiguously indicate that the heterocyclic MBI ligand and one CO molecule are lost upon interaction of the Ru compound with the protein, in good agreement with expectations on the basis of mass spectrometry data. Interestingly, a deeper inspection of the electron density map around the Ru center allows the modelling of two discrete positions of the CO ligand trans to the His15 side chain. One is close to the Ru center and can be described as a CO ligand bound to Ru. In the second, the CO is dissociated from the Ru center. This result could indicate a partial photolysis of the OC–Ru bond, with a metastable transient form that is trapped in the crystal state. In this respect, it is useful to recall that X-ray radiation can be able to photodissociate small ligands such as CO63 and NO64 from metal centers (like Fe) and that transient metastable forms of photodissociated ligand have been already observed previously.63,64
Cytotoxicity in cancer cell lines
The capacity of inhibiting tumor cell growth was assessed by means of the MTT assay in three human cancer cell lines, i.e., CH1/PA-1 (ovarian teratocarcinoma), SW480 (colon carcinoma) and A549 (non-small cell lung carcinoma). IC50 values of 2 and 4 are almost identical and in a range well comparable with the clinically studied anticancer ruthenium compound indazolium trans-[tetrachloridobis(1H-indazole)ruthenate(III)] (KP1019; Table 4).65 Still, it should be borne in mind that, in contrast to KP1019, the compounds reported here do not require activation by reduction, as they already contain ruthenium in the oxidation state (+2), which tends to be more reactive. In contrast to the imidazole-, N-methylimidazole- and thiazole-containing analogs reported previously,3,4 they even show some effects in the multidrug-resistant cell line A549 (Fig. S24†), though with a rather low potency (IC50 values ∼200 μM). In the other two cell lines, IC50 values are consistently about 2.5–4 times lower than those of the previous analogs. The bigger substituted benzimidazole ligands thus seem favorable for cytotoxicity. However, whether this is due to the higher lipophilicity or another reason remains unclear. Anyway, the higher potency made these two complexes the candidates of choice for evaluation in vivo.:1 mixtures of 1 + MBI or DMBI (all from DMF stocks) and KP1019 (without an organic solvent) (MTT assay, 96 h exposure). Note that IC50 values given for the mixtures relate to the molarities of MBI and DMBI, whereas the corresponding concentration of the dimeric 1 in the mixtures is half of that
When experiments using different solvents are compared, it becomes evident that the lower stability in DMSO (according to NMR studies) as compared to stock solutions in DMF does not affect the cytotoxicity of the complexes. It should be noted that stocks in organic solvents were diluted in cell culture medium after several minutes and that significant amounts of the non-dissociated complex would persist even after several hours in pure DMSO. The dimeric precursor 1 (not containing any azole ligand) is as active as the other complexes in A549 cells based on molarity, or about half as active when viewed in terms of ruthenium equivalents. Adding MBI or DMBI, which are completely devoid of cytotoxicity in the tested concentration range alone (data not shown), does not change the IC50 values to a meaningful degree. But in the generally more sensitive cell line SW480, 1 alone is much less active than 2 and 4, and adding MBI or DMBI increases the cytotoxicity to a level comparable to that of the other complexes (Fig. S25†).
Since inactive components such as the applied azoles are unlikely to potentiate the activity of a basically active component, this might rather argue for the in situ formation of complex species from the mixtures of 1 and MBI or DMBI.
Anticancer activity against a murine colon cancer model in vivo
As a first step to establish the optimal dose for in vivo tests, toxicity experiments with single-dose treatments were performed. An intraperitoneal application of 10 mg kg−1 led to unconsciousness in animals treated with 2 and 4. Also at 5 mg kg−1, strong (but transient) drowsiness was observed for all compounds (including CORM-3), consistent with the hypotensive effects known as the main toxicity of the fast CO releaser CORM-366 and suggesting a similar behavior for 2 and 4. Consequently, a dose of 2.5 mg was chosen for the experiment using CT-26 cells in Balb/c mice. Drugs were applied intraperitoneally at days 4, 5, 7, 8, 11, 12, 14, and 15 (continuous treatment for more than 2 days was not performed due to the death of one animal receiving 4 at day 6). Nevertheless, treatment with 4 resulted in a significant delay of tumor growth (p < 0.05 by two-way ANOVA and Bonferroni post-test in comparison to solvent- or 2-treated animals) (Fig. 11). This was also reflected by a significantly reduced tumor weight at day 15 (p < 0.05 by one-way ANOVA and Dunnett post-test; in comparison to solvent- or CORM-3-treated animals). In contrast, 2 did not impact the tumor burden, and CORM-3 even distinctly enhanced the growth of the CT-26 tumors (also reflected by the significantly increased tumor burden; p < 0.01 by one-way ANOVA and Dunnett post-test; in comparison to solvent- or 4-treated animals). A comparison with historic controls, which had been treated with 0.9% NaCl, indicated that the solvent (20% propylene glycol) did not impact the growth of CT-26 tumors (data not shown).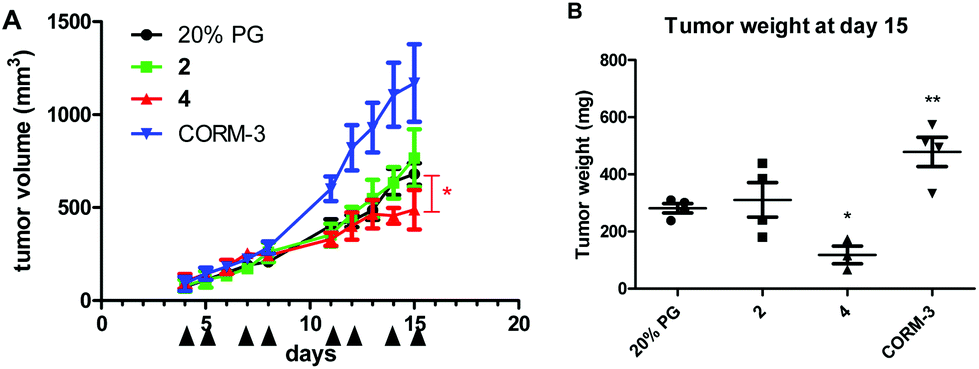 | ||
| Fig. 11 Anticancer activity in vivo. Murine CT-26 cells (5 × 10⁵) were injected subcutaneously into the right flank of female Balb/c mice. Animals were treated with the drugs intraperitoneally (2.5 mg kg−1 in 20% propylene glycol, with the exception of CORM-3, which was dissolved in water) on days 4, 5, 7, 8, 11, 12, 14 and 15. The tumor size was assessed regularly by caliper measurement. The number of animals is four per group, with the exception of treatment with 4, where n = 3 due to the death of one animal at day 6. (A) Tumor volumes (means ± standard errors of the mean, SEM), calculated by using the formula: length × width2/2. Tumors in 4-treated animals were significantly smaller in comparison to solvent- or 2-treated animals on day 15; two-way ANOVA and Bonferroni post-test; * p < 0.05. (B) Tumor weights at day 15 (means ± SEM). *p < 0.05; **p < 0.01 in comparison to solvent-treated animals; calculated by one-way ANOVA and Dunnett post-test. | ||
General discussion
Complexes 2 and 4 act as CO-releasing materials (CORMs), which are species of growing interest in biology, pharmacology and medicinal chemistry as revealed by the large amount of research work on the subject; examples of such publications are those listed in ref. 66–70. We wish to stress here that 2 and 4 showed noticeable cytotoxic and anticancer activities, especially when compared to chemically related octahedral ruthenium complexes. The IC50 values in ovarian teratocarcinoma CH1/PA-1 and colon carcinoma SW480 human cell lines in vitro are comparable to or lower than those of analogous compounds. The activity of 2 and 4 was 2.5–4 times higher than those found under the same conditions for imidazole, N-methylimidazole and thiazole analogs reported previously.3 In in vivo tests, compound 4 delayed significantly the growth of a murine colon cancer model, in contrast to 2, to the solvent and to CORM-3. However, there might be some limitations due to the too fast CO release in the circulation. Consequently, it might be of interest to develop a series of second-generation compounds with increased stability.Regarding the reactivity of 2 and 4 with DMSO (a solvent that was used in certain tests for cytotoxicity and for reactivity with proteins in this work), we wish to emphasize that both complexes are almost not sensitive for time periods of 4 h (2) and ca. a day (4) after dissolution in a pure solvent. It has to be expected that in the case of a lower DMSO content the reactivity is even slower. Notwithstanding this, tests were performed with comparable results even in media that contained a small amount of DMF whose reactivity towards 2 is null, and that towards 4 is low, requiring at least several hours to cause the dissociation of 15–20% of the molecules.
In addition to data published with respect to anticancer activity, it has been recently noticed that CORMs might also have activity against prokaryotic cells.71 This aspect might also be of interest for the class of complexes presented here. However, the occurrence of drowsiness in vivo might also be a limitation in this respect. Nevertheless, the drugs presented here are among the scarce examples of activated anticancer molecules that contain Ru(II). As such, they do not require the reduction step that is invoked by many workers for speeding the action of Ru(III)-based drugs. Consequently, this work suggests pursuing RuII-based CORMs as anticancer drugs.
Conclusions
The present work brought about the following: (i) the synthesis of two novel complexes that contain the fac-{RuII(CO)3}2+-core and the benzimidazole ligands MBI (2) or DMBI (4); (ii) the starting mixture of fac,trans-[RuII2(CO)6Cl4] and MBI in methanol that produced 2 revealed that a CO ligand per metal center was prone to being released, thus head-to-head-cis,trans-[RuII(CO)2Cl2(3-MBI)2] (3) was also isolated; (iii) the three complexes 2–4 were characterized via single crystal X-ray diffraction, and two of them (2 and 4) via spectroscopy (IR, UV-Vis, NMR) as well as via density functional computations (DFT/6-31G** or DFT/6-311++G** for CHClNO; pseudo-potential Lanl2DZ for Ru); (iv) the complexes 2 and 4 have the cis-{RuIICl2} function and the MBI/DMBI ligand is “trans” to a CO and coordinated to Ru via 3-benzimidazole; (v) 2 and 4 are mild CO-releasing molecules (CORM) in aqueous systems in which they have small but biologically significant solubility; (vi) 2 and 4 are also MBI- or DMBI-releasing molecules in aqueous systems; (vii) 2 and 4 showed moderate cytotoxicity in three human cancer cell lines in vitro in the range of the clinically studied ruthenium complex KP1019. In contrast to 2 and CORM-3, 4 showed anticancer activity in vivo by significantly decreasing the tumor growth of a murine CT-26 colon cancer model; (viii) ESI-MS studies revealed the ability of 2 and 4 to bind strongly a few model proteins such as HEWL, RNase A and Cyt c, with the partial release of heteroaromatic, chlorido and carbonyl ligands; (ix) the crystal structure of the adduct formed between 2 and HEWL has been also solved. X-ray diffraction data prove the existence of a protein adduct containing a Ru(CO) or Ru(CO)2 core.
Acknowledgements
The authors thank Dr Francesco Berrettini (CIADS, Center for Analysis and Structural Determinations, University of Siena) for XRD Data Collection. G. T. and R. C. thank Dr Daniela Valensin for 1H NMR data for 2 and 4, Dr Alice Carpini who did some preparative work for 2 and 4 during her internship for Tesi di Laurea in Scienze Chimiche at the University of Siena, and Dr Sara Draghi who performed other preparative and characterization work for 3 and 4 during her internship for Tesi di Laurea Magistrale in Chimica. G. T. and R. C. also gratefully acknowledge CINECA (Consorzio Interuniversitario dell'Italia Nord Est per il Calcolo Automatico, Casalecchio di Reno, Bologna) for grants MM-MBD-HP10C0SD05 and CS-BBCMME-HP10CP2UZ2 that allowed them to carry out high performance computations through SP5, SP6 and Eurora machines and Gaussian-03 and -09 software. F. S. and L. M. gratefully acknowledge Beneficentia Stiftung (Vaduz, Liechtenstein) and Elena Michelucci, CISM (University of Florence) for recording ESI mass spectra. A. M. thanks G. Sorrentino and M. Amendola for technical assistance at the CNR Institute of Biostructures and Bioimages, Naples, Italy. We thank Markus Galanski (University of Vienna) for performing NMR studies on compound stability. Part of this work was performed in the surrounding of the EU-funded COST action CM1105.Notes and references
- R. Motterlini, J. E. Clark, R. Foresti, P. Rarathchandra, B. E. Mann and C. J. Green, Circ. Res., 2002, 90, e17 CrossRef CAS PubMed.
- T. Santos-Silva, A. Mukhopadhyay, J. D. Seixas, G. J. Bernardes, C. C. Romão and M. J. Romão, J. Am. Chem. Soc., 2011, 133, 1192 CrossRef CAS PubMed.
- G. Tamasi, A. Carpini, D. Valensin, L. Messori, A. Pratesi, F. Scaletti, M. Jakupec, B. Keppler and R. Cini, Polyhedron, 2014, 81, 227 CrossRef CAS.
- R. Cini, S. Defazio, G. Tamasi, M. Casolaro, L. Messori, A. Casini, M. Morpurgo and M. B. Hursthouse, Inorg. Chem., 2007, 46, 79 CrossRef CAS PubMed.
- D. Valensin, P. Anzini, E. Gaggelli, N. Gaggelli, G. Tamasi, R. Cini, C. Gabbiani, E. Michelucci, L. Messori, H. Kozlowski and G. Valensin, Inorg. Chem., 2010, 49, 4720 CrossRef CAS PubMed.
- R. Cini, S. J. Moore and L. G. Marzilli, Inorg. Chem., 1998, 37, 6890 CrossRef CAS PubMed.
- V. Herbert, Am. J. Clin. Nutr., 1988, 48(3 Suppl.), 852 CAS.
- A. C. H. Richard, Br. Med. J., 2002, 324, 466 CrossRef.
- J. N. Kanji, R. E. Anglin, D. L. Hunt and A. Panju, J. Am. Med. Assoc., 2010, 303, 1526 CrossRef CAS PubMed.
- M. Mishkind, N. V. Raikhel, B. A. Palevitz and K. Keegstra, J. Cell Biol., 1982, 92, 753 CrossRef CAS PubMed.
- H. Lumbsch and S. M. Huhndorf, Myconet, 2007, 13, 1 Search PubMed.
- E. Reisner, V. B. Arion, M. F. Guedes da Silva, R. Lichtenecker, A. Eichinger, B. K. Keppler, V. Y. Kukushkin and A. J. Pombeiro, Inorg. Chem., 2004, 43, 7083 CrossRef CAS PubMed; M. A. Jakupec, E. Reisner, A. Eichinger, M. Pongratz, V. B. Arion, M. Galanski, C. G. Hartinger and B. K. Keppler, J. Med. Chem., 2005, 48, 2831 CrossRef PubMed.
- H. Smith, B. E. Mann, R. Motterlini and R. K. Poole, IUBMB Life, 2011, 63, 363 CrossRef CAS PubMed.
- J. D. Seixas, M. F. A. Santos, A. Mukhopadhyay, A. C. Coelho, P. M. Reis, L. F. Veiros, A. R. Marques, N. Penacho, A. M. L. Gonçalves, M. J. Romão, G. J. L. Bernardes, T. Santos-Silva and C. C. Romão, Dalton Trans., 2015, 44, 5058 RSC.
- P. Wang, H. Liu, Q. Zhao, Y. Chen, B. Liu, B. Zhang and Q. Zheng, Eur. J. Med. Chem., 2014, 74, 199 CrossRef CAS PubMed.
- D. S. Thompson, G. J. Weiss, S. F. Jones, H. A. Burris, R. K. Ramanathan, J. R. Infante, J. G. Bendell, A. Ogden and D. D. Von Hoff, J. Clin. Oncol., 2012, 30(Suppl.), 3033 Search PubMed; R. Trondl, P. Heffeter, C. R. Kowol, M. A. Jakupec, W. Berger and B. K. Keppler, Chem. Sci., 2014, 5, 2925 RSC.
- C. C. Romão, W. A. Blättler, J. D. Seixasab and G. J. L. Bernardes, Chem. Soc. Rev., 2012, 41, 3571 RSC.
- L. Ibáñez, M. J. Alcaraz, N. Maicas, D. Guede, J. R. Caeiro, R. Motterlini and M. L. Ferrándiz, Calcif. Tissue Int., 2014, 91, 69 CrossRef PubMed.
- W. Fukuda, T. Takagi, K. Katada, K. Mizushima, T. Okayama, N. Yoshida, K. Kamada, K. Uchiyama, T. Ishikawa, O. Handa, H. Konishi, N. Yagi, H. Ichikawa, T. Yoshikawa, G. Cepinskas, Y. Naito and Y. Itoh, Dig. Dis. Sci., 2014, 59, 1142 CrossRef CAS PubMed.
- S. Lancel, S. M. Hassoun, R. Favory, B. Decoster, R. Motterlini and R. Neviere, J. Pharmacol. Exp. Ther., 2009, 329, 641 CrossRef CAS PubMed; S. Mizuguchi, J. Stephen, R. Bihari, N. Markovic, S. Suehiro, A. Capretta, R. F. Potter and G. Cepinskas, Am. J. Physiol., 2009, 297, H920 CrossRef PubMed.
- Y. Guo, A. B. Stein, W.-J. Wu, W. Tan, X. Zhu, Q.-H. Li, B. Dawn, R. Motterlini and R. Bolli, Am. J. Physiol., 2004, 286, H1649 CrossRef CAS PubMed.
- A. Yabluchanskiy, P. Sawle, S. Homer-Vanniasinkam, C. J. Green, R. Foresti and R. Motterlini, Crit. Care Med., 2012, 40, 544 CrossRef CAS PubMed.
- M. Di Pascoli, L. Rodella, D. Sacerdoti, M. Bolognesi, S. Turkseven and N. G. Abraham, Biochem. Biophys. Res. Commun., 2006, 340, 935 CrossRef CAS PubMed.
- T. Vera, J. R. Henegar, H. A. Drummond, J. M. Rimoldi and D. E. Stec, J. Am. Soc. Nephrol., 2005, 16, 950 CrossRef CAS PubMed.
- G. M. Sheldrick, SHELXS 86 Program for the Solution of Crystal Structures, University of Göttingen, 1986 Search PubMed.
- G. M. Sheldrick, SHELXS 97 Program for the Solution of Crystal Structures, University of Göttingen, 1997 Search PubMed.
- G. M. Sheldrick, SHELXL 97 Program for the Refinement of Crystal Structures, University of Göttingen, 1997 Search PubMed.
- M. Nardelli, PARST-97, A System of Computer Routines for Calculating Molecular Parameters from Results of Crystal Structure Analyses, University of Parma, 1997 Search PubMed.
- C. K. Johnson and M. N. Burnett, ORTEP-3 for Windows, 1998, Oak Ridge National Laboratory. 32-bit Implementation by L. J. Farrugia, University of Glasgow Search PubMed.
- Mercury 2.4 (Build RC5), Created on October 31, 2010, Copyright CCDC 2001–2010. http://www.ccdc.cam.ac.uk/mercury/.
- J. L. Farrugia, WinGX an Integrated System of Windows Programs for the Solution, Refinement and Analysis of Single Crystal X-Ray Diffraction Data, Version 1.64.05 1999–2003, University of Glasgow CrossRef; J. L. Farrugia, J. Appl. Crystallogr., 1999, 32, 837 CrossRef.
- Z. Otwinowski and W. Minor, Methods Enzymol., 1997, 276, 307 CAS.
- A. J. McCoy, R. W. Grosse-Kunstleve, P. D. Adams, M. D. Winn, L. C. Storoni and R. J. Read, J. Appl. Crystallogr., 2007, 40, 658 CrossRef CAS PubMed.
- M. C. Vaney, S. Maignan, M. Riès-Kautt and A. Ducriux, Acta Crystallogr., Sect. D: Biol. Crystallogr., 1996, 52, 505 CrossRef CAS PubMed.
- G. N. Murshudov, P. Skubak, A. A. Lebedev, N. Pannu, R. A. Steiner, R. A. Nicholls, M. D. Winn, F. Long and A. A. Vagin, Acta Crystallogr., Sect. D: Biol. Crystallogr., 2011, 67, 355 CrossRef CAS PubMed.
- P. Emsley and K. Cowtan, Acta Crystallogr., Sect. D: Biol. Crystallogr., 2004, 60, 2126 CrossRef PubMed.
- R. A. Laskowski, M. W. Macarthur, D. S. Moss and J. M. Thornton, J. Appl. Crystallogr., 1993, 26, 283 CrossRef CAS.
- M. J. Frisch, G. W. Trucks, H. B. Schlegel, G. E. Scuseria, M. A. Robb, J. R. Cheeseman, G. Scalmani, V. Barone, B. Mennucci, G. A. Petersson, H. Nakatsuji, M. Caricato, X. Li, H. P. Hratchian, A. F. Izmaylov, J. Bloino, G. Zheng, J. L. Sonnenberg, M. Hada, M. Ehara, K. Toyota, R. Fukuda, J. Hasegawa, M. Ishida, T. Nakajima, Y. Honda, O. Kitao, H. Nakai, T. Vreven, J. A. Jr. Montgomery, J. E. Peralta, F. Ogliaro, M. Bearpark, J. J. Heyd, E. Brothers, K. N. Kudin, V. N. Staroverov, T. Keith, R. Kobayashi, J. Normand, K. Raghavachari, A. Rendell, J. C. Burant, S. S. Iyengar, J. Tomasi, M. Cossi, N. Rega, J. M. Millam, M. Klene, J. E. Knox, J. B. Cross, V. Bakken, C. Adamo, J. Jaramillo, R. Gomperts, R. E. Stratmann, O. Yazyev, A. J. Austin, R. Cammi, C. Pomelli, J. W. Ochterski, R. L. Martin, K. Morokuma, V. G. Zakrzewski, G. A. Voth, P. Salvador, J. J. Dannenberg, S. Dapprich, A. D. Daniels, O. Farkas, J. B. Foresman, J. V. Ortiz, J. Cioslowski and D. J. Fox, Gaussian 09, ES64L-G09RevD.01, Gaussian, Inc., Wallingford, CT, 24-Apr- 2013 Search PubMed.
- A. Frisch and M. J. Frisch, Gaussian 98, User's Reference, Gaussian, Inc., Pittsburgh, PA 15106, 2nd edn, 1998 Search PubMed.
- R. Dennington II, T. Keith, J. Millam, K. Eppinnett, W. L. Hovell and R. Gilliland, GaussView, Version 3.03, Semichem, Inc., Shawnee Mission, KS, 2003 Search PubMed.
- C. Korch, M. A. Spillman, T. A. Jackson, B. M. Jacobsen, S. K. Murphy, B. A. Lessey, V. C. Jordan and A. P. Bradford, Gynecol. Oncol., 2012, 127, 241 CrossRef CAS PubMed.
- A. Escande and J. L. Galigné, Acta Crystallogr., Sect. B: Struct. Crystallogr. Cryst. Chem., 1974, 30, 1647 CrossRef.
- Ž. Ružić-Toroš, Acta Crystallogr., Sect. B: Struct. Crystallogr. Cryst. Chem., 1979, 35, 1277 CrossRef.
- G. Tamasi, A. Carpini, D. Valensin and R. Cini, J. Mol. Struct., 2015, 1079, 465 CrossRef CAS.
- M. Egliand and W. Saenger, Principles of Nucleic Acid Structure, Springer, Berlin, 1984 Search PubMed.
- F. P. Intini, R. Cini, G. Tamasi, M. B. Hursthouse, L. G. Marzilli and G. Natile, Inorg. Chem., 2010, 49, 7853 CrossRef CAS PubMed.
- (a) M. Nishio, M. Hirotaand and Y. Umezawa, A comprehensive monograph, THE CH/π INTERACTION, Wiley-VCH, New York, 1998 Search PubMed; (b) M. Nishio, The CH/π hydrogen bond. The CH/π Institute, 1999–2014. Last updated November 2, 2014. Last connected July 28, 2015.
- B. F. G. Johnson, R. D. Johnston and J. Lewis, J. Chem. Soc. A, 1969, 792 RSC.
- J. B. Foresman and A. Frisch, Exploring chemistry with electronic structure methods, Gaussian, Inc., Pittsburgh, PA, USA, 2nd edn, 1996 Search PubMed.
- M. F. A. Santos, J. D. Seixas, A. C. Coelho, A. Mukhopadhyay, P. M. Reis, M. J. Romao, C. C. Romao and T. Santos-Silva, J. Inorg. Biochem., 2012, 117, 285 CrossRef CAS PubMed.
- I. N. Stepanenko, B. Cebrián-Losantos, V. B. Arion, A. A. Krokhin, A. A. Nazarov and B. K. Keppler, Eur. J. Inorg. Chem., 2007, 400 CrossRef CAS.
- J. E. Huheey, Inorganic Chemistry: Principles of Structure and Reactivity, Harper Collins Publishers, New York, 1983, p. 432 Search PubMed.
- M. Patra, T. Joshi, V. Pierroz, K. Ingram, M. Kaiser, S. Ferrari, B. Spingler, J. Keiser and G. Gasser, Chem. – Eur. J., 2013, 19, 14768 CrossRef CAS PubMed.
- G. Tamasi, C. Bernini, G. Corbini, N. F. Owens, L. Messori, F. Scaletti, L. Massai, P. Lo Giudice and R. Cini, J. Inorg. Biochem., 2014, 134, 25 CrossRef CAS PubMed.
- F. Adar, The Porphyrins Vol. 3, Book 5, ed. D. Dolphin, Academic Press, New York, 1978, vol. 179, p. 167 Search PubMed.
- A. Casini, G. Mastrobuoni, M. Terenghi, C. Gabbiani, E. Monzani, G. Moneti, L. Casella and L. Messori, J. Biol. Inorg. Chem., 2007, 12, 1107 CrossRef CAS PubMed.
- C. Gabbiani, L. Massai, F. Scaletti, E. Michelucci, L. Maiore, M. A. Cinellu and L. Messori, J. Biol. Inorg. Chem., 2012, 17, 1293 CrossRef CAS PubMed.
- H. B. Gray and J. R. Winkler, Chem. Phys. Lett., 2009, 483, 1 CrossRef CAS PubMed.
- K. M. Yocom, J. B. Shelton, J. R. Shelton, W. A. Schroeder, G. Worosila, S. S. Isied, E. Bordignon and H. B. Gray, Proc. Natl. Acad. Sci. U. S. A., 1982, 79, 7052 CrossRef CAS.
- A. Vergara, G. D'Errico, D. Montesarchio, G. Mangiapia, L. Paduano and A. Merlino, Inorg. Chem., 2013, 52, 4157 CrossRef CAS PubMed.
- T. Santos-Silva, A. Mukhopadhyay, J. D. Seixas, G. J. Bernardes, C. C. Romão and M. J. Romão, Dalton Trans., 2015, 44, 5058 RSC.
- H. Tabe, K. Fujita, S. Abe, M. Tsujimoto, T. Kuchimaru, S. Kizaka-Kondoh, M. Takano, S. Kitagawa and T. Ueno, Inorg. Chem., 2015, 54, 215 CrossRef CAS PubMed.
- H. Hartmann, S. Zinser, P. Komninos, R. T. Schneider, G. U. Nienhaus and F. Parak, Proc. Natl. Acad. Sci. U. S. A., 1996, 93, 7013 CrossRef CAS.
- A. Merlino, M. R. Fuchs, A. Pica, A. Balsamo, F. S. Dworkowski, G. Pompidor, L. Mazzarella and A. Vergara, Acta Crystallogr., Sect. D: Biol. Crystallogr., 2013, 69, 137 CAS.
- G. E. Büchel, I. N. Stepanenko, M. Hejl, M. A. Jakupec, B. K. Keppler and V. B. Arion, Inorg. Chem., 2011, 50, 7690 CrossRef PubMed.
- K. Kramkowski, A. Leszczynska, A. Mogielnicki, S. Chlopicki, A. Federowicz, E. Grochal, B. Mann, T. Brzoska, T. Urano, R. Motterlini and W. Buczko, Arterioscler., Thromb., Vasc. Biol., 2012, 32, 2149 CrossRef CAS PubMed.
- S. Fayad-Kobeissi, J. Ratovonantenaina, H. Dabiré, J. L. Wilson, A. M. Rodriguez, A. Berdeaux, J. L. Dubois-Randé, B. E. Mann, R. Motterlini and R. Foresti, Biochem. Pharmacol., 2016, 102, 64 CrossRef CAS PubMed.
- D. Babu, G. Leclercq, V. Goossens, Q. Remijsen, P. Vandenabeele, R. Motterlini and R. A. Lefebvre, Toxicol. Appl. Pharmacol., 2015, 288, 161 CrossRef CAS PubMed.
- P. Kaczara, R. Motterlini, G. M. Rosen, B. Augustynek, P. Bednarczyk, R. Foresti and S. Chlopicki, Biochim. Biophys. Acta, 2015, 1847, 1297 CrossRef CAS PubMed.
- A. Nikam, A. Ollivier, M. Rivard, J. L. Wilson, K. Mebarki, T. Martens, J. L. Dubois-Rande, R. Motterlini and R. Foresti, J. Med. Chem., 2016, 59, 756 CrossRef CAS PubMed.
- L. S. Nobre, H. Jeremias, C. C. Romao and L. M. Saraiva, Dalton Trans., 2016, 45, 1455 RSC.
Footnotes |
| † Electronic supplementary information (ESI) available: Structural studies by XRD collections; spectroscopic characterization and solvent stability/reactivity by UV-Vis, ATR-FTIR and 1H NMR data; HPLC chromatograms; details from computation studies (DFT and semi-empirical methods); reactivity with proteins via UV-Vis and ESI-MS; and concentration–effect curves against human cancer cell lines (A549, CH1/PA-1, SW480). CCDC 1516744–1516746. For ESI and crystallographic data in CIF or other electronic format see DOI: 10.1039/c6dt04295c |
| ‡ Current address: Department of Chemistry, University of Massachusetts Amherst, 710 Nt. Pleasant Street, Amherst, MA 01003, USA. |
| This journal is © The Royal Society of Chemistry 2017 |