 Open Access Article
Creative Commons Attribution 3.0 Unported Licence
The influence of halides in polyoxotitanate cages; dipole moment, splitting and expansion of d-orbitals and electron–electron repulsion†
Schirin
Hanf
 a,
Peter D.
Matthews
 *ab,
Ning
Li
ac,
He-Kuan
Luo
c and
Dominic S.
Wright
*a
aDepartment of Chemistry, University of Cambridge, Lensfield Road, Cambridge, CB2 1EW, UK. E-mail: dsw1000@cam.ac.uk
bSchool of Chemistry, University of Manchester, Oxford Road, Manchester, M13 9PL, UK. E-mail: peter.matthews-2@manchester.ac.uk
cInstitute of Materials Research and Engineering, Agency for Science, Technology and Research, 2 Fusionopolis Way, #08-03, Innovis, Singapore 138634, Singapore
First published on 12th December 2016
Abstract
Metal-doped polyoxotitanate (M-POT) cages have been shown to be efficient single-source precursors to metal-doped titania [TiO2(M)] (state-of-the-art photocatalytic materials) as well as molecular models for the behaviour of dopant metal ions in bulk titania. Here we report the influence halide ions have on the optical and electronic properties of a series of halide-only, and cobalt halide-‘doped’ POT cages. In this combined experimental and computational study we show that halide ions can have several effects on the band gaps of halide-containing POT cages, influencing the dipole moment (hole–electron separation) and the structure of the valance band edge. Overall, the band gap behaviour stems from the effects of increasing orbital energy moving from F to I down Group 17, as well as crystal-field splitting of the d-orbitals, the potential effects of the Nephelauxetic influence of the halides and electron–electron repulsion.
Introduction
Metal-‘doped’ polyoxotitanate (M-POT) cages of the form [TixOy(OR)zMnXm] (R = Et or iPr, M = transition metal or lanthanide and X = halide) have been of great interest in recent years as single-source precursors to metal-doped TiO2 [TiO2(M)].1–11 In undoped TiO2 (a high band gap semiconductor), excitation leads to the promotion of an electron from the valence band [predominately O(-p)] to the conduction band [predominately Ti(-d)].12–15 The introduction of a metal dopant into TiO2 can improve the quantum efficiency of this process and the ability to harness a broader range of solar energy in two ways. Firstly, if the metal is inhomogenously dispersed within the titania it will induce a dipole within the bulk material, which promotes hole–electron separation.16 Secondly, the low-lying d-orbitals of the dopant metal (M) can mix with the orbitals at the band gap edge, raising the energy of the valence band and decreasing the band gap of [TiO2(M)] compared to TiO2 (from ca. 3.2 eV to ca. 2.7 eV). These effects have led to extensive applications of [TiO2(M)] in, for example, the photocatalytic destruction of pollutants and water splitting.1–10,17–22 We have shown that POT/M-POT cages can be used as atom-efficient, low-temperature single-source materials to [TiO2(M)], which can deliver the same M![[thin space (1/6-em)]](https://www.rsc.org/images/entities/char_2009.gif) :
:![[thin space (1/6-em)]](https://www.rsc.org/images/entities/char_2009.gif) Ti ratio from the M-POT to [TiO2(M)].20,23,24
Ti ratio from the M-POT to [TiO2(M)].20,23,24
A further key focus of interest in M-POTs is their potential structural and electronic relationship to bulk [TiO2(M)]. It is for this reason that the cages have typically been referred to as ‘doped’, when heterobimetallic cluster might have been considered more conventional. In order to be able to draw comparisons to the literature, we will continue with the naming scheme of ‘doped’ polyoxotitanate cage. The TixOy cores of M-POTs can be seen as nano- or sub-nano sized fragments of bulk TiO2, which are encapsulated in a stabilising ligand periphery. Important issues in this respect are the extent of quantum confinement in M-POTs compared to TiO2 and the relationship between structure and size of the M-POTs and their HOMO–LUMO/band gaps. This last issue is a contentious one. However, we have considered the band gap of the M-POT cages to correspond to the principle, predominantly O(-p) → Ti(-d) charge-transfer transition within the TixOy fragments of these species, by analogy with the electronic structures of bulk TiO2 and [TiO2(M)]. It is important in this regard to separate the spectroscopic effects of this transition from, for example, localised transitions like d–d transitions of dopant transition metal ions, which may otherwise lead to large errors in the determination of band gaps in M-POTs.
There are many structural and electronic analogies between the electronic behaviour of M-POTs and bulk [TiO2(M)]. For example, in a recent structural and quantum mechanical study of a series of related CoII-‘doped’ POTs we showed that one potentially important effect in reducing the band gap of M-POTs is that of dipole moment, an effect which is directly analogous to that found in bulk [TiO2(M)].16 Thus, if the direction of the dipole moment is coincident with change in electron density for the HOMO–LUMO transition, a significant band gap reduction is expected.16,25–28 This conclusion has recently been challenged by Coppens and Zhang in respect to the experimental band gaps found in [Ti11O14(OiPr)17(MX)] (M = Mn, Fe; X = Cl, Br or I).26 However,29 reassessment of their spectroscopic data (ignoring the spurious effect of localised d–d transitions) supports our conclusions concerning the influence of dipole moment on band gap.26
In addition to the metal ion, halogen doping can also reduce the band gap of TiO2 and enhance its photocatalytic activity.30 However, very few POT cages have been reported that model anion encapsulation in bulk TiO2.30,31 A striking example is seen in the anion [(BrCo)6Ti15O24(OiPr)18Br]−, in which a spherical POT ‘traps’ a bromide anion at the center.9
In this experimental and computational paper we explore the electronic effects of halide inclusion in three series of halide cages [Ti3(OiPr)9X] (1-X, X = F, Cl, Br, I), [Ti4O(OEt)15CoX] (2-X, X = F, Cl, Br, I) and [Ti7O5(OEt)19CoX] (3-X, X = F, Cl, Br, I), which we compare to the ‘undoped’ counterparts [Ti3O(OiPr)9(OMe)] (1), [Ti4O(OEt)14(HOEt)] (2) and [Ti7O4(OEt)20] (3).32,33 These studies stress the important relationship between dipole moment and band gap and also reveal that the halide ions in these species can make a number of other contributions to the band gap behaviour.
Results and discussion
Halide-‘doped’ POT cages
The focus of this current work was on the effects of halide ions on the band gaps of ‘undoped’ polyoxotitanate (POT) and metal-‘doped’ polyoxotitanate cages (M-POT).The new cage [Ti3O(OiPr)9Cl] (1-Cl, Fig. 1, ESI Fig. S13†) was obtained from the 2![[thin space (1/6-em)]](https://www.rsc.org/images/entities/char_2009.gif) :
:![[thin space (1/6-em)]](https://www.rsc.org/images/entities/char_2009.gif) 1 solvothermal reaction of Ti(OiPr)4 with WCl6 in iPrOH at 150 °C. The synthetic difficulties involved with other tungsten hexahalides, WX6 (X = F, Br, I) meant that this synthetic route could not be extended to the isostructural cages 1-X.34 The cage 1-Cl is obtained in 14% crystalline yield and was characterised by elemental analysis, IR spectroscopy, 1H NMR spectroscopy and single-crystal X-ray crystallography. The structure of 1-Cl (Fig. 1) consists of a C3-symmetric trinuclear titanium core linked by three bridging μ2-OiPr groups, with a μ3-O and a μ3-Cl atom above and below the Ti3 ring plane. The Ti atoms have a slightly distorted octahedral coordination geometry. The Ti–μ2-OiPr bond lengths are in the range of 2.021(5)–2.040(5) Å, while the terminal iPrO–Ti bonds are shorter at 1.755(5)–1.788(5) Å and the Ti–μ3-O are of intermediate length [1.939(5)–1.948(4) Å]. The Ti–Cl bond lengths range from 2.726(2)–2.772(2) Å. The Ti–Cl–Ti bond angles are 67.41(6)–67.68(6)°, and the Ti–μ3-O–Ti angles are 103.6(2)–104.1(2)°.
1 solvothermal reaction of Ti(OiPr)4 with WCl6 in iPrOH at 150 °C. The synthetic difficulties involved with other tungsten hexahalides, WX6 (X = F, Br, I) meant that this synthetic route could not be extended to the isostructural cages 1-X.34 The cage 1-Cl is obtained in 14% crystalline yield and was characterised by elemental analysis, IR spectroscopy, 1H NMR spectroscopy and single-crystal X-ray crystallography. The structure of 1-Cl (Fig. 1) consists of a C3-symmetric trinuclear titanium core linked by three bridging μ2-OiPr groups, with a μ3-O and a μ3-Cl atom above and below the Ti3 ring plane. The Ti atoms have a slightly distorted octahedral coordination geometry. The Ti–μ2-OiPr bond lengths are in the range of 2.021(5)–2.040(5) Å, while the terminal iPrO–Ti bonds are shorter at 1.755(5)–1.788(5) Å and the Ti–μ3-O are of intermediate length [1.939(5)–1.948(4) Å]. The Ti–Cl bond lengths range from 2.726(2)–2.772(2) Å. The Ti–Cl–Ti bond angles are 67.41(6)–67.68(6)°, and the Ti–μ3-O–Ti angles are 103.6(2)–104.1(2)°.
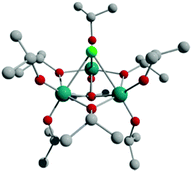 | ||
| Fig. 1 Structure of [Ti3O(OiPr)9Cl] (1-Cl). Note the C3v symmetry of the molecule. Hydrogen atoms are omitted for clarity. Teal = Ti, red = O, grey = C, green = Cl. | ||
In order to investigate the influence of the halide on the POT cage, a related Ti3-cage [Ti3O(OiPr)9(OMe)] (1) was prepared from the reaction of Ti(OiPr)4, water and methanol in 2-propanol.35 The ‘undoped’ [Ti3O(OiPr)10] cage was not investigated as part of this study due to the low stability of this oxoalkoxide, probably due to steric effects and its low degree of condensation.35 The cage compound 1-Cl is of special interest in being a rare example of a halide-containing POT cage, providing the opportunity to study the effects of halide-‘doping’ in this situation, in the absence of the effects of the orbital contributions by a dopant metal ion.
The diffuse reflectance UV-vis spectra of crystalline 1 and 1-Cl are shown in Fig. 2, with the band gaps determined by the Direct Extrapolation (DE) method of 3.74 ± 0.12 eV for 1 and 3.22 ± 0.17 eV for 1-Cl. For this method, the Kubelka–Munk function is plotted against the energy of the photons and from the direct extrapolation of the absorption edge data to the energy axis the band gap can be determined. The error in the band gap, which is often ignored by authors, was derived from propagating the errors of regression.36–38 It is clear that the ‘undoped’ cage 1 exhibits a larger band gap than the Cl-‘doped’ counterpart 1-Cl.
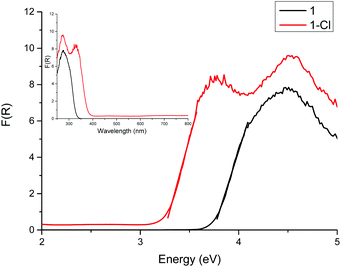 | ||
| Fig. 2 Diffuse reflectance UV-vis spectrum of 1 and 1-Cl. The band gap was determined by the DE method as 3.74 eV for 1 and 3.22 eV for 1-Cl. | ||
DFT calculations were carried out to predict the influence of the halide on the band gaps of the whole series 1-X (X = F, Cl, Br, I). For these calculations the B3LYP functional39–41 in conjunction with the 6-31g** basis set42,43 (6-311g** for iodine44), were used. Initial geometry optimisations of the four structures show good agreement with the structural features observed experimentally for 1-Cl, with the change in the halide ions having no effect on the overall arrangement adopted. The band gaps extracted from DOS calculations for the halide-POT cages are in the order 1-F (5.49 eV) > 1-Cl (5.41 eV) > 1-Br (5.11 eV) > 1-I (4.18 eV) (ESI Table S9†). Comparison with the experimentally-determined value for 1 (3.74 ± 0.12 eV) and 1-Cl (3.22 ± 0.17 eV) shows that the calculated values vastly overestimate the band gap. However, band gaps obtained from TD-DFT calculations (first singlet excitation energy with oscillator strength ≥0) agree much better with the experimentally-obtained value: 1-F (4.42 eV) > 1-Cl (4.39 eV) > 1-Br (4.14 eV) > 1-I (3.36 eV) (ESI Table S10†). Although, the two computational methods show different absolute values of the band gap, the significant point is the overall trend of a decrease in band gap with increasing halide size.45 The calculated UV-vis spectra are provided in ESI Fig. S1.†
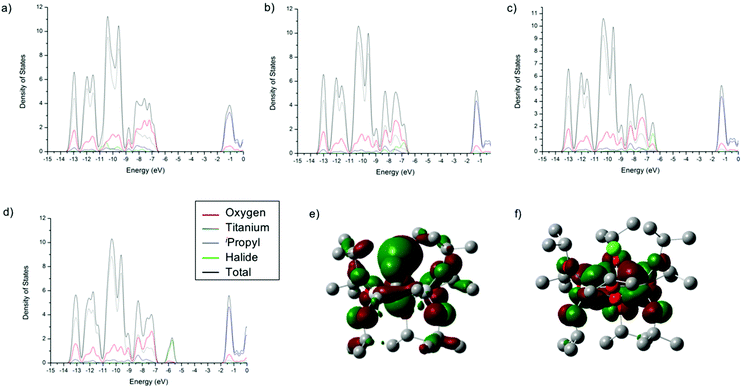
The density of states (DOS) diagrams of 1-X are key to understanding the trend in decreasing band gap from X = F to X = I. They indicate that, as expected, the conduction bands (or LUMO) are predominantly made up of the Ti(-d) orbitals (Fig. 3, ESI Tables S1–S4†). The valence band (or HOMO) is initially dominated by the O(-p) character for 1-F. However, moving from F, to Cl, to Br and then I, the orbital contribution to the HOMO from the halide ion increases from 2% for 1-F to 35% for 1-Cl also for 1-Br the HOMO is 63% Br and for 1-I it is 91% I (Fig. 3, ESI Tables S1–S4†). It is clear from these calculations that the increasing energy of the valance orbitals of the halide located at the band gap edge is the reason for the observed decrease in the band gap moving down Group 17. This is illustrated schematically in Fig. 4.
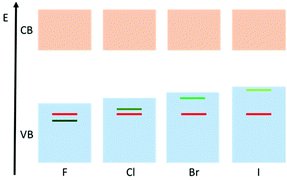 | ||
| Fig. 4 Qualitative diagram demonstrating the influence of the halide on the valence band in the 1-X (X = F, Cl, Br, I) family. Red = oxygen contribution, green = halide contribution. | ||
The C3 symmetry of the series 1-X suggests that the dipole moment lies along the C3 axes of the complexes, which was confirmed by DFT calculations. Calculation of the dipole moments shows that the iodine has a major influence in comparison to the other halides: 1-F (1.07 D) ≈ 1-Cl (0.90 D) ≈ 1-Br (0.84 D) ≪ 1-I (3.28 D). The HOMO and LUMO of 1-X are shown in Fig. 4e and f, respectively (for 1-Cl). The LUMO is centred around the Ti3O core, whilst the major contribution to the HOMO comes from the halide ion. Therefore, the HOMO–LUMO transition is in the same direction as the dipole moment, in line with our previous conclusions concerning the relationship between the effect of dipole moment on the reduction of band gap drawn from a CoII-‘doped’ series of M-POTs.16,25 These findings are also in-line with the behaviour of halide-‘doped’ TiO2.46,47
Halide ions in CoII-POTs
M-POT cages with a Ti4 or Ti7 core are a particularly common class, spanning the range from the ‘undoped’ [Ti4O(OEt)14(HOEt)] and [Ti7O4(OEt)20], to metal-‘doped’ [Ti4O(OEt)15MX] (M = Co, Fe, Cu, Zn; X = Cl, Br) and [Ti7O5(OEt)19MX] [M = Co, Fe; X = Cl, Br]. The compounds are accessed through the simple solvothermal reactions of Ti(OEt)4 with the relevant metal halides in anhydrous ethanol.16,32,48,49The CoII-‘doped’ cages [Ti4O(OEt)15MX] (2-X) and [Ti7O5(OEt)19CoX] (3-X) are structurally related to each other and their ‘undoped’ relatives, [Ti4O(OEt)14(HOEt)] (2) and [Ti7O4(OEt)20] (3). The CoII ion is bound to both Ti-cores in a similar, tetrahedral manner in 2-X and 3-X. The Ti7 cages can be regarded as an extended Ti4 cage, through the addition of a Ti3 unit at one end of the cage (Fig. 5).
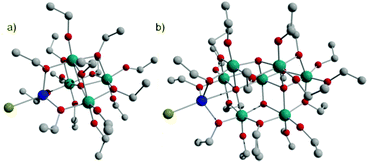 | ||
| Fig. 5 The structures of (a) [Ti4O(OEt)15CoX] (2-X, X = Cl, Br) and (b) [Ti7O5(OEt)19CoX] (3-X, Cl, Br). Teal = Ti, red = O, grey = C, blue = Co, green = X. | ||
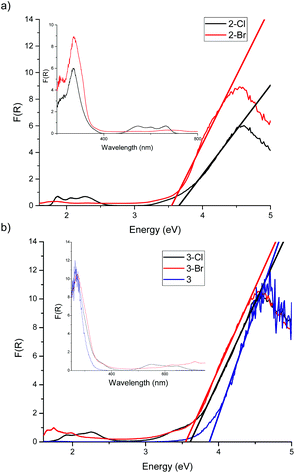
The Cl and Br cages for 2-X and 3-X have previously been reported.50 The experimental UV-vis spectra of 2-X (X = Cl, Br) and 3-X (X = Cl, Br) have two major features, absorption edges in the 300–400 nm region associated with the TixOy core and CoII d–d transitions (4A2 → 4T1) at 550 nm (Fig. 6, ESI Fig. S12†).51
Analysis of the TixOy cut-off reveals that the band gaps in 2-Cl (3.65 ± 0.09 eV) and 2-Br (3.57 ± 0.13 eV) are identical within experimental error. Unfortunately, the band gap of the ‘undoped’ counterpart 2 could not be obtained due to its low melting point. Again, in the case of 3-X the band gap values for 3-Cl (3.61 ± 0.06 eV) and 3-Br (3.57 ± 0.05 eV) are identical within experimental error [but less than for ‘undoped’ 3 (3.88 ± 0.13 eV)]. The seeming invariance of the band gap behaviour of the cages 2-X and 3-X with different halides cannot be explained by dipole moment alone.
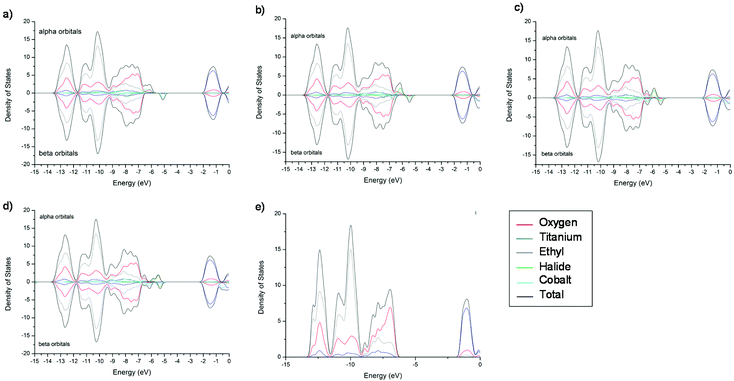
In order to give insight into the experimental band gaps, we turned to DFT calculations. Table 1 shows the calculated band gaps (Eg) for the two CoII-‘doped’ M-POT cages (2-X and 3-X) for both α and β spin states obtained from DOS calculations. In all cases Eg(β) is smaller than Eg(α). This can be explained by studying the DOS plots for the two families of cages. In this case, absolute numbers of the band gaps could not be obtained from the first singlet exited state from TD-DFT calculations due to the presence of d–d transitions.
| Cage | E g(α)/eV | E g(β)/eV |
|---|---|---|
| 2-F | 4.29 | 3.46 |
| 2-Cl | 4.38 | 3.71 |
| 2-Br | 4.15 | 3.63 |
| 2-I | 3.74 | 3.53 |
| 2 | 4.99 | |
| 3-F | 4.28 | 3.34 |
| 3-Cl | 4.33 | 3.60 |
| 3-Br | 4.01 | 3.52 |
| 3-I | 3.55 | 3.38 |
| 3 | 5.10 | |
The DOS plots for 3-X are shown in Fig. 7, those for 2-X demonstrate very similar behaviour and are found in ESI Fig. S2.† Starting with ‘undoped’ cage 3 (Fig. 7e), it can be seen that the valence band is composed predominantly of the O(-p) and the conduction band of the Ti(-d) orbital character, as expected. The inclusion of a CoX moiety results in the addition of new α and β spin states, which consist mainly of the Co and X orbitals. The α and β band gaps for both 2-X and 3-X have a slightly different ordering across the halide series (Table 1, Cl > F > Br > I for α and Cl > Br > I > F for β), which is caused by the different underlying transitions. In the case of 3-F the α band gap is mainly caused by Co(-d) → Ti(-d) (Co contribution 50%), F(-p) → Ti(-d) (F contribution 24%) and O(-p) → Ti(-d) (O contribution 20%) transitions, whereas for the I analogue only the I(-p) → Ti(-d) (I contribution 93%) transitions dominate. On the other hand, the β band gap is predominantly Co(-d) → Ti(-d) for 3-F (Co contribution 80%) and again I(-p) → Ti(-d) (I contribution 70%) transitions are observed for 3-I (ESI Tables S21–S25†). This same trend is seen for 2-X (ESI Tables S11–S15†). The experimentally-obtained band gaps will consist of various types of transitions [X(-p) → Ti(-d), Co(-d) → Ti(-d), O(-p) → Ti(-d)]. However, the magnitudes of the computational values for Eg(β) agree closely with the experimental values [i.e., for 2-X 3.57 ± 0.13 eV (2-Br) to 3.65 ± 0.09 eV (2-Cl), and for 3-X 3.57 ± 0.05 to (3-Br) 3.61 ± 0.06 eV (3-Cl)].
In conclusion, the computational results suggest that 2/3-F should have a smaller band gap than their Cl counterparts (for both Eg(α) and Eg(β), Table 1). This is quite surprising, since one would expect the heavier halide to contribute higher energy electronic states to the valence band, as was demonstrated by the behaviour of 1-X.
Overall, the predicted behaviour of these cages can be understood in terms of the effect of the halide ligands on the magnitude of the splitting of the d-orbitals (Δ) (i.e., the position in the Spectrochemical series), combined with the contribution of the halide orbitals to the valance band edge and its effect on the expansion of the d-orbitals (i.e., the Nephelauxetic effect). For Cl, Br and I, both the energy of the valance orbitals and their Nephelauxetic influence increases down going from Cl, to Br, to I. The reduction in band gap is a consequence mainly of the increased contribution of the valance orbitals of the halide at the valance band edge. For F, however, the reduction in the band gap predicted by calculations is primarily the result of the larger crystal-field splitting of the e and t2 orbitals, resulting in the t2 orbital making a larger contribution to the valance band edge (even though the valance orbitals of F are buried within the valance band). Calculations also suggest that an additional contribution to the lowering of the band gap in the case of F is that of the increased O(-p) orbital energy in the alpha channel, which is probably due to F(-p)/O(-p) orbital repulsion, which is greater for the more electron dense F than for the other halides. This results in an increase in the O(-p) orbital energy (i.e., the valence band energy). These conclusions are depicted schematically in Fig. 8.
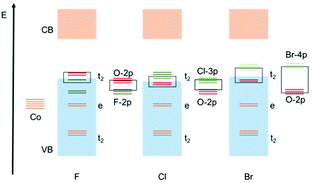 | ||
| Fig. 8 Qualitative molecular orbitals to explain the observed band gap trends in cages 2-X and 3-X. Orange = Co, red = O and green = halide. | ||
Although the experimental errors involved do not allow us to discern the theoretically predicted trends in detail, the implication is that the similarity of the band gaps of the two series of compounds 2-Cl, 2-Br and 3-Cl, 3-Br observed experimentally results from the counterbalance of the effect of the contribution of the halide orbitals at the band gap edge (which is most significant for Cl, Br and I) versus greater crystal field splitting and increased O(-p) orbital energy (which is the greatest contribution for F).
Conclusions
We have used density functional theory to predict the influence of halides on polyoxotitanate cages. For the cages [Ti3(OiPr)9X] (1-X, X = F, Cl, Br, I), the predicted reduction in the band gap is solely due to the effect of the increase in the energy of the valance orbitals of the halide at the valance band edge. In the CoII-‘doped’ cages [Ti4O(OEt)15CoX] (2-X, X = F, Cl, Br, I) and [Ti7O5(OEt)19CoX] (3-X, X = F, Cl, Br, I) the additional effects of crystal-field splitting and electron–electron repulsion between F(-p) and O(-p) orbitals needs to be considered to explain the unexpectedly low band gap predicted in the F-containing cages. We have also reported the synthesis of a new trinuclear cage [Ti3O(OiPr)9Cl] (1-Cl). Overall, our study backs up the idea that dipole moment has a large influence on band gap in POT and M-POT cages. However, the crystal field, the Nephelauxetic influence and electron–electron repulsion can also have a role to play.Experimental
Materials and synthesis
All chemicals were purchased from Sigma-Aldrich and used in their standard state. Anhydrous ethanol and isopropanol were prepared via distillation over Mg turnings. Autoclaves were loaded with reactants in a N2-filled glove box (Saffron, type α). Several of the Co-POT cages were synthesised according to the literature: 1,352-Cl,522-Br,163-Cl![[thin space (1/6-em)]](https://www.rsc.org/images/entities/char_2009.gif) 52 and 3-Br.16
52 and 3-Br.16
Synthesis of 1-Cl
Ti(OiPr)4 (3.50 mL, 11.5 mmol), tungsten(VI) chloride (264 mg, 0.66 mmol) and dry isopropanol (7.00 mL, 92 mmol) were placed in a Teflon-lined autoclave and heated at 150 °C for 72 hours. After slow cooling to room temperature, colourless crystals of [Ti3O(OiPr)9Cl] were formed (62 mg, 0.09 mmol, 13.6% yield with respect to WCl6). Elemental analysis (%) calcd for C27H63O10ClTi3: C 44.6 H 8.7; found: C 44.1 H 9.1. 1H NMR (C6D6) (ppm) = 1.16 (m, OCH(CH3)2), 4.48 (br, m, OCH(CH3)2). FT-IR (cm−1) = 2969 (m), 2923 (m), 1770 (s), 1759 (s), 1463 (w), 1375 (m), 1247 (s), 1162 (w), 1104 (s), 1056 (m), 1000 (s) 968 (m), 918 (m).Synthesis of 2
Ti(OEt)4 (6.0 ml, 27.0 mmol), 1,1′-bi-2-naphthol (286 mg, 1.0 mmol) and dry EtOH (10.00 ml, 170 mmol) were loaded into a Teflon-lined autoclave and heated at 150 °C for 72 hours. After slow cooling to room temperature pale yellow crystals could be grown at 0 °C (92 mg, 0.10 mmol, 1.5%). Elemental analysis (%) calcd for C30H76O16Ti4: C 40.7 H 8.7; found: C 39.9 H 8.7. 1H NMR (CDCl3) (ppm) = 1.23–1.32 (br, m, OCH2CH3), 4.33–4.47 (br, m, OCH2CH3).Synthesis of 3
A solution of deionised water (0.34 mL) in ethanol (5.00 mL) was added to a second solution of Ti(OEt)4 (7.00 mL, 33 mmol) in toluene (15 mL) and stirred at room temperature for two hours. The reaction mixture was then concentrated in vacuo and crystals of [Ti7O4(OEt)20] (3) were grown at −20 °C (4.17 g, 3.21 mmol, 9.7% yield). Elemental analysis (%) calcd for C40H100O24Ti7: C 37.0 H 7.8; found: C 36.6 H 7.9. Unit cell matched CCDC 169789.321H NMR (C6D6) (ppm) = 1.1–1.8 (3H overlapping multiplets, OCH2CH3), 4.1–5.4 (2H overlapping multiplets, OCH2CH3).X-ray crystallography
Single crystal X-ray diffraction was carried out using a Nonius Kappa CCD (Mo-Kα) (1-Cl). Data reduction was done using the HKL Denzo and Scalepack program. Structure solutions were obtained using the SHELXS-97 software53 and structure refinement completed using the SHELXL-97 programme.54 Details of the refinement are provided in the ESI Table S31.† CCDC reference number 1499257 (1-Cl).Spectroscopic measurements
Elemental analysis for carbon and hydrogen was performed using an Exeter CE-440 Elemental Analyser. Samples were prepared in aluminium capsules in a N2-filled glove box. Infrared (IR) spectroscopic measurements were performed on powdered samples using a Perkin Elmer Spectrum One FT-IR fitted with a diamond attenuated total reflectance system, which allowed for direct measurement of samples without the need for a nujol mull. UV-Vis measurements were made using a Varian Cary 50 UV-Vis spectrophotometer. The diffuse reflectance spectra were collected on powdered samples that were sandwiched between quartz plates and sealed with parafilm in a N2-filled glovebox. The Kubelka–Munk function F(R) was recorded over the range 250–800 nm. To determine the band gaps, the Kubelka–Munk function was plotted against the photon energy and the band gap was determined from direct extrapolation of the absorption edge to the energy axis. The errors were derived from propagating the errors of regression.36–38Theoretical calculations
Geometry optimisations of the polyoxotitanate cages were carried out using the Gaussian-Programme package (Revision D.01).55 The optimised structures were obtained employing the B3LYP![[thin space (1/6-em)]](https://www.rsc.org/images/entities/char_2009.gif) 39–41 density functional. The 6-31g**
39–41 density functional. The 6-31g**![[thin space (1/6-em)]](https://www.rsc.org/images/entities/char_2009.gif) 42,43 basis set (6-311g**
42,43 basis set (6-311g**![[thin space (1/6-em)]](https://www.rsc.org/images/entities/char_2009.gif) 56 for iodine from the EMSL database57,58) was used throughout the calculations of the Ti3-cage series, whereas the 6-31g*
56 for iodine from the EMSL database57,58) was used throughout the calculations of the Ti3-cage series, whereas the 6-31g*![[thin space (1/6-em)]](https://www.rsc.org/images/entities/char_2009.gif) 42,43 basis set (6-311g*
42,43 basis set (6-311g*![[thin space (1/6-em)]](https://www.rsc.org/images/entities/char_2009.gif) 56 for iodine from the EMSL database57,58) was used for the larger cobalt-‘doped’ POT cages. Time-dependent DFT (TD-DFT) calculations were carried out for the calculation of excited states.59–63 For the generation of the DOS as well as the UV-vis spectra and the analysis of the data the programme suit GaussSum64 was used. For the DOS calculation analysis of the iodine-containing cages (2-I and 3-I) with GaussSum, the output file of the Gaussian calculation (more precisely the alpha and beta occupied eigenvalues with λ ≥ 4000 eV) had to be modified/given an energy value. Usually, for the determination of the band gap of discrete molecules, the lowest UV-vis excitation energy (excitation energy of the first singlet excited state obtained from TD-DFT calculations) provides a reasonable approximation of the HOMO–LUMO gap.65 However, in the case of clusters containing transition metals, which, can undergo d–d transitions, this first excitation energy cannot be used as the band gap approximation, since the band gap would be completely underestimated (e.g. 0.7 eV for 3-Cl). Therefore, the band gaps were obtained from density of state calculations. However, in the case of the Ti3-cages it is possible to obtain the band gaps from TD-DFT calculations, since there are no d–d transitions possible. Molecular orbitals were visualised using the programme GaussView 5.0.8.66
56 for iodine from the EMSL database57,58) was used for the larger cobalt-‘doped’ POT cages. Time-dependent DFT (TD-DFT) calculations were carried out for the calculation of excited states.59–63 For the generation of the DOS as well as the UV-vis spectra and the analysis of the data the programme suit GaussSum64 was used. For the DOS calculation analysis of the iodine-containing cages (2-I and 3-I) with GaussSum, the output file of the Gaussian calculation (more precisely the alpha and beta occupied eigenvalues with λ ≥ 4000 eV) had to be modified/given an energy value. Usually, for the determination of the band gap of discrete molecules, the lowest UV-vis excitation energy (excitation energy of the first singlet excited state obtained from TD-DFT calculations) provides a reasonable approximation of the HOMO–LUMO gap.65 However, in the case of clusters containing transition metals, which, can undergo d–d transitions, this first excitation energy cannot be used as the band gap approximation, since the band gap would be completely underestimated (e.g. 0.7 eV for 3-Cl). Therefore, the band gaps were obtained from density of state calculations. However, in the case of the Ti3-cages it is possible to obtain the band gaps from TD-DFT calculations, since there are no d–d transitions possible. Molecular orbitals were visualised using the programme GaussView 5.0.8.66
Acknowledgements
We thank the EPSRC (Doctoral Prize for P. D. M.), A*STAR Singapore (Scholarship for N. L.), the Studienstiftung des deutschen Volkes, Fonds of the Chemical Industry (S. H.) for funding. Thanks also to Mr W.-Y. Chen for discussions and to Dr John Davies for collecting and solving the crystal data of 1-Cl. The authors would like to acknowledge the use of the EPSRC UK National Service for Computational Chemistry Software (NSCCS) at Imperial College London and contributions from its staff in carrying out this work.Notes and references
- W. Zhao, W. Ma, C. Chen, J. Zhao and Z. Shuai, J. Am. Chem. Soc., 2004, 126, 4782–4783 CrossRef CAS PubMed.
- M. Anpo and M. Takeuchi, J. Catal., 2003, 216, 505–516 CrossRef CAS.
- T. Morikawa, T. Ohwaki, K. Suzuki, S. Moribe and S. Tero-Kubota, Appl. Catal., B, 2008, 83, 56–62 CrossRef CAS.
- J. D. Musgraves, B. G. Potter and T. J. Boyle, J. Mater. Res., 2009, 24, 3372–3379 CrossRef CAS.
- B. A. Hernandez-Sanchez, T. J. Boyle, C. M. Baros, L. N. Brewer, T. J. Headley, D. R. Tallant, M. A. Rodriguez and B. A. Tuttle, Chem. Mater., 2007, 19, 1459–1471 CrossRef CAS.
- K. Li, S. Wei and W. Yang, J. Phys. Chem. Solids, 2011, 72, 643–647 CrossRef CAS.
- K. H. Mahmoud, Z. M. El-Bahy and A. I. Hanafy, J. Phys. Chem. Solids, 2011, 72, 1057–1065 CrossRef CAS.
- L. Song, C. Chen, S. Zhang and Q. Wei, Ultrason. Sonochem., 2011, 18, 1057–1061 CrossRef CAS PubMed.
- Y. Lv, J. Willkomm, A. Steiner, L. Gan, E. Reisner and D. S. Wright, Chem. Sci., 2012, 3, 2470–2473 RSC.
- A. Iwaszuk and M. Nolan, J. Phys. Chem. C, 2011, 115, 12995–13007 CAS.
- N. Li, P. D. Matthews, H.-K. Luo and D. S. Wright, Chem. Commun., 2016, 52, 11180–11190 RSC.
- X. Chen and S. S. Mao, Chem. Rev., 2007, 107, 2891–2959 CrossRef CAS PubMed.
- A. Yamakata, T. A. Ishibashi and H. Onishi, Int. J. Photoenergy, 2003, 5, 7–9 CrossRef CAS.
- A. Yamakata, T. A. Ishibashi and H. Onishi, J. Mol. Catal. A: Chem., 2003, 199, 85–94 CrossRef CAS.
- S. H. Szczepankiewicz, A. J. Colussi and M. R. Hoffmann, J. Phys. Chem. B, 2000, 104, 9842–9850 CrossRef CAS.
- Y. Lv, J. Cheng, A. Steiner, L. Gan and D. S. S. Wright, Angew. Chem., Int. Ed., 2014, 53, 1934–1938 CrossRef CAS PubMed.
- M. Sidheswaran and L. L. Tavlarides, Ind. Eng. Chem. Res., 2009, 48, 10292–10306 CrossRef CAS.
- L. Kumaresan, A. Prabhu, M. Palanichamy, E. Arumugam and V. Murugesan, J. Hazard. Mater., 2011, 186, 1183–1192 CrossRef CAS PubMed.
- Y.-H. Lai, H. S. Park, J. Z. Zhang, P. D. Matthews, D. S. Wright and E. Reisner, Chem. – Eur. J., 2015, 21, 3919–3923 CrossRef CAS PubMed.
- Y. Lv, M. Yao, J. P. Holgado, T. Roth, A. Steiner, L. Gan, R. M. Lambert and D. S. Wright, RSC Adv., 2013, 3, 13659–13662 RSC.
- Y.-Y. Wu, P. Wang, Y.-H. Wang, J.-B. Jiang, G.-Q. Bian, Q.-Y. Zhu and J. Dai, J. Mater. Chem. A, 2013, 1, 9862–9868 CAS.
- Y.-H. Lai, T. C. King, D. S. Wright and E. Reisner, Chem. – Eur. J., 2013, 19, 12943–12947 CrossRef CAS PubMed.
- P. Coppens, Y. Chen and E. Trzop, Chem. Rev., 2014, 114, 9645–9661 CrossRef CAS PubMed.
- P. D. Matthews, T. C. King and D. S. Wright, Chem. Commun., 2014, 50, 12815–12823 RSC.
- Y. Lv, J. Cheng, P. D. Matthews, J. P. Holgado, J. Willkomm, M. Leskes, A. Steiner, D. Fenske, T. C. King, P. T. Wood, L. Gan, R. M. Lambert and D. S. Wright, Dalton Trans., 2014, 43, 8679–8689 RSC.
- Y. Chen, K. N. Jarzembska, E. Trzop, L. Zhang and P. Coppens, Chem. – Eur. J., 2015, 21, 11538–11544 CrossRef CAS PubMed.
- P. Gorai, A. G. Hollister and E. G. Seebauer, Appl. Phys. Lett., 2013, 103, 141601 CrossRef.
- X. Li, Z. Li and J. Yang, Phys. Rev. Lett., 2014, 112, 18301 CrossRef PubMed.
- P. D. Matthews, N. Li, H.-K. Luo and D. S. Wright, Chem. – Eur. J., 2016, 22, 4632–4633 CrossRef CAS PubMed.
- T. J. Boyle, T. M. Alam, E. R. Mechenbier, B. L. Scott and J. W. Ziller, Inorg. Chem., 1997, 36, 3293–3300 CrossRef CAS PubMed.
- M. Schormann, S. P. Varkey, H. W. Roesky and M. Noltemeyer, J. Organomet. Chem., 2001, 621, 310–316 CrossRef CAS.
- R. Schmid, A. Mosset and J. Galy, J. Chem. Soc., Dalton Trans., 1991, 8, 1999–2005 RSC.
- Y. Lv, J. Willkomm, M. Leskes, A. Steiner, T. C. King, L. Gan, E. Reisner, P. T. Wood and D. S. Wright, Chem. – Eur. J., 2012, 18, 11867–11870 CrossRef CAS PubMed.
- Tungsten hexafluoride, hexachloride and hexabromide are known as the only tungsten hexahalides. The preparation of the F and Br derivatives involves elemental fluorine, HF or Br2, respectively. Unfortunately, the hexaflouride is very volatile and reactive and also the hexabromide is very sensitive and decomposes when heated. These facts limit their application in solvothermal reactions at high temperatures and high pressure. The use of WF6 and WBr6 was therefore avoided. As an alternative, solvothermal reactions of Ti(OR)4 (R = Et, OiPr) with the corresponding potassium halide salt were carried out. Unfortunately, the KF, KCl and KBr reactions resulted in an amorphous powder, however, slow cooling to room temperature of the KI reaction only gave colourless crystals of [Ti12O16(OiPr)16], previously reported by Day et al., J. Am. Chem. Soc., 1993, 115, 8469–8470.
- V. W. Day, T. A. Eberspacher, Y. Chen, J. Hao and W. G. Klemperer, Inorg. Chim. Acta, 1995, 229, 391–405 CrossRef CAS.
- Y. Chen, J. Sokolow, E. Trzop, Y.-S. Chen and P. Coppens, J. Chin. Chem. Soc., 2013, 60, 887–890 CrossRef CAS.
- Y. Chen, E. Trzop, A. Makal, J. D. Sokolow and P. Coppens, Inorg. Chem., 2013, 52, 4750–4752 CrossRef CAS PubMed.
- Y. Chen, E. Trzop, A. Makal, Y. Chen and P. Coppens, Dalton Trans., 2014, 38, 3839–3841 RSC.
- A. D. Becke, J. Chem. Phys., 1993, 98, 5648–5652 CrossRef CAS.
- C. Lee, W. Yang and R. G. Parr, Phys. Rev. B: Condens. Matter, 1988, 37, 785–789 CrossRef CAS.
- P. J. Stephens, F. J. Devlin, C. F. Chabalowski and M. J. Frisch, J. Phys. Chem., 1994, 98, 11623–11627 CrossRef CAS.
- G. A. Petersson, A. Bennett, T. G. Tensfeldt, M. A. Al-Laham, W. A. Shirley and J. Mantzaris, J. Chem. Phys., 1988, 89, 2193–2198 CrossRef CAS.
- G. A. Petersson and M. A. Al-Laham, J. Chem. Phys., 1991, 94, 6081–6090 CrossRef CAS.
- M. N. Glukhovstev, A. Pross, M. P. McGrath and L. Radom, J. Chem. Phys., 1995, 103, 1878–1885 CrossRef.
- M.-C. Kim, E. Sim and K. Burke, Phys. Rev. Lett., 2013, 111, 073003 CrossRef PubMed.
- S. Tojo, T. Tachikawa, M. Fujitsuka and T. Majima, J. Phys. Chem. C, 2008, 112, 14948–14954 CAS.
- H. Luo, T. Takata, Y. Lee, J. Zhao, K. Domen and Y. Yan, Chem. Mater., 2004, 16, 846–849 CrossRef CAS.
- S. Eslava, B. P. R. Goodwill, M. McPartlin and D. S. Wright, Inorg. Chem., 2011, 50, 5655–5662 CrossRef CAS PubMed.
- S. Eslava, M. McPartlin, R. I. Thomson, J. M. Rawson and D. S. Wright, Inorg. Chem., 2010, 49, 11532–11540 CrossRef CAS PubMed.
- We attempted to synthesise the fluoride terminated cage using CoF2, however, we were only able to isolate the Cl terminated cage as a result of Cl contamination in the Ti(OEt)4. This was characterised by elemental analysis and single crystal X-ray diffraction.
- K. W. Hipps and B. Susla, Chem. Phys. Lett., 1986, 132, 507–510 CrossRef CAS.
- S. Eslava, F. Hengesbach, M. McPartlin and D. S. Wright, Chem. Commun., 2010, 46, 4701–4703 RSC.
- G. M. Sheldrick, Acta Crystallogr., Sect. A: Fundam. Crystallogr., 2015, 71, 3–8 CrossRef PubMed.
- G. M. Sheldrick, Acta Crystallogr., Sect. C: Cryst. Struct. Commun., 2015, 71, 3–8 CrossRef PubMed.
- M. J. Frisch, G. W. Trucks, H. B. Schlegel, G. E. Scuseria, M. A. Robb, J. R. Cheeseman, G. Scalmani, V. Barone, B. Mennucci, G. A. Petersson, H. Nakatsuji, M. Caricato, X. Li, H. P. Hratchian, A. F. Izmaylov, J. Bloino, G. Zheng, J. L. Sonnenberg, M. Hada, M. Ehara, K. Toyota, R. Fukuda, J. Hasegawa, M. Ishida, T. Nakajima, Y. Honda, O. Kitao, H. Nakai, T. Vreven, J. A. Montgomery Jr., J. E. Peralta, F. Ogliaro, M. Bearpark, J. J. Heyd, E. Brothers, K. N. Kudin, V. N. Staroverov, R. Kobayashi, J. Normand, K. Raghavachari, A. Rendell, J. C. Burant, S. S. Iyengar, J. Tomasi, M. Cossi, N. Rega, J. M. Millam, M. Klene, J. E. Knox, J. B. Cross, V. Bakken, C. Adamo, J. Jaramillo, R. Gomperts, R. E. Stratmann, O. Yazyev, A. J. Austin, R. Cammi, C. Pomelli, J. W. Ochterski, R. L. Martin, K. Morokuma, V. G. Zakrzewski, G. A. Voth, P. Salvador, J. J. Dannenberg, S. Dapprich, A. D. Daniels, Ö. Farkas, J. B. Foresman, J. V. Ortiz, J. Cioslowski and D. J. Fox, Gaussian 09, Revision E.01, 2009 Search PubMed.
- M. N. Glukhovstev, A. Pross, M. P. McGrath and L. Radom, J. Chem. Phys., 1995, 103, 1878–1885 CrossRef.
- D. Feller, J. Comput. Chem., 1996, 17, 1571–1586 CrossRef CAS.
- K. L. Schuchardt, B. T. Didier, T. Elsethagen, L. Sun, V. Gurumoorthi, J. Chase, J. Li and T. L. Windus, J. Chem. Inf. Model., 2007, 47, 1045–1052 CrossRef CAS PubMed.
- M. E. Casida, C. Jamorski, K. C. Casida and D. R. Salahub, J. Chem. Phys., 1998, 108, 4439–4449 CrossRef CAS.
- F. Furche and R. Ahlrichs, J. Chem. Phys., 2002, 117, 7433–7447 CrossRef CAS.
- R. E. Stratmann, G. E. Scuseria and M. J. Frisch, J. Chem. Phys., 1998, 108, 8218–8224 CrossRef.
- C. V. Caillie and R. D. Amos, Chem. Phys. Lett., 2000, 317, 159–164 CrossRef.
- C. V. Caillie and R. D. Amos, Chem. Phys. Lett., 1999, 308, 249–225 CrossRef.
- M. O'Boyle, A. L. Tenderholt and K. M. Langner, J. Comput. Chem., 2008, 29, 839–845 CrossRef PubMed.
- G. R. Hutchison, M. A. Ratner and T. J. Marks, J. Phys. Chem. A, 2002, 106, 10596–10605 CrossRef CAS.
- R. Dennington, T. Keith and J. Millam, GausView, Semichem Inc., Shawnee Mission KS, 2009 Search PubMed.
Footnote |
| † Electronic supplementary information (ESI) available: Computational details, diffuse reflectance spectroscopy and single crystal X-ray crystallography. CCDC 1499257. For ESI and crystallographic data in CIF or other electronic format see DOI: 10.1039/c6dt04288k |
| This journal is © The Royal Society of Chemistry 2017 |

