 Open Access Article
Creative Commons Attribution 3.0 Unported Licence
Flexible crystals of perovskite-like coordination polymers with a tunable and switchable organic guest: (CH3NH3)2[KFe(CN)6] and (CH3NH3)2[KCo(CN)6]†
M.
Rok
 *a,
J. K.
Prytys
a,
V.
Kinzhybalo
 b and
G.
Bator
a
aFaculty of Chemistry, University of Wroclaw, Joliot-Curie 14, 50-383 Wroclaw, Poland. E-mail: magdalena.rok@chem.uni.wroc.pl
bInstitute of Low Temperature and Structure Research, Polish Academy of Science, Okólna 2, PO Box 937, 50-950 Wroclaw, Poland
First published on 16th January 2017
Abstract
The crystal structure has been determined for (CH3NH3)2[KCo(CN)6] at temperatures 100 and 443 K. It crystallizes in the monoclinic space group C2/c (LT) and in the cubic one Fm![[3 with combining macron]](https://www.rsc.org/images/entities/char_0033_0304.gif) m (HT). The dielectric response has been investigated for single crystals of pure K3[A′(CN)6] and guest–hosts of (CH3NH3)2[KA′(CN)6], where A′ is a trivalent metal, Co or Fe. Their dielectric properties were measured in the frequency range between 135 Hz and 2 MHz in a wide temperature range between 200 and 460 K. The anisotropy of the electric permittivity for single crystals of (CH3NH3)2[KCo(CN)6] was analysed in terms of the crystal structure. The relaxation processes were observed in the case of the pure host K3Fe(CN)6 and the guest/host crystal (CH3NH3)2[KFe(CN)6]. The activation energies of the dielectric relaxation have been estimated to be equal to 44 and 40 kJ mol−1 for (CH3NH3)2[KFe(CN)6] and K3Fe(CN)6, respectively. The mechanism of the phase transitions found at 425 K and 421 K for (CH3NH3)2[KFe(CN)6] and (CH3NH3)2[KCo(CN)6], respectively, has been postulated. From the dielectric losses the value of the electric ac conductivity has been estimated and analyzed in terms of the activation process of the current carriers.
m (HT). The dielectric response has been investigated for single crystals of pure K3[A′(CN)6] and guest–hosts of (CH3NH3)2[KA′(CN)6], where A′ is a trivalent metal, Co or Fe. Their dielectric properties were measured in the frequency range between 135 Hz and 2 MHz in a wide temperature range between 200 and 460 K. The anisotropy of the electric permittivity for single crystals of (CH3NH3)2[KCo(CN)6] was analysed in terms of the crystal structure. The relaxation processes were observed in the case of the pure host K3Fe(CN)6 and the guest/host crystal (CH3NH3)2[KFe(CN)6]. The activation energies of the dielectric relaxation have been estimated to be equal to 44 and 40 kJ mol−1 for (CH3NH3)2[KFe(CN)6] and K3Fe(CN)6, respectively. The mechanism of the phase transitions found at 425 K and 421 K for (CH3NH3)2[KFe(CN)6] and (CH3NH3)2[KCo(CN)6], respectively, has been postulated. From the dielectric losses the value of the electric ac conductivity has been estimated and analyzed in terms of the activation process of the current carriers.
Introduction
The family of cyano-bridged coordination polymers (CPs), which undergo transitions between the high and low dielectric states upon a thermal stimulus, are promising materials with potential application in electrical and electronics devices.1,2 A good example of such materials is crystals with the perovskite-type structure, where the organic–inorganic hybrids with the general formula RMX3 (where R – an organic cation, M – a metal, X – a halogen atom) have the same crystal structure as perovskite, MTiO3 (M = Sr, Ca, Ba).3 The best known compound from this group is methylammonium iodoleadate (MAPbI3), which when applied in photovoltaic systems shows an extraordinarily large efficiency of solar light to electric energy conversion, even exceeding that of the silicon or mixed inorganic semiconductor systems.1–7 The carefully designed cage compounds with organic guest molecules as cations may give materials where solid-to-solid phase transitions of different nature, like the order–disorder or displacive one, can be observed. However, it should be noted that the guests should have relatively small dimensions and a spherical form and be endowed with a dipole moment in order to observe the dynamical effects. Moreover, the switchable guest cations in the well-matched anionic host framework should possess a relatively large freedom for rotation, i.e. they should have the ability to jump between at least two energetically equivalent positions. The reorientation of the polar guest may result in the switch of the related physical properties, for example, dielectric constant, non-linear optics, magnetic susceptibility and electric polarization.8,9 Such a switchable dielectric system, where the crystal structure is formed by periodical arrangement both of the rigid and mobile components was defined by Garcia-Gariabay as amphidynamic crystals, where the prefix “amphi” means both sides. It may be understood that the liquid and solid properties, i.e. molecular freedom and rigidity/periodicity, are combined together.10 The cyano-bridged coordination polymers (CPs) are classified as the elpasolite family11 a typical structural feature of which is the presence of octahedral groups, as shown in Scheme 1.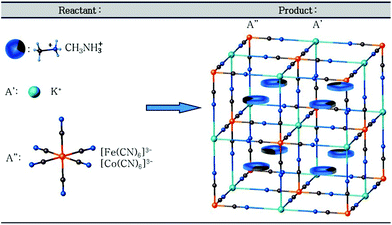 | ||
| Scheme 1 Schematic procedure of the self-assembly of CPs crystals in three-dimensional packed cages. | ||
These materials have a double perovskite-type structure. The cage framework is formed with the general formula: [A′A′′(CN)6] (A′ – monovalent metal, K+, and A′′ – trivalent metal, Fe3+/Co3+) and the cationic organic guest, which resides in the cage. They represent another promising class of materials with structural phase transitions.12–19 Depending on the chemical composition of CPs the crystals can undergo transitions between the high and low dielectric states. It was found that the mechanism of this phase transition is related undoubtedly to a change in the dynamics of cations and to a deformation of the inorganic sublattice.
Recently, CP crystals derived from K3Fe(CN)6 with the methylammonium cation as a guest molecule have been investigated.12 The electric studies concerned, however, exclusively a polycrystalline form of the compound. Encouraged by these pioneering studies we would like to report the determination of dielectric parameters for single crystals of (CH3NH3)2[KFe(CN)6] (1) and an isostructural compound with iron replaced by cobalt, (CH3NH3)2[KCo(CN)6] (2). The other important purpose of our studies was the determination of the cationic dynamical parameters. These parameters can be obtained on the basis of the dielectric relaxation measurements. The detailed analysis of the X-ray structural properties leads to a discovery of the correlation between their microscopic structures and the dielectric and optical properties of their single crystals.
Results and discussion
Single-crystal X-ray diffraction studies have been carried out for (CH3NH3)2[KCo(CN)6] (1) at 100 and 443 K. Crystallographic data and structural refinements for 1 and 2 are summarized in Table 1S (ESI†). This compound and (CH3NH3)2[KFe(CN)6] (2)12 appeared to be isomorphic and crystallize in the monoclinic space group, C2/c, in the low-temperature phase (LT). The crystals, 1 and 2, undergo, during heating, solid-to-solid reversible phase transitions at 421 and 424 K, respectively. The transition from the low-temperature to high-temperature state is accompanied by a change of the space group from the monoclinic C2/c to cubic Fm![[3 with combining macron]](https://www.rsc.org/images/entities/char_0033_0304.gif) m and the number of symmetry elements of the crystallographic point group increases from 4 (E, C2, i, σh) to 48 (E, 8C3, 3C2, 6C2, 6C4, i, 8S6, 3σh, 6σd, 6S4). The asymmetric part of the structures and the shape of the cage structure, in LT and HT phases, are presented in Fig. 1 and 2, respectively.
m and the number of symmetry elements of the crystallographic point group increases from 4 (E, C2, i, σh) to 48 (E, 8C3, 3C2, 6C2, 6C4, i, 8S6, 3σh, 6σd, 6S4). The asymmetric part of the structures and the shape of the cage structure, in LT and HT phases, are presented in Fig. 1 and 2, respectively.
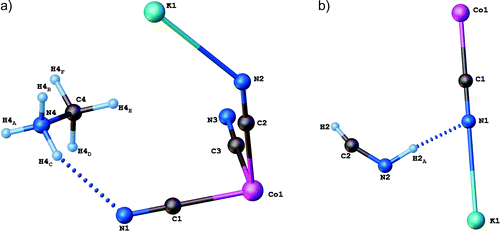 | ||
| Fig. 1 Independent part of the (CH3NH3)2[KCo(CN)6]: (a) low-temperature (LT) and (b) high-temperature (HT) phases. | ||
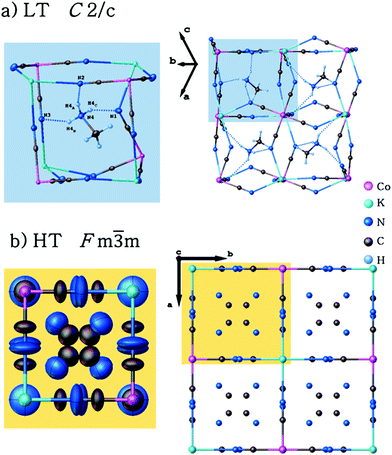 | ||
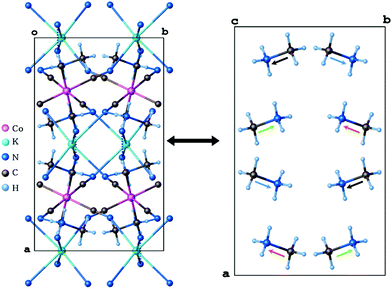
| Fig. 2 Structures for LT and HT phases of (CH3NH3)2[KCo(CN)6]. The disordered organic cations and the host framework are presented by ellipsoids. | ||
In both phases an anionic framework is formed by Co–C![[triple bond, length as m-dash]](https://www.rsc.org/images/entities/char_e002.gif) N–K units, in which the CH3NH3+ cations are placed. Each K+ and Co3+ ion is joined by six cyano groups (CN−) and, in consequence, a three-dimensional cage is created. According to Table 2Sa and 2Sb (see ESI†), in the LT phase the cobalt–cyanide bonds within Co(CN)63− moieties are strong and covalent, while the K–N bonds are rather of ionic nature. The Co3+ ion adopts a symmetric octahedral configuration (Co–C equal to 1.8987(17), 1.9008(17) and 1.9074(18) Å for Co(1)–C(1), Co(1)–C(2) and Co(1)–C(3), respectively), although K+ is surrounded by six nitrogen atoms with significantly different lengths of bonds (2.8181(16), 2.8534(14) and 2.8847(15) Å for K(1)–N(1), K(1)–N(2) and K(1)–N(3), respectively). The angles between cyano groups and potassium cations ∠CNK are also different (132.02(13), 138.97(12), 152.85(13)°). This means that the anionic cage-like framework is distorted. This deformation results from the strong interactions between the guest molecules and the framework. Based on Table 3S,† three strong hydrogen N–H⋯N bonds between methylammonium cations and cyanide anions are formed: N(4)–H(4A)⋯N(2)1 (2.933(2) Å, 155(2)°), N(4)–H(4B)⋯N(3)2 (3.092(2) Å, 140.6(15)°) and N(4)–H(4C)⋯N(1) (2.911(2) Å, 154(2)°).
N–K units, in which the CH3NH3+ cations are placed. Each K+ and Co3+ ion is joined by six cyano groups (CN−) and, in consequence, a three-dimensional cage is created. According to Table 2Sa and 2Sb (see ESI†), in the LT phase the cobalt–cyanide bonds within Co(CN)63− moieties are strong and covalent, while the K–N bonds are rather of ionic nature. The Co3+ ion adopts a symmetric octahedral configuration (Co–C equal to 1.8987(17), 1.9008(17) and 1.9074(18) Å for Co(1)–C(1), Co(1)–C(2) and Co(1)–C(3), respectively), although K+ is surrounded by six nitrogen atoms with significantly different lengths of bonds (2.8181(16), 2.8534(14) and 2.8847(15) Å for K(1)–N(1), K(1)–N(2) and K(1)–N(3), respectively). The angles between cyano groups and potassium cations ∠CNK are also different (132.02(13), 138.97(12), 152.85(13)°). This means that the anionic cage-like framework is distorted. This deformation results from the strong interactions between the guest molecules and the framework. Based on Table 3S,† three strong hydrogen N–H⋯N bonds between methylammonium cations and cyanide anions are formed: N(4)–H(4A)⋯N(2)1 (2.933(2) Å, 155(2)°), N(4)–H(4B)⋯N(3)2 (3.092(2) Å, 140.6(15)°) and N(4)–H(4C)⋯N(1) (2.911(2) Å, 154(2)°).
In the vicinity of the phase transition the differences in crystal structure are reflected in the geometries of the host-framework and the organic guest. At 100 K, in the monoclinic space group, the edges of the cage (Co⋯K) are in the range of 5.8704–5.9461 Å and angles of the inorganic framework (∠CoKCo) are between 97.76 and 92.06°. In the cubic phase the cage's edges are becoming a little shorter and equal to each other (5.694 Å), the angles ∠CoKCo become equal to 90°. The length of the N⋯K bonds changed from ∼2.9 Å to 2.716 Å.
These data proved that the displacement of the K+ cation and cyanide anions and hence the ionic nature of the K⋯N bonds are the main reason for the contraction of the crystal lattice upon heating. In the LT phase, the organic guest-cations are totally frozen and distinguishable. However, the relatively large atomic displacement parameters indicate the existence of a certain degree of static disorder. In the unit cell, eight (CH3NH3+) cations are present having four orientations of dipole moments in mutually opposite directions (see Fig. 3). In the host-framework, also the CN− bridges are ordered in the low-temperature phase, whereas in the high-temperature phase the cyanide anions are disordered over four sites (see Fig. 2). Contrarily, in the HT phase the guest's cations are highly disordered over 12 sites by the imposed cubic symmetry.
The thermal stability of the examined crystals was studied by means of a simultaneous thermogravimetric analysis (TGA) and differential thermal analysis (DTA) between 300 and 900 K. On the DTA curves two strong endothermic peaks have been found both for 1 and 2 crystals (Fig. 1Sa and b†): the sharp peak at 420 K and the broad one at ca. ∼500 K. The former peak in both compounds is not accompanied by any change in the sample's initial mass and is attributed to the solid-to-solid phase transition at 421 and 424 K (heating) for 1 and 2, respectively. These peaks were also observed by DSC measurements (Fig. 4). The latter anomaly in TGA/DTA corresponds to the melting and complete decomposition of the crystals. Based on the TGA/DTA results, we can state that in the temperature range in which the DSC and electric permittivity have been measured, the loss of the sample mass was inconsiderable. Moreover, this means that we may assume that the sample was also stable in the dielectric measurements up to 465 K.
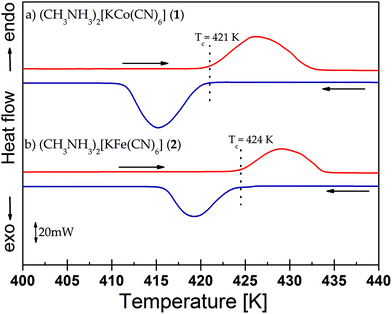 | ||
| Fig. 4 DSC curves for (a) (CH3NH3)2[KCo(CN)6] (1) and (b) (CH3NH3)2[KFe(CN)6] (2) crystals. Arrows show the directions of runs (cooling or heating). | ||
Table 4S† contains the thermodynamic information about the phase transition for the crystals, both 1 and 2. The shape of the thermal anomaly and the presence of the temperature hysteresis in the DSC curves (ΔT = 4 K) clearly indicate the discontinuous character (first order) of the transition from the orientationally ordered (LT) to a disordered (HT) phase. The observation of a phase front in the images obtained using the polarized light microscope (Fig. 5) and the values of thermodynamic functions (Table 4S†) prove the first order character of the structural phase transition at 421 and 424 K of the crystals (1) and (2). In the case of these crystals, strong deformation was observed. Therefore, invertibility of the transition was difficult to observe. Nevertheless, the thermal results and electric response measured upon heating and cooling cycles proved that deformation occurred rather on the surface than in the entire volume of the crystals. For pure K3Fe(CN)6 and K3Co(CN)6 host-crystals no phase transitions have been found.
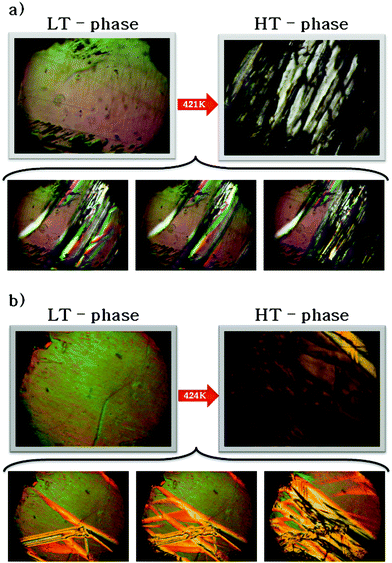 | ||
Fig. 5 The phase front observed during the phase transitions upon heating cycle: (a) (CH3NH3)2[KCo(CN)6] (1) and (b) (CH3NH3)2[KFe(CN)6] (2). The projection is along the [10![[1 with combining macron]](https://www.rsc.org/images/entities/char_0031_0304.gif) ] direction. ] direction. | ||
Based on information from the literature and the results obtained in this work for the CP perovskite-like crystals exhibiting structural phase transitions, the dynamics of organic guest-cations plays a crucial role in their mechanisms. The mechanism of the phase transition can be defined as the order–disorder type. According to crystallographic data in the HT phase the guest molecule showed the dynamical disorder with the 12 equivalent positions; however, it should be noted that from the X-ray data it cannot be deduced if the disorder is statistical or dynamical. On the other hand, the dynamical nature of the molecular disorder may be deduced on the basis of a thermal analysis (DSC). The Boltzmann equation, ΔS ∼ R![[thin space (1/6-em)]](https://www.rsc.org/images/entities/char_2009.gif) ln(N), where R is a gas constant and N is the ratio of the number of equivalent orientations in the HT phase, gives, in the case of the perovskite cages with the methylammonium cations as the guests, an N value equal to 12 (see Table 4S,†N = 14.7 and 15.1 for 1 and 2, respectively). The obtained N value, greater than 12, may suggest that not only a change in the cationic but also in anionic dynamics should be taken into consideration. The general conclusion, with regard to the crystal structures, is that the phase transition behavior in crystals 1 and 2 is modulated by the match of the encapsulated guest cations and the host frameworks.
ln(N), where R is a gas constant and N is the ratio of the number of equivalent orientations in the HT phase, gives, in the case of the perovskite cages with the methylammonium cations as the guests, an N value equal to 12 (see Table 4S,†N = 14.7 and 15.1 for 1 and 2, respectively). The obtained N value, greater than 12, may suggest that not only a change in the cationic but also in anionic dynamics should be taken into consideration. The general conclusion, with regard to the crystal structures, is that the phase transition behavior in crystals 1 and 2 is modulated by the match of the encapsulated guest cations and the host frameworks.
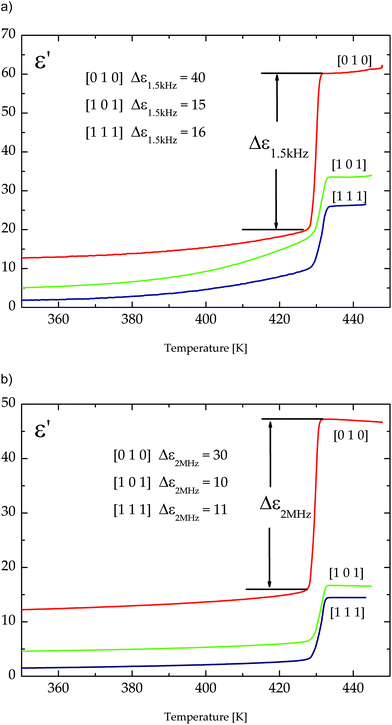
The cationic/anionic disorder should affect the dielectric response of the crystals. Therefore, the main purpose of this work was to carry out the electric measurements of single crystals (1 and 2) and the pure hosts as a function of temperature and frequency. Fig. 6 presents the dielectric response of (CH3NH3)2[KCo(CN)6] (1) measured along different crystallographic directions. The first observation was that the relative permittivity of (1) is anisotropic, which means a strong dependence of ε′ on the direction of the applied field. The highest value of ε′ is observed along the crystallographic [010] axis (red line in Fig. 6a and b). For directions other than [010], the electric permittivity is smaller, but the change at the phase transition temperature is still significant. The increment, Δε, measured at 1.5 kHz and 2 MHz almost equals 40 and 30, respectively.
As is presented in Fig. 6, in the vicinity of 420 K the high temperature transition is accompanied by a single jump of the dielectric constants. This observation is similar for both organic–inorganic hybrids (Fig. 7 and 8). Fig. 2S and 3S† present the dielectric permittivity measured for pure hosts K3Co(CN)6 and K3Fe(CN)6.
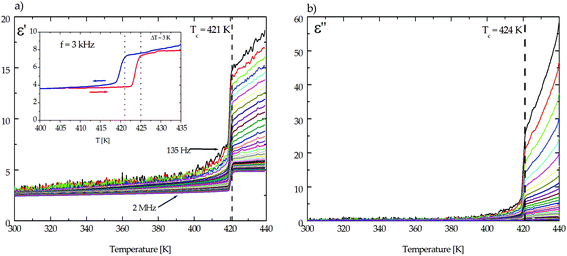 | ||
| Fig. 7 The temperature dependence of (a) the real part, ε′, and (b) the imaginary part, ε′′, of the electric permittivity for the (CH3NH3)2[KCo(CN)6] (1) complex along the [1 0 1] direction. | ||
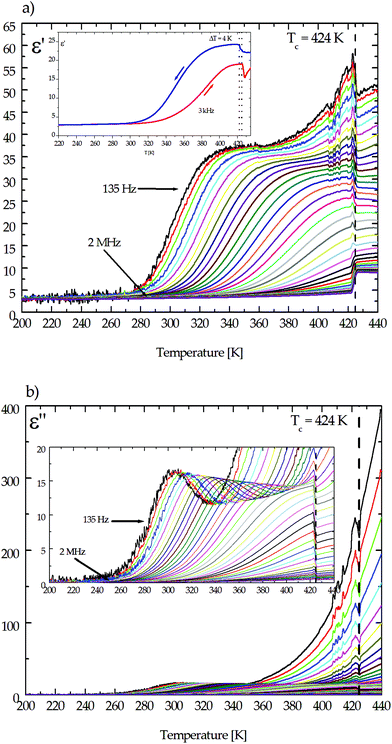 | ||
Fig. 8 The temperature dependence of (a) the real part, ε′, and (b) the imaginary part, ε′′, of the electric permittivity for the (CH3NH3)2[KFe(CN)6] (2) complex along the [10![[1 with combining macron]](https://www.rsc.org/images/entities/char_0031_0304.gif) ] direction. ] direction. | ||
In the LT as well as HT phases no dielectric relaxation process has been found for crystal 1. But a large contribution of the ac conductivity, especially in the HT state in the frequency range between 135 Hz and 1 kHz, is visible. This means that in this temperature range the relaxation process is retarded, probably because of the rigidity of the crystalline lattice. For both crystals (1 and 2), the measurements were scrutinized on cooling and heating and the corresponding runs are reversible (see the inset in Fig. 7a and 8a), while for crystals of (CH3NH3)2[KFe(CN)6] (2), the dispersion of electric permittivity appears in the range of frequencies between 135 Hz and 2 MHz over the temperature interval from 280 K up to the phase transition temperature (Tc = 424 K). It should be emphasized that the dielectric relaxation was also observed for pure host crystals of K3Fe(CN)6 (see Fig. 3Sa and b†).
In order to illustrate the dielectric relaxation process, in this crystal, the frequency dependencies of the real and imaginary parts of the electric permittivity (ε* = ε′ − iε′′) in the temperature range are presented in Fig. 9a and b. This is the temperature range where the dielectric dispersion and absorption are significant. In the LT phase the maxima of the absorption slightly decrease in value and move with temperature towards high frequencies (see Fig. 9b). In the whole temperature range our analysis proves that dielectric absorption can be described by a four-parameter Cole–Cole function:19
 | (1) |
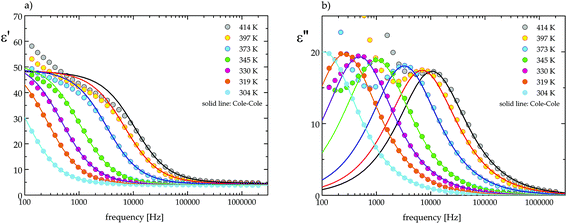 | ||
| Fig. 9 The frequency dependence of (a) the real part, ε′, and (b) the imaginary part, ε′′, of permittivity at several temperatures for (CH3NH3)2[KFe(CN)6] (2). | ||
On the basis of eqn (1) the macroscopic relaxation time was estimated by fitting the calculated real and imaginary parts of the electric permittivity to the experimental data in the frequency range between 135 Hz and 2 MHz. From Fig. 10 it may be concluded that the temperature behavior of the relaxation times obeys the Arrhenius equation, τ = τ0![[thin space (1/6-em)]](https://www.rsc.org/images/entities/char_2009.gif) exp(EA/kT), where τ0 is the high temperature limit of the relaxation time and EA – an activation energy for the dielectric relaxation process. Based on this equation, the activation energy for (2) equals 44 ± 4 [kJ mol−1]. The Argand's diagrams for selected temperatures are presented in Fig. 11, from which it is clear that the plots are close to the Debye semi-circles. The distribution of the relaxation times is almost constant for all the applied temperatures and the α parameter varies between 0.18 and 0.12, which may suggest that the distribution of the relaxation times within the orientationally ordered (LT) phase is very narrow and the dielectric relaxation observed indicates practically monodispersive nature.
exp(EA/kT), where τ0 is the high temperature limit of the relaxation time and EA – an activation energy for the dielectric relaxation process. Based on this equation, the activation energy for (2) equals 44 ± 4 [kJ mol−1]. The Argand's diagrams for selected temperatures are presented in Fig. 11, from which it is clear that the plots are close to the Debye semi-circles. The distribution of the relaxation times is almost constant for all the applied temperatures and the α parameter varies between 0.18 and 0.12, which may suggest that the distribution of the relaxation times within the orientationally ordered (LT) phase is very narrow and the dielectric relaxation observed indicates practically monodispersive nature.
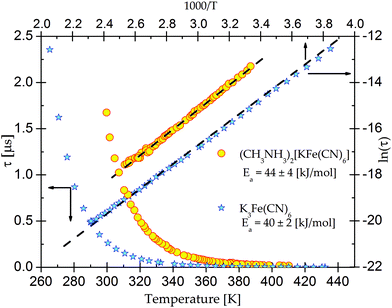 | ||
| Fig. 10 The temperature dependence of the macroscopic dielectric relaxation time for (CH3NH3)2[KFe(CN)6] (2) and pure K3Fe(CN)6. | ||
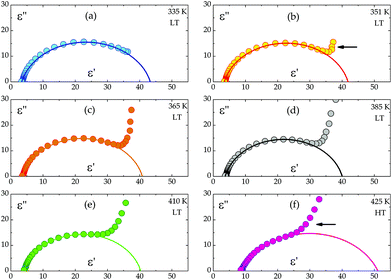 | ||
| Fig. 11 The dependence of ε′′ versus ε′ for single crystals of the (CH3NH3)2[KFe(CN)6] (2) complex. The solid line represents a fit to the Cole–Cole equation (eqn (1)). | ||
Another interesting feature of the Argand's diagrams is the low-frequency tail, which can be observed above ca. 351 K (Fig. 11b). In the low frequency range, the increase in the dielectric permittivity is, in our opinion, combined with the ac conductivity, σac, of the sample.
This is our first study on the conductivity in perovskite-type CPs and our purpose is to scrutinize the ac conductivity in order to describe the expected semiconductor properties of this compound. The contribution of ac conductivity increases with temperature and dominates in the dielectric response of the HT phase (Fig. 11e).
The ac conductivity at different frequencies and temperatures was determined from the dielectric absorption data. The conductivity dispersion phenomenon in solids can be analysed based on Jonscher's law:20
| σtotalac = ε0ε′′totalω = σdc + Aωn + ε0ε′′totalω, [S m−1] | (2) |
The frequency dependence of the ac conductivity in the log–log scale is depicted in Fig. 12. For crystals with the semiconductor properties the ac contribution (Aωn) is observed as a straight line with a slope equal to n. The n values were estimated by using eqn (2) for the frequency interval between 135 Hz and 1000 Hz, although the purpose of our analysis was not fitting all parameters in Jonscher's equation, but only estimation of the dominant phenomenon affecting the electric response. The n coefficient represents the degree of interaction of mobile ions/electrons. It is known that the conductive mechanism can be understood from the temperature and frequency dependency of n. In order to ascertain the way of conducting in the material, various models have been proposed.21 If the exponent n is temperature independent but frequency dependent, then the quantum mechanical tunnelling (QMT) model should be taken in account.22–25 If the n value is both temperature and frequency dependent and a strong increase in ac conductivity with increasing temperature is observed, then the migration of carriers should be described by the overlapping large-polaron tunnelling (OLPT) model.26 The variation of the exponent n as a function of temperature is presented in the inset in Fig. 12. The character of the n coefficient variations suggests that the observed ac conductivity can be explained by the correlated barrier hopping (CBH) model. This model was initially developed by Pike27 for single-electron hopping and extended to two electrons by Elliot.28,29 According to this model the charge transport is between two localized states due to a hopping over potential barriers and the exponent n should decrease with increasing temperature.
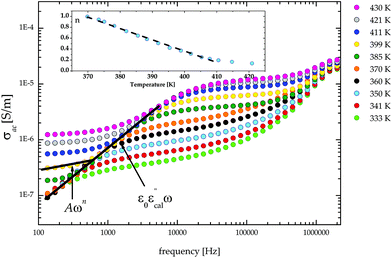 | ||
| Fig. 12 The plot of σacversus frequency for (CH3NH3)2[KFe(CN)6] (2) in the log–log scale. Insert: The temperature dependence of the n parameter for the frequency range 135–1000 Hz. | ||
Conclusions
The aim of our studies was to describe the crystal structure and analyse the dielectric response of the single crystals (CH3NH3)2[KFe(CN)6] (1) and (CH3NH3)2[KCo(CN)6] (2) and explain the crystal dynamics as well as propose models for the organic cation motions in the guest–host crystal lattice. These novel hybrids are composed of the inorganic [M(CN)6]3− (M = Fe3+, Co3+) part and the organic cation of the methylamine (CH3NH3+). The architecture of the structure remains a cage compound, where the host-framework is constituted by the inorganic Fe/Co–C–N–K units and the organic cations reside in the guest position. The bonds in the octahedral units Fe/Co–CN are strong, covalent and ionic ones in the fragment of K+–NC. The assembled structure resembles the double perovskite-type, named also cyano-elpasolite with general formula A2[B′B′′(CN)6], where A is organic cation, B′ is monovalent and B′′ is trivalent metal.In order to have a better understanding of the dielectric behaviour of the tuneable compounds, the frequency and temperature dependencies of the dielectric properties of cyano-bridge CPs were investigated in the frequency range between 135 Hz and 2 MHz. Most crystals of the elpasolite family undergo phase transitions from the high-symmetry cubic phase to various distorted low symmetry phases.30,31 In crystals 1 and 2 the structural phase transitions have been found at 421 and 424 K (on heating), respectively, by using thermodynamic methods. During the transition, a change of the space group from C2/c to Fm![[3 with combining macron]](https://www.rsc.org/images/entities/char_0033_0304.gif) m is observed. The phase transitions found are of the first order. No phase transitions have been found in the case of pure host-framework crystals. Thermal analysis revealed the order–disorder feature of the solid-to-solid transition. Therefore, the mechanism of the phase transition (at 421 K for 1 and at 424 K for 2) is consistent with the crystal structure determined in the HT phase using the X-ray method. In the crystal structure determined for both 1 and 2 the 12 equivalent positions (N) for two formal methylammonium cations in a mole of the compound have to be assumed. The large value of entropy and, by extension, the number N suggest also the contribution of the inorganic framework dynamics to the transition. Therefore, we have carried out the dielectric measurements for the pure cage crystals, K3Fe(CN)6 and K3Co(CN)6 as well, in order to determine their contribution to crystal dynamics observed in the dielectric response of the guest–host crystals of 1 and 2 (see Fig. S2 and S3†). In the case of crystals (2) with Fe3+ the dielectric relaxation process was observed for both pure-host and guest–host systems. Fig. 4S† depicts the comparison of the real and imaginary parts of the permittivity versus temperature at a frequency of 1 kHz. The dielectric relaxation, as can be seen from Fig. 4S,† begins at 280 K for the pure host and at 340 K for (2), so the relatively slow reorientations of the organic cations and probably inorganic anions are revealed already in the LT phase. The shift of the temperature by 60 degrees of the guest–host crystals with respect to the pure host ones is probably due to the interaction through two strong hydrogen bonds between the organic-guest cations and nitrogen atoms from cyanide groups of the cage framework. The parameters of the Cole–Cole equation were fitted to the experimental data for both the compounds, pure K3Fe(CN)6 and (2). The estimated activation energies differ insignificantly, 40 kJ mol−1 (0.415 eV) and 44 kJ mol−1 (0.456 eV) for pure-host and 2, respectively (see Fig. 10). The small increase in the energy value in the case of the guest–host crystal points to the possible impact of the organic cations on the inorganic sublattice dynamics. It should be emphasized that the above described dielectric relaxation has not been observed for crystals 1 (with Co atoms instead of Fe). This observation is related to both the pure-host and host-framework crystals. According to the crystal data both pure host K3Co(CN)6 and K3Fe(CN)6 crystals display polytypism and the existence of 1M, 3M, 7M (one-, three-, seven-layer monoclinic) and 2Or, 4Or (two-, four-layer orthorhombic) phases was reported.32–34 Generally, we can conclude that the increase in nuclear charge of the central atom in the series Mn–Fe–Co causes a decrease in the ligand–metal bond lengths and, in consequence, an increase in bond strength. This was also proven by the rise of the M(Mn, Fe, Co)–C infrared frequencies for the hexacyanides on going from Mn(III) to Co(III), which also proves the increase in bond strength.34 Also, in this series, there is a decrease in the lengths corresponding to the K⋯N bonds. This can explain why the relaxation processes could not be observed in the case of crystals with Co as a central metal. Additionally, the observation of only one doublet in the 57Fe Mössbauer spectrum proved that in the (K3Fe(CN)6) crystal, in both the phases monoclinic and orthorhombic, only one crystallographically equivalent position exists for the iron atoms.35 Therefore, we can connect the dielectric relaxation with the movement of K+ ions either in the host framework or the guest–host crystal. Taking into account the dielectric results obtained for temperatures around the phase transitions it should be noted that the dielectric dispersion and absorption observed in the low temperature phase in the case of the Fe (2) crystals has to be assigned exclusively to the pure cage. However, in both types of crystals (1, 2) on heating we have observed a jump-like increase in the electric permittivity (the real part) at phase transitions, particularly at high frequencies. In accordance with the structural changes postulated from the X-ray data this increase is related to the release of the organic cation rotations. Most likely the movements of cations in the electric field are quite fast and the dielectric relaxation should be observed at higher frequencies than those applied in our experiments (f > 2 MHz).
m is observed. The phase transitions found are of the first order. No phase transitions have been found in the case of pure host-framework crystals. Thermal analysis revealed the order–disorder feature of the solid-to-solid transition. Therefore, the mechanism of the phase transition (at 421 K for 1 and at 424 K for 2) is consistent with the crystal structure determined in the HT phase using the X-ray method. In the crystal structure determined for both 1 and 2 the 12 equivalent positions (N) for two formal methylammonium cations in a mole of the compound have to be assumed. The large value of entropy and, by extension, the number N suggest also the contribution of the inorganic framework dynamics to the transition. Therefore, we have carried out the dielectric measurements for the pure cage crystals, K3Fe(CN)6 and K3Co(CN)6 as well, in order to determine their contribution to crystal dynamics observed in the dielectric response of the guest–host crystals of 1 and 2 (see Fig. S2 and S3†). In the case of crystals (2) with Fe3+ the dielectric relaxation process was observed for both pure-host and guest–host systems. Fig. 4S† depicts the comparison of the real and imaginary parts of the permittivity versus temperature at a frequency of 1 kHz. The dielectric relaxation, as can be seen from Fig. 4S,† begins at 280 K for the pure host and at 340 K for (2), so the relatively slow reorientations of the organic cations and probably inorganic anions are revealed already in the LT phase. The shift of the temperature by 60 degrees of the guest–host crystals with respect to the pure host ones is probably due to the interaction through two strong hydrogen bonds between the organic-guest cations and nitrogen atoms from cyanide groups of the cage framework. The parameters of the Cole–Cole equation were fitted to the experimental data for both the compounds, pure K3Fe(CN)6 and (2). The estimated activation energies differ insignificantly, 40 kJ mol−1 (0.415 eV) and 44 kJ mol−1 (0.456 eV) for pure-host and 2, respectively (see Fig. 10). The small increase in the energy value in the case of the guest–host crystal points to the possible impact of the organic cations on the inorganic sublattice dynamics. It should be emphasized that the above described dielectric relaxation has not been observed for crystals 1 (with Co atoms instead of Fe). This observation is related to both the pure-host and host-framework crystals. According to the crystal data both pure host K3Co(CN)6 and K3Fe(CN)6 crystals display polytypism and the existence of 1M, 3M, 7M (one-, three-, seven-layer monoclinic) and 2Or, 4Or (two-, four-layer orthorhombic) phases was reported.32–34 Generally, we can conclude that the increase in nuclear charge of the central atom in the series Mn–Fe–Co causes a decrease in the ligand–metal bond lengths and, in consequence, an increase in bond strength. This was also proven by the rise of the M(Mn, Fe, Co)–C infrared frequencies for the hexacyanides on going from Mn(III) to Co(III), which also proves the increase in bond strength.34 Also, in this series, there is a decrease in the lengths corresponding to the K⋯N bonds. This can explain why the relaxation processes could not be observed in the case of crystals with Co as a central metal. Additionally, the observation of only one doublet in the 57Fe Mössbauer spectrum proved that in the (K3Fe(CN)6) crystal, in both the phases monoclinic and orthorhombic, only one crystallographically equivalent position exists for the iron atoms.35 Therefore, we can connect the dielectric relaxation with the movement of K+ ions either in the host framework or the guest–host crystal. Taking into account the dielectric results obtained for temperatures around the phase transitions it should be noted that the dielectric dispersion and absorption observed in the low temperature phase in the case of the Fe (2) crystals has to be assigned exclusively to the pure cage. However, in both types of crystals (1, 2) on heating we have observed a jump-like increase in the electric permittivity (the real part) at phase transitions, particularly at high frequencies. In accordance with the structural changes postulated from the X-ray data this increase is related to the release of the organic cation rotations. Most likely the movements of cations in the electric field are quite fast and the dielectric relaxation should be observed at higher frequencies than those applied in our experiments (f > 2 MHz).
It should be noted that at low frequencies in the dielectric results of K3Fe(CN)6 and 2 the contribution of the frequency dependent ac conductivity, σac, has been found (Fig. 12). This effect is most probably related to the electron-ionic conductivity of the cage structure. This is supported by the similar effect of the conductivity contribution in the dielectric results observed both for the guest–host crystals and for the pure cage, particularly at low frequencies. Fig. 13 illustrates the temperature dependence of ac conductivity at a frequency equal to 135 Hz. It is very clear that an addition of the organic cations affects the order of magnitude of ac conductivity. The activation energies, calculated from the Arrhenius relationship, are found to be equal to 22 [kJ mol−1] (0.22 eV) for 2 and 24 [kJ mol−1] (0.25 eV) for a pure-host, respectively. It is worth noting that the activation energies for the relaxation process are twice as large as that obtained for σac. This suggests that different phenomena are responsible for the relaxation and conduction processes.
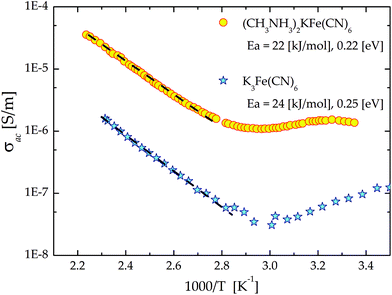 | ||
| Fig. 13 Temperature dependence of ac conductivity (in the log scale) at one frequency (f = 1 kHz) for (2) and the pure host K3Fe(CN)6. The dashed lines are the linear fit. | ||
On the basis of the observations under a polarizing microscope one can state that the structural phase transition has martensitic character in both crystals. On heating the single crystals, the nucleation of the new (low temperature) phase appears at different places of the crystals. This conclusion was also drawn on the basis of the results recently presented by Piecha-Bisiorek et al.8, where the martensitic transition of the non-metallic sample was claimed. The detailed description of the phase transition mechanisms in this type of crystal on the basis of both the crystallographic data and the images of TEM microscopy we are going to present in the near future.
The crystals show anisotropy of the dielectric properties (see Fig. 6a and b), which is surely connected with the relatively low symmetry of the crystal (C2/c). The largest value of the real part of the electric permittivity has been observed along the b-axis. The dimensions of the single crystals obtained for 2 were too small to confirm the dielectric anisotropy for this compound. Nevertheless, taking into account the isomorphism of the crystals 1 and 2 and their structural phase transitions found at similar temperatures, one can assume similar dynamics in both crystals. Finally, one can state that the embedding of the guest molecule (here the methylammonium cation) modifies both the crystal structure of the cage and their dielectric response. The greatest changes were observed along the b axis, where the dipole moment projection of the organic guest is the largest. The contribution of the organic cations to the dielectric response in crystals 1 and 2 occurs only in the high temperature phase.
Experimental
Sample preparation
Single crystals of the methylammonium derivatives (CH3NH3)2[KCo(CN)6] (1) and (CH3NH3)2[KFe(CN)6] (2) were prepared by a reaction of methylamine hydrochloride (Sigma, ≥98%) with K3Fe(CN)6 (Sigma-Aldrich, ACS reagent, ≥99.0%) and K3Co(CN)6 (Sigma-Aldrich, ≥97.0%) in a molar ratio of 3![[thin space (1/6-em)]](https://www.rsc.org/images/entities/char_2009.gif) :
:![[thin space (1/6-em)]](https://www.rsc.org/images/entities/char_2009.gif) 1. In the case of (1), 0.012 mol of K3Co(CN)6 and 0.036 mol of CH3NH3Cl were dissolved in distilled water (∼50 ml), and for crystal (2) 0.012 mol of K3Fe(CN)6 was added to 0.032 mol of CH3NH3Cl in an aqua solution (∼50 ml). After a few days pale yellow crystals of (1) and deep red crystals of (2) were obtained, and the yield of the synthesis was ca. 70%. The crystalline product was then only once recrystallized from deionized water, because in the case of the crystal with Fe, multiple crystallization causes the formation of Prussian Blue. The dimensions of the single crystals chosen for either crystallographic or dielectric measurements were of course different and suitable for a particular method. The purity of the compounds was confirmed by an elemental analysis. The mass percentages were for (CH3NH2)2[KFe(CN)6]: N 35.01% (35.6%); C 30.1% (30.5%); H 3.6% (3.8%), and for (CH3NH3)2[KCo(CN)6]: N 34.9% (35.2%); C 30.02% (30.2%); H 3.5% (3.8%). The values in brackets are theoretical.
1. In the case of (1), 0.012 mol of K3Co(CN)6 and 0.036 mol of CH3NH3Cl were dissolved in distilled water (∼50 ml), and for crystal (2) 0.012 mol of K3Fe(CN)6 was added to 0.032 mol of CH3NH3Cl in an aqua solution (∼50 ml). After a few days pale yellow crystals of (1) and deep red crystals of (2) were obtained, and the yield of the synthesis was ca. 70%. The crystalline product was then only once recrystallized from deionized water, because in the case of the crystal with Fe, multiple crystallization causes the formation of Prussian Blue. The dimensions of the single crystals chosen for either crystallographic or dielectric measurements were of course different and suitable for a particular method. The purity of the compounds was confirmed by an elemental analysis. The mass percentages were for (CH3NH2)2[KFe(CN)6]: N 35.01% (35.6%); C 30.1% (30.5%); H 3.6% (3.8%), and for (CH3NH3)2[KCo(CN)6]: N 34.9% (35.2%); C 30.02% (30.2%); H 3.5% (3.8%). The values in brackets are theoretical.
Thermal analysis
Differential scanning calorimetry (DSC) spectra were recorded with a PerkinElmer DSC 8500 in the temperature range between 298 and 450 K with a ramp rate of 20 K min−1. The TGA and DTA measurements were performed using a Setaram SETSYS 16/18 instrument between 290 and 700 K with a ramp rate of 5 K min−1. The scan was performed in flowing nitrogen (flow rate: 1 dm3 h−1).Dielectric measurements
The complex dielectric permittivity, ε* = ε′ − iε′′, was measured by using an Agilent 4284A Precision LCR Meter in the frequency range between 100 Hz and 2 MHz and in the temperature range between 100 and 450 K with a scan rate of 4 K min−1 (on heating and cooling). In order to obtain the electric permittivity anisotropy the crystal (1) was measured in three crystallographically oriented directions: [010], [101] and [111]. The geometry of the sample was as follows: [010] S = 4 mm2, d = 0.84 mm, [10![[1 with combining macron]](https://www.rsc.org/images/entities/char_0031_0304.gif) ] S = 8 mm2, d = 1.34 mm and [111] S = 4 mm2, d = 1.54 mm. In this part of the measurements silver-paste was used as the electrode. The crystal (2) was measured in one direction [10
] S = 8 mm2, d = 1.34 mm and [111] S = 4 mm2, d = 1.54 mm. In this part of the measurements silver-paste was used as the electrode. The crystal (2) was measured in one direction [10![[1 with combining macron]](https://www.rsc.org/images/entities/char_0031_0304.gif) ], and the dimension of the sample was S = 15 mm2, d = 1.0 mm. Electric properties of two pure host inorganic frameworks K3Co(CN)6 and K3Fe(CN)6 were scrutinized in the direction [10
], and the dimension of the sample was S = 15 mm2, d = 1.0 mm. Electric properties of two pure host inorganic frameworks K3Co(CN)6 and K3Fe(CN)6 were scrutinized in the direction [10![[1 with combining macron]](https://www.rsc.org/images/entities/char_0031_0304.gif) ], and the dimensions of the samples were equal to S = 15.5 mm2, d = 0.6 mm and S = 8 mm2, d = 1.33 mm, respectively. The copper-foil measuring electrodes were affixed to the prepared crystals. The overall error in the estimation of the real and imaginary parts of the complex electric permittivity was about 5%. The activation energies of relaxation processes were estimated from three independent dielectric measurements.
], and the dimensions of the samples were equal to S = 15.5 mm2, d = 0.6 mm and S = 8 mm2, d = 1.33 mm, respectively. The copper-foil measuring electrodes were affixed to the prepared crystals. The overall error in the estimation of the real and imaginary parts of the complex electric permittivity was about 5%. The activation energies of relaxation processes were estimated from three independent dielectric measurements.
Optical properties
The crystals were observed by means of an Olympus BX53 optical polarized light microscope. The samples were placed on a LINKAM THM-600 heating/cooling stage. In the vicinity of the phase transitions the scan rate was 1 K min−1 (upon heating and cooling cycles).Crystal structure determination
The crystallographic measurements were performed using a Kuma KM4CCD four-circle diffractometer with the graphite-monochromatized MoKα radiation. The data sets were collected at 100 and 443 K using an Oxford Cryosystems cooler. Data reduction and analytical correction for absorption were carried out with the use of the CrysAlisPRO program using a multifaceted crystal model based on the expressions derived by Clark and Reid.36 The crystal structures were solved by direct methods with the SHELXT37 program and refined by a full-matrix least-squares method on all F2 data using the SHELXL program.38 All heavy atoms were refined with anisotropic temperature factors. The H atoms were located from the molecular geometry and their isotropic temperature factors Uiso were assumed to be 1.2 times the Ueq of their closest heavy atoms. Crystallographic data and structural refinements for 1 and 2 are summarized in Table 1S (ESI†). The structures reported in this paper (excluding structure factors) have been deposited with the Cambridge Crystallographic Data Centre, CCDC numbers: 1508843 and 1508844. All crystal structure figures were prepared using the Olex2 software.39Acknowledgements
This project was supported by the Wroclaw Centre of Biotechnology through the programme: The Leading National Research Centre (KNOW) for years 2014–2018.References
- P. Simon and Y. Gogotsi, Nat. Mater., 2008, 7, 845 CrossRef CAS PubMed.
- P. A. Kohl, Annu. Rev. Chem. Soc., 2013, 135, 5230 Search PubMed.
- W. J. Merz, Phys. Rev., 1953, 91, 513 CrossRef CAS; K. A. Müller and W. Berlinger, Phys. Rev. Lett., 1971, 26, 13 CrossRef.
- O. Malinkiewicz, A. Yella, Y. H. Lee, G. M. Espallargas, M. Graetzel, M. K. Nazeeruddin and H. J. Bolink, Nat. Photonics, 2014, 8, 128 CrossRef CAS.
- R. Van Noorden, Nature, 2014, 513, 470 CrossRef CAS PubMed.
- N. J. Jeon, J. H. Noh and S. I. Seok, Nature, 2015, 517, 476 CrossRef CAS PubMed.
- M. Liu, M. B. Johnston and H. J. Snaith, Nature, 2013, 501, 395 CrossRef CAS PubMed.
- A. Piecha-Bisiorek, A. Białońska, R. Jakubas, P. Zieliński, M. Wojciechowska and M. Gałązka, Adv. Mater., 2015, 27, 5023 CrossRef CAS PubMed.
- M. Owczarek, R. Jakubas, A. Pietraszko, W. Medycki and J. Baran, Dalton Trans., 2013, 42, 15069 RSC.
- M. A. Garcia-Garibay, Proc. Natl. Acad. Sci. U. S. A., 2005, 102, 10771 CrossRef CAS PubMed.
- V. I. Zinenko and N. G. Zamkova, JETP Lett., 1997, 87, 944 CrossRef.
- W.-J. Xu, S.-L. Chen, Z.-T. Hu, R.-B. Lin, Y.-J. Su, W.-X. Zhang and X.-M. Chen, Dalton Trans., 2016, 45, 4224 RSC.
- X. Zhang, X.-D. Shao, S.-C. Li, Y. Cai, Y.-F. Yao, R.-G. Xiong and W. Zhang, Chem. Commun., 2015, 51, 4568 RSC.
- B.-Y. Wang, W.-J. Xu, W. Xue, R.-B. Lin, Z.-Y. Du, D.-D. Zhou, W.-X. Zhang and X.-M. Chen, Dalton Trans., 2014, 43, 9008 RSC.
- W. Zhang, H.-Y. Ye, R. Graf, H. W. Spiess, Y.-F. Yao, R.-Q. Zhu and R.-G. Xiong, J. Am. Chem. Soc., 2013, 135, 5230 CrossRef CAS PubMed.
- B. Wei, R. Shang, X. Zhang, X.-D. Shao, Y.-F. Yao, Z.-M. Wang, R.-G. Xiong and W. Zhang, Chem. – Eur. J., 2014, 20, 8269 CrossRef CAS PubMed.
- W. Zhang, Y. Cai, R.-G. Xiong, H. Yoshikawa and K. Awaga, Angew. Chem., Int. Ed., 2010, 49, 6608 CrossRef CAS PubMed.
- A. E. Phillips, G. J. Halder, K. W. Chapman, A. L. Goodwin and C. J. Kepert, J. Am. Chem. Soc., 2010, 132, 10 CrossRef CAS PubMed.
- K. S. Cole and R. H. Cole, J. Chem. Phys., 1941, 9, 341 CrossRef CAS.
- A. K. Jonscher, Nature, 1977, 267, 673 CrossRef CAS.
- A. Ghosh, Phys. Rev. B: Condens. Matter, 1990, 42, 1388 CrossRef CAS.
- I. G. Austin and N. F. Mott, Adv. Phys., 1969, 18, 41 CrossRef CAS.
- M. Pollak, Philos. Mag., 1971, 23, 519 CrossRef CAS.
- H. Bröttger and V. V. Bryskin, Phys. Status Solidi B, 1976, 78, 415 CrossRef.
- A. L. Efros, Philos. Mag. B, 1981, 43, 829 CAS.
- A. R. Long, Adv. Phys., 1982, 31, 553 CrossRef CAS.
- G. E. Pike, Phys. Rev. B: Condens. Matter, 1972, 6, 1572 CrossRef CAS.
- S. R. Elliot, Philos. Mag. B, 1977, 36, 1291 CrossRef.
- S. R. Elliot, Adv. Phys., 1987, 36, 135 CrossRef.
- V. I. Zinenko and N. G. Zamkova, JETP Lett., 1997, 87, 944 CrossRef.
- V. I. Zinenko and N. G. Zamkova, Phys. Solid State, 2001, 43, 2198 CrossRef.
- J.-P. Willems, M. P. J. W. Clephas and E. De Boer, Mol. Phys., 1993, 80, 607 CrossRef CAS.
- B. N. Figgis, B. W. Skelton and A. H. White, Aust. J. Chem., 1978, 31, 1195 CrossRef CAS.
- N.-G. Vannerberg, Acta Chem. Scand., 1972, 26, 2869 CrossRef.
- T. Hikita and K. Itoh, J. Korean Phys. Soc., 1998, 32, S679 CAS.
- R. C. Clark and J. S. Reid, Acta Crystallogr., Sect. A: Fundam. Crystallogr., 1995, 51, 887 CrossRef.
- G. M. Sheldrick, Acta Crystallogr., Sect. A: Fundam. Crystallogr., 2015, 71, 3 CrossRef PubMed.
- G. M. Sheldrick, Acta Crystallogr., Sect. C: Cryst. Struct. Commun., 2015, 71, 3 CrossRef PubMed.
- O. V. Dolomanov, L. J. Bourhis, R. J. Gildea, J. A. K. Howard and H. Puschmann, J. Appl. Crystallogr., 2009, 42, 339 CrossRef CAS.
Footnote |
| † Electronic supplementary information (ESI) available: Crystal structure and thermal properties. CCDC 1508843 and 1508844. For ESI and crystallographic data in CIF or other electronic format see DOI: 10.1039/c6dt03915d |
| This journal is © The Royal Society of Chemistry 2017 |

