
 Open Access Article
 This Open Access Article is licensed under a
 Creative Commons Attribution 3.0 Unported Licence
Colloidal Cu/ZnO catalysts for the hydrogenation of carbon dioxide to methanol: investigating catalyst preparation and ligand effects†
Sebastian D.
Pike‡
 a,
Andrés
García-Trenco‡
b,
Edward R.
White
a,
Alice H. M.
Leung
b,
Jonathan
Weiner
a,
Milo S. P.
Shaffer
*a and
Charlotte K.
Williams
*b
a,
Andrés
García-Trenco‡
b,
Edward R.
White
a,
Alice H. M.
Leung
b,
Jonathan
Weiner
a,
Milo S. P.
Shaffer
*a and
Charlotte K.
Williams
*b
aDepartment of Chemistry, Imperial College London, London, SW7 2AZ, UK. E-mail: m.shaffer@imperial.ac.uk
bDepartment of Chemistry, University of Oxford, Chemistry Research Laboratory, 12 Mansfield Road, Oxford, OX1 3TA, UK
First published on 11th August 2017
Abstract
The production of methanol from CO2 hydrogenation is a promising potential route to a renewable liquid fuel and renewable energy vector. Herein, three distinct routes to make colloidal catalysts based on mixtures of Cu(0) and ZnO nanoparticles (NPs) and using low-temperature organometallic procedures are reported. The colloids are surface coordinated by a phosphinate ligand: dioctylphosphinate ([DOPA]−), which delivers a high solubility in organic solvents. Further, the synthetic routes allow fine control of the ZnO:Cu and ligand loadings. The catalysts are prepared by mixing small NPs (2 nm) of either Cu(0) or air-stable Cu2O NPs with ZnO NPs (3 nm), or by the synthesis of Cu(0) in presence of ZnO NPs (ZnO: 2 nm, Cu: 6 nm). The resulting colloidal catalysts are applied in the liquid phase hydrogenation of CO2 to methanol (210 °C, 50 bar, 3![[thin space (1/6-em)]](https://www.rsc.org/images/entities/char_2009.gif) :1 molar ratio of CO2:H2). The catalysts typically exhibit 3 times higher rates when compared to a heterogeneous Cu–ZnO–Al2O3 commercial catalyst (21 vs. 7 mmolMeOH gCuZnO−1 h−1). The characterisation of the post-catalysis colloids show clear Cu/ZnO interfaces (HR-TEM), which are formed under reducing conditions, as well as differences in the Cu(0) NP size (from 3 to 7 nm) and nanoscale restructuring of the catalysts. The combination of characterisation and catalytic results indicate that the activity is mostly dictated by the Cu(0) particle size and ligand loading. Smaller Cu(0) NPs exhibited lower turnover frequency (TOF) values, whereas higher ligand loadings ([DOPA]−:(Cu + Zn) of 0.2–1.1) lead to smaller Cu(0) NPs and reduce the formation of Cu/ZnO interfaces. UV-vis spectroscopy reveals that the Cu(0) NPs are more stable to oxidation under air after catalysis than beforehand, potentially due to migration of ZnO onto the Cu surface whilst under catalytic conditions.
:1 molar ratio of CO2:H2). The catalysts typically exhibit 3 times higher rates when compared to a heterogeneous Cu–ZnO–Al2O3 commercial catalyst (21 vs. 7 mmolMeOH gCuZnO−1 h−1). The characterisation of the post-catalysis colloids show clear Cu/ZnO interfaces (HR-TEM), which are formed under reducing conditions, as well as differences in the Cu(0) NP size (from 3 to 7 nm) and nanoscale restructuring of the catalysts. The combination of characterisation and catalytic results indicate that the activity is mostly dictated by the Cu(0) particle size and ligand loading. Smaller Cu(0) NPs exhibited lower turnover frequency (TOF) values, whereas higher ligand loadings ([DOPA]−:(Cu + Zn) of 0.2–1.1) lead to smaller Cu(0) NPs and reduce the formation of Cu/ZnO interfaces. UV-vis spectroscopy reveals that the Cu(0) NPs are more stable to oxidation under air after catalysis than beforehand, potentially due to migration of ZnO onto the Cu surface whilst under catalytic conditions.
1. Introduction
As global energy demands rise, there is growing need for alternative fuels, and those that can be incorporated into the existing liquid fuel infrastructure are particularly attractive.1 Methanol is a liquid fuel which may be used neat or in blends with petrol, and can potentially be synthesised using renewable raw materials.2–4 Currently, methanol is industrially produced from syn-gas (H2/CO/CO2) as feedstock; the syn-gas is transformed to methanol over a heterogeneous catalyst based on Cu–ZnO–Al2O3.5 Isotopic labelling and modelling studies suggest that the carbon source for methanol is in fact CO2;6 the need of CO in the feed may be attributed to the transformation of CO into CO2 removing undesired water via the water-gas shift reaction (WGSR, CO + H2O![[left over right harpoons]](https://www.rsc.org/images/entities/char_21cb.gif) CO2 + H2).7,8 Additionally, Cu–ZnO–Al2O3 heterogeneous catalysts are also active for the direct hydrogenation of CO2 to methanol, although with only moderate activity and insufficient stability.9–11 In the past decade, Fischer, Muhler and co-workers pioneered the liquid phase reaction using colloidal catalysts of Cu(0) and ZnO nanoparticles (NPs) showing promising results for methanol synthesis from syn-gas.12–15 Interestingly, such colloidal catalysts have a number of properties that are expected to be more easily controlled compared to heterogeneous catalysts, such as the surface functionality, catalyst composition and particle size.16 Furthermore, performing the process in liquid phase improves the control over temperature gradients in the reactor, limiting the catalyst deactivation typically attributed to hot-spots that occur in fixed-bed technologies.17 In fact, a commercial liquid-phase methanol synthesis process (LPMeOH™) has been developed.17 Our group has investigated Cu/ZnO NPs as well as Pd2Ga NPs, as liquid phase catalysts for the direct hydrogenation of CO2 to methanol.10,18–21 Typically, small (<10 nm) colloidal NPs were prepared and post-catalysis analysis showed the evolution of Cu/ZnO interfaces, where the catalytic active sites are proposed to be located.11,22,23 Colloidal Cu/ZnO catalysts showed equivalent and better rates of methanol synthesis benchmarked against the conventional Cu–ZnO–Al2O3 catalyst.18 Nevertheless, previous studies did not investigate in detail different methods to make Cu(0) and ZnO NPs nor the nature of the resulting Cu/ZnO interfaces.
CO2 + H2).7,8 Additionally, Cu–ZnO–Al2O3 heterogeneous catalysts are also active for the direct hydrogenation of CO2 to methanol, although with only moderate activity and insufficient stability.9–11 In the past decade, Fischer, Muhler and co-workers pioneered the liquid phase reaction using colloidal catalysts of Cu(0) and ZnO nanoparticles (NPs) showing promising results for methanol synthesis from syn-gas.12–15 Interestingly, such colloidal catalysts have a number of properties that are expected to be more easily controlled compared to heterogeneous catalysts, such as the surface functionality, catalyst composition and particle size.16 Furthermore, performing the process in liquid phase improves the control over temperature gradients in the reactor, limiting the catalyst deactivation typically attributed to hot-spots that occur in fixed-bed technologies.17 In fact, a commercial liquid-phase methanol synthesis process (LPMeOH™) has been developed.17 Our group has investigated Cu/ZnO NPs as well as Pd2Ga NPs, as liquid phase catalysts for the direct hydrogenation of CO2 to methanol.10,18–21 Typically, small (<10 nm) colloidal NPs were prepared and post-catalysis analysis showed the evolution of Cu/ZnO interfaces, where the catalytic active sites are proposed to be located.11,22,23 Colloidal Cu/ZnO catalysts showed equivalent and better rates of methanol synthesis benchmarked against the conventional Cu–ZnO–Al2O3 catalyst.18 Nevertheless, previous studies did not investigate in detail different methods to make Cu(0) and ZnO NPs nor the nature of the resulting Cu/ZnO interfaces.
Ligands have a profound impact on colloidal catalytic systems, and are required to prevent NP ripening and agglomeration, in turn maintaining high surface areas. However, ligands necessarily coordinate to surface sites and could potentially compete with substrate in a catalytic process,24 or create an energy barrier to surface reaction.25 The effects of ligands within nanoparticle catalysis are increasingly recognised,26–28 and have been reported to affect factors such as the steric environment of the active site,29,30 electronic properties,31 changes to hydrophobicity,32 oxidation state or even blocking of deleterious sites.24,33 Previously, we reported catalysts comprising Cu(0) and ZnO NPs, coordinated by stearate ([C17H35CO2]−) or [DOPA]− ([(C8H17)2PO2]−) ligands, suggesting a delocalised chelating coordination mode by IR characterisation.19,34,35 The catalyst stability was improved by partially replacing stearate with [DOPA]−, suggesting that a controlled amount of the more resilient [DOPA]− ligand (more stable to hydrogenation or hydrolysis than carboxylates) is advantageous.12,19 However, the ligand loading could not be tuned as it was controlled by the Cu and Zn precursors.18,19 In fact, an excess of ligand, typically ≥1.0 molar equivalent to total metal concentration (Cu + Zn), was applied, which is expected to result in a large excess (e.g. 900%,19 or 1100%18) relative to available surface sites. It is expected that much less ligand might be sufficient to stabilise NPs. For instance, 0.2 molar equivalents of carboxylate ligands to Zn were used in the synthesis of 3–4 nm ZnO NPs (∼100% ligand relative to surface sites), which retained high solubility in organic solvents,36 and as low as 0.05 molar equivalents of amines to Cu allowed production of 8 nm Cu(0) NPs.37,38 In methanol synthesis catalysis, an interface between Cu and ZnO species is proposed as the active site, and it may be that excess ligand is detrimental to forming interfaces by keeping particles isolated. Therefore, it is important to develop new routes to make colloidal Cu/ZnO catalysts that allow fine control of the ligand loading. In this work, three different synthetic routes to make NP are explored. The routes involve mixing pre-synthesised Cu(0) or air-stable Cu2O with ZnO NPs, or synthesising Cu(0) in presence of ZnO NPs (Fig. 1).
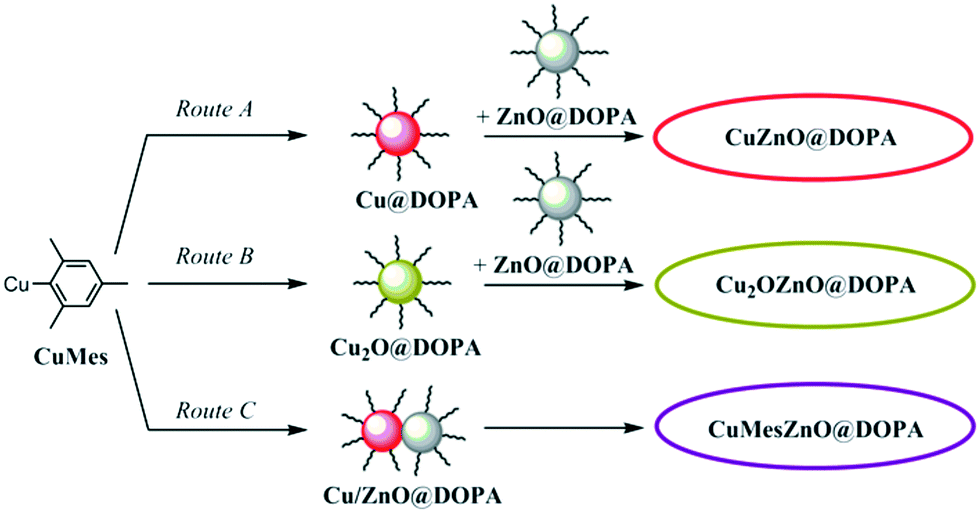 | ||
| Fig. 1 Synthetic routes to Cu/ZnO pre-catalyst colloids coordinated by the [DOPA]− ligand. | ||
2. Results and discussion
2.1. Preparation of Cu/ZnO pre-catalyst colloids
Three different routes to prepare mixtures of Cu and ZnO nanoparticles are compared. In each route, small (<6 nm) particles are produced with good control of ligand loading and Cu:ZnO composition. Firstly, the ZnO NPs, which are common to all three routes, were prepared by the controlled hydrolysis of ZnEt2 in the presence of 0.2 molar equivalents of dioctylphosphinic acid as described previously (sample ZnO@DOPA).19,35 The ZnO NPs are white powders, and were characterised by XRD, ADF-STEM and UV-vis spectroscopy. All methods showed crystalline ZnO NPs, with diameters of 2–3 nm (Fig. S1†). Elemental analysis allowed determination of the [DOPA]−:ZnO molar composition as 0.17:1.32 At such loadings, it is estimated that approximately 66% of the NP surface is covered by ligand (see ESI† for details of the estimation/calculation).
Cu(0) NPs coordinated by [DOPA]− ligands were synthesised by the reduction of mesitylcopper(I) (CuMes) as previously reported.34 The reaction required only 3 bar of H2, at 110 °C, applied mesitylene as a solvent, and was successful using 0.1 molar equiv. of DOPA–H. The product (sample Cu@DOPA) consisted of Cu(0) NPs with diameter ∼2 nm, although some larger NPs (ca. 4 nm) were also observed by ADF-STEM analysis (Fig. S2†), as found previously.34 Considering the size distribution of the NPs, a ligand surface coverage of 34% is calculated (see ESI†). The surface structure was previously identified as a partial surface layer of Cu(I)–DOPA.34
The use of air stable copper catalysts may be desirable from a practical viewpoint. Hence, Cu2O NPs, coordinated with [DOPA]− ligand (sample Cu2O@DOPA), were prepared by exposing a mesitylene solution of CuMes and 0.1 molar equiv. of DOPA–H to air over 48 h.34 The resulting solution contains very small Cu2O NPs, with sizes between 1–3 nm, as confirmed ADF-STEM (Fig. S3†). These Cu2O NPs were previously shown to exhibit a Cu2O core with a surface layer of Cu(II) species likely coordinated to surface [DOPA]− and [OH]−.34 It was also shown that Cu2O@DOPA can be reduced to Cu(0) NPs by exposure to 3 bar H2 at 135 °C. The quantitative conversion of CuMes to Cu(0) or Cu2O NPs was confirmed by 1H NMR spectroscopy of solutions. More detailed information about the synthetic routes and methods can be found in the ESI.†
As shown in Fig. 1, the pre-catalysts were prepared by combining the Cu@DOPA (route A) or Cu2O@DOPA (route B) NP solutions with ZnO@DOPA powder. In both methods, a 1:1 Cu:Zn molar ratio was selected since this value had previously shown maximum activity.18,19 The total [DOPA]−:(Cu + Zn) molar ratio was 0.13:1 for both routes A and B. Additionally, a direct route to make Cu/ZnO colloids was achieved by reducing CuMes in the presence of ZnO@DOPA NPs (route C). CuMes was added to a mesitylene solution of the ZnO@DOPA NPs, using reagent quantities selected so as to obtain a Cu:Zn molar ratio of 1:1. In this case, no additional ligand was added but some mobility of the ZnO@DOPA ligand onto Cu is envisaged under the reaction conditions. Overall the [DOPA]−:(Cu + Zn) molar ratio for route C was 0.08:1, lower than in routes A and B which utilise additional ligand in the formation of Cu NPs. The resulting solution was reduced under 3 bar of H2 at 110 °C for 2.5 h. The pre-catalyst colloids are labelled as xZnO@DOPA, where x stands for the initial state of Cu when mixed with ZnO@DOPA NPs (i.e. Cu, Cu2O or CuMes). The reaction of ZnO@DOPA with CuMes (to form pre-catalyst CuMesZnO@DOPA, route C) was monitored using 1H NMR spectroscopy (Fig. S4†): it showed the immediate protonation of ∼15% of the CuMes (by integration) to form mesitylene. It is proposed that this initial reaction involves protonation by water or hydroxyl species on the ZnO NP surface.39 No Cu–DOPA complexes were observed using 31P NMR spectroscopy. The reduction conditions (3 bar H2 at 110 °C for 2 h) resulted in formation of a deep red solution. The complete consumption of CuMes was revealed by 1H NMR spectroscopy (Fig. S5†), along with the minor formation of the [Zn4O(DOPA)6] cluster (faint signals in the 31P NMR spectrum). This cluster is known to form from ZnO@DOPA NPs in solution.35 UV-vis spectroscopy showed both a surface plasmon resonance (SPR) signal (max = 573 nm) from Cu(0) NPs and a band edge at λ½ = 335 nm (vide infra) corresponding to ZnO NPs of 2.8 nm (Table 1), notably there is no ripening of ZnO during the reduction step. Powder XRD analysis of the dried NPs (without exposing the sample to air) showed clear signals for Cu(0) and broad signals for ZnO (Fig. S6†). Scherrer analysis indicates crystallite sizes of 6.8 nm (hkl = 111) for Cu(0), and 2.3 nm (hkl = 102) for ZnO. TEM images were also consistent with the formation of larger Cu(0) particles (6.2 nm) which are intimately mixed with small ZnO particles (2–3 nm) (Fig. S6†). The Cu(0) NPs here are larger than those obtained by the independent reduction of CuMes (and 0.1 equiv. of ligand), likely due to the lower ligand concentration in this case.
| Sample | ZnO (nm) | Cu (nm) | TOFd | ||||||||
|---|---|---|---|---|---|---|---|---|---|---|---|
| Pre-catalysis | Post-catalysis | Pre-catalysis | Post-catalysis | ||||||||
| XRD | TEMa | UV | XRD | TEMa | UV | XRD | TEMa | XRD | TEMa | ||
| a Average particle size ± standard error (standard deviation). The standard error of the mean is defined as standard deviation/(no. of measures)1/2. b The size given is for Cu2O. c The size of all particles was ≤3 nm by STEM, the Cu(0) and ZnO phases could not be distinguished by HR-TEM. d TOF = turnover frequency, units = 10−8 molCH3OH mCu−2 s−1. | |||||||||||
| CuZnO@DOPA | 2.3 | 2.8 ± 0.02 (0.6) | 2.8 | 3.2 | 4.9 ± 0.1 (1.1) | 4.2 | — | 2.1 ± 0.02 (0.9) | 6.4 | 7.2 ± 0.2 (1.9) | 15.6 |
| Cu2OZnO@DOPA | 2.3 | 2.8 ± 0.02 (0.6) | 2.8 | — | — | — | — | 2.2 ±0.1 (0.7)b | 3.6 | 3.6 ± 0.1 (0.8) | 8.3 |
| CuMesZnO@DOPA | 2.3 | 2.5 ± 0.04 (0.5) | 2.8 | 3.8 | 3.9 ± 0.1 (1.1) | 4.1 | 6.8 | 6.2 ± 0.2 (1.7) | 8.7 | 6.0 ± 0.5 (2.4) | 14.9 |
| CuMesZnO@DOPA+0.25 | — | ≤3c | 2.9 | — | 4.5 ± 0.2 (1.3) | 4.1 | — | ≤3c | — | 3.3 ± 0.1 (1.1) | 4.7 |
2.2. Catalytic experiments
:CO2 mixture (3:1 molar ratio), and heated to 210 °C. These reaction conditions are in the range of those used industrially, where temperatures are typically 200–270 °C and pressures are 50–100 bar.40,41 A previously reported Cu/ZnO colloidal catalyst (pre-catalyst Cu/ZnO@St),42 and a conventional Cu–ZnO–Al2O3 heterogeneous catalyst were also tested as references under the same reaction conditions and at the same overall catalyst molar loading (0.8 mmol of Cu + Zn). The heterogeneous catalyst, commercially available as CuO–ZnO–Al2O3 precursor, was subject to a standard activation by suspension in mesitylene and using a 5% H2/N2 stream under 4.5 bar at 240 °C for 3 h.43 All experiments were conducted under differential reaction conditions, with CO2 conversions always below 2%. More details on the catalytic procedure and reference catalysts are available in the ESI.†
In a typical catalytic run, the methanol rate rose to a peak value after several hours on stream, after which, the rate and selectivity remained stable over 12 h (Fig. S7–S11†). The only by-product observed was CO, which is produced by the reverse water gas shift reaction (rWGSR). The previously reported CuZnO@St and the conventional Cu–ZnO–Al2O3 catalysts exhibited similar methanol rates and selectivities – in good agreement with previous reports (Fig. 2).18 The three CuZn@DOPA catalysts gave activities 2–3 times higher than reference catalysts. The higher methanol rate compared to the CuZnO@St colloidal catalyst is mostly attributed to the use of lower ligand loading (ligand:(Cu + Zn) molar ratio of 0.08–0.13:1 vs. 1:1). Nonetheless, the greater stability of [DOPA]− under reducing conditions, compared to the stearate used in CuZnO@St, might also contribute to the higher rates.19 For the CuZn@DOPA catalysts, prepared by routes A–C, the specific methanol rates and selectivities exhibited were not substantially different, despite the variations in the synthesis. It is potentially very useful that the air stable pre-catalyst colloid, Cu2OZnO@DOPA, was equally effective, removing the need for air-sensitive handling techniques. The methanol rate is generally correlated to the Cu(0) surface area for heterogeneous Cu/Zn-based methanol synthesis catalysts.44,45 Hence, the size distributions of the Cu(0) NPs from the post-catalysis samples (Fig. S12†) were used to estimate the turnover frequencies (TOFs, molCH3OH mCu−2 s−1) on the active catalysts. As seen in Table 1, the Cu2OZnO@DOPA pre-catalyst, which forms smaller Cu(0) NPs (3.6 nm) exhibited a lower TOF compared to CuZnO@DOPA and CuMesZnO@DOPA pre-catalysts, which produced larger Cu(0) particle sizes (6–7 nm).
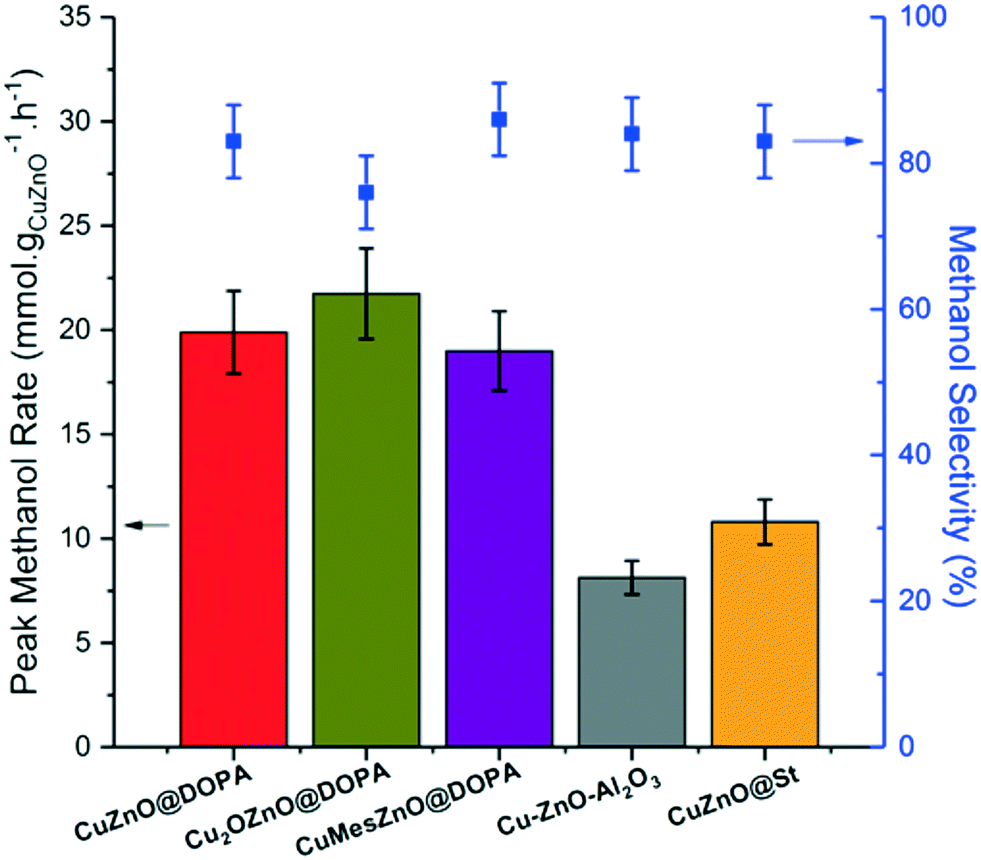 | ||
| Fig. 2 Peak methanol rates and selectivity for the colloidal CuZn@DOPA catalysts, and the reference CuZnO@St and Cu–ZnO–Al2O3 catalysts in the hydrogenation of CO2 to methanol. Reaction conditions: 210 °C, 50 bar, H2:CO2 molar ratio of 3:1, 10.8 Lsyngas mmolCu+Zn−1 h−1 in mesitylene. | ||
This finding correlates with recent studies reporting that the surface-specific activity decreases gradually for Cu(0) NPs smaller than 8 nm, providing the promotion by Zn is not limited by Zn loading.46,47 This size-related structure sensitivity for Cu/Zn heterogeneous catalysts used in the methanol synthesis, although still unclear, has been attributed to the requirement for a unique configuration of Cu(0) particles with specific step sites which occur less frequently on smaller NPs.46 However, per mass of CuZnO, the lower surface specific activity associated with small particles is compensated by the increased available surface area in the case of pre-catalyst Cu2OZnO@DOPA, indicating that there is an optimum Cu(0) NP size which maximises the methanol rate.
CuZn@DOPA post-catalysis colloids were characterised using air-sensitive techniques in order to prevent their oxidation. By XRD, all the samples showed typical diffraction peaks assigned to the crystalline Cu(0), confirming that Cu2O NPs in sample Cu2OZnO@DOPA were reduced under the reaction conditions (Fig. S13–S15†). CuZnO@DOPA and CuMesZnO@DOPA also showed peaks corresponding to the crystalline ZnO phase. In contrast, no clear ZnO peaks were observed for the sample prepared from Cu2O NPs, Cu2OZnO@DOPA, suggesting the presence of an amorphous ZnO phase or ZnO crystallites with sizes under the detection limit of the diffractometer (≲2 nm). All the samples showed an increase in the crystallite size of Cu(0) after catalysis (Table 1), which is more pronounced for CuZnO@DOPA, and a small increase in ZnO diameter from 2–3 to 3–4 nm (except for Cu2OZnO@DOPA for which crystalline ZnO was not observed).
The nanoscale structure of the post-catalysis colloids was studied by electron microscopy. Whilst catalysts CuZnO@DOPA and CuMesZnO@DOPA exhibited well-defined NPs (Fig. 3a and c), Cu2OZnO@DOPA formed 20–100 nm agglomerates (Fig. 3b). EDX analysis of the agglomerates, showed Cu(0) NPs embedded in a Zn and O rich phase (Fig. S16†). In this case, the re-arrangement of the ZnO phase is not obviously rationalised but may relate to increased amounts of water which are present from the in situ Cu2O reduction.
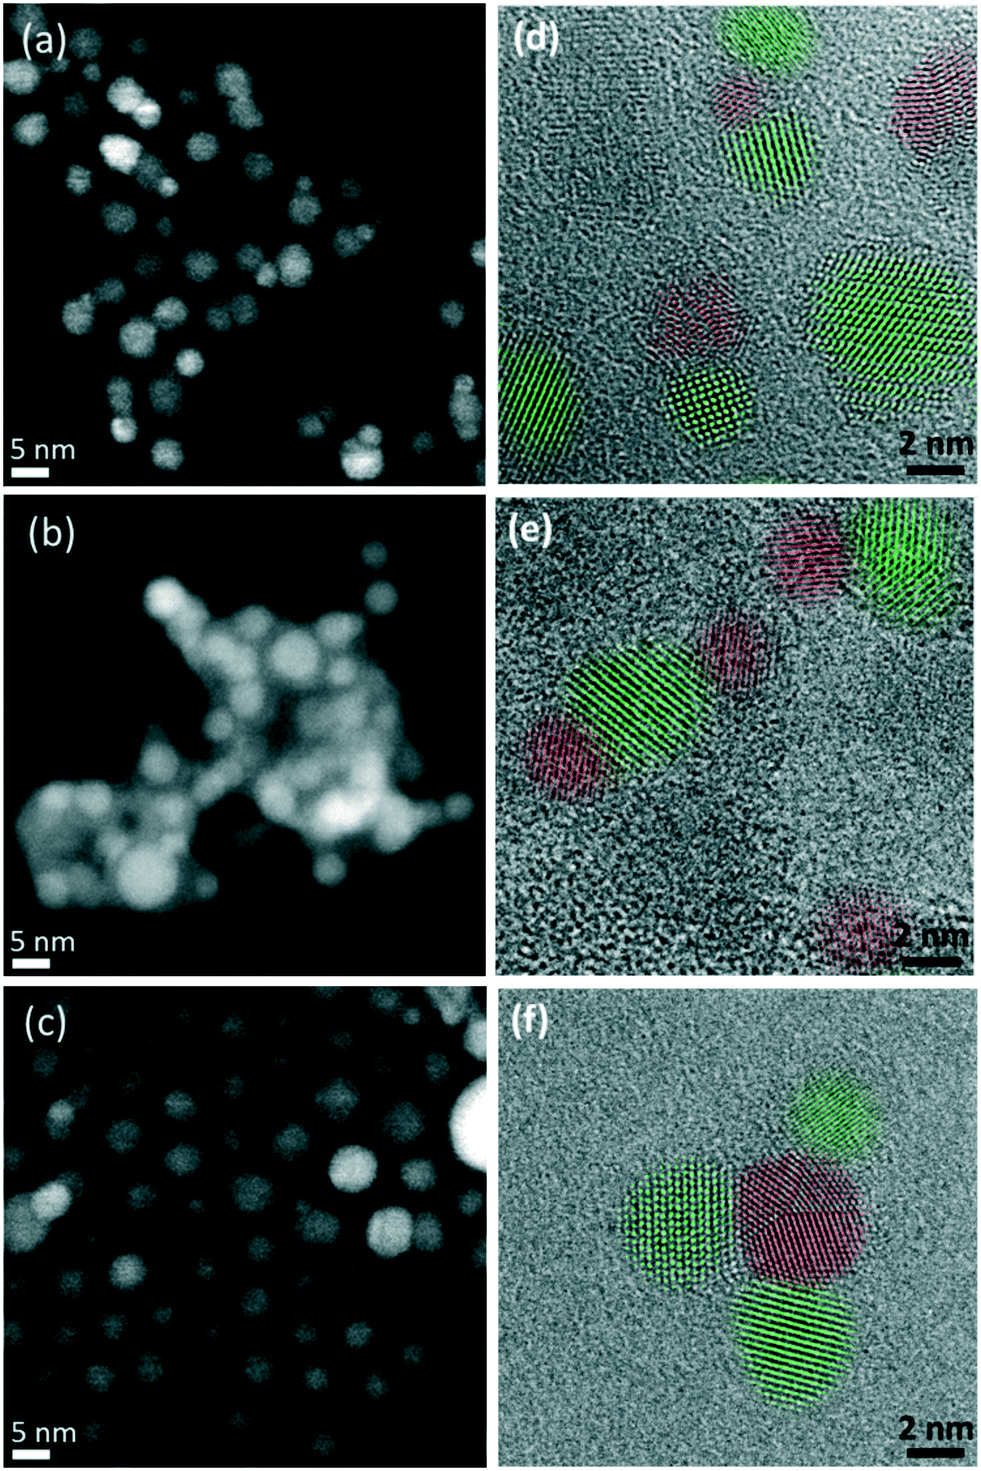 | ||
| Fig. 3 Representative STEM and HR-TEM images for CuZnO@DOPA (a and d), Cu2OZnO@DOPA (b and e) and CuMesZnO@DOPA (c and f) post-catalysis samples. Cu(0) in red and ZnO in green. | ||
As seen in Fig. 3, lattice spacing analysis of the HR-TEM images allowed identification of Cu(0) and ZnO NPs in the post-catalysis samples of CuZnO@DOPA and CuMesZnO@DOPA (Fig. 3a and c). For Cu2OZnO@DOPA well-defined Cu(0) NPs were mainly located in an amorphous ZnO phase, though some minor regions of small ZnO crystallites were also observed (Fig. 3e and S17†). It might suggest that crystalline ZnO is not required to form the methanol synthesis active sites, as reported in some studies.46,48,49 However, the identification of some crystalline ZnO structures prevents firm conclusion from being obtained. In any case, the HR-TEM images of the post-catalysis colloids showed clear evidence of Cu(0) and ZnO interfaces (Fig. 3 and S17–S19†). The proportion of Cu(0) NPs in contact with crystalline ZnO particles was higher than 40% for the post-catalysis samples of CuZnO@DOPA and CuMesZnO@DOPA (Table S1†), whereas the amorphous ZnO phase of Cu2ZnO@DOPA sample hindered a fair analysis.
A representative HR-TEM image of an interface between a Cu(0) and ZnO NP is shown in Fig. 4a. The fast Fourier transform (FFT) of the image (Fig. 4b) shows peaks at lattice spacings corresponding to the Cu(0) and ZnO phases. Vectors from the center of the FFT to the two labelled peaks, Cu (111) and ZnO (002), share the same direction and are perpendicular to the Cu/ZnO interface, indicating a likely epitaxial relationship between the Cu (111) and ZnO (001) facets. Previous measurements of ZnO grown on Cu(0) showed the same epitaxial relationship.50 Other Cu/ZnO interfaces from HR-TEM analysis indicate that different epitaxial relationships are also likely present. Fig. 4c shows a Cu(0) NP with three ZnO interfaces. The FFTs (Fig. 4d) show that two of the interfaces are perpendicular to vectors pointing to the ZnO (002) peaks, but not the Cu (111) peaks, meaning the interface is not likely between the Cu (111) and ZnO (001) facets. Furthermore, unlike in the previous example, there is some apparent overlap between the Cu(0) and ZnO lattice fringes. Thus for these interfaces, the epitaxial relationship is likely between some higher indexed ZnO facet, such as (01l) where l > 1, and a Cu facet other than (111).
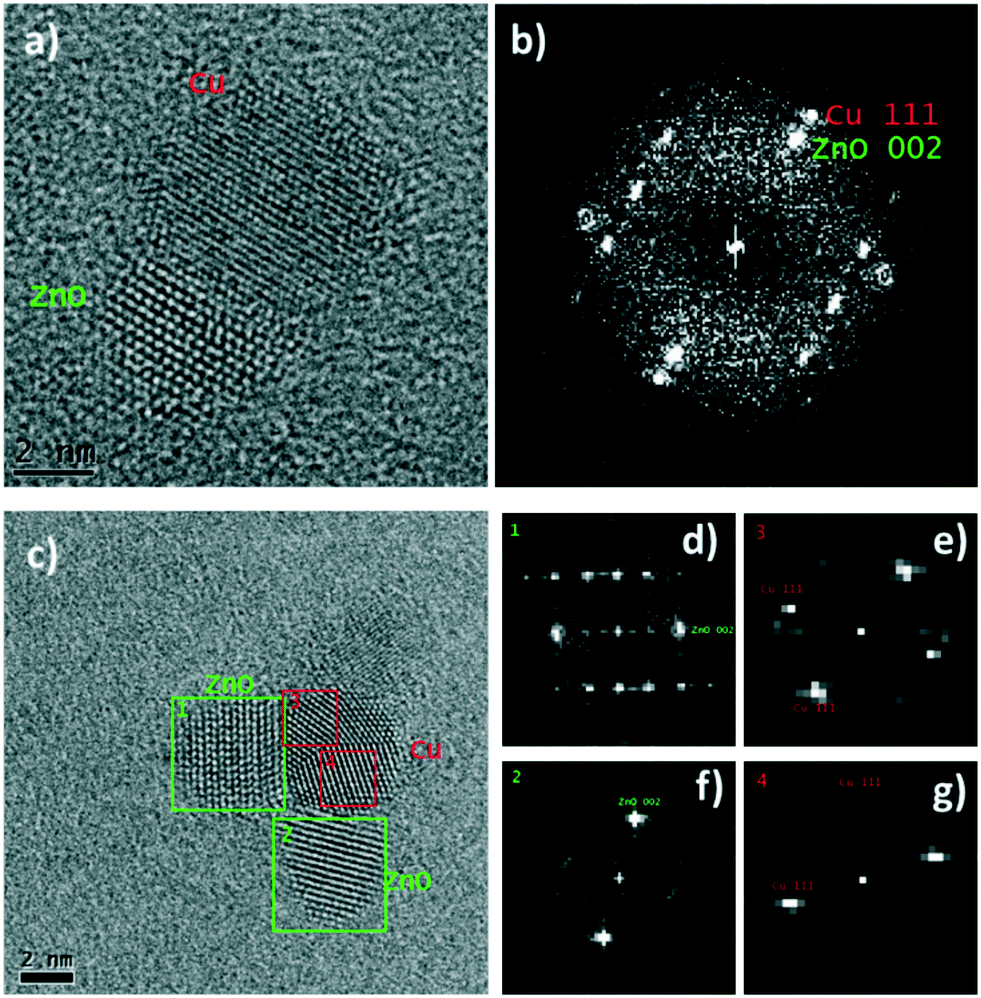 | ||
| Fig. 4 a) Representative HR-TEM image of Cu/ZnO interface in the post-catalysis CuZn@DOPA samples, b) fast Fourier transform of image a, c) HR-TEM image of a Cu(0) NP (with multiple crystalline domains) in contact with three ZnO NPs after catalysis, d–g) fast Fourier transform of selected areas 1–4 (from image c), respectively. | ||
It is commonly suggested that the Cu/ZnO interface leads to the formation of the active sites for methanol synthesis,14,15,51 and consistent with this hypothesis, here, such interfaces were indeed observed to form in the post-catalysis samples. In order to establish when the interfaces are formed, the pre-catalyst colloids CuZnO@DOPA and CuMesZnO@DOPA were also analysed by HR-TEM. No Cu/ZnO interfaces were observed upon simply mixing the Cu(0) and ZnO NPs (sample CuZnO@DOPA). On the other hand, when CuMesZnO@DOPA was submitted to a reduction treatment during its preparation (3 bar of H2 at 110 °C), the clear formation of interfaces was identified (Table S1†). The conclusion that the active Cu/ZnO interfaces form under the reaction conditions (50 bar of H2:CO2 = 3:1) is aligned with previous reports that, in heterogeneous catalytic systems, Cu(0) and ZnO NPs create contact points during the reduction step.22,52
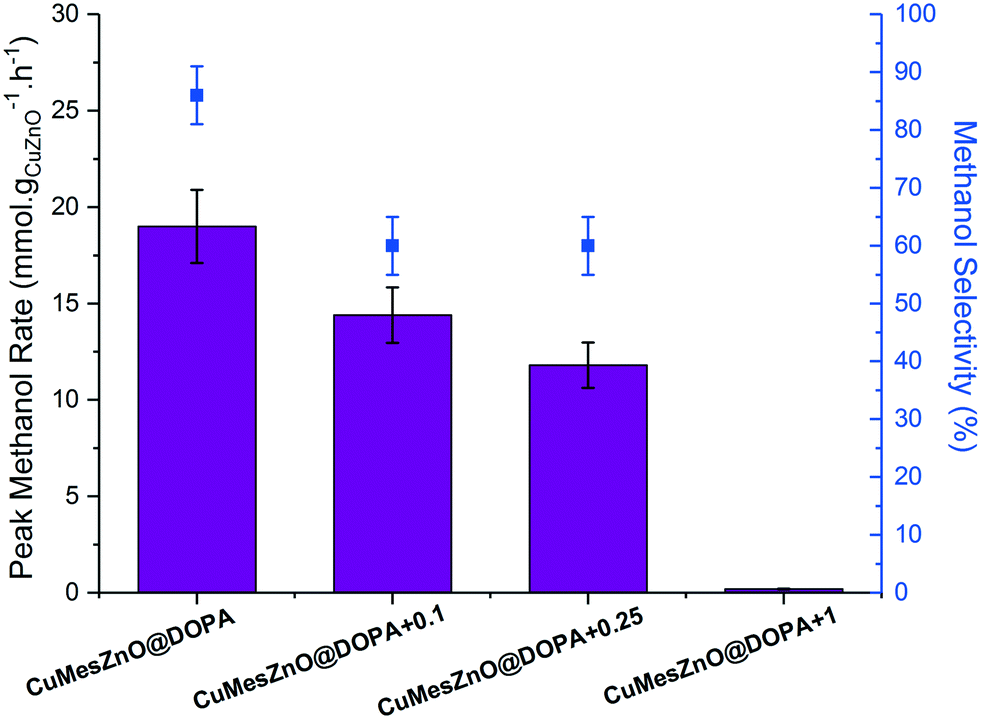
:(Cu + Zn) molar ratios of 0.18 (CuMesZnO@DOPA+0.1), 0.33 (CuMesZnO@DOPA+0.25) and 1.08 (CuMesZnO@DOPA+1) were prepared. In each case, a deep red solution was formed and there was evidence for both Cu(0) and ZnO NPs in the UV-vis spectra (Fig. S20–S22†). The sizes of the ZnO NPs were ∼2.9 nm by UV-vis for all the samples, in agreement with the previously synthesised CuMesZnO@DOPA sample without addition of extra ligand ([DOPA]−:ZnO of 0.08). STEM images of CuMesZnO@DOPA+0.25 also confirmed that the particle diameters (both Cu and ZnO) were lower than 3 nm (Fig. S23†), which is smaller than that for the equivalent CuMesZnO@DOPA sample without extra ligand addition. This observation indicates that an increased ligand content leads to smaller Cu(0) NPs.
The CuMesZnO@DOPA+x catalysts with variable ligand loadings were tested in the hydrogenation of CO2 to methanol. As observed in the previous catalytic runs, the methanol rate reached a maximum after several hours and then remained nearly constant over the 12 h of each experiment (Fig. S24†). The increased [DOPA]− ligand content did not substantially affect the short-term stability of the colloidal solutions. However, increasing the [DOPA]− loading systematically decreased the methanol synthesis rate (Fig. 5), almost to zero for the highest concentration sample, CuMesZnO@DOPA+1. As shown in Table 1, smaller Cu(0) NPs (3.3 nm) were observed for CuMesZnO@DOPA+0.25 compared to the original CuMesZnO@DOPA (6.0 nm). However, the decrease in rate for CuMesZnO@DOPA+0.25 cannot be attributed to the smaller Cu(0) particle size, as Cu2OZnO@DOPA, which has a similar Cu(0) NPs size (3.3 and 3.6 nm, Table 1), exhibited one of the highest methanol rates. Therefore, the ca. 40% lower methanol rate (and TOF value) for the sample CuMesZnO@DOPA+0.25 must be attributed to detrimental effects of extra ligand addition. Unlike CuMesZnO@DOPA, HR-TEM and STEM images for CuMesZnO@DOPA+0.25 showed fewer Cu(0) and ZnO interfaces after catalysis (Table S1†), the discrete NPs may be stabilised by the greater concentration of available ligand (Fig. S25†). Supporting this characterisation data, more isolated Cu(0) NPs would be expected to promote the rWGSR, consistent with an observed decrease in methanol selectivity from 85 to 60% on increasing ligand loading (Fig. 5).53–55
 | ||
| Fig. 5 Peak MeOH rates and selectivity of CuMesZnO@DOPA+x catalysts prepared varying amounts [DOPA]− ligand. Reaction conditions: 210 °C, 50 bar, H2:CO2 molar ratio of 3:1, 10.8 Lsyngas mmolCu+Zn−1 h−1 in mesitylene. | ||
An alternative explanation for the detrimental effect of excess ligand may be the formation of inactive molecular species by the reaction of [DOPA]− with the NPs. In fact, all the NMR spectra of the post-catalysis colloids showed a sharp signal in the 31P NMR spectrum [δ 56.5 ppm (CDCl3)] which was assigned to a known [Zn4O(DOPA)6] cluster compound (Fig. S5†).35 The cluster is known to form as a minor by-product during the synthesis of ZnO@DOPA NPs and was also observed, by 31P NMR spectroscopy, when isolated ZnO@DOPA particles were dissolved in organic solvents.35 It appears that the cluster species is in equilibrium with ZnO@DOPA NPs (ESI,† supporting note 2). Therefore, the experiments conducted with greater quantities of ligand are expected to result in depletion of active ZnO due to formation of higher concentrations of [Zn4O(DOPA)6]. UV-vis characterisation of the post-catalysis CuMesZnO@DOPA+1 with the largest excess of ligand ([DOPA]−:(Cu + Zn) molar ratio of 0.18) did not show any signals corresponding to Cu(0) or ZnO NPs. In this case, it is proposed that the large excess of [DOPA]− reacts to form a range of inactive molecular species containing both metals. A control experiment combining Zn4O(DOPA)6 with Cu(0) NPs exhibited no activity for methanol synthesis. Finally, it is possible that an increased amount of ligand might also reduce the methanol rate by blocking or hampering the accessibility of the reactants to the active sites, as reported under conditions where large quantities of ligand were used in other catalytic systems.33
2.3. Oxidative stability of the post-catalysis colloids
The oxidation of Cu(0) NPs to form Cu2O can be followed by UV-vis spectroscopy by monitoring the loss of the SPR signal, which is accompanied by a colour change from red to yellow/green/blue (depending on the particle size).34 Typically, oxidation occurs quickly and for small (<5 nm) NPs, it reaches completion within a few minutes. However, once the particles become larger (>5 nm), evidence of the formation of long-lived (hours to weeks) Cu2O/Cu core shell particles has been observed.34,38 During oxidation of such larger particles, as a surface layer of Cu2O forms, the remaining Cu(0) core initially displays an enhanced SPR, due to reduced interaction with the surrounding solvent.34,38,56,57 All the pre-catalyst colloids changed colour within 10 minutes under air, indicative of rapid surface oxidation (Fig. 6b and S2 and S20–S22†).34 On the other hand, the post-catalysis solutions without the addition of extra ligand behaved differently, with all remaining a deep red colour under air for up to 24 h (Fig. 6d and S26 and S27†).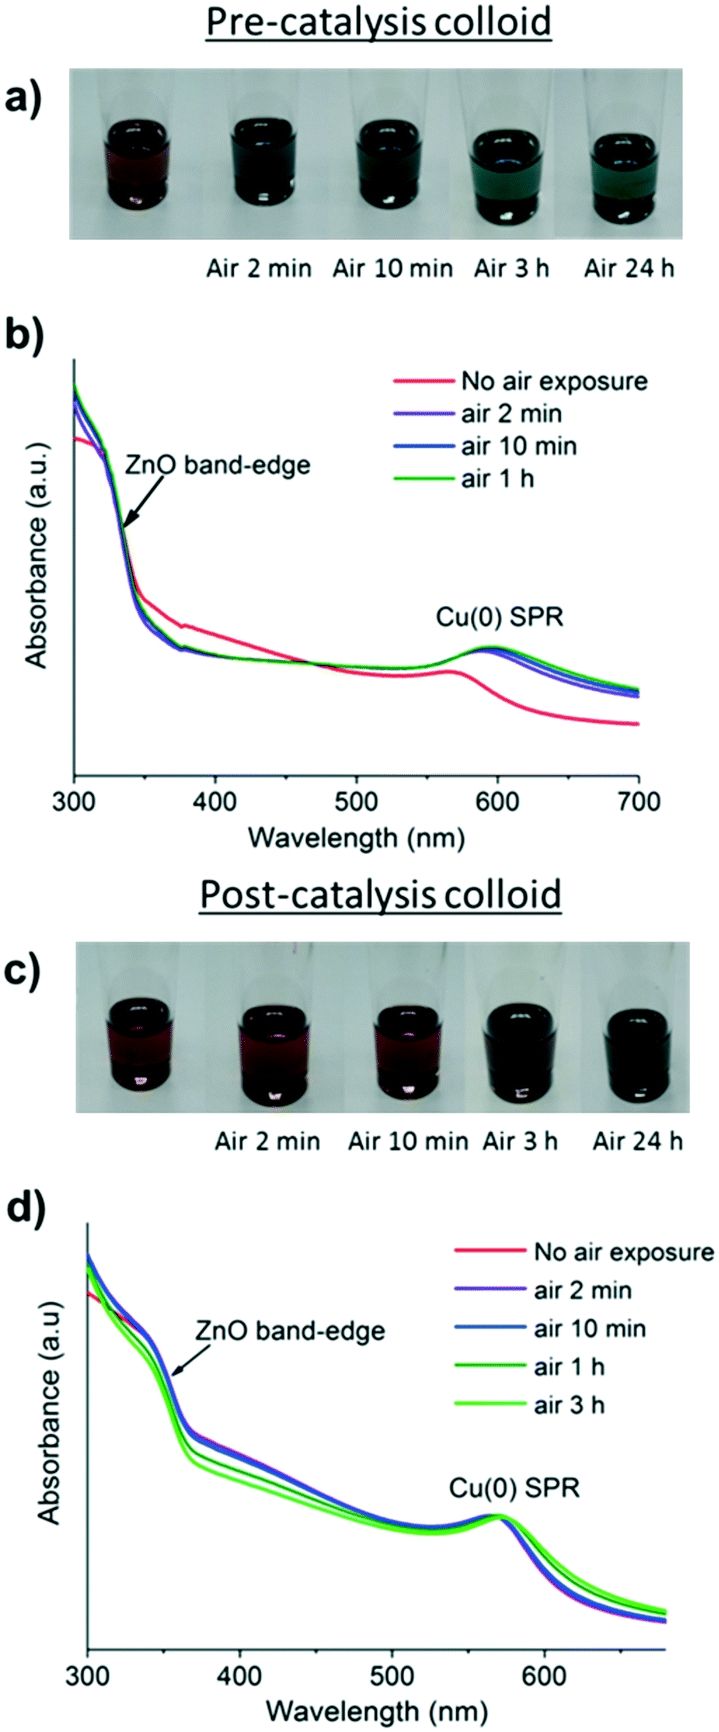 | ||
| Fig. 6 a & b) Photographs and UV/vis spectra of the pre-catalysis CuMesZnO@DOPA solution before and after air exposure. c & d) Photographs and UV-vis spectra of the CuMesZnO@DOPA post-catalysis solution before and after air exposure. | ||
In all cases, the SPR signal remains at a similar intensity with only a very slight red shift, suggesting that the surface of the Cu(0) particles is hardly changed. This lack of oxidation is consistent with XRD of the same samples, which showed no change on air exposure (Fig. S13 and S14†).34 Previous reports describe the deposition of a Zn phase onto Cu(0) NPs by sequential co-pyrolysis of the organometallic precursors which retards the oxidation of Cu(0) in air.14 In this study, using different synthetic routes, we have found that the Zn deposition occurs under reducing conditions during catalysis. One explanation for this surprising stability could be that a ZnO surface passivation layer forms on the Cu(0) NPs (Fig. 7). Layers of “graphitic” ZnO have also been observed on the Cu(0) surface in a post-catalysis sample of the conventional Cu/Zn-based methanol synthesis catalyst.58 Here, multiple attempts were made to analyse the putative surface layer but it could not be conclusively identified by either HR-TEM or XPS techniques.
 | ||
| Fig. 7 Schematic illustrating the proposed oxidation of Cu(0) NPs by air before or after catalysis, with the formation of a Zn containing surface layer during catalysis. | ||
There was also a ligand loading effect on the oxidative stability. When greater loadings of ligand were used, the post catalyst solutions (CuMesZnO@DOPA+0.1 and CuMesZnO@DOPA+0.25) oxidised more rapidly in air (e.g. colour change within ∼1 h, Fig. S28 and S29†), although still more slowly than before catalysis (colour change <2 min, Fig. S20–S22†). The findings are consistent with the formation of small (≤3 nm) Cu(0) particles that are not so effectively stabilised by a surface layer. A lesser degree of oxidative protection may be attributed to less efficient transfer of ZnO onto the Cu(0) surface due to the reduced formation of Cu/ZnO interfaces, as observed experimentally, although an excess of ligand acting as a scavenger of Zn species cannot be dismissed. Interestingly, when ZnO@DOPA NPs were combined with Cu@DOPA NPs and heated under 3 atm H2, at 135 °C for 24 h, the resultant colloidal mixtures showed rapid oxidation profiles (<2 minutes, by visible spectroscopy, Fig. S30†). Therefore, the protection of the Cu(0) surface appears to require either higher temperatures and/or more reducing conditions such as those present during catalysis.
Conclusions
Three different routes have been studied to prepare mixtures of Cu(0) and ZnO colloidal NPs, starting from organometallic reagents, producing small (<6 nm) particles with good control of the [DOPA]− ligand loading. The catalysts consisted of mixtures of Cu(0) or Cu2O NPs (ca. 2 nm) and ZnO NPs (ca. 3 nm), as well as the direct synthesis of Cu(0) NPs in the presence of ZnO NPs. The catalysts were tested in the liquid phase hydrogenation of CO2 to methanol (210 °C, 50 bar, H2:CO2 molar ratio of 3:1). Strikingly, the colloidal catalysts exhibited a methanol rate (mmolMeOH gCuZnO−1 h−1) 2–3 times higher than those for the conventional Cu–ZnO–Al2O3 heterogeneous catalyst and higher than a previously tested Cu/ZnO@stearate colloidal catalyst,18 regardless of the synthetic method used. It was quite possible to use air stable Cu2O NPs as pre-catalysts, in that case removing the need for air-sensitive handling methods.
The characterisation of the post-catalysis samples showed the formation of Cu/ZnO interfaces in all cases, although there were clear differences in the Cu(0) NP size and in the nanoscale structure between the various catalysts. Catalytic and characterization results suggest an optimum Cu(0) NP size to maximise the methanol rate (per mass of CuZnO), which is dictated by the synthetic route used and the ligand loading. As the ligand loading was increased, both the rate and selectivity decreased. This may be due to a combination of factors including reduced formation of Cu/ZnO interfaces and a greater proportion of inactive molecular species.
UV-vis spectroscopy revealed that the Cu(0) NPs in the post-catalysis samples were more stable to oxidation in air than in the pre-catalysis material. This stabilising effect is tentatively attributed to the formation, under reaction conditions, of an ZnO-containing layer on the surface of the Cu(0) NPs. Additionally, the oxidative stability decreased with increased ligand content. Determining whether a surface coverage of ZnO is essential for forming active sites or merely a by-product of the catalytic process should be a future target for the field.
Cu/ZnO-Based colloidal catalysts show real promise in terms of activity and selectivity, and could provide a viable liquid phase methanol production process. The ligand exerts an important influence on the structures and performances of the catalysts and thus, further studies focused on the ligand design and loading are warranted.
Acknowledgements
The EPSRC are acknowledged for funding (EP/K035274/1, EP/M013839/1, EP/M028291/1 and EP/H046380/1); DTA studentships to AL.References
- C.-J. Yang and R. B. Jackson, Energy Policy, 2012, 41, 878–884 CrossRef.
- G. A. Olah, Angew. Chem., Int. Ed., 2013, 52, 104–107 CrossRef CAS PubMed.
- M. D. Porosoff, B. Yan and J. G. Chen, Energy Environ. Sci., 2016, 9, 62–73 CAS.
- A. Tremel, P. Wasserscheid, M. Baldauf and T. Hammer, Int. J. Hydrogen Energy, 2015, 40, 11457–11464 CrossRef CAS.
- M. Behrens and R. Schlögl, Z. Anorg. Allg. Chem., 2013, 639, 2683–2695 CrossRef CAS.
- G. Chinchen, P. Denny, D. Parker, M. Spencer and D. Whan, Appl. Catal., 1987, 30, 333–338 CrossRef CAS.
- Y. Zhang, Q. Sun, J. Deng, D. Wu and S. Chen, Appl. Catal., A, 1997, 158, 105–120 CrossRef CAS.
- F. Studt, M. Behrens, E. L. Kunkes, N. Thomas, S. Zander, A. Tarasov, J. Schumann, E. Frei, J. B. Varley and F. Abild-Pedersen, ChemCatChem, 2015, 7, 1105–1111 CrossRef CAS.
- O. Martin, A. J. Martín, C. Mondelli, S. Mitchell, T. F. Segawa, R. Hauert, C. Drouilly, D. Curulla-Ferré and J. Pérez-Ramírez, Angew. Chem., Int. Ed., 2016, 55, 6261–6265 CrossRef CAS PubMed.
- A. García-Trenco, E. R. White, A. Regoutz, D. J. Payne, M. S. P. Shaffer and C. K. Williams, ACS Catal., 2017, 7, 1186–1196 CrossRef.
- S. Kattel, P. J. Ramírez, J. G. Chen, J. A. Rodriguez and P. Liu, Science, 2017, 355, 1296–1299 CrossRef CAS PubMed.
- S. Schimpf, A. Rittermeier, X. Zhang, Z.-A. Li, M. Spasova, M. W. E. van den Berg, M. Farle, Y. Wang, R. A. Fischer and M. Muhler, ChemCatChem, 2010, 2, 214–222 CrossRef CAS.
- A. Rittermeier, S. Miao, M. K. Schröter, X. Zhang, M. W. van den Berg, S. Kundu, Y. Wang, S. Schimpf, E. Löffler and R. A. Fischer, Phys. Chem. Chem. Phys., 2009, 11, 8358–8366 RSC.
- M. K. Schröter, L. Khodeir, M. W. van den Berg, T. Hikov, M. Cokoja, S. Miao, W. Grünert, M. Muhler and R. A. Fischer, Chem. Commun., 2006, 2498–2500 RSC.
- M. A. Sliem, S. Turner, D. Heeskens, S. B. Kalidindi, G. V. Tendeloo, M. Muhler and R. A. Fischer, Phys. Chem. Chem. Phys., 2012, 14, 8170–8178 RSC.
- D. Astruc, F. Lu and J. R. Aranzaes, Angew. Chem., Int. Ed., 2005, 44, 7852–7872 CrossRef CAS PubMed.
- S. Lee and A. Sardesai, Top. Catal., 2005, 32, 197–207 CrossRef CAS.
- N. J. Brown, A. García-Trenco, J. Weiner, E. R. White, M. Allinson, Y. Chen, P. P. Wells, E. K. Gibson, K. Hellgardt, M. S. P. Shaffer and C. K. Williams, ACS Catal., 2015, 5, 2895–2902 CrossRef CAS.
- N. J. Brown, J. Weiner, K. Hellgardt, M. S. P. Shaffer and C. K. Williams, Chem. Commun., 2013, 49, 11074–11076 RSC.
- A. García-Trenco, E. R. White, M. S. P. Shaffer and C. K. Williams, Catal. Sci. Technol., 2016, 6, 4389–4397 Search PubMed.
- A. García-Trenco, E. R. White, A. Regoutz, D. J. Payne, M. S. P. Shaffer and C. K. Williams, ACS Catal., 2017, 7, 1186–1196 CrossRef.
- A. Le Valant, C. Comminges, C. Tisseraud, C. Canaff, L. Pinard and Y. Pouilloux, J. Catal., 2015, 324, 41–49 CrossRef CAS.
- E. Poels and D. Brands, Appl. Catal., A, 2000, 191, 83–96 CrossRef CAS.
- P. Haider, A. Urakawa, E. Schmidt and A. Baiker, J. Mol. Catal. A: Chem., 2009, 305, 161–169 CrossRef CAS.
- J. G. Smith and P. K. Jain, J. Am. Chem. Soc., 2016, 138, 6765–6773 CrossRef CAS PubMed.
- J. Owen, Science, 2015, 347, 615–616 CrossRef CAS PubMed.
- M. A. Boles, D. Ling, T. Hyeon and D. V. Talapin, Nat. Mater., 2016, 15, 141–153 CrossRef CAS PubMed.
- T. Chen and V. O. Rodionov, ACS Catal., 2016, 6, 4025–4033 CrossRef CAS.
- B. Wu, H. Huang, J. Yang, N. Zheng and G. Fu, Angew. Chem., Int. Ed., 2012, 51, 3440–3443 CrossRef CAS PubMed.
- G. Vilé, N. Almora-Barrios, S. Mitchell, N. López and J. Pérez-Ramírez, Chem. – Eur. J., 2014, 20, 5926–5937 CrossRef PubMed.
- S. Jones, J. Qu, K. Tedsree, X.-Q. Gong and S. C. E. Tsang, Angew. Chem., Int. Ed., 2012, 51, 11275–11278 CrossRef CAS PubMed.
- T. Taguchi, K. Isozaki and K. Miki, Adv. Mater., 2012, 24, 6462–6467 CrossRef CAS PubMed.
- K. B. Vu, K. V. Bukhryakov, D. H. Anjum and V. O. Rodionov, ACS Catal., 2015, 5, 2529–2533 CrossRef CAS.
- S. D. Pike, E. R. White, A. Regoutz, N. Sammy, D. J. Payne, C. K. Williams and M. S. P. Shaffer, ACS Nano, 2017, 11, 2714–2723 CrossRef CAS PubMed.
- S. D. Pike, E. R. White, M. S. P. Shaffer and C. K. Williams, Nat. Commun., 2016, 7, 13008 CrossRef CAS PubMed.
- K. L. Orchard, M. S. P. Shaffer and C. K. Williams, Chem. Mater., 2012, 24, 2443–2448 CrossRef CAS.
- A. Glaria, J. Cure, K. Piettre, Y. Coppel, C.-O. Turrin, B. Chaudret and P. Fau, Chem. – Eur. J., 2015, 21, 1169–1178 CrossRef CAS PubMed.
- C. Barriere, K. Piettre, V. Latour, O. Margeat, C.-O. Turrin, B. Chaudret and P. Fau, J. Mater. Chem., 2012, 22, 2279–2285 RSC.
- I. P. Silverwood, C. W. Keyworth, N. J. Brown, M. S. P. Shaffer, C. K. Williams, K. Hellgardt, G. H. Kelsall and S. G. Kazarian, Appl. Spectrosc., 2014, 68, 88–94 CrossRef CAS PubMed.
- X.-M. Liu, G. Q. Lu, Z.-F. Yan and J. Beltramini, Ind. Eng. Chem. Res., 2003, 42, 6518–6530 CrossRef CAS.
- S. Lee and A. Sardesai, Top. Catal., 2005, 32, 197–207 CrossRef CAS.
- N. J. Brown, A. García-Trenco, J. Weiner, E. R. White, M. Allinson, Y. Chen, P. P. Wells, E. K. Gibson, K. Hellgardt and M. S. Shaffer, ACS Catal., 2015, 5, 2895–2902 CrossRef CAS.
- A. Sawant, M. K. Ko, V. Parameswaran, S. Lee and C. J. Kulik, Fuel Sci. Technol. Int., 1987, 5, 77–88 CrossRef CAS.
- C. Baltes, S. Vukojević and F. Schüth, J. Catal., 2008, 258, 334–344 CrossRef CAS.
- G. Chinchen, K. Waugh and D. Whan, Appl. Catal., 1986, 25, 101–107 CrossRef CAS.
- R. van den Berg, G. Prieto, G. Korpershoek, L. I. van der Wal, A. J. van Bunningen, S. Lægsgaard-Jørgensen, P. E. de Jongh and K. P. de Jong, Nat. Commun., 2016, 7, 13057 CrossRef CAS PubMed.
- A. Karelovic and P. Ruiz, Catal. Sci. Technol., 2015, 5, 869–881 CAS.
- A. García-Trenco and A. Martínez, Catal. Today, 2013, 215, 152–161 CrossRef.
- R. Becker, H. Parala, F. Hipler, O. P. Tkachenko, K. V. Klementiev, W. Grünert, H. Wilmer, O. Hinrichsen, M. Muhler, A. Birkner, C. Wöll, S. Schäfer and R. A. Fischer, Angew. Chem., Int. Ed., 2004, 43, 2839–2842 CrossRef CAS PubMed.
- J. C. J. Bart and R. P. A. Sneeden, Catal. Today, 1987, 2, 1–124 CrossRef CAS.
- M. Behrens, F. Studt, I. Kasatkin, S. Kuehl, M. Haevecker, F. Abild-Pedersen, S. Zander, F. Girgsdies, P. Kurr, B.-L. Kniep, M. Tovar, R. W. Fischer, J. K. Norskov and R. Schloegl, Science, 2012, 336, 893–897 CrossRef CAS PubMed.
- C. Tisseraud, C. Comminges, T. Belin, H. Ahouari, A. Soualah, Y. Pouilloux and A. Le Valant, J. Catal., 2015, 330, 533–544 CrossRef CAS.
- J. Yoshihara and C. T. Campbell, J. Catal., 1996, 161, 776–782 CrossRef CAS.
- N. A. Koryabkina, A. A. Phatak, W. F. Ruettinger, R. J. Farrauto and F. H. Ribeiro, J. Catal., 2003, 217, 233–239 CAS.
- M. Behrens, Angew. Chem., Int. Ed., 2016, 55, 14906–14908 CrossRef CAS PubMed.
- O. Peña-Rodríguez and U. Pal, J. Opt. Soc. Am. B, 2011, 28, 2735–2739 CrossRef.
- K. P. Rice, E. J. Walker, M. P. Stoykovich and A. E. Saunders, J. Phys. Chem. C, 2011, 115, 1793–1799 CAS.
- T. Lunkenbein, J. Schumann, M. Behrens, R. Schlögl and M. G. Willinger, Angew. Chem., Int. Ed., 2015, 54, 4544–4548 CrossRef CAS PubMed.
Footnotes |
| † Electronic supplementary information (ESI) available. See DOI: 10.1039/c7cy01191a |
| ‡ Joint contribution from these authors. |
| This journal is © The Royal Society of Chemistry 2017 |