 Open Access Article
Creative Commons Attribution 3.0 Unported Licence
Effect of O2, CO2 and N2O on Ni–Mo/Al2O3 catalyst oxygen mobility in n-butane activation and conversion to 1,3-butadiene†
Venkata D. B. C.
Dasireddy
 *,
Matej
Huš
and
Blaž
Likozar
Department of Catalysis and Chemical Reaction Engineering, National Institute of Chemistry, Hajdrihova 19, 1001, Ljubljana, Slovenia. E-mail: dasireddy@ki.si; Fax: +386 1 4760300; Tel: +386 1 4760224
First published on 21st June 2017
Abstract
A commercial heterogeneous Ni–Mo/Al2O3 catalyst was tested for the oxidative dehydrogenation (ODH) reaction of n-butane with different oxidant species: O2, CO2 and N2O. The effect of the lattice oxygen mobility and storage in Ni–Mo/Al2O3 on catalytic conversion performance was investigated. Experiments indicated that a high O2-storage/release is beneficial for activity, however at the expense of selectivity. A significant amount of butadiene with no oxygenated compound products was formed upon using carbon dioxide and nitrous oxide, while O2 favoured the formation of cracked hydrocarbon chains and COx. The highest turnover yield to 1,3-butadiene was achieved at an oxidant-to-butane molar ratio of 2![[thin space (1/6-em)]](https://www.rsc.org/images/entities/char_2009.gif) :
:![[thin space (1/6-em)]](https://www.rsc.org/images/entities/char_2009.gif) 1 at temperatures of 350 °C and 450 °C. With CO2, significant amounts of hydrogen and carbon monoxide have evolved due to a parallel reforming pathway. Partial nickel/molybdenum oxidation was also observed under CO2 and N2O atmospheres. TPR revealed the transformation of the high valence oxides into structurally distinct metal sub-oxides. In TPRO, three distinct peaks were visible and ascribed to surface oxygen sites and two framework positions. With N2O, these peaks shifted towards a lower temperature region, indicating better diffusional accessibility and easier bulk-to-surface migration. XRD revealed the presence of an α-NiMoO4 active phase, which was used in DFT modelling as a (110) plane. Theoretical ab initio calculations elucidated fundamentally different reactive chemical intermediates when using CO2/N2O or O2 as the oxidant. The former molecules promote Mo atom oxygen termination, while in an O2 environment, Ni is also oxygenated. Consequently, CO2 and N2O selectively dehydrogenate C4H10 through serial hydrogen abstraction: butane → butyl → 1-butene → 1-butene-3-nyl → butadiene. With O2, butane is firstly transformed into butanol and then to butanal, which are prone to subsequent C–C bond cleavage. The latter is mirrored in different mechanisms and rate-determining steps, which are essential for efficient butadiene monomer process productivity and the optimisation thereof.
1 at temperatures of 350 °C and 450 °C. With CO2, significant amounts of hydrogen and carbon monoxide have evolved due to a parallel reforming pathway. Partial nickel/molybdenum oxidation was also observed under CO2 and N2O atmospheres. TPR revealed the transformation of the high valence oxides into structurally distinct metal sub-oxides. In TPRO, three distinct peaks were visible and ascribed to surface oxygen sites and two framework positions. With N2O, these peaks shifted towards a lower temperature region, indicating better diffusional accessibility and easier bulk-to-surface migration. XRD revealed the presence of an α-NiMoO4 active phase, which was used in DFT modelling as a (110) plane. Theoretical ab initio calculations elucidated fundamentally different reactive chemical intermediates when using CO2/N2O or O2 as the oxidant. The former molecules promote Mo atom oxygen termination, while in an O2 environment, Ni is also oxygenated. Consequently, CO2 and N2O selectively dehydrogenate C4H10 through serial hydrogen abstraction: butane → butyl → 1-butene → 1-butene-3-nyl → butadiene. With O2, butane is firstly transformed into butanol and then to butanal, which are prone to subsequent C–C bond cleavage. The latter is mirrored in different mechanisms and rate-determining steps, which are essential for efficient butadiene monomer process productivity and the optimisation thereof.
1 Introduction
One of the main tasks of the chemical industry today is the production of large amounts of organic compounds.1 Mono-olefins and di-olefins (butenes, butadiene, etc.) are extensively used in various chemical processes for the production of synthetic resins, plastics, and other valuable products.2,3 Nowadays, it is desirable to find substitute procedures for the production of these compounds from more economically suitable raw materials and with lesser impacts on the environment.4 The major industrial process for the production of mono-olefins and di-olefins has a drawback of producing other raw materials, such as ethylene, propylene, and isobutene in high quantities.5,6 Direct dehydrogenation of n-butane is an endothermic reaction that requires relatively high temperatures in order to obtain high yields of butenes and butadiene.7 High reaction temperature favours thermal cracking reactions, production of lower alkanes and coke formation, resulting in a decreased product yield and catalyst deactivation.8 On the other hand, oxidative dehydrogenation (ODH) of n-butane usually gives a lower yield of coke and cracking products because the reaction is exothermic.9,10Recent studies have focused on ODH of n-butane for producing butenes and butadiene (BD).2,7,8,11 ODH of butenes can efficiently produce BD in high yields.9,12 Molybdenum-based catalysts have been widely used for many selective oxidation reactions, especially the oxidation of butanes to butadiene.13 In particular, NiMoO4 shows potential for ODH of lighter paraffins, ethane, propane and n-butane.8,14
Recently, metal molybdates have been proposed as selective catalysts for oxy-dehydrogenation reactions,15,16 although they show lower catalytic activity than vanadium-containing catalysts.17,18 On the other hand, the ODH of short-chain alkanes on V-containing catalysts has been demonstrated to depend on the nature of the support.13,19 Basic supports seem to be preferable for n-butane or propane,7,8,13 whereas acid supports are more appropriate for obtaining ethylene from ethane.20,21 In all cases, γ-Al2O3 (with a surface area ranging 150–210 m2 g−1) was used.22,23 Mesoporous alumina was used as a support of vanadium oxide in the ODH of ethane,19,22 showing high productivity towards ethylene as a consequence of a remarkable dispersion of vanadium on the support surface. However, an even better metal dispersion can be achieved using γ-Al2O3 as the support,8,12,16,18,24 which makes it more interesting for use in ODH of n-butane.
To the best of our knowledge, only the ODH of butane using O2 or air as the oxidant has been reported in the literature and patents.5,25 Due to the strong oxidative capacity of oxygen, the reported BD selectivity is not as high as desired. CO2 and N2O have been reported to be soft oxidants for ODH of light alkanes.26,27 The use of these soft oxidants has several benefits over molecular oxygen, such as minimising the total oxidation reaction, further improving the selectivity towards partially oxidized products, increasing the process's safety by reducing the explosion risk and using up N2O and CO2, which are major greenhouse gases in the atmosphere.4,26,27 Recently, Fe2O3/Al2O3 catalysts have been used for ODH of 1-butene using CO2 as a soft oxidant.27 It has been found that CO2 is essential in the activation of 1-butene over the Fe2O3 catalysts and thus BD production. N2O has also been used as an oxidant in the ODH of propane over NiMoO4 catalysts,26 with a small concentration of N2O leading to an increase in the selectivity and propylene yields.
Based on these findings, in this work a commercial Ni–Mo on γ-Al2O3 catalyst was tested for the ODH of butane in the presence of O2, CO2 and N2O. TPRO (temperature programmed re-oxidation) experiments were carried out to determine the oxygen properties of the catalyst. The effect of the oxygen capacity and acidity of the catalyst on the catalytic performance was then discussed. The experimental results were supported by theoretical DFT calculations.
2 Experimental
A Ni–Mo commercial catalyst with a Ni and Mo wt% of 1.8 and 6.5 on an alumina support was used for the reactions. Physisorption analyses were carried out by degassing the catalysts under a N2 flow for 2 h at 200 °C. The degassed samples were analysed in a Micromeritics ASAP 2020. Temperature programmed reduction (TPR) was performed with a Micromeritics 2920 AutoChem II chemisorption analyser. Prior to the reduction of the sample in TPR, the catalyst was pre-treated by heating under a stream of argon (30 mL min−1) at 400 °C for 30 min and then cooled to 80 °C. Thereafter, 4.9% hydrogen in argon was used as a reducing agent at a flow rate of 30 mL min−1. The samples were analysed from room temperature to 700 °C at a ramp rate of 10 °C min−1. In order to determine the oxygen capacity and oxygen mobility of the catalysts, temperature programmed re-oxidation (TPRO) experiments were carried out. For TPRO experiment, each catalyst was reduced by n-butane (5% n-butane in He) at a flow rate of 30 mL min−1 at 500 °C for 2 h in the absence of oxygen feed in order for the lattice oxygen from the catalyst to be consumed. After that the temperature was lowered to 60 °C and an appropriate oxidant (10% O2 in He, 10% N2O in He, or 10% CO2 in He) at a flow rate of 30 mL min−1 was passed through the catalyst, while the temperature was raised to 700 °C at a heating rate of 10 °C min−1. The amount of oxidant consumed was measured using a thermal conductivity detector.Metal dispersion on the surface of the catalyst was measured with oxygen pulse chemisorption using a Micromeritics AutoChemII 2920. The samples (200 mg), placed in a U-shaped quartz reactor with an inner diameter of 0.5 cm, were pre-treated under 5% H2 in Ar at a temperature of 350 °C for 2 h. Then, the catalyst was cooled down to 80 °C in a He flow of 50 mL min−1 and kept at this temperature for 3 h before being heated to the desired temperature for chemisorption. This was performed in order to clean the catalyst surface and to remove any residual adsorbed hydrogen. Oxygen pulse chemisorption was performed at a temperature of 350 °C. The volume of the injection loop was 0.5 cm3, the carrier gas was Ar and pulses of O2 (5.0% O2 in Ar), injected in the catalytic reactor, corresponded to 0.5 μmol of O2. The O2 consumption was measured with the same TCD that was used for TPR, but equipped with a water trap. The pulse injection and sample temperature were controlled and the TCD signals monitored using a computer equipped with the Micromeritics AutoChemII software. TCD data were analysed using the Origin program suite.
Powder X-ray diffraction (XRD) studies were conducted using a PANalytical X'Pert Pro instrument. Scans from 10 to 90° were carried out using a Cu/Kα radiation source with a wavelength of 1.5406 Å. The particle size, morphology and elemental mapping, determined by EDXS analysis, were further investigated using a Cs-corrected scanning transmission electron microscope (TEM) (JEOL, JEM-ARM200CF), equipped with a JEOL Centurio 100 mm2 EDXS system.
The oxidative dehydrogenation (ODH) of n-butane was carried out in a vertical fixed-bed U-shaped quartz reactor (100 cm length and 1.5 cm ID). An electric furnace fitted with a temperature-programmed controller heated the reactor and the reactor temperature was monitored using a K-type thermocouple. The gas flow rates were measured and controlled by Brooks mass flow controllers. Prior to reaction, each catalyst was pre-treated in situ with a He flow (50 mL min−1) at 400 °C for 1 h. The reaction was carried out at different temperatures from 250 to 550 °C, with steps of 50 °C. The oxidant-to-butane molar ratio (O2, CO2, or N2O) was varied from 1 to 2.75. The experiments were conducted at varying W/F ratio (0.1 to 0.7) at a fixed oxidant-to-butane ratio of 2.0 and a temperature of 450 °C. Outlet gases, including butenes, butadiene (BD), cracked products (mainly propane and ethane), CO, CO2, H2 and H2O were analysed by online quadrupole mass spectrometry (MS). All catalytic tests were carried out in duplicate and the values obtained for CO conversion showed a standard deviation below 3.0%. The conversion of n-butane and product selectivity were calculated from the mole fraction of products in the outflow as shown in the ESI.†28 Carbon mass balances ranged between 96–99% and all data points were obtained in duplicate with a standard deviation of ±2%.
Mass transport and heat transfer calculations were carried out for the highest rates for the reactions with CO2, N2O and O2 as shown by Oyama et al.29 The Mears criterion for the external diffusion  gave a value of 3.12 × 10⁻⁴ for O2, 2.85 × 10⁻⁴ for CO2 and 1.72 × 10⁻⁴ for N2O which are less than 0.15. The Weisz–Prater criterion,
  , gave a value of 4.9 × 10⁻⁴ for O2, 4.07 × 10⁻⁴ for CO2 and 2.28 × 10⁻⁴ for N2O which are less than 1, indicating no diffusion limitations.30 The full calculation for the Mears criterion for external diffusion, Weisz–Prater criterion and Mears criterion for combined interphase and intraparticle heat and mass transport is given in the ESI.† The values obtained through these calculations indicate that no interphase and intraparticle heat transfer or mass transport limitations are involved in the present study.31,32
3 Theoretical
Plane-wave density functional calculations (DFT) were carried out using a Quantum Espresso program,33 using an open-source PWscf code to calculate the electronic structure and energies. Electron–ion-core interactions were described with a projector augmented wave (PAW) method34 with the generalized gradient approximation (GGA) exchange potential of Perdew, Burke and Ernzerhof (PBE).35 A kinetic energy cutoff of 550 eV and electron density cut-off which is eight times as large were found to be sufficient to obtain accurate results, as proved by convergence testing. Large cutoffs were needed as oxygen atoms require very large basis sets to converge. Dispersion effects were included semi-empirically via the DFT-D2 method of Grimme.36,37 Since the PBE approach is known to overbind the oxygen molecule, the energy of isolated O2 molecule was corrected by ΔE(O2) = −1.59 eV resulting in an experimentally determined bond energy of −5.15 eV, which is a standard procedure.4 Results and discussion
The Ni and Mo wt% are 1.7 and 6.3, respectively, obtained from elemental analysis. This is in agreement with the nominal wt% of Ni and Mo on the alumina support. No presence of phosphate, which is sometimes used as a promoter, was detected. The surface area of the catalyst was 154 m2 g−1 as measured by a N2 physisorption method. This is lower than the surface area of γ-Al2O3 (225 m2 g−1), which could be due to blockage of the pores of alumina by Ni and Mo. This is corroborated by the total metal dispersion, which was measured to be 38 ± 2% in the oxygen pulse chemisorption experiment. The surface concentration of Ni and Mo was 0.4 mmol NiO g−1 and 1.042 mmol MoO3 g−1 and the numbers of Ni and Mo atoms are 2.5 × 10²⁰ and 6.3 × 10²⁰. This catalyst is active and selective in the ODH of n-butane with oxygen. The main reaction products identified in the reaction mixture were butenes, butadiene, cracked products (ethane and propane) and carbon oxides. There were no other products, such as acetaldehyde, maleic anhydride, other oxygenates or products of significant catalyst coking when using the O2 oxidant. The homogeneous conversion of n-butane without the catalyst is about 0.1% at 450 °C, which is markedly lower than the conversions obtained with the catalyst.4.1 Oxidant-to-butane ratio
The product distribution is given as a function of the oxygen-to-butane ratio at temperatures of 350 °C and 450 °C. The highest selectivity towards BD was achieved at a molar ratio of 2.0 at both temperatures (Fig. 1). Selectivity towards BD was low, while the amount of CO2 formed increases with temperature, which may be due to the increase of coke deposition at lower oxygen-to-butane molar ratios.2 At lower oxygen-to-butane molar ratios, more oxygen is used to burn the coke deposited on the catalyst surface, leaving no oxygen available for ODH. Increased conversion at higher oxygen-to-butane molar ratios can be attributed to the participation of oxygen in the oxidation of n-butane and the intermediates, increasing the amount of carbon oxides formed and decreasing the selectivity towards BD.8 The amount of butenes formed decreases much more slowly with increased oxygen-to-butane molar ratios.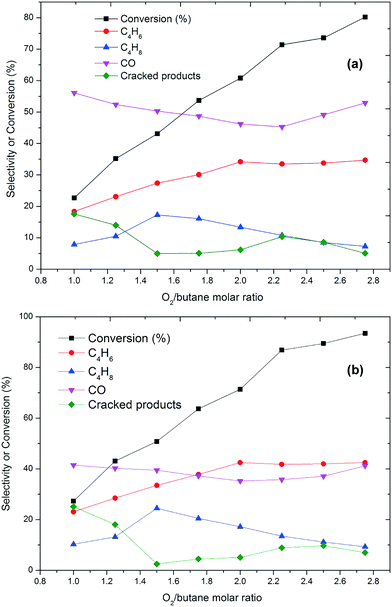 | ||
| Fig. 1 Conversion and selectivity as a function of the O2/butane molar ratio at (a) 350 °C and (b) 450 °C (GHSV = 6000 h−1). Carbon mass balances range between 97–99%. | ||
At a higher temperature, i.e. 450 °C, an oxygen-to-butane molar ratio of 2.0 led to the highest selectivity towards BD being 42%, which is higher than 34% at 350 °C (Fig. 1). The amount of carbon oxides formed is lower at higher oxygen-to-butane ratios, suggesting that ODH of butane is favoured at higher temperatures, which is also supported by the higher conversion. Formation of cracked products is not favourable, being especially low for oxygen-to-butane molar ratios of 1.5 to 2.2. They form more readily at 450 °C than at 350 °C, which is probably due to the thermal cracking of the intermediates formed in the ODH of n-butane (Fig. 1). Higher selectivity towards the cracked products at low oxygen-to-butane molar ratios can be attributed to the oxidative cracking of butane or butene isomers (Fig. 1). At both temperatures, the catalyst showed a steady state for more than 72 h at an oxygen-to-butane molar ratio of 2.0.
After evaluating the catalytic activity of the catalyst in the presence of oxygen, the ODH of butane with CO2 as the oxidant was performed at temperatures of 350 °C and 450 °C. At both temperatures, the catalyst showed higher selectivity towards BD compared to oxygen (Fig. 2). A very low conversion (<10%) of n-butane was obtained, showing that n-butane is not directly oxidised in the presence of CO2 but may undergo an oxidative cracking mechanism. This argument also supported by a high selectivity towards the cracked products at a low CO2-to-butane molar ratio (Fig. 2). Low amounts of butane and butadiene were detected at low CO2-to-butane molar ratios despite the fact that C–H bond dissociation can occur on the molybdenum metal.38 In the presence of CO2, significant amounts of hydrogen and CO are formed. Aside from a dehydrogenation reaction, a CO2 reforming reaction can also take place. Hence the results obtained from the ODH of n-butane with CO2 indicate that by using CO2 a new route of reaction is available, namely the formation of hydrogen and CO.39 Of course, CO2 can be converted to CO via reverse water-gas shift reaction by consuming the H2 formed through dehydrogenation.40 As the CO2-to-butane molar ratio increases, the catalytic activity increases, as well as the amount of CO and H2 formed. Butane reactivity studies with CO2 reveal that the activity of the catalyst also depends on the nature of the oxidant and the amount of oxidant present in the feed (Fig. 2).
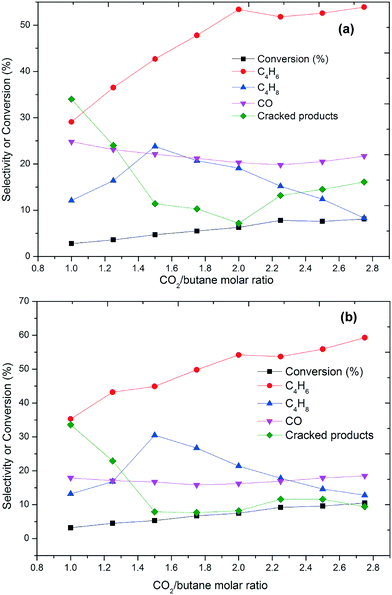 | ||
| Fig. 2 Conversion and selectivity as a function of CO2/butane molar ratio at (a) 350 °C and (b) 450 °C (GHSV = 6000 h−1). Carbon mass balances range between 96–99%. | ||
The effect of the oxidative environment on the ODH of butane at various N2O-to-butane molar ratios is shown in Fig. 3. With N2O, the main products are butenes and butadiene, while the amount of formed carbon oxides is low. The conversion is low compared to using O2 and increased from 2 to 9% as the N2O-to-butane molar ratio increased from 1 to 2.8. This is accompanied by an increasing selectivity towards butadiene (Fig. 3). No molecular oxygen was detected in the effluent gas in these experiments, which evidences the high reactivity of oxygen species. At both temperatures, the conversion of butane increases dramatically with increasing N2O-to-butane ratio up to 2.0. As this ratio is further increased, conversion and selectivity towards BD only marginally increase.
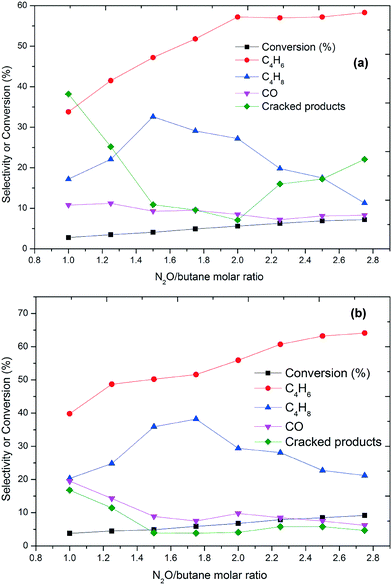 | ||
| Fig. 3 Conversion and selectivity as a function of the N2O/butane molar ratio at (a) 350 °C and (b) 450 °C (GHSV = 6000 h−1). Carbon mass balances range between 96–99%. | ||
4.2 Flow-rate
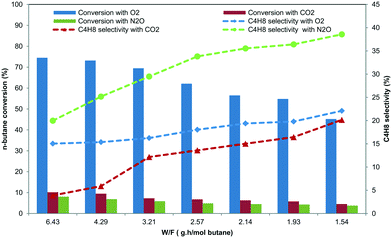
The flow rate of feed gas is an important parameter in catalytic reactions that warrants additional attention. The Ni–Mo/Al2O3 catalyst was tested under different weight-to-flow velocities at 450 °C. With increasing W/F, the butane conversion exhibits an increase and the selectivity towards BD also increases in all oxidative atmospheres (Fig. 4). Similar BD selectivities observed suggest that surface ODH is a relatively slow reaction, favoured from high to low W/F. In contrast, selectivity to both trans-2-butene and cis-2-butene monotonically increases as W/F increases, clearly proving that isomerisation of 2-butenes is a fast reaction.41 However, the isomerisation to isobutene seems to be a relatively slow reaction, since a low flow rate favours its formation. As expected, formation of coke is concomitantly suppressed as W/F increases.42 The coke content on the used catalysts seems to correlate well with the BD selectivity, suggesting that BD may be a coke precursor, thereby promoting coke formation (Table 1). Among the oxidants used, the catalyst used with the N2O oxidant showed a high amount of formed coke (18%) on the surface of the catalyst which was measured by TOC analysis.4.3 Oxygen species
The comparison of runs of butane oxidative dehydrogenation by different oxidizing agents, i.e. O2, N2O and CO2 at 450 °C, is summarized in Table 1. It can be clearly seen that the substitution of O2 with N2O leads to a substantial increase in the selectivity to butadiene from 25% to 61%. The higher selectivity to butadiene in the presence of N2O was also observed over the Ni–Mo/Al2O3 catalyst. On the other hand, fewer carbon oxides were observed. The differences between runs with different oxidizing agents are caused by the different natures of the oxygen species formed on the catalyst surface. The active species in oxidative dehydrogenation with oxygen is the O2− ion, which is less selective and supports the total and incomplete combustion of hydrocarbons, in contrast to the oxygen species formed upon decomposition of nitrous oxide.1,43,44 Most authors consider the O− radical or neutral atomic oxygen to be the active oxidizing species in the presence of N2O. These oxygen species govern the activity and selectivity in the dehydrogenation step.When using O2 as the oxidant, there is a negligible amount of H2 formed as any would be instantly consumed by the oxygen. When using N2O and CO2 as oxidants, some hydrogen is formed as the two are weaker oxidants. Hydrogen can form via water-gas shift reaction from H2O, which is formed during butane oxidation, and a side product CO.
In the literature,1,13,39,45 it was reported that the reaction of C1–C4 alkanes with O− gives significant amounts of olefins, but no oxygenated products over transition metal oxides. The remarkable selectivity of N2O relates to a particular state of the anion radical oxygen species Oα− which is named α-oxygen.1,46 N2O forms α-sites on the surface of the catalysts, but cannot form an O2 site. It is assumed that oxygen, upon adsorption on the catalyst surface can accept electrons one by one until transforming into a fully reduced form.47 Oxygen species may differ not only in charge but also in coordination, bond energy, etc. In general, molybdate catalysts contain terminal oxygen species, leading to a conclusion that the doubly bonded lattice oxygen is responsible for selective oxidation.1,46,48 Selective oxidation is provided by strongly bonded lattice oxygen having a nucleophilic nature, and complete oxidation is provided by weakly bonded reactive oxygen having an electrophilic nature.26,48 Under the conditions employed in the present study, we couldn't distinguish between the different oxidation species available on the catalyst surface. Therefore, one cannot exclude that the lattice oxygen may react via its preliminary conversion into a more reactive form i.e. O− radical species.1,26,48
The reaction with oxygen as the oxidant showed a higher butane TOF compared to the reactions with CO2 and N2O as oxidants (Table 2). The obtained TOF over the Ni–Mo/Al2O3 catalyst in the present study is higher compared to those of other catalytic systems (ESI,† Table S1). Thus, the anion radical oxygen species (α-oxygen) are the selective oxygen species for the production of butadiene from butane as observed by the productivity of the reaction which used N2O as the oxidant.
4.4 Mars–van Krevelen mechanism
The oxidative dehydrogenation of n-butane to butenes and 1,3-butadiene follows the Mars–van Krevelen mechanism, as also reported by several researchers.2,7,8,38 In this mechanism, chemisorption of n-butane, activation of C–H bonds, and abstraction of hydrogen from n-butane to form an alkyl radical–metal cation intermediate are important steps in the oxidative dehydrogenation of n-butane.27,49,50 The rates of ODH are enhanced if the cation present in the catalyst is a weak acid and can be reduced by two electrons transferred from C–H bonds. Additionally, a high concentration of surface oxygen can also enhance the rate of ODH.7,8,13 This suggests that the oxygen properties and the acid properties of the catalyst play very important roles in the oxidative dehydrogenation of n-butane. Considering the mechanism of n-butane activation reported by various researchers,2,9,13,39,51,52 it can be inferred that the amount of oxygen in the catalyst involved in the reaction (oxygen capacity) may serve as a crucial factor for determining the catalytic performance, while the intrinsic mobility of oxygen in the catalyst involved in the reaction (oxygen mobility) may affect the working regeneration cycles of the catalyst during the reaction. However, to the best of our knowledge, systematic research to see the influence of oxygen capacity and mobility of the catalyst on the oxidative dehydrogenation of n-butane has not been endeavoured yet.4.5 Catalyst characterisation
Oxidative dehydrogenation of alkanes is considered to proceed by a redox mechanism in which the reducibility of the active sites is a key factor for the catalyst activity.53 In order to measure the reducibility of Ni and Mo species and determine the metal oxide support interaction, TPR analyses were performed under 5% H2 in Ar and 5% butane in He. In both reducing atmospheres the catalyst exhibited similar reduction behaviours with the Tmax of hydrogen consumption between 400–460 °C. The catalyst was reduced at lower temperatures under butane, which is probably due to the strong reducing nature of butane compared to hydrogen.13,52,54 The TPR profiles indicate that the surface species on alumina widely modified the reduction behaviour of molybdenum and nickel oxides. Usually, the reduction of supported MoO3 species occurs in several steps,13 while the reduction of NiO occurs above 500 °C.55 The single peak at low temperatures (<500 °C) can be due to the partial reduction of molybdenum along with NiO.53,55,56 The aggregated MoO3 may also promote Ni intermediate reducible species of Ni and Mo, which may also occur in a single step reduction. It was also reported56,57 that the Ni–Mo active phase over various supports is reduced at lower temperatures (<500 °C) and exhibited a single reduction peak (<500 °C), which is in agreement with the observations in our work. The reducibility of the catalyst is 89% and 51% under n-butane and hydrogen, respectively. The XPS spectra of the fresh catalyst shows only Mo6+ species with Mo 3d5/2 and Mo 3d3/2 binding energies at 233.1 and 236.2 eV, respectively. After reduction with n-butane, the catalyst shows Mo species with 3d5/2 binding energies for Mo5+ and Mo4+ species at 231.2 and 229.0 eV, respectively (ESI,† Fig. S1). In addition to this, the XPS profile of the fresh catalyst showed Ni peaks which can be assigned to Ni2+ in NiO species, with Ni 2p3/2 binding energies appearing at 854 eV. After reduction, this peak shifted to 853 eV, which represented the formation of Ni0 after reduction.However, the interactions of the support depend on different parameters, such as the isoelectric point of the support and the number of hydroxyl groups present on the surface of the support. According to Bañares,58 there is some disagreement arising from the fact that some reports show correlation between catalytic activity and bulk reducibility of the molybdate catalyst, which may differ significantly from that of the surface sites and lead to different conclusions. TPR studies performed in this work showed no correlation between bulk reducibility and activity of the catalyst. In this study, the TPR profiles reflect the structural transformation of the starting high valence oxides into structurally distinct suboxides. Numerous investigations59–61 claim that what could have a major effect on the activity in oxidative dehydrogenation is the re-oxidation and not the reduction of the catalyst under reaction conditions.
It has been reported in the literature7,38,48,49 that the oxygen capacity and oxygen mobility of the catalyst serve as crucial factors for determining the catalytic performance in oxidative dehydrogenation of n-butane. In order to investigate the effect of various oxidants on the oxygen properties of the catalyst, TPRO experiments were carried out, where we tried to correlate the catalytic performance under different oxygen sources with the oxygen capacity of the catalyst. In the TPRO experiment, the TPRO peak temperature and TPRO peak area reflect the oxygen mobility and the oxygen capacity, respectively.50,60,61 A lower TPRO peak temperature (<350 °C) and a larger TPRO peak area correspond to a higher oxygen mobility and a larger oxygen capacity, respectively. Fig. 5b shows the TPRO profile of the catalyst under various oxygen sources. The three peaks in the range of 150 to 450 °C under an oxygen atmosphere specify that in an oxygen environment the reduced catalyst undergoes a step-wise re-oxidation (Mo4+ → Mo6+). The first peak can be ascribed to the surface oxygen sites of the catalyst, while the other two peaks can be attributed to the fraction of lattice oxygens on the surface of the catalyst.62 Under a CO2 atmosphere, it was found that there is a broad peak observed in the temperature range 80–450 °C, which indicates much adsorption and high activation ability of CO2 on the surface of the catalyst.39,63 In general, the peak shift towards lower temperatures indicates superior accessibility of the lattice oxygen. The peak shift towards lower temperatures was observed in the TPRO profile under a N2O atmosphere along with a shoulder peak in the range of 250–350 °C, suggesting that N2O has a stronger adsorption capability on the surface of the catalyst and it facilitates easier migration of lattice oxygen from the bulk to the surface to complete the oxidation process.43,62 The degree of reduction is 84% in the case of O2, 51% in the case of CO2 and 61% in the case of N2O. The XPS spectra of the re-oxidised catalyst (with O2) showed Mo6+ species with Mo 3d5/2 and Mo 3d3/2 binding energies at 233.8 and 236.7 eV, respectively (ESI,† Fig. S1). The spectra were deconvoluted using the constraint of having equal spin–orbit splitting of Mo 3d peaks, and it showed that most of the Mo species are in the +6 oxidation state (∼68%).
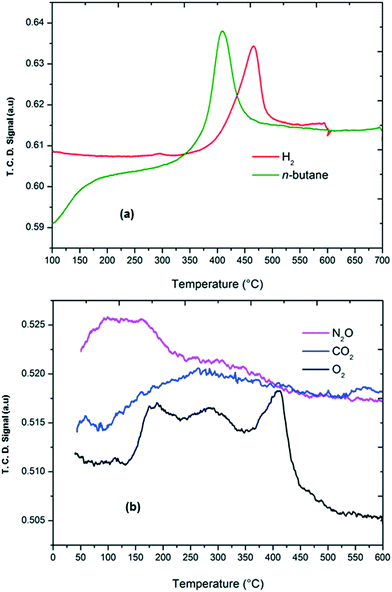 | ||
| Fig. 5 (a) TPR profile of the Ni–Mo catalyst under H2 and n-butane/Al2O3 atmospheres (b) and TPRO profile of the Ni–Mo/Al2O3 catalyst under O2, N2O and CO2 atmospheres. | ||
Among the oxidants used in this study, N2O showed an important difference in the catalytic performance. The observation made from both catalytic testing and TPRO experiments is that when N2O interacts with nickel molybdate catalysts, modification in the nature of the sites on the surface of the catalysts occurs. When O2 is the oxidant, the number of re-oxidised sites is larger than those observed in the presence of N2O. In other words, the surface of the catalysts is in a higher oxidation state in the presence of O2. Multiple peaks in a broad temperature range observed in the TPRO profile are in agreement with this. In contrast, the oxidation state of the surface is limited in the presence of N2O. These results suggest that under the reaction conditions, N2O inhibits the total oxidation of the catalyst.
To investigate the rates of reduction and oxidation a series of experiments at various heating rates were conducted (ESI,† 4). The rate of reduction (in the presence of 5% H2) was determined to be 2.4 × 10⁻⁷ mol g−1 s−1 which is similar to the rate of oxidation (in the presence of 5% O2) determined to be 2.1 × 10⁻⁷ mol g−1 s−1. The lower rate of oxidation could be due to the oxygen mobility in the Ni–Mo/Al2O3 catalyst. The activation energies were determined to be 110.3 kJ mol−1 for the reduction and 132.2 kJ mol−1 for the oxidation (ESI,† Fig. S2–S4). The similarity in the oxidation and reduction rates along with the TPRO profiles indicates that the oxidative dehydrogenation of n-butane to butenes and 1,3-butadiene over the Ni–Mo/Al2O3 catalyst follows the Mars–van Krevelen mechanism.
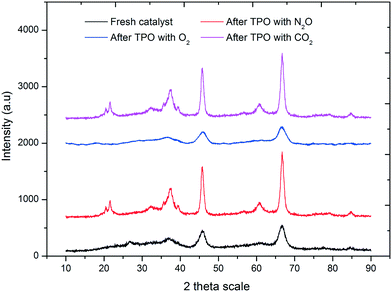
To investigate the phases present after re-oxidation under various atmospheres, powder XRD was performed. In the XRD profile of the present catalyst, two prominent diffraction peaks are observed in the 2θ range 46° and 67°, which can be assigned to γ-Al2O3. An amorphous peak at 37° indicates the presence of NiO. On the other hand, a lack of characteristic diffraction peaks for NiO at 43° and 67° indicates the presence of an amorphous phase or monocrystalline NiO phases (PDF card no. 47-1049). A similar pattern was observed for the diffraction peaks of MoO3. The amorphous peak at 26° indicates the presence of MoO3 (PDF card no. 65-2421). The other characteristic peaks at 39°, 46° and 66° were not observed clearly, which might be due to the presence of an amorphous or monocrystalline phase of molybdenum oxide.
After re-oxidation with O2, the catalyst showed a similar XRD pattern, which is supported by the TPRO profile, indicating that the surface oxygen species and the lattice oxygen species are completely redistributed into the catalyst after TPRO experiment. After TPRO with N2O and CO2, the catalyst showed an XRD pattern different from that observed with O2, with some additional peaks. The peaks at 23°, 32°, 38° and 62° indicate the formation of the NiMoO4 phase (PDF, card no. 9-175) on the surface of alumina after TPRO experiment. The enhancement of the peak intensities at 37°, 46° and 67° suggested the conversion of NiO and MoO3 to the NiMoO4 phase. The appearance of the peak at 23° with a shoulder indicates an overlap of the MoO3 and NiMoO4 phases. The enhancement in the characteristic peak intensity of NiO and MoO3 suggests the formation of crystalline oxide phases of Ni and Mo after oxidation with N2O and CO2. This could be due to the partial oxidation of metal oxides due to the low oxidation environment. In addition to the NiMoO4 phase, the increase in the peak intensities at 46° and 67° might be due to the formation of a stoichiometric NiAl2O4 spinel phase as well (Fig. 6).
4.6 Activation energy
The activation energies (EA) for the oxidative dehydrogenation of butane were determined through the Arrhenius equation in the temperature range from 250 °C to 550 °C. The activation energy depends on the oxidant used, as shown in Table 2. When using O2 as the oxidant, EA is 75 kJ mol−1. In CO2 and N2O atmospheres, however, EA is 161 and 112 kJ mol−1. Together with the noticeably different conversions and selectivities, this further proves that the reaction proceeds via a fundamentally different mechanism and rate-determining step in an O2 atmosphere.In an O2 atmosphere, we postulate the rate-determining step to be the re-oxidation of active sites on the catalyst, namely the formation of O–Mo and O–Ni species. Under milder conditions, e.g. when using N2O and CO2, the surface oxygen is less reactive and the rate-determining step is the abstraction of the first hydrogen atom from butane. This was further investigated and corroborated (vide infra) by DFT theoretical studies.
4.7 Density functional theory calculations
In DFT calculations, the active catalyst phase was modelled as a {110} facet of α-NiMoO4.64 In the bulk, Ni and Mo atoms are octahedrally coordinated with oxygen atoms. The {110} facet can be additionally oxygen-terminated on Mo atoms, Ni atoms, or both. We found that Mo atoms were oxygen-terminated regardless of the oxidant used, while Ni atoms are oxygen-terminated only in the presence of O2, but not with CO2 and N2O (see Fig. 7).
| α-NixMoxO4x{110} + N2O(g) → α-Nix(O)MoxO4x{110} + N2(g) ΔE = +0.19 eV |
| α-NixMoxO4x{110} + N2O(g) → α-NixMox(O)O4x{110} + N2(g) ΔE = −3.14 eV |
| α-NixMoxO4x{110} + CO2(g) → α-Nix(O)MoxO4x{110} + CO(g) ΔE = +3.63 eV |
| α-NixMoxO4x{110} + CO2(g) → α-NixMox(O)O4x{110} + CO(g) ΔE = +0.30 eV |
| α-NixMoxO4x{110} + CO2(g) → α-NixMox(O)O4x{110} + CO* ΔE = −0.19 eV |
This difference in surface composition has profound effects on the conversion and selectivity, as a fully oxygen-terminated facet favours oxidative decomposition of butane into cracked products and COx, while surfaces with only oxygen-terminated Mo atoms favour selective oxidation of butane into butenes and 1,3-butadiene, as shown below.
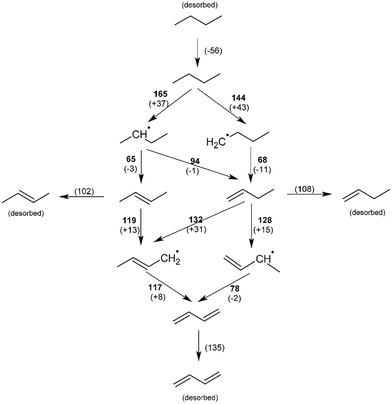
On the O–Mo terminated surface (in CO2 and N2O atmosphere), butane preferentially adsorbs in the groove between O–Mo groups, above Ni atoms (see Fig. 8). The energy of adsorption was calculated to be Eads = −0.58 eV (56 kJ mol−1). The activation energy for the abstraction of methyl hydrogen is +1.49 eV (144 kJ mol−1), while the abstraction of methylenic hydrogen is somewhat less likely with an energy barrier of +1.71 eV (165 kJ mol−1). These processes are the rate-determining steps with the values in good agreement with the experimental data from section 4.6. Further dehydrogenation steps lead first to the formation of 1-butene and 2-butene, which have similar activation energies for desorption and further dehydrogenation; thus all expected products were identified among the products. Ultimately, butadiene is formed. As shown in Fig. 9, the most likely pathway for the selective oxidation to butadiene is therefore CH3–CH2–CH2–CH3 → ˙CH2–CH2–CH2–CH3 → CH2![[double bond, length as m-dash]](https://www.rsc.org/images/entities/char_e001.gif) CH–CH2–CH3 → CH2
CH–CH2–CH3 → CH2![[double bond, length as m-dash]](https://www.rsc.org/images/entities/char_e001.gif) CH–CH˙–CH3 → CH2
CH–CH˙–CH3 → CH2![[double bond, length as m-dash]](https://www.rsc.org/images/entities/char_e001.gif) CH–CH
CH–CH![[double bond, length as m-dash]](https://www.rsc.org/images/entities/char_e001.gif) CH2.
CH2.
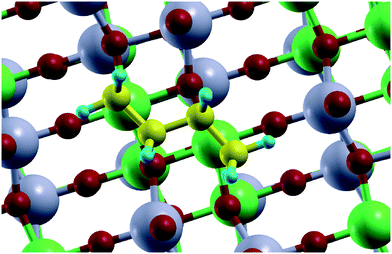 | ||
| Fig. 8 Adsorbed butane over the O–Mo terminated {110} facet of the NiMoO4 catalyst. Colour code: carbon – yellow, hydrogen – blue, oxygen – red, nickel – green, molybdenum – grey. | ||
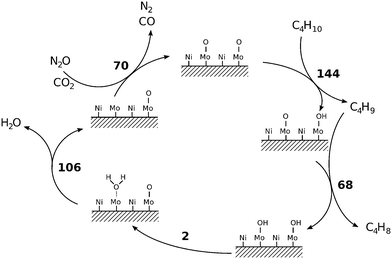
Abstraction of hydrogen atoms from the reactant results in the formation of OH groups on the catalyst, which is typical of the Mars–van Krevelen mechanism of catalysis (Fig. 10). Hydrogen atoms are extremely mobile on the surface; the activation barrier for the migration of hydrogen between two adjacent OH groups was found to be 0.02 eV (2 kJ mol−1). This results in the recovery of one oxygen site and the formation of adsorbed water molecule with an adsorption energy of −1.10 eV (106 kJ mol−1), which then desorbs. Oxygen vacancies are replenished with oxygen from the oxidant. The activation barrier for the reaction with N2O is 0.74 eV (71 kJ mol−1) and for CO2 is 0.73 eV (70 kJ mol−1), which is clearly not a rate-determining step.
When molecular oxygen is used as the oxidant, however, the barrier for vacancy replenishment drops to 0.64 eV (62 kJ mol−1) and leads to the non-negligible formation of both O–Mo and O–Ni surface species. The pathway for selective oxidation would remain as in Fig. 10, but a new pathway for total oxidation becomes possible. Such a fully oxygen-terminated surface shows much greater reactivity towards butane decomposition. Butane weakly physisorbs (Eads = −0.27 eV). It immediately reacts with surface O–Ni species into strongly bonded butan-1-ol (EA = 0.05 eV, ΔE = −3.57 eV) in a very exothermic reaction. Butan-1-ol then quickly decomposes into cracked products and COx. Hydroxyl hydrogen quickly migrates across the surface O–Ni groups (EA = 0.10 eV), yielding the butyloxidanyl radical (CH3CH2CH2CH2O˙). Subsequently, both hydrogen atoms are abstracted, yielding butanal (CH3CH2CH2CHO) and the butyloxidanyl radical (CH3CH2CH2CO˙) in the process with activation barriers of 0.25 eV (24 kJ mol−1) and 0.49 eV (48 kJ mol−1), respectively. The butyloxidanyl radical is prone to C–C bond cleavage, ultimately yielding cracked products and COx. These results support the experimental data.
Different surface species when using O2 (O–Ni and O–Mo) as the oxidant in comparison to using N2O and CO2 (only O–Mo) are responsible for the markedly different conversion and selectivity. Our calculations show the abstraction of the first hydrogen atom to be the rate-determining step in the selective oxidation of butane with an activation energy of 144 kJ mol−1. This is in good agreement with the experimental values of 161 kJ mol−1 and 112 kJ mol−1 when using N2O and CO2, respectively. CO2 is deemed a weaker oxidant on the account of having a higher activation energy, lower productivity, and lower butadiene/butenes ratio. Despite the same reaction mechanism postulated in DFT modelling, we aim to explain these differences by the different affinities of the surface for replenishing oxygen with CO2 (ΔE = −0.19 eV) and N2O (ΔE = −3.14 eV). In the case of N2O, all Mo atoms are believed to be oxygen-terminated, which might not be the case with CO2. Additionally, CO2 is converted into CO in the process, which can remain adsorbed on the catalyst, diminishing its active surface further.
A fully oxygen-terminated surface favours total oxidation of butane to cracked products and COx, as butane immediately and irreversibly transforms into butan-1-ol. The rate-determining step is the replenishment of the surface vacancies with oxygen, which has a calculated reaction barrier of 62 kJ mol−1, which is also in good agreement with the experimentally determined value of 75 kJ mol−1.
5 Conclusions
From our experimental and theoretical results, we conclude the following:1. CO2 and N2O are useful reagents for the oxidative dehydrogenation of n-butane over the Ni–Mo/Al2O3 catalyst, exhibiting advantageous selectivity over oxygen.
2. The most abundant product of selective oxidation was butadiene with productivity up to 0.89 gbutadiene gcat−1 h−1 when using N2O as the oxidant, 0.61 gbutadiene gcat−1 h−1 when using CO2 as the oxidant and 0.21 gbutadiene gcat−1 h−1 when using O2 as the oxidant. The cumulative selectivity of all C4 olefins was up to 80% when CO2 and N2O were used as oxidants.
3. Using soft oxidants like N2O and CO2 limits the formation of electrophilic oxygen species, which promote the oxidation of alkenes to carbon oxides, on the surface of the catalyst, thereby increasing the selectivity towards butadiene. The coke content on the used catalysts correlates well with the selectivity towards butadiene, suggesting that butadiene may be a coke precursor.
4. TPRO profiles showed that N2O had a stronger adsorption capability on the surface of the catalyst compared to CO2 and O2 and that it facilitates easier migration of lattice oxygen from the bulk to the surface to complete the oxidation process. After TPRO experiment with CO2 and N2O, partial oxidation of the catalyst was observed by XRD.
5. The experimentally determined activation energies (EA) with CO2 and N2O as oxidants, 161 and 112 kJ mol−1, respectively, are in good agreement with the theoretically predicted activation energy 144 kJ mol−1 for the abstraction of first hydrogen atom from butane, suggesting that this is the rate-determining step.
6. In an oxygen atmosphere, the experimentally determined activation energy is 75 kJ mol−1. This is in close agreement with the theoretically calculated value of 62 kJ mol−1 for the re-oxidation of the surface. The calculated activation barriers for the other steps are lower, confirming that the re-oxidation of the surface is the rate-determining step.
7. The calculated reaction barriers from DFT are in excellent agreement with the experimental data, proving the postulated reaction mechanism to be sound. Selective oxidation of butane to butenes and, ultimately, butadiene proceeds with the transfer of hydrogens to the O–Mo species on the catalyst. Total oxidation proceeds on a fully oxygen-terminated surface via O–Ni species and yields cracked products and COx. Typical for the Mars–van Krevelen mechanism, surface oxygen species (O–Mo and O–Ni) are recovered via recombination with two hydrogen atoms to water molecule, its desorption and the replenishment of the ensuing vacancy with oxygen from the gaseous oxidants (O2, N2O, or CO2).
Acknowledgements
The authors acknowledge financial support from the Slovenian Research Agency (research core funding No. P2-0152).References
- G. I. Panov, K. A. Dubkov and E. V. Starokon, Catal. Today, 2006, 117, 148–155 CrossRef CAS.
- G. P. Schindler, C. Walsdorff, K. Harth and H. Hibst, Method for the production of butadiene from n-butane, US Pat., US7034195B2, 2006 Search PubMed.
- F. A. Pasha, L. Cavallo and J. M. Basset, ACS Catal., 2014, 4, 1868–1874 CrossRef CAS.
- V. Polshettiwar and R. S. Varma, Green Chem., 2010, 12, 743–754 RSC.
- M. Peters, J. Taylor, D. E. Henton and L. E. Manzer, Methods of preparing renewable butadiene and renewable isoprene, US2010/0216958A1, 2012.
- I. E. Wachs and K. Routray, ACS Catal., 2012, 2, 1235–1246 CrossRef CAS.
- J. Rischard, C. Antinori, L. Maier and O. Deutschmann, Appl. Catal., A, 2016, 511, 23–30 CrossRef CAS.
- L. M. Madeira and M. F. Portela, Catal. Rev.: Sci. Eng., 2002, 44, 247–286 CAS.
- U. Rodemerck, S. Sokolov, M. Stoyanova, U. Bentrup, D. Linke and E. V. Kondratenko, J. Catal., 2016, 338, 174–183 CrossRef CAS.
- C. H. Collett and J. McGregor, Catal. Sci. Technol., 2016, 6, 363–378 CAS.
- B. Rabindran Jermy, S. Asaoka and S. Al-Khattaf, Catal. Sci. Technol., 2015, 5, 4622–4635 CAS.
- F. Cavani, S. Albonetti, F. Basile and A. Gandini, Chemicals and Fuels from Bio-Based Building Blocks, Wiley, 2016 Search PubMed.
- A. Dejoz, J. M. López Nieto, F. Márquez and M. I. Vázquez, Appl. Catal., A, 1999, 180, 83–94 CrossRef CAS.
- L. M. Madeira, M. F. Portela and C. Mazzocchia, Catal. Rev.: Sci. Eng., 2004, 46, 53–110 Search PubMed.
- F. Bolz, Advanced Materials in Catalysis, Elsevier Science, 2013 Search PubMed.
- J. L. G. Fierro, Metal Oxides: Chemistry and Applications, CRC Press, 2005 Search PubMed.
- K. V. R. Chary, C. P. Kumar, T. Rajiah and C. S. Srikanth, J. Mol. Catal. A: Chem., 2006, 258, 313–319 CrossRef CAS.
- K. V. R. Chary, T. Bhaskar, J. J. Maheshwar, K. Ramesh and V. V. Rao, Appl. Catal., A, 2000, 202, 133–139 CrossRef CAS.
- J. M. L. Nieto, Top. Catal., 2006, 41, 3–15 CrossRef.
- E. V. Ishchenko, T. Y. Kardash, R. V. Gulyaev, A. V. Ishchenko, V. I. Sobolev and V. M. Bondareva, Appl. Catal., A, 2016, 514, 1–13 CrossRef CAS.
- A. Qiao, V. N. Kalevaru, J. Radnik, A. Srihari Kumar, N. Lingaiah, P. S. Sai Prasad and A. Martin, Catal. Commun., 2013, 30, 45–50 CrossRef CAS.
- B. Solsona, A. Dejoz, T. Garcia, P. Concepción, J. M. L. Nieto, M. I. Vázquez and M. T. Navarro, Catal. Today, 2006, 117, 228–233 CrossRef CAS.
- B. Fu, J. Lu, P. C. Stair, G. Xiao, M. C. Kung and H. H. Kung, J. Catal., 2013, 297, 289–295 CrossRef CAS.
- S. Veldurthi, C.-H. Shin, O.-S. Joo and K.-D. Jung, Catal. Today, 2012, 185, 88–93 CrossRef CAS.
- T. Johann, G. P. Schindler, A. Brodhagen, S. Crone, R. Benfer, T. Hill and M. Duda, Verfahren zur herstellung von butadien, WO2005063658A1, 2005.
- F. Dury, M. A. Centeno, E. M. Gaigneaux and P. Ruiz, Appl. Catal., A, 2003, 247, 231–246 CrossRef CAS.
- W. Yan, J. Luo, Q.-Y. Kouk, J. E. Zheng, Z. Zhong, Y. Liu and A. Borgna, Appl. Catal., A, 2015, 508, 61–67 CrossRef CAS.
- W.-W. Wang, P.-P. Du, S.-H. Zou, H.-Y. He, R.-X. Wang, Z. Jin, S. Shi, Y.-Y. Huang, R. Si, Q.-S. Song, C.-J. Jia and C.-H. Yan, ACS Catal., 2015, 5, 2088–2099 CrossRef CAS.
- S. T. Oyama, X. Zhang, J. Lu, Y. Gu and T. Fujitani, J. Catal., 2008, 257, 1–4 CrossRef CAS.
- W. Goldstein and J. J. Carberry, J. Catal., 1973, 28, 33–38 CrossRef CAS.
- D. E. Mears, Ind. Eng. Chem. Process Des. Dev., 1971, 10, 541–547 CAS.
- C. James and V. Arvind, Chemical Reaction and Reactor Engineering, Taylor & Francis, New York, US, 1986 Search PubMed.
- G. Paolo, B. Stefano, B. Nicola, C. Matteo, C. Roberto, C. Carlo, C. Davide, L. C. Guido, C. Matteo, D. Ismaila, C. Andrea Dal, G. Stefano de, F. Stefano, F. Guido, G. Ralph, G. Uwe, G. Christos, K. Anton, L. Michele, M.-S. Layla, M. Nicola, M. Francesco, M. Riccardo, P. Stefano, P. Alfredo, P. Lorenzo, S. Carlo, S. Sandro, S. Gabriele, P. S. Ari, S. Alexander, U. Paolo and M. W. Renata, J. Phys.: Condens. Matter, 2009, 21, 395502–395521 CrossRef PubMed.
- P. E. Blöchl, Phys. Rev. B: Condens. Matter Mater. Phys., 1994, 50, 17953–17979 CrossRef.
- J. P. Perdew, K. Burke and M. Ernzerhof, Phys. Rev. Lett., 1996, 77, 3865–3868 CrossRef CAS PubMed.
- S. Grimme, J. Comput. Chem., 2006, 27, 1787–1799 CrossRef CAS PubMed.
- V. Barone, M. Casarin, D. Forrer, M. Pavone, M. Sambi and A. Vittadini, J. Comput. Chem., 2009, 30, 934–939 CrossRef CAS PubMed.
- Z. Zhai, X. Wang, R. Licht and A. T. Bell, J. Catal., 2015, 325, 87–100 CrossRef CAS.
- G. Raju, B. M. Reddy, B. Abhishek, Y.-H. Mo and S.-E. Park, Appl. Catal., A, 2012, 423–424, 168–175 CrossRef CAS.
- M. D. Porosoff, B. Yan and J. G. Chen, Energy Environ. Sci., 2016, 9, 62–73 CAS.
- A. Moronta, J. Luengo, Y. Ramírez, J. Quiñónez, E. González and J. Sánchez, Appl. Clay Sci., 2005, 29, 117–123 CrossRef CAS.
- Y. Song, Y. Xu, Y. Suzuki, H. Nakagome, X. Ma and Z.-G. Zhang, J. Catal., 2015, 330, 261–272 CrossRef CAS.
- J. Zhu, S. Albertsma, J. G. Van Ommen and L. Lefferts, J. Phys. Chem. B, 2005, 109, 9550–9555 CrossRef CAS PubMed.
- R. K. Grasselli, Top. Catal., 2002, 21, 79–88 CrossRef CAS.
- S. G. Newman, K. Lee, J. Cai, L. Yang, W. H. Green and K. F. Jensen, Ind. Eng. Chem. Res., 2015, 54, 4166–4173 CrossRef CAS.
- M. V. Parfenov, E. V. Starokon, L. V. Pirutko and G. I. Panov, J. Catal., 2014, 318, 14–21 CrossRef CAS.
- E. V. Starokon, M. V. Parfenov, S. S. Arzumanov, L. V. Pirutko, A. G. Stepanov and G. I. Panov, J. Catal., 2013, 300, 47–54 CrossRef CAS.
- G. I. Panov, A. K. Uriarte, M. A. Rodkin and V. I. Sobolev, Catal. Today, 1998, 41, 365–385 CrossRef CAS.
- A. P. V. Soares, L. D. Dimitrov, M. C. R. A. De Oliveira, L. Hilaire, M. F. Portela and R. K. Grasselli, Appl. Catal., A, 2003, 253, 191–200 CrossRef.
- C. Wan, D.-G. Cheng, F. Chen and X. Zhan, Catal. Today, 2016, 264, 180–184 CrossRef CAS.
- M. Setnička, R. Bulánek, L. Čapek and P. Čičmanec, J. Mol. Catal. A: Chem., 2011, 344, 1–10 CrossRef.
- A. H. Karim, S. Triwahyono, A. A. Jalil and H. Hattori, Appl. Catal., A, 2012, 433–434, 49–57 CrossRef CAS.
- B. R. Jermy, B. P. Ajayi, B. A. Abussaud, S. Asaoka and S. Al-Khattaf, J. Mol. Catal. A: Chem., 2015, 400, 121–131 CrossRef CAS.
- S. Triwahyono, A. A. Jalil, N. N. Ruslan, H. D. Setiabudi and N. H. N. Kamarudin, J. Catal., 2013, 303, 50–59 CrossRef CAS.
- X. Wang, B. Zhao, D.-E. Jiang and Y. Xie, Appl. Catal., A, 1999, 188, 201–209 CrossRef CAS.
- C. Leyva, M. S. Rana and J. Ancheyta, Catal. Today, 2008, 130, 345–353 CrossRef CAS.
- M. S. Rana, M. L. Huidobro, J. Ancheyta and M. T. Gómez, Catal. Today, 2005, 107–108, 346–354 CrossRef CAS.
- M. A. Bañares, Catal. Today, 1999, 51, 319–348 CrossRef.
- S. Anniballi, F. Cavani, A. Guerrini, B. Panzacchi, F. Trifirò, C. Fumagalli, R. Leanza and G. Mazzoni, Catal. Today, 2003, 78, 117–129 CrossRef CAS.
- V. D. Araújo, M. M. de Lima Jr, A. Cantarero, M. I. B. Bernardi, J. D. A. Bellido, E. M. Assaf, R. Balzer, L. F. D. Probst and H. V. Fajardo, Mater. Chem. Phys., 2013, 142, 677–681 CrossRef.
- A. Pintar, J. Batista and S. Hočevar, J. Colloid Interface Sci., 2005, 285, 218–231 CrossRef CAS PubMed.
- J. Zhu, J. G. Van Ommen, H. J. M. Bouwmeester and L. Lefferts, J. Catal., 2005, 233, 434–441 CrossRef CAS.
- J.-H. Park and C.-H. Shin, J. Ind. Eng. Chem., 2015, 21, 683–688 CrossRef CAS.
- H. Ehrenberg, I. Svoboda, G. Wltschek, M. Wiesmann, F. Trouw, H. Weitzel and H. Fuess, J. Magn. Magn. Mater., 1995, 150, 371–376 CrossRef CAS.
Footnote |
| † Electronic supplementary information (ESI) available: Arrhenius equation dependence representations of the n-butane activation reactions using different oxidants. See DOI: 10.1039/c7cy01033h |
| This journal is © The Royal Society of Chemistry 2017 |

