 Open Access Article
Creative Commons Attribution 3.0 Unported Licence
Correction: Vibrational dynamics and solvatochromism of the label SCN in various solvents and hemoglobin by time dependent IR and 2D-IR spectroscopy
Luuk J. G. W.
van Wilderen
,
Daniela
Kern-Michler
,
Henrike M.
Müller-Werkmeister
and
Jens
Bredenbeck
*
Johann Wolfgang Goethe-University, Institute of Biophysics, Max-von-Laue-Str. 1, 60438, Frankfurt am Main, Germany. E-mail: bredenbeck@biophysik.uni-frankfurt.de; Fax: +49 69 798 46423; Tel: +49 69 798 46428
First published on 28th March 2017
Abstract
Correction for ‘Vibrational dynamics and solvatochromism of the label SCN in various solvents and hemoglobin by time dependent IR and 2D-IR spectroscopy’ by Luuk J. G. W. van Wilderen et al., Phys. Chem. Chem. Phys., 2014, 16, 19643–19653.
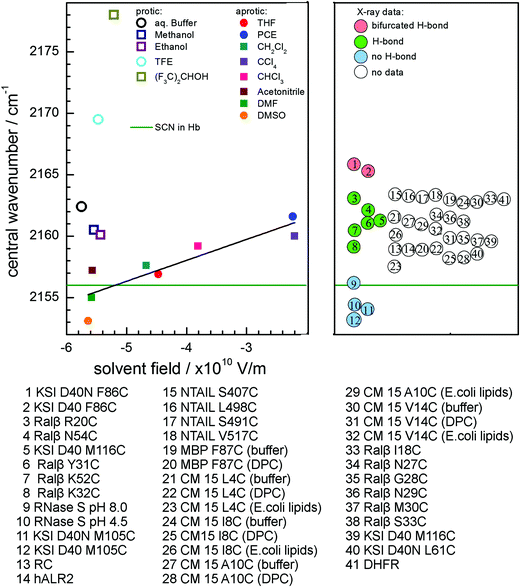
We would like to point the reader to a mistake in our previous publication, which caused an error of a factor of 4π/3 in the Stark tuning rate calculated from the Onsager reaction field model. The discussion and conclusions of the paper remain unaltered.
The Onsager field (in SI units) in our paper is correctly given by:
In accordance with the previous literature,1–3a3 was erroneously set equal to the volume V of the Onsager spherical cavity. Because a represents the Onsager spherical cavity radius, a3 = V·3/(4π) has to be used instead. This has recently been pointed out by Bagchi and coworkers4 and was mentioned before in the supplementary information of a previous publication.5 For MeSCN, the Onsager spherical cavity volume is VMeSCN = MW/(ρ·NA) = 1.19 × 10⁻²⁸ m3 and the cavity radius cubed becomes aMeSCN3 = 2.8 × 10⁻²⁹ m3. Correspondingly, the estimated Onsager field ![[F with combining right harpoon above (vector)]](https://www.rsc.org/images/entities/i_char_0046_20d1.gif) Onsager is a factor of 4π/3 too low in our work as well as in the previous work of others.1–3
Onsager is a factor of 4π/3 too low in our work as well as in the previous work of others.1–3
In Fig. 8 and Fig. S5 of the ESI, the Onsager solvent field on the X-axis therefore has to be multiplied by 4π/3. The corrected figures are shown below. The slope of the line fitting the aprotic solvents in Fig. 8 and Fig. S5 (ESI) produces the Stark tuning rate, which accordingly was a factor of 4π/3 too high in the previous publication and now becomes |Δ![[small mu, Greek, vector]](https://www.rsc.org/images/entities/i_char_e0e9.gif) | = 1.7(4) × 10−9 cm−1/(V/m).
| = 1.7(4) × 10−9 cm−1/(V/m).
Note that the references in the captions to Fig. 8 and Fig. S5 (ESI) refer to the references in the original publication.
Acknowledgements
We thank Sayan Bagchi for pointing out this error.The Royal Society of Chemistry apologises for these errors and any consequent inconvenience to authors and readers.
References
- N. M. Levinson, S. D. Fried and S. G. Boxer, J. Phys. Chem. B, 2012, 116, 10470–10476 CrossRef CAS PubMed.
- A. T. Fafarman, P. A. Sigala, D. Herschlag and S. G. Boxer, J. Am. Chem. Soc., 2010, 132, 12811–12813 CrossRef CAS PubMed.
- S. Bagchi, S. D. Fried and S. G. Boxer, J. Am. Chem. Soc., 2012, 134, 10373–10376 CrossRef CAS PubMed.
- P. Deb, T. Haldar, S. M. Kashid, S. Banerjee, S. Chakrabarty and S. Bagchi, J. Phys. Chem. B, 2016, 120, 4034–4046 CrossRef CAS PubMed.
- S. D. Fried, S. Bagchi and S. G. Boxer, J. Am. Chem. Soc., 2013, 135, 11181–11192 CrossRef CAS PubMed.
| This journal is © the Owner Societies 2017 |


![[small nu, Greek, tilde]](https://www.rsc.org/images/entities/i_char_e0e1.gif)