Shapes matter: examining the optical response evolution in stretched aluminium nanoparticles via time-dependent density functional theory
Junais Habeeb
Mokkath

Department of Physics, Kuwait College of Science And Technology, Doha Area, 7th Ring Road, P.O. Box 27235, Kuwait. E-mail: j.mokath@kcst.edu.kw
First published on 30th November 2017
Abstract
Using first-principles time-dependent density functional theory calculations, we investigate the shape-anisotropy effects on the optical response of a spherical aluminium nanoparticle subjected to a stretching process in different directions. Progressively increased stretching in one direction resulted in prolate spheroid (nanorice) geometries and produced a couple of well-distinguishable dominant peaks together with some satellite peaks in the UV-visible region of the electromagnetic spectrum. On the other hand, progressively increased stretching in two directions caused multiple peaks to appear in the UV-visible region of the electromagnetic spectrum. We believe that our findings can be beneficial for the emerging and potentially far-reaching field of aluminum plasmonics.
Introduction
Research studies in the field of nanoplasmonics have increased tremendously over the past few years and triggered cutting-edge innovations in a panoply of fields, for instance, in nanoscale light management,1 medicine,2 solar energy,3 optoelectronics,4 and chemosensing.5 These applications are supported by the ability of metal nanoparticles to create localized surface plasmon resonances (LSPRs), i.e., collective oscillations of conduction band electrons in response to light.6–8 It is known that the excitation of LSPRs leads to enormously large enhancements of the local electromagnetic field at the nanoparticle surface, resulting in huge cross sections for surface-enhanced Raman scattering (SERS).9 The resonance frequency and intensity of LSPRs can be typically modified by changing the different parameters of individual nanoparticles such the size, shape, materials, and local environment of the nanoparticles10,11 and this creates novel pathways for nanoparticle–light interactions. Among the different tuning parameters mentioned above, LSPR tuning via shape-anisotropy is the most sought after method, in particular due to the emergence of new plasmon modes. For example, quasi-one-dimensional nanostructures such as metal nanorods have demonstrated that small changes in shape could strongly influence the optical response.12–15 While spherical nanoparticles exhibit a single dipole mode, non-spherical nanoparticles can support multiple dipole modes. For instance, metal nanorods possess two dipole modes with different features known as longitudinal and transverse modes. The former (latter) corresponds to the electron oscillations along (perpendicular to) the nanorod major axis. As the aspect ratio of the nanorods increases, the characteristics of the two modes become well-distinguishable. Even more dramatic optical responses have been found in prolate spheroid nanorice structures due to the complex plasmon mode mixing.16Optical responses in metal nanostructures can be accurately calculated using classical electromagnetic simulations based on Maxwell's equations.17,18 However, as the size is reduced below 10 nanometers, quantum mechanical effects emerge and classical simulations inevitably fail,19,20 and the quantum mechanical techniques such as time-dependent density-functional theory (TDDFT) are essential. In this Communication, we report the time-dependent density-functional theory study of anisotropy effects on the optical response of aluminium nanoparticles. To the best of our knowledge, it is the first time that the optical response of non-spherical aluminium nanoparticles has been studied by means of the TDDFT technique. The specific choice of aluminium for this work is justified as follows. Aluminium nanostructures have been drawing significant attention due to their enthralling optical response in the UV-visible region of the electromagnetic spectrum.21–25 Apart from this, the use of aluminium for modeling is not only computationally convenient because of the 3 valence electrons per atom needed in its description, but it has also been successful in reproducing many general phenomena of simple and noble metals in plasmonics. We consider spherical aluminium nanoparticles (807 atoms and 2421 electrons) subjected to a progressively increased stretching process leading to the formation of non-spherical nanoparticles. It is worth noting that the quantum mechanical treatment of the optical response is highly demanding for this size owing to the large number of electrons involved in the optical response. Our results reveal a complex evolution of the optical response as a function of the stretching process. We show that progressively increasing the stretching parameter in a spherical aluminium nanoparticle in just one direction leads to a nanorice-like geometry and the spectra exhibit focused and well-distinguishable peaks together with some satellite peaks. This result is consistent with the previous studies predicting that a nanorice geometry possesses a far greater spectrum tunability than a nanorod, along with much larger local field intensity enhancements.16 On the other hand, progressively increased stretching in two directions leads to complex structure modifications and multiple peaks to appear in the spectra.
Selected snapshots of the stretching process are shown in Fig. 1 and 2 for stretching in one and two directions, respectively. Following a ground-state density functional theory calculation using the BP-86 GGA xc-functional, the optical spectra are obtained by solving time-dependent Kohn–Sham equations using the well-known Casida's method26 as implemented in the Turbomole code.27,28 We use the triple-zeta plus polarization (TZP) basis set. The multipole-accelerated resolution of identity method is used for the Coulomb term, and quadrature grids of m3 quality are employed. The optical spectra are computed by solving the following eigenvalue equation,
| ΩFI = ωI2FI | (1) |
 | ||
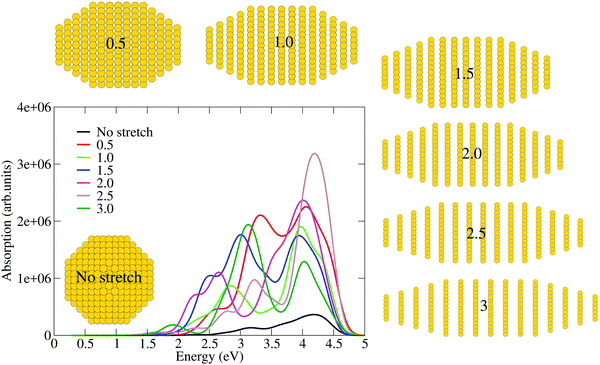
| Fig. 1 TDDFT calculated optical spectra for stretching in one direction in which the stretching parameter progressively increased from 0 to 3. | ||
 | ||
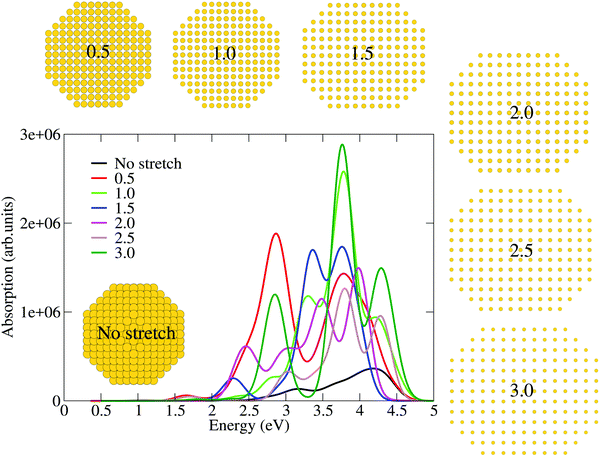
| Fig. 2 TDDFT calculated spectra for stretching in two directions in which the stretching parameter progressively increased from 0 to 3. | ||
We start our discussion by analyzing the optical response evolution found in the calculated spectra shown in Fig. 1 for stretching in one direction in which the stretching parameter progressively increased from 0 to 3. One readily notes that progressively increased stretching in one direction causes the emergence of a couple of well-distinguishable peaks together with some satellite peaks in accordance with the gradual structural change in a nanorice-like geometry. This result bears a remarkable resemblance to an experimental study exploring the multipolar plasmon resonance in silver nanorice,29 finding well-distinguishable longitudinal mode, transverse mode, and satellite peaks, although our structures are much smaller in size and different in nature. Before discussing the optical response of non-spherical nanoparticles, let us examine the optical response of a spherical nanoparticle (see Fig. 1). We observe that a spherical nanoparticle exhibits two peaks, one peak located between 3 and 3.5 eV and another located between 4 and 4.5 eV. By progressively increasing the stretching parameter from a small value of 0.5 to a larger value of 3, the optical response modifies drastically via the emergence of new additional peaks. This kind of spectral evolution is not unexpected since as the spherical nanoparticle gradually transforms into a nanorice-like geometry, one speculates the emergence of the longitudinal mode and the transverse mode together with some multi-polar satellite peaks. Briefly, for a small stretching parameter of 0.5, the longitudinal and transverse mode peaks appear centered around 3.2 and 4.1 eV, respectively, and on top of that satellite peaks also emerge centering around 2.5 eV. Upon further increasing the stretching parameter to 1, the longitudinal mode and transverse mode peaks slightly red-shift to 2.8 eV and 4.0 eV, respectively, together with a significant reduction in the spectral intensities. In addition, one sees that the satellite peaks are now located between 2 and 2.5 eV. By further increasing the stretching parameter to 1.5, significant spectral modifications come into play. For instance, the longitudinal peak blue-shifts by 0.2 eV having a slight enhancement in intensity while the spectral features of the transverse mode remain unchanged and the satellite peaks now appear around 2.4 eV. By further increasing the stretching parameter to 2, more dramatic differences appear, i.e., the longitudinal mode red-shifts by 0.2 eV with a significant reduction in the spectral intensity while the transverse peak gains an enhanced intensity while its energetic position remains unchanged and the satellite peaks appear around 2.25 eV. More dramatic spectral modifications emerge for a stretching parameter of 2.5, in which the longitudinal mode slightly blue-shifts together with a significant reduction in the spectral intensity, whereas a huge enhancement in the transverse peak emerges. Finally, for the largest stretching parameter of 3, we see well-distinguishable spectral features in which the longitudinal peak appears centered around 3.1 eV and the transverse peak appears centered around 4 eV. The above-mentioned findings are consistent with the nanorice spectral features reported previously.16 In brief, Fig. 1 reveals rich features in the evolution of the optical response. This is especially pronounced for the longitudinal peaks, which undergo considerable modifications in their features with respect to different amounts of stretching. This implies that the shape-anisotropy has a stronger influence on the optical response than just the shifting of the peak frequencies. Also we see that even small deviations from the spherical shape can cause huge effects on the optical response. We believe that the discontinuous shifts in the longitudinal peaks, transverse peaks and satellite peaks could be due to the coupling of unperturbed single particle–hole transitions with the collective electron oscillations.
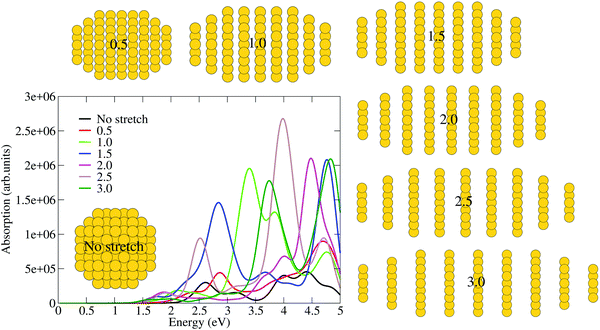
Having explored the optical response evolution as a function of progressively increased stretching in one direction (see Fig. 1), we proceed to analyze the optical response evolution when the stretching process is applied in two directions. Toward this aim, we show in Fig. 2 the optical response as a function of the different stretching parameters from 0 to 3. Our preliminary analysis of Fig. 2 reveals that progressively increasing the stretching parameter causes multiple peaks to appear. This finding is not unexpected since the structural transformation from a highly symmetric to a less symmetric geometry causes different plasmon modes to interact with each other. This result is qualitatively in agreement with the shape-dependent plasmon response modifications studied by Prodan and coworkers using the plasmon hybridization theory.30 In brief, for a small stretching parameter of 0.5, the spectrum shows a couple of dominant peaks centered around 2.8 and 3.7 eV, respectively, and one low-intensity peak centered around 1.6 eV (see Fig. 2). A further increase in the stretching parameter to 1 causes dramatic changes in the spectrum, i.e. a strong peak appears centered around 3.7 eV with some satellite peaks located on both its shoulders. A further increase in the stretching parameter to 1.5 brings noteworthy changes in the spectral profile. One finds that the strong peak slightly red-shifts and splits into two close-lying peaks having almost similar intensities and also a low-intensity peak appears centered around 2.25 eV. Further tuning the stretching parameter to 2, one sees that the double-peak spectral profile slightly blue-shifts with a significant reduction in the intensity (see Fig. 2). A further increase in the stretching parameter to 2.5 causes a spectral blue-shift and a reduction in the intensity. Finally, for the highest stretching parameter of 3, we see remarkable spectral features, i.e., two strong and well-distinguishable peaks centered around 2.7 eV and 3.5 eV emerge. Overall, Fig. 2 shows the complex features in the optical response evolution. In order to check for size effects on the optical response evolution, we have performed the calculations for a 249 atom spherical nanoparticle (see Fig. 3) by stretching in one direction in which the stretching parameter progressively increased from 0 to 3. Fig. 3 confirms our previous conclusions on an 807 atom nanoparticle. Interestingly, cross-comparison of the 807 atom nanoparticle (see Fig. 1) and 249 atom nanoparticle (Fig. 3) optical responses shows one interesting effect. That is the highest peak absorption in both nanoparticles appears for a stretching parameter of 2.5. This simply means that 2.5 stretch induces more collective excitations compared to the rest of the stretching values. In addition, we have also calculated the effect of compression on the optical response finding that even a small compression results in a drastic reduction in the spectral intensity. Also note that the optical response modifications under compression are quite different from the stretching case since in the former (latter) a huge reduction (enhancement) in the spectral intensity can be observed.
 | ||
| Fig. 3 TDDFT calculated optical spectra for stretching in one direction (249 atom nanoparticle) in which the stretching parameter progressively increased from 0 to 3. | ||
Conclusion
In conclusion, we have shown the shape-anisotropy dependent optical response in a spherical aluminum nanoparticle. To this aim, we have calculated the optical response of stretched aluminium nanoparticles (807 atoms and 2421 valence electrons) using first-principles time-dependent density functional theory calculations. Aluminum is a useful starting point for studying this system because it is more computationally feasible, but should be similar to other plasmonic metals. We observed a strong deviation in the optical response of anisotropic nanoparticles compared to spherical nanoparticles. Progressively increased stretching in one direction resulted in a prolate spheroid nanorice-like geometry and leads to strong longitudinal and transverse peaks in the optical spectra. This finding is useful since the nanorice structure is an important plasmonic system due to the large electromagnetic near-fields that can penetrate well into the surrounding medium mainly at the nanoparticle ends, thus useful for sensing applications. On the other hand, progressively increased stretching in two directions causes multiple peaks to appear in the UV-visible spectral range due to the complex plasmon mode mixing. In summary, our results show that the optical response in aluminium nanoparticles can be tuned in energy and character via stretching. Since our findings are based on a simple stretching process, they are most likely to be experimentally reproducible.Conflicts of interest
There are no conflicts to declare.References
- R. Zia, J. A. Schuller, A. Chandran and M. L. Brongersma, Mater. Today, 2006, 9, 20–27 CrossRef CAS.
- D. O'Neal, L. R. Hirsch, N. J. Halas, J. Payne and J. L. West, Cancer Lett., 2004, 209, 171–176 CrossRef PubMed.
- J. A. Schuller, E. S. Barnard, W. Cai, Y. C. Jun, J. S. White and M. L. Brongersma, Nat. Mater., 2010, 9, 193–204 CrossRef CAS PubMed.
- D. K. Gramotnev and S. I. Bozhevolnyi, Nat. Photonics, 2010, 4, 83–91 CrossRef CAS.
- K. M. Mayer and J. H. Hafner, Chem. Rev., 2011, 111, 3828–3857 CrossRef CAS PubMed , PMID: 21648956.
- L. Novotny and B. Hecht, Principles of Nano-Optics, Cambridge University Press, 2006 Search PubMed.
- K. A. Willets and R. P. V. Duyne, Annu. Rev. Phys. Chem., 2007, 58, 267–297 CrossRef CAS PubMed , PMID: 17067281.
- K. L. Kelly, E. Coronado, L. L. Zhao and G. C. Schatz, J. Phys. Chem. B, 2003, 107, 668–677 CrossRef CAS.
- Q. Zhang, N. Large and H. Wang, ACS Appl. Mater. Interfaces, 2014, 6, 17255–17267 CAS , PMID: 25222940.
- K. L. Shuford, J. Lee, T. W. Odom and G. C. Schatz, J. Phys. Chem. C, 2008, 112, 6662–6666 CAS.
- E. Hutter and J. Fendler, Adv. Mater., 2004, 16, 1685–1706 CrossRef CAS.
- L. Shao, C. Fang, H. Chen, Y. C. Man, J. Wang and H.-Q. Lin, Nano Lett., 2012, 12, 1424–1430 CrossRef CAS PubMed , PMID: 22268670.
- T. H. Taminiau, F. D. Stefani and N. F. van Hulst, Nano Lett., 2011, 11, 1020–1024 CrossRef CAS PubMed , PMID: 21322590.
- J. Zuloaga, E. Prodan and P. Nordlander, ACS Nano, 2010, 4, 5269–5276 CrossRef CAS PubMed , PMID: 20698558.
- C. J. DeSantis, D. Huang, H. Zhang, N. J. Hogan, H. Zhao, Y. Zhang, A. Manjavacas, Y. Zhang, W.-S. Chang, P. Nordlander, S. Link and N. J. Halas, J. Phys. Chem. C, 2016, 120, 20518–20524 CAS.
- H. Wang, D. W. Brandl, F. Le, P. Nordlander and N. J. Halas, Nano Lett., 2006, 6, 827–832 CrossRef CAS PubMed , PMID: 16608292.
- C. Oubre and P. Nordlander, J. Phys. Chem. B, 2005, 109, 10042–10051 CrossRef CAS PubMed , PMID: 16852215.
- Y. Cao, A. Manjavacas, N. Large and P. Nordlander, ACS Photonics, 2015, 2, 369–375 CrossRef CAS.
- S. Raza, N. Stenger, S. Kadkhodazadeh, S. V. Fischer, N. Kostesha, A.-P. Jauho, A. Burrows, M. Wubs and N. A. Mortensen, Blueshift of the surface plasmon resonance in silver nanoparticles studied with EELS, in Nanoph, 2013, vol. 2, p. 131 Search PubMed.
- T. Reiners, C. Ellert, M. Schmidt and H. Haberland, Phys. Rev. Lett., 1995, 74, 1558–1561 CrossRef CAS PubMed.
- M. W. Knight, L. Liu, Y. Wang, L. Brown, S. Mukherjee, N. S. King, H. O. Everitt, P. Nordlander and N. J. Halas, Nano Lett., 2012, 12, 6000–6004 CrossRef CAS PubMed , PMID: 23072330.
- G. Maidecchi, G. Gonella, R. Proietti Zaccaria, R. Moroni, L. Anghinolfi, A. Giglia, S. Nannarone, L. Mattera, H.-L. Dai, M. Canepa and F. Bisio, ACS Nano, 2013, 7, 5834–5841 CrossRef CAS PubMed , PMID: 23725571.
- M. W. Knight, N. S. King, L. Liu, H. O. Everitt, P. Nordlander and N. J. Halas, ACS Nano, 2014, 8, 834–840 CrossRef CAS PubMed , PMID: 24274662.
- S. Tian, O. Neumann, M. J. McClain, X. Yang, L. Zhou, C. Zhang, P. Nordlander and N. J. Halas, Nano Lett., 2017, 17, 5071–5077 CrossRef CAS PubMed , PMID: 28664736.
- M.-N. Su, P. D. Dongare, D. Chakraborty, Y. Zhang, C. Yi, F. Wen, W.-S. Chang, P. Nordlander, J. E. Sader, N. J. Halas and S. Link, Nano Lett., 2017, 17, 2575–2583 CrossRef CAS PubMed , PMID: 28301725.
- M. E. Casida, C. Jamorski, K. C. Casida and D. R. Salahub, J. Chem. Phys., 1998, 108, 4439–4449 CrossRef CAS.
- R. Bauernschmitt and R. Ahlrichs, Chem. Phys. Lett., 1996, 256, 454–464 CrossRef CAS.
- R. Bauernschmitt, M. Häser, O. Treutler and R. Ahlrichs, Chem. Phys. Lett., 1997, 264, 573–578 CrossRef CAS.
- H. Wei, A. Reyes-Coronado, P. Nordlander, J. Aizpurua and H. Xu, ACS Nano, 2010, 4, 2649–2654 CrossRef CAS PubMed , PMID: 20397629.
- E. Prodan, C. Radloff, N. J. Halas and P. Nordlander, Science, 2003, 302, 419–422 CrossRef CAS PubMed.
| This journal is © the Owner Societies 2018 |
