CO2 reduction catalysis by tunable square-planar transition-metal complexes: a theoretical investigation using nitrogen-substituted carbon nanotube models†
Yu-Te
Chan
and
Ming-Kang
Tsai
 *
*
Department of Chemistry, National Taiwan Normal University, Taipei, 11677, Taiwan. E-mail: mktsai@ntnu.edu.tw
First published on 18th October 2017
Abstract
In this work, using density functional theory, we have characterized the CO2 reduction capabilities of a series of nine transition-metal-chelated nitrogen-substituted carbon nanotube models (TM-4N2v-CNT). Each of the chelated models consists of a four-N-substituted and one vacancy framework to mimic square planar homogeneous catalysts, and is coordinated to Fe, Ru, Os, Co, Rh, Ir, Ni, Pt or Cu. The results are further investigated to search for the possible electrochemical intermediates along the CO2 reduction pathway. We’ve found that all of the tested elements are predicted to favor the hydrogen evolution reaction over CO2 reduction energetically (with the exception of Cu), and that only Group 8 elements are predicted to bind CO effectively and other cases prefer HCOOH formation. The observed CO binding preference could be rationalized via ligand field theory based on the molecular orbitals of the square planar complexes. With a suitable applied voltage to stabilize all of the adsorbed CO intermediates, Ru and Os are predicted to produce CH4, whereas Fe is predicted to produce CH3OH. Increasing the curvature of the CNT could reduce the required potential in the potential-determining step substantially. However, the predicted catalytic sequence is subject to only the selection of a metal center.
Introduction
Homogeneous metal complexes (metalloenzymes) are found in nature for carrying out the multi-electron catalytic processes to transform stable molecules, e.g. H2O, N2, O2 or CO2, to biologically important ingredients. Such chemical conversion typically poses a high energy barrier in aqueous solutions, but this could be easily overcome as commonly seen in photosynthetic and bioenergetic processes. Humans have been trying to mimic Nature's success of catalytic capability and stability by designing functional or structural catalysts to activate these small molecules. One of the most versatile examples shown in the literature, in terms of the reactivity of various catalytic conversions, is transition metal (TM) polypyridyl complexes. For instance, Ru–polypyridyl complexes, one of the most extensively studied cases, can undergo a wide range of photochemical or electrochemical redox processes to transform H2O, O2, H2, CO2, N2, etc.1–4The functionality of these TM–polypyridyl complexes depends on properly aligning the d orbitals of the central metal with the frontier valence orbitals or low-lying unoccupied orbitals of the absorbed substrates. For oxidative catalysis, withdrawing t2g orbitals are helpful in facilitating the charge transfer process from the valence electron density of the substrate. For reductive catalysis, the backdonation from the low-lying d electrons of the metal to the antibonding orbitals of the substrate plays a key role in weakening the bond order of the absorbent. Both types of metal–ligand interactions require good overlap energetically and symmetrically between d orbital wavefunctions and the targeting occupied or virtual MO of the ligands. The orientation of the d orbitals was synthetically controlled by the design of the chelated ligands. However, the procedure of designing and synthesizing ideal ligands for the purpose of carrying out the particular activation process is scientifically challenging.
The fragility of coordinated ligands presents a scientific challenge as it hinders the application of such organometallic complexes. During the catalytic cycle, reactive intermediates form and could subsequently attack the supporting ligand framework. As a result, the previously working ligand field would be non-functional or even destroyed. Thus, using heterogeneous catalysis to replace the functionality of homogeneous catalysis for mass production is of industrial interest. Nonetheless, the cost of using such expensive transition metals hinders its chemical application. Reducing the number of noble metals or introducing earth abundant replacement becomes the primary focus of catalyst development. Alternatively, designing a durable ligand framework with single catalytic metal centers, being chemically resistant to the reactive catalytic-intermediate, would also be a potential solution.
Carbon based materials including carbon nanotube (CNT), graphene, and other carbon nanostructures have been extensively investigated to overcome the limits of the conventional organometallic ligand framework due to its supreme redox stability and electrical conductivity for electrocatalysis. The pioneering experiment reported by Gong et al. introduced nitrogen-substituted carbon nanotubes (N-CNT) as a metal-free electro-catalyst for the oxygen reduction reaction (ORR) where the operational stability of the catalyst was significantly maintained up to 7000 seconds in the presence of reactive oxygen derivatives.5 The chemical nature of the ORR on these N-substituted carbon materials was subsequently investigated in many experimental and theoretical studies.6–12 Recently, the CO2 reduction reaction (CO2RR) using these metal-free N-CNT materials was also reported.13 Alternatively, Lee et al. synthesized Fe–porphyrin-like carbon nanotube catalysts in an attempt to replace Pt catalysts in the oxygen reduction reaction.14 The introduction of a metal center combining with the ligand field of N-CNT promoted early TMs like Fe to be as reactive as Pt catalysts for the ORR. Other transition metal elements like Co and Mo were also synthesized with these N-substituted carbon materials for energy applications like the ORR, hydrogen evolution reaction (HER) and CO2RR.15–19
From the theoretical perspective, Stoyanov et al. reviewed various types of metal doped carbon nanostructures where the presence of metal dopants was concluded to stabilize buckled carbon materials.20 Lee et al. predicted that the formation energy of Fe–N-CNT could be the most favourable synthetic route if the chemical potential of the N-dopant increased,14 which was followed by several theoretical studies in exploring the nature of ORR reactivity on various metal centers.21–35 Tripkovic et al. explored CO and CO2 reduction with a metal-functionalized graphene model where Rh was identified as the most active candidate.36 Cheng et al. designed a graphene model with an additional axial ligand to increase the preference for CO2 reduction over the normally more competitive hydrogen evolution pathway.37 Note, however, that even though this introduction of axial ligands allows for further tuning of ligand fields, the related synthetic challenge could be non-trivial. Recently, Chai and Guo used ab initio molecular dynamics simulations to explore the interplay between the curvature of N-substituted graphene and CO2 reduction activity,13 in which the curvature of graphene was also shown to be an influential factor in the predicted overpotentials.
In the present study, we extend the theoretical exploration using a series of N-CNT models chelating with various transition metal elements, including Fe, Ru, Os, Co, Rh, Ir, Ni, Pt, and Cu. We examine the electronic structures generated using N-CNT frameworks of different CNT radii to the chelated TM. We also compare the electronic structures of these TM-N-CNT models with the case of classic square planar complexes through the lens of ligand field theory. Finally, we analyse the redox thermodynamics for the CO2 reduction vs. hydrogen evolution reaction in terms of CNT radii.
Computational details
DFT calculations are performed using the Vienna ab initio simulation package (VASP) code.38–41 Projector augmented waves (PAW) are used to describe the ion cores, and the exchange–correlation interactions are expressed with a generalized gradient approximation (GGA) in the form of the Perdew, Burke, and Ernzerhof (PBE) functional.42 We include spin polarization as the TM may have odd number of electrons or transfer electrons to CNT. The plane-wave basis set is expanded to the cutoff energy level of 450 eV. The calculations are performed with the Γ point centered 1 × 1 × 1 to 1 × 1 × 10 k-point mesh generated by the Monkhorst–Pack scheme in the various supercells as shown in Fig. S1(a) (ESI†), and the size of the cell is designed to approximate the concentration of N in the experimental data.10 For the density of states (DOS) calculations, the Methfessel–Paxton method with a width of 0.05 eV is employed. Ionic relaxation is performed using the conjugate gradient method. All models are fully relaxed until the maximum of Hellmann–Feynman forces converged to 0.05 eV Å−1. To include the various curvatures of CNT as shown in Fig. S1(b) (ESI†), the armchair type single wall CNT, n = 5–8, 10, and 12, are used. In addition to CNT curvature, the various site densities (ρs) of nitrogen substitution are considered. The k-point selection from 3 × 1 × 1 to 10 × 1 × 1 k-points is used for the TM bound nitrogen-substituted CNT (denoted as TM-xNyv-CNT) models, where x is the number of substituted nitrogens and y is the number of carbon vacancies (see the ESI† for the details). In the present study, TM-4N2v is the main simulated model and such structure was identified as the dominant form at a high concentration of nitrogen doping.14 In order to explore the possible electrochemical steps, we used the computational hydrogen electrode (CHE) method43 to calculate the free energies of all possible intermedia for the CO2 reduction reaction (CO2RR) and estimated the corresponding reduction potential. A solvation correction at 0.3 eV was adapted for all species containing OH groups, e.g. COOH, COH, COHOH, CHOH, and CH2OH.Results and discussion
A. N-Substitution and carbon vacant site formation
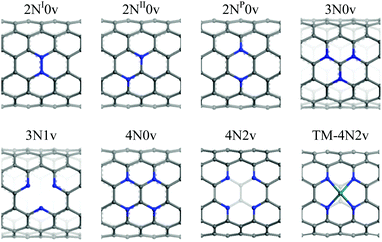
The formation energy (ΔEfxN0v) of N-substituted armchair CNT (n,n), n = 5–8, 10, and 12, is defined by | (1) |
| ΔEfyv = Eyv + yEC − EP | (2) |
In order to assemble TM-3N1v-CNT or TM-4N2v-CNT structures, one has to remove 4 or 6 carbon atoms from the pristine CNT, respectively. The formation energies of such models without TM chelation can be expressed as ΔEfxNyv by
 | (3) |
 | (4) |
We observe that more N-substitution substantially causes ΔETotFxNyv (for y = 0 cases) to increase from 0.33 to 4.03 eV due to the poor orbital incorporation of the valence orbitals of N atoms into the conjugated C–C bond network of CNT. Among the three types of 2N0v models, ΔETotF2N0v is estimated to be 1.41 to 2.76 eV, and 2NP0v is the predicted lowest-energy 2N0v structure. We notice that ΔETotF2N0v is almost greater than 2 × ΔETotF1N0v, which indicates that the infinitely separated N-substitution would still be favourable. However, clustering N-substituents could be favourable for metal binding under high N doping conditions.14 For instance, ΔETotFxNyv of Ru-4N2v is substantially lower than that of 4N2v for both CNT(6,6) and CNT(12,12) models.
In the cases of 3N- and 4N-substitution, the introduction of vacant sites modestly reduced ΔETotFxNyv as shown by the comparison of 3N0v with 3N1v and 4N0v with 4N2v in Table 1. Metal binding to xNyv models (ΔETotFMxNyv as defined in eqn (5)) is not able to compensate for the endothermic formation energies of the xNyv models as shown in Table 1. For instance, the formation energies of the Ru-3N1v-CNT and Ru-4N2v-CNT models are predicted to be between 2.79 and 3.35 eV following
| ΔETotFMxNyv = ΔETM + ΔETotFxNyv | (5) |
| ΔETM = ΔEemb − ΔEcoh | (6) |
| ΔEemb = EMxNyv − (ExNyv + EisoM) | (7) |
| ΔEcoh = Ebulk − EisoM | (8) |
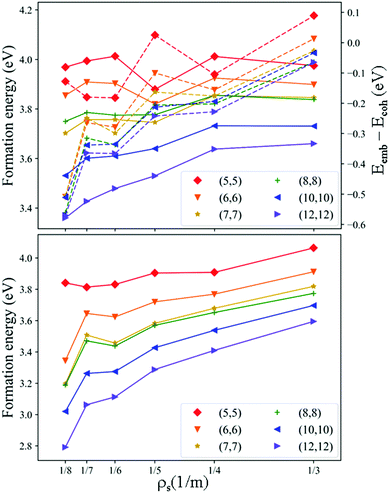
ΔETotFxNyv, ΔETM, and ΔETotFMxNyv of the Ru-4N2v-CNT models using CNT(n,n), n = 5–8, 10 and 12, at various site densities (ρs = 1/3–1/8) are summarized in Fig. 2. We chose Ru chelation (due to its versatile catalytic ability reported in the literature)1–3 as an example to investigate the balance between the bulk cohesion energy and the metal chelation energy. ΔEemb − ΔEcoh ranges from 0.1 to −0.6 eV as shown in Fig. 2(top-right) and its negative value suggests that the exothermic metal binding to the 4N2v-CNT model can compensate for the formation of the isolated metal atom from the bulk state. Both ΔETotFxNyv and ΔETotFMxNyv decrease generally as ρs decreases at each CNT radius. As the radii of CNT increase, the formation of the Ru-4N2v-CNT model is shown to be more favourable.
In Fig. 2, we observe that ΔETotFMxNyv is dominantly affected by ΔETotFxNyv and all predicted ΔETotFMxNyv values are greater than 2.6 eV. However, the formation of TM-xNyv-CNT may be significantly reduced if ΔEcoh is disregarded, e.g. using the atomic form of metal sources during the material synthesis. Several experiments have reported the observation of TM-4N2v structures, TM = Fe, Co, and Zn, through various synthetic pathways.14,44–46 Therefore, exploring more theoretical implications using the current TM-4N2v-CNT models would provide more chemical insights into the experiments.
B. Geometry and electronic structure of the Ru-4N2v-CNT model
The structural details of Ru-4N2v-CNT models are summarized in Table S1 (ESI†), in which the Nx–Ru–Ny angles (θNRuN) and N–Ru bond lengths (rRuN) are listed. θNRuN is found to increase with decrease of CNT curvature but rRuN is insensitive to the radii of CNT. θNRuN of the largest CNT radii case is close to 164° and is 15° smaller than those of the typical square planar complexes.The total spin angular momentum (S) and d-band center values are tabulated in Table S2 (ESI†). The partial densities of states (PDOS) of the Ru-4N2v-CNT models at various ρs and the contribution of each Ru d-orbital are summarized in Fig. S2 (ESI†). As we emphasized earlier, the ligand field of the 4N2v-CNT model is tunable subject to the curvature of CNT. The calculated d-band center (by averaging over all d valence bands) shows a systematic shift toward the Fermi level as the CNT radii increase. The up-shifting of the d-band center also aligns consistently with ΔETM, in which the stronger ligand field that resulted from the lower CNT curvature causes stronger metal binding energy with the 4N2v structure as summarized in Table S3 (ESI†).
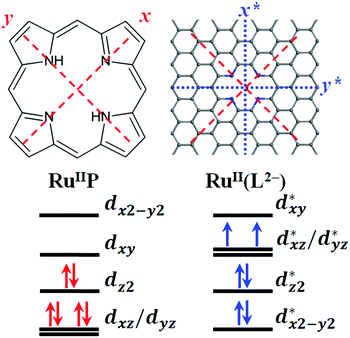
The x*- and y*-axes for the Ru-4N2v-CNT models are rotated counterclockwise by 45 degrees from the conventional square planar (Sq) complexes as compared in Fig. 3, where the z*-axis of the Ru-4N2v-CNT model still maintains the same orientation as the z-axis for the Sq complexes. Although the d-orbital energetics for TM-Sq complexes typically have the dx2−y2 orbital at the highest energy level, the dxy* orbital is predicted at the highest energy due to the symmetry alignment of the N-substitution for the TM-4N2v-CNT models, and the dx2−y2* orbital is calculated to be the lowest energy orbital because of the stabilization effect introduced by the CNT π* orbitals along the axial direction. The change of radii of CNT is expected to break the degeneracy of dxz*/dyz*, and the latter is repelled to higher energy levels as the CNT radii decrease.
In order to understand the conductivity of Ru-4N2v-CNT models, which is a crucial factor affecting the catalytic overpotential, we thus examine the band structures of the selected Ru-4N2v-CNT(5,5) and Ru-4N2v-CNT(12,12) at ρs = 1/3 and 1/8, respectively, as shown in Fig. 4. All of the Ru models are found to maintain the conductor characteristic as same as the pristine armchair CNT, and that is beneficial to preserve the low overpotential character. It should be noted that most of the 3d TM binding at 4N2v models using zigzag CNT were found to be semi-metallic.47
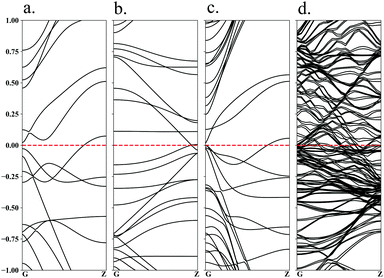 | ||
| Fig. 4 Band structures of Ru-4N2v-CNT(n,n) models: (a) (5,5) at ρs = 1/3, (b) (12,12) at ρs = 1/3, (c) (5,5) at ρs = 1/8, and (d) (12,12) at ρs = 1/8. | ||
C. Small molecule adsorption
We characterize CO2, CO and H2O adsorption on Ru-4N2v models at ρs = 1/8. The adsorbed structures are schematically shown in Fig. S3 (ESI†) and the corresponding adsorption energies are summarized in Table S4 (ESI†). Both CO2 and CO are found to bind the Ru-4N2v-CNT model more strongly monotonically with increase of CNT radii while H2O adsorption is insensitive to the change in CNT radii. In all CO2 adsorbed cases, the CCO2–Ru bond lengths and O–C–O bond angles are about 2.20 Å and 147°, respectively. The *CO bond lengths are about 1.18 Å, which are significantly longer than the gas phase optimized case (1.14 Å), due to the strong metal π-backbonding. The calculated CO vibrational frequency is about 200 cm−1 red-shifted from the CO(g) at 2123 cm−1 predicted at the current theory level.Increasing the CNT radii generally shifts the d-band center of Ru toward the Fermi level, and consequently enhances the adsorption energies of small molecules. The interaction between the gaseous molecules and metal could be tuned for the specific small molecule activation catalysis through the selection of a metal center and a suitable ligand field in terms of CNT radii. In the following section, we comprehensively compare the CO2 reduction reaction (CO2RR) using Fe, Ru, Os, Co, Rh, Ir, Ni, Pt and Cu for different CNT radii.
D. CO2RR mechanism
Nine types of transition metal elements, i.e. Fe, Ru, Os, Co, Rh, Ir, Ni, Pt, Cu, chelated with 4N2v-CNT models are investigated using (5,5) and (12,12) CNT at ρs = 1/8. The corresponding electrochemical properties are calculated along the possible CO2RR mechanistic pathway. We chose the low site density (ρs = 1/8) model to minimize the inter-site artificial strain, and these low site-density models contain at least 158 heavy atoms. The stability of the chelated metal is estimated using ΔETM in Table S3 (ESI†). All the calculated metal elements, except Os (ΔETM > 0), are predicted to chelate the 4N2v-CNT models favorably rather than being embedded in the bulk structure. Notably, the ΔETM values for TM = Fe, Ru, Ni, Pt and Cu chelated with the 4N2v-(12,12) models are predicted to exhibit comparable stability to those of previous TM-4N2v-graphene models.27 The structural details including the N–TM bond length (rNM) and N–TM–N bond angle (θNMN) for each model are also summarized in Table S3 (ESI†). The 1st raw transition metal atoms like Fe, Co, Ni, and Cu have shorter rNM and larger θNMN than the cases of other metal atoms from the 4th and 5th periods. The calculated d-band centers of the TM-4N2v-CNT models are found to shift substantially (>0.2 eV) upon replacing CNT(5,5) by CNT(12,12) in the cases of Fe, Ru, Os, Co, Rh, and Cu; these d-band shifts suggest the possibility of tuning the electronic structures of TM-4N2v-CNT models via the selection of CNT radii.In order to characterize the CO2RR mechanism, we chose CO2(aq) + bare TM-4N2v-CNT as the reference state to calculate the stepwise relative energetics. For the 1st electrochemical step, a hydrogen atom binding with the TM-4N2v-CNT model (denoted as *H to represent hydrogen binding on the TM site) is predicted to be the most thermodynamically favourable intermediate over the electrochemical-reduction-equivalent *COOH and *OCHO for all of the models, except for TM = Cu, as shown in Table S5 (ESI†). Such electrochemical reduction preference of forming *H favours the hydrogen evolution reaction (HER) instead of the CO2RR. All of the calculated chemical-bound intermediates are schematically shown in Fig. S3 (ESI†). However, it has been demonstrated experimentally and theoretically that hydrogenation at the adsorbed CO2 (*COO) intermediate can be enhanced, and the HER can be suppressed, in the presence of a bias electrode potential (U). Hori et al. observed dominant Faraday efficiency in CH4 formation on the Cu surface using U < −1.3 V vs. NHE.48 Such observed selectivity was elaborated by Peterson et al. using Density Functional Theory (DFT),49 in which the applied bias potential enhances CO2 adsorption on the Cu surface and facilitates the subsequent hydrogenation steps. In this study, all of the calculated TM-4N2v-CNT models, which were predicted to favour *H formation, could follow the CO2 hydrogenation pathway if the suitable voltage is applied.
Along the CO2 electrochemical reduction pathway, *C(![[double bond, length as m-dash]](https://www.rsc.org/images/entities/char_e001.gif) O)OH is predicted to be the favourable intermediate over *OCH(
O)OH is predicted to be the favourable intermediate over *OCH(![[double bond, length as m-dash]](https://www.rsc.org/images/entities/char_e001.gif) O) for all of the calculated models in step 1, except for TM = Cu. In step 2, three potential intermediates could be formed, i.e. HCOOH(aq), *CO + H2O(aq) and *C(OH)(OH). For TM = Fe, Ru and Os cases, *CO is the favourable and important intermediate for the subsequent hydrogenation steps, while other metal elements prefer to form HC(
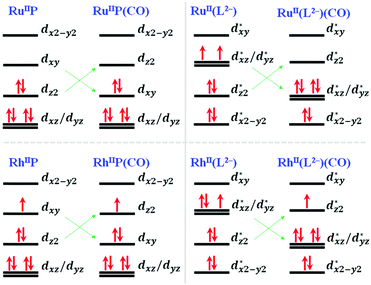
O) for all of the calculated models in step 1, except for TM = Cu. In step 2, three potential intermediates could be formed, i.e. HCOOH(aq), *CO + H2O(aq) and *C(OH)(OH). For TM = Fe, Ru and Os cases, *CO is the favourable and important intermediate for the subsequent hydrogenation steps, while other metal elements prefer to form HC(![[double bond, length as m-dash]](https://www.rsc.org/images/entities/char_e001.gif) O)OH(aq) thermodynamically. The recent experiment reported by Zhang et al. with cobalt phthalocyanine (CoPc) molecules anchored on carbon nanotubes shows the CO production from CO2 electrochemical reduction.19 Such experimental observation could fairly align with this theoretical study – the 2nd lowest-energy reaction channel of generating CO and H2O is only ∼0.1 eV higher than the formation of HCOOH. The CO(aq) production could be exothermic if a higher bias potential is applied, and enhanced by the temperature effect. The strong M–CO coordination bonds for the TM = Fe, Ru and Os models can be elaborated using ligand field theory as the comparison of Ru with Rh models in Fig. 5. For the conventional square-planar TM–porphyrin complexes, the d orbital energetics of the TM = RuII(d6) and RhII(d7) metal centers are schematically represented in RuIIP and RhIIP where the dx2−y2 orbital is the highest unoccupied orbital, and dxz and dyz are the degenerate lowest-energy orbitals. With CO adsorption, the complexes turn to experience the square-pyramidal ligand field, and the dz2 orbital is repelled to higher energy levels.
O)OH(aq) thermodynamically. The recent experiment reported by Zhang et al. with cobalt phthalocyanine (CoPc) molecules anchored on carbon nanotubes shows the CO production from CO2 electrochemical reduction.19 Such experimental observation could fairly align with this theoretical study – the 2nd lowest-energy reaction channel of generating CO and H2O is only ∼0.1 eV higher than the formation of HCOOH. The CO(aq) production could be exothermic if a higher bias potential is applied, and enhanced by the temperature effect. The strong M–CO coordination bonds for the TM = Fe, Ru and Os models can be elaborated using ligand field theory as the comparison of Ru with Rh models in Fig. 5. For the conventional square-planar TM–porphyrin complexes, the d orbital energetics of the TM = RuII(d6) and RhII(d7) metal centers are schematically represented in RuIIP and RhIIP where the dx2−y2 orbital is the highest unoccupied orbital, and dxz and dyz are the degenerate lowest-energy orbitals. With CO adsorption, the complexes turn to experience the square-pyramidal ligand field, and the dz2 orbital is repelled to higher energy levels.
Unlike the conventional square planar complexes, dxz and dyz are no longer the lowest energy orbitals due to repulsion caused by the CNT curvature. Thus, M-4N2v-CNT models, TM = RuII and RhII, are predicted to be triplet and doublet, respectively. Upon introducing the 5th coordination (CO) along the z-axis, dz2 is destabilized over dxz and dyz orbitals. Thus, a d6 configuration like RuII would be favoured by the square pyramidal coordination, while the d7 case like RhII would populate one electron on the anti-bonding character dz2 orbital. The substantial CO binding with TM = Fe, Ru and Os could be attributed to the ligand field stabilization effect.
E. CORR mechanism
The calculated electrochemical minimum energy pathway (ecMEP) of the CO reduction mechanism is summarized in Table S5 (ESI†) and graphically presented in Scheme 1. The mechanism is calculated under the presumption of the saturated CO(aq) concentration in solution, and consequently, the stability of the *CO intermediate would not be of concern. Only Fe, Ru and Os are predicted to have favourable CO adsorption; however, the CO reduction reaction (CORR) could be accessible for other metal elements using high CO(g) pressure.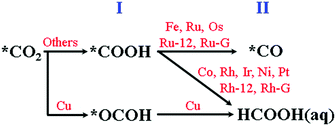 | ||
| Scheme 1 The predicted electrochemical minimum energy pathway (ecMEP) of the CO2 reduction mechanism. | ||
In the 1st step of the CORR, *CHO is predicted to be the dominant intermediate for all of the calculated models instead of *COH. The 2nd hydrogenation step leads to the favourable formation of *CHOH for TM = Fe, Ru, Os and Ir, while other metal centres prefer the formation of *CH2(![[double bond, length as m-dash]](https://www.rsc.org/images/entities/char_e001.gif) O). The interactions of *CH2(
O). The interactions of *CH2(![[double bond, length as m-dash]](https://www.rsc.org/images/entities/char_e001.gif) O) with the TM = Co, Rh, Ni, Pt and Cu models are almost negligible, which implies the subsequent desorption of CH2O(aq) as the dominant route. We also characterize the CORR mechanism using TM-4N2v-graphene, TM = Ru and Rh, models as shown in Fig. S4 (ESI†). We observe the same tendency of CH2O(aq) desorption as the non-Group-8 cases instead of proceeding with the subsequent hydrogenation steps as listed in Table S5 (ESI†).
O) with the TM = Co, Rh, Ni, Pt and Cu models are almost negligible, which implies the subsequent desorption of CH2O(aq) as the dominant route. We also characterize the CORR mechanism using TM-4N2v-graphene, TM = Ru and Rh, models as shown in Fig. S4 (ESI†). We observe the same tendency of CH2O(aq) desorption as the non-Group-8 cases instead of proceeding with the subsequent hydrogenation steps as listed in Table S5 (ESI†).
In the 3rd hydrogenation step, the formation of *OCH3via the re-adsorption of oxygen on CH2O is considered to be unlikely due to the repulsive interaction between the long pairs of CH2O and the negative electric field of the cathode electrode. Therefore, the CORR of the TM = Co, Rh (with CNT or graphene), Ni, Pt and Cu models would stop at CH2O(aq) formation. Only three metal centres (M = Fe, Ru and Os) could continue along the 3rd hydrogenation pathway to form *CH2OH instead of forming *CH + H2O and the latter is a higher-energy intermediate as shown in the ESI.†
In the 4th step, the prior *CH2OH intermediate could be hydrogenated to either release CH3OH(aq) or produce *CH2 + H2O. The TM = Fe model favours CH3OH(aq) generation and the TM = Ru and Os models would favour the *CH2(g) formation (Scheme 2).
The *CH2 intermediate could undergo two more hydrogenation steps to eventually form CH4(g).
In Table 2, we summarize the major product and potential-determining step (PDS) for the CORR. Rh is predicted to be the catalyst required for the lowest potential of −0.124 V for HCOOH generation. We predict the potentials required for overcoming the PDS to be −1.255 V and −0.283 V using TM-4N2v-graphene models, TM = Ru and Rh, respectively. These predicted potentials are in good agreement with the early results obtained by Tripkovic et al.36 where their prediction was at −1.22 V for Ru and −0.19 V for Rh. The minor difference between this study and early report can be attributed to the selection of functional and site density. In this study, only the Fe-4N2v-CNT(5.5) model is found to show CH3OH formation at −0.741 V, and the previous results using the graphene model was, however, to generate CH4 at −0.93 V. The ligand field effect introduced by the curvature of CNT seems to enhance the predicted reactivity of the chelated metal atoms. In this study, we include three types of carbon materials, i.e. CNT(5,5), CNT(12,12) and graphene, to build different ligand field effects for TM = Ru and Rh cases. All three TM = Ru and Rh models are predicted to generate CH4 and HCOOH, respectively, regardless of the curvature of carbon materials. However, the required potential for overcoming the PDS becomes more negative as the curvature of carbon materials decreases.
| TM | Product | Potential (V) | PDS |
|---|---|---|---|
| a CO(aq) or *CO, whichever gives a lower reference energy for the prediction of the PDS, is chosen. | |||
| Fe | CH3OH | −0.741 | *CO → *CHO |
| Ru | CH4 | −0.801 | *CO → *CHO |
| Os | CH4 | −0.948 | *CO → *CHO |
| Co | CH2O | −0.137 | CO(aq) → *CHO |
| Rh | CH2O | −0.124 | *CHO → CH2O(aq) |
| Ir | CH2O | −0.367 | *CHO → CH2O(aq) |
| Ni | CH2O | −1.692 | CO(aq) → *CHO |
| Pt | CH2O | −1.703 | CO(aq) → *CHO |
| Cu | CH2O | −1.907 | CO(aq) → *CHO |
| Ru | CH4 | −0.801 | *CO → *CHO |
| Ru-12 | CH4 | −0.993 | *CO → *CHO |
| Ru-G | CH4 | −1.255 | *CO → *CHO |
| Rh | CH2O | −0.124 | *CHO → CH2O(aq) |
| Rh-12 | CH2O | −0.146 | CO(aq) → *CHO |
| Rh-G | CH2O | −0.283 | *CHO → CH2O(aq) |
F. Scaling relation among the chelated metal atoms
As reported in the literature, the formation energies of the adsorbed intermediates from CO2 reduction scale linearly on the metallic surfaces, and the corresponding scaling slope represents the number of coordinated metal atoms underneath the particular adsorption site. In Fig. S6 (ESI†), the predicted d-band centers and G(*CHO) are compared with G(*H) using TM-4N2v-CNT(5,5) models, and G(*CHO) is found to increase with increasing G(*H). For those models with the d-band center at high energy levels, both G(*H) and G(*CHO) are observed to be favourable. In Fig. 6, we systematically plot the scaling relation to compare the various TM-4N2v-CNT models. We select G(*H) and G(*CHO) as the x-axes as both intermediates are identified as one-electron-pair σ donors as H− and CHO−. The y-axis contains the formation energies of all the possible hydrogenated intermediates along both the CO2RR and CORR reaction pathways. We include the electrochemical-equivalent intermediates in one figure, and thus the intermediate positions at the lower y-axis would be the dominant case.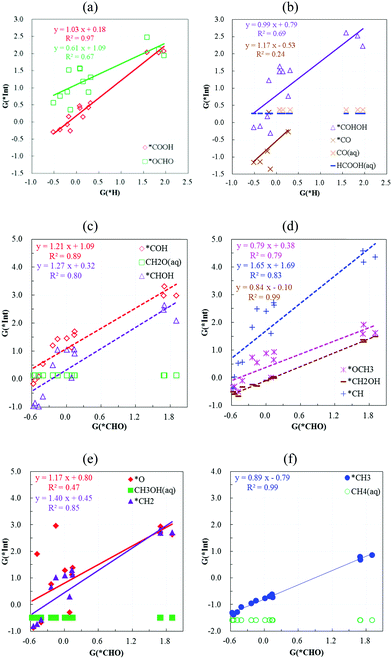 | ||
| Fig. 6 The scaling relation between the formation energies of the calculated intermediates vs. G(*H) and G(*CHO). | ||
In Fig. 6a and b, only the formation of *COOH scales linearly with that of *H for the CO2RR, while such proportional relationships for the other intermediates are insignificant. Notably, the formation energy of *COOH vs. *H can be described by the linear formula y = 1.03x + 0.18, which suggests that the overpotential to suppress the HER and activate the CO2RR could be a constant around 0.18 V regardless of the metal atoms embedded in the TM-4N2v-CNT models. The exothermic *H formation also leads to favourable *CO formation, and this enables the possibility for the subsequent hydrogenation steps, otherwise HCOOH would be the end-point product for the cases of G(*H) > 0 as shown in Fig. 6b.
In Fig. 6c–f, the formation energies of *CH2OH and *CH3 align almost linearly (scaling slope at ∼0.9) with that of *CHO. All these three intermediates can undergo one-step hydrogenation to stable chemicals – methanol, methane and formaldehyde. The formation energies of *COH, *CHOH and *CH2, in which these intermediates can potentially form two-coordination bonds (σ donation and π backdonation), align less linearly (0.8 < R2 < 0.9) with that of *CHO with a scaling slope >1.2. The scaling slope of *CH is predicted to be 1.65 (R2 = 0.83) and *CH could potentially form three-coordination bonds (one σ donation and two π backdonations) with the TM-4N2v-CNT models. The scaling slope between the formation energies of *CHO and the other intermediates is found to increase with the number of possible coordination bonds, and such a trend could roughly described as 0.9 vs. 1.2 vs. 1.6 at the slope for the comparison of 1σ and 1σ1π and 1σ2π coordination. The interaction resulted from π backdonation is estimated to be less than half of σ donation, given the change in scaling slopes. Similar analysis using the scaling slope for the CO2 reduced intermediates on a metal surface was pointed out by Rossmeisl and coworkers, where the change in the scaling slope was 1, 2 and 3 as the intermediates were adsorbed on atop, bridge and hollow sites.36 As shown in Fig. S6 (ESI†), the d-band centers of the TM-4N2v-CNT models decrease as the σ donation from *H and *CHO becomes reduced. Thus, the π backdonation to form multiple coordination bonds would be further hindered by the hardness that resulted from the increase of d-band centers.
Conclusions
In this study, we have built a series of TM-4N2v-CNT models to characterize CO2 reduction catalysis subject to a tunable ligand field effect using density functional theory. We take into account nine types of transition metals (Fe, Ru, Os, Co, Rh, Ir, Ni, Pt, Cu), and search the electrochemically minimum energy pathway. Only Group 8 elements – Fe, Ru and Os – are predicted to bind CO effectively and result in the formation of subsequent hydrogenation steps. The TM = Fe model is the only model predicted to produce CH3OH, and the Ru and Os cases are predicted to produce CH4. For the CO2RR, the non-Group 8 elements are predicted to produce HCOOH and could produce CH2O if the saturated CO concentration is applied. In the comparison of the scaling relation, we observe that the scaling slope shifts from 0.9, 1.2 to 1.6, and this represents the coordination bonding transformation from 1σ, 1σ1π to 1σ2π coordination for the proposed intermediates adsorbed on the square-planar-like TM-4N2v-CNT models. Reducing the curvature based on the selection of CNT radii pushes up the d-band center of the metal, and further reduces the required potential of the PDS. However, the major catalytic product would not depend on the selection of CNT curvature, and be determined only by the type of chelated metal.Conflicts of interest
There are no conflicts to declare.Acknowledgements
This study was supported by the Ministry of Science and Technology of Taiwan (105-2113-M-003-010 and 106-2113-M-003-012). MKT is grateful for the computational resources provided by the National Center for High-Performance Computing of Taiwan and the Center for Cloud Computing in National Taiwan Normal University.References
- H. Nagao, T. Mizukawa and K. Tanaka, Inorg. Chem., 1994, 33, 3415–3420 CrossRef CAS.
- X. Y. Yi, Y. Liang and C. Li, RSC Adv., 2013, 3, 3477–3486 RSC.
- Y. M. Badiei, D. E. Polyansky, J. T. Muckerman, D. J. Szalda, R. Haberdar, R. Zong, R. P. Thummel and E. Fujita, Inorg. Chem., 2013, 52, 8845–8850 CrossRef CAS PubMed.
- D. M. Arias-Rotondo and J. K. McCusker, Chem. Soc. Rev., 2016, 45, 5803–5820 RSC.
- K. Gong, F. Du, Z. Xia, M. Durstock and L. Dai, Science, 2009, 323, 760–764 CrossRef CAS PubMed.
- I. Y. Jeon, D. S. Yu, S. Y. Bae, H. J. Choi, D. W. Chang, L. M. Dai and J. B. Baek, Chem. Mater., 2011, 23, 3987–3992 CrossRef CAS.
- H. J. Choi, S. M. Jung, J. M. Seo, D. W. Chang, L. M. Dai and J. B. Baek, Nano Energy, 2012, 1, 534–551 CrossRef CAS.
- Y. X. Feng, F. F. Li, Z. P. Hu, X. G. Luo, L. X. Zhang, X. F. Zhou, H. T. Wang, J. J. Xu and E. G. Wang, Phys. Rev. B: Condens. Matter Mater. Phys., 2012, 85, 155454 CrossRef.
- Q. Liu, H. Y. Zhang, H. W. Zhong, S. M. Zhang and S. L. Chen, Electrochim. Acta, 2012, 81, 313–320 CrossRef CAS.
- H. Wang, T. Maiyalagan and X. Wang, ACS Catal., 2012, 2, 781–794 CrossRef CAS.
- J. Gao, J. Zhong, L. L. Bai, J. Y. Liu, G. Q. Zhao and X. H. Sun, Sci. Rep., 2014, 4, 3606 CrossRef PubMed.
- M. G. Jiao, W. Song, K. Li, Y. Wang and Z. J. Wu, J. Phys. Chem. C, 2016, 120, 8804–8812 CAS.
- G. L. Chai and Z. X. Guo, Chem. Sci., 2016, 7, 1268–1275 RSC.
- D. H. Lee, W. J. Lee, S. O. Kim and Y. H. Kim, Phys. Rev. Lett., 2011, 106, 175502 CrossRef PubMed.
- X. G. Fu, Y. R. Liu, X. P. Cao, J. T. Jin, Q. Liu and J. Y. Zhang, Appl. Catal., B, 2013, 130, 143–151 CrossRef.
- D. J. Li, U. N. Maiti, J. Lim, D. S. Choi, W. J. Lee, Y. Oh, G. Y. Lee and S. O. Kim, Nano Lett., 2014, 14, 1228–1233 CrossRef CAS PubMed.
- X. G. Fu, J. Y. Choi, P. Zamani, G. P. Jiang, M. A. Hoque, F. M. Hassan and Z. W. Chen, ACS Appl. Mater. Interfaces, 2016, 8, 6488–6495 CAS.
- J. E. Kim, J. Lim, G. Y. Lee, S. H. Choi, U. N. Maiti, W. J. Lee, H. J. Lee and S. O. Kim, ACS Appl. Mater. Interfaces, 2016, 8, 1571–1577 CAS.
- X. Zhang, Z. Wu, L. Li, Y. Li, H. Xu, X. Li, X. Yu, Z. Zhang, Y. Liang and H. Wang, Nat. Commun., 2017, 8, 14675 CrossRef PubMed.
- S. R. Stoyanov, A. V. Titov and P. Král, Coord. Chem. Rev., 2009, 253, 2852–2871 CrossRef CAS.
- X. Chen, F. Li, N. L. Zhang, L. An and D. G. Xia, Phys. Chem. Chem. Phys., 2013, 15, 19330–19336 RSC.
- S. Kattel and G. F. Wang, J. Mater. Chem. A, 2013, 1, 10790–10797 CAS.
- K. Srinivasu and S. K. Ghosh, J. Phys. Chem. C, 2013, 117, 26021–26028 CAS.
- E. F. Holby, G. Wu, P. Zelenay and C. D. Taylor, J. Phys. Chem. C, 2014, 118, 14388–14393 CAS.
- S. Kattel, P. Atanassov and B. Kiefer, Phys. Chem. Chem. Phys., 2014, 16, 13800–13806 RSC.
- S. Kattel and G. F. Wang, J. Phys. Chem. Lett., 2014, 5, 452–456 CrossRef CAS PubMed.
- W. I. Choi, B. C. Wood, E. Schwegler and T. Ogitsu, Adv. Energy Mater., 2015, 5, 1501423 CrossRef.
- D. W. Kim, O. L. Li and N. Saito, Phys. Chem. Chem. Phys., 2014, 16, 14905–14911 RSC.
- W. Liang, J. X. Chen, Y. W. Liu and S. L. Chen, ACS Catal., 2014, 4, 4170–4177 CrossRef CAS.
- C. E. Szakacs, M. Lefevre, U. I. Kramm, J. P. Dodelet and F. Vidal, Phys. Chem. Chem. Phys., 2014, 16, 13654–13661 RSC.
- Z. S. Lu, G. L. Xu, C. Z. He, T. X. Wang, L. Yang, Z. X. Yang and D. W. Ma, Carbon, 2015, 84, 500–508 CrossRef CAS.
- A. G. Saputro and H. Kasai, Phys. Chem. Chem. Phys., 2015, 17, 3059–3071 RSC.
- F. He, K. Li, G. Y. Xie, Y. Wang, M. G. Jiao, H. Tang and Z. J. Wu, Phys. Chem. Chem. Phys., 2016, 18, 12675–12681 RSC.
- K. X. Liu, S. Kattel, V. Mao and G. F. Wang, J. Phys. Chem. C, 2016, 120, 1586–1596 CAS.
- C. R. Raj, A. Samanta, S. H. Noh, S. Mondal, T. Okajima and T. Ohsaka, J. Mater. Chem. A, 2016, 4, 11156–11178 CAS.
- V. Tripkovic, M. Vanin, M. Karamad, M. E. Bjorketun, K. W. Jacobsen, K. S. Thygesen and J. Rossmeisl, J. Phys. Chem. C, 2013, 117, 9187–9195 CAS.
- M. J. Cheng, Y. Kwon, M. Head-Gordon and A. T. Bell, J. Phys. Chem. C, 2015, 119, 21345–21352 CAS.
- G. Kresse and J. Hafner, Phys. Rev. B: Condens. Matter Mater. Phys., 1993, 47, 558–561 CrossRef CAS.
- G. Kresse and J. Hafner, Phys. Rev. B: Condens. Matter Mater. Phys., 1994, 49, 14251–14269 CrossRef CAS.
- G. Kresse and J. Furthmüller, Phys. Rev. B: Condens. Matter Mater. Phys., 1996, 54, 11169–11186 CrossRef CAS.
- G. Kresse and J. Furthmüller, Comput. Mater. Sci., 1996, 6, 15–50 CrossRef CAS.
- J. P. Perdew, K. Burke and M. Ernzerhof, Phys. Rev. Lett., 1996, 77, 3865–3868 CrossRef CAS PubMed.
- J. K. Nørskov, J. Rossmeisl, A. Logadottir, L. Lindqvist, J. R. Kitchin, T. Bligaard and H. Jónsson, J. Phys. Chem. B, 2004, 108, 17886–17892 CrossRef.
- J. Yang, D. J. Liu, N. N. Kariuki and L. X. Chen, Chem. Commun., 2008, 329–331 RSC.
- X. Wan, H. Wang, H. Yu and F. Peng, J. Power Sources, 2017, 346, 80–88 CrossRef CAS.
- S. Seo, K. Lee, M. Min, Y. Cho, M. Kim and H. Lee, Nanoscale, 2017, 9, 3969–3979 RSC.
- M. R. Mananghaya, J. Chem. Sci., 2015, 127, 751–759 CrossRef CAS.
- Y. Hori, A. Murata and R. Takahashi, J. Chem. Soc., Faraday Trans. 1, 1989, 85, 2309–2326 RSC.
- A. A. Peterson, F. Abild-Pedersen, F. Studt, J. Rossmeisl and J. K. Nørskov, Energy Environ. Sci., 2010, 3, 1311–1315 CAS.
Footnote |
| † Electronic supplementary information (ESI) available: Bond length, bond angle, total spin angular momentum, d-band center, partial density of states and graphical representation of each TM-4N2V-CNT model and the formation energy of each intermediate. See DOI: 10.1039/c7cp06024f |
| This journal is © the Owner Societies 2017 |

