 Open Access Article
Dealloying progress during nanoporous structure evolution analyzed by in situ resistometry
Eva-Maria
Steyskal
 *a,
Michael
Seidl
a,
Matthias
Graf
 b and
Roland
Würschum
 a
a
aInstitute of Materials Physics, Graz University of Technology, Petersgasse 16, 8010 Graz, Austria. E-mail: steyskal@tugraz.at
bInstitute of Materials Physics and Technology, Hamburg University of Technology, Eißendorfer Straße 42, 21073 Hamburg, Germany
First published on 25th October 2017
Abstract
The progress of dealloying, an electrochemical synthesis method capable of producing nanoporous structures with bulk outer dimensions, is studied by in situ resistometry. The resistance increases by three orders of magnitude while nanoporous gold or platinum is formed. Simultaneous monitoring of charge flow and electrical resistance increase proves to be an ideal combination for analyzing the etching progress, which in accordance with recent studies can be demonstrated to occur in two steps referred to as ‘primary (or bulk) dealloying’ and ‘secondary (or ligament) dealloying’. A model is developed, which describes the resistance increase during etching as governed by the reduction of the master alloy backbone in favor of the nanoporous structure. This new approach allows an evaluation of the etching front propagation (primary dealloying) as well as the status of the already porous structure (secondary dealloying).
1 Introduction
Dealloying is an (electro-)chemical process in which the less noble component is removed from a master alloy by selective etching.1 By this method bulk quantities of nanoporous (np) metals can be produced, which find application in different fields of science and technology, ranging from energy storage2,3 and (electro-)catalysis4–8 to sensing9–12 and electrochemical property tuning.13–19Dealloying is known to occur in a variety of different alloy systems, ranging from simple solid solution binary alloys1,20 to more complex systems such as intermetallic compounds21,22 or ternary alloys.23,24 By far the most intensively studied dealloyed material is nanoporous gold (np-Au), selectively etched from solid solution Ag–Au master alloys,1 with typical pore sizes in the range of tens of nanometers. However, among the variety of other dealloyable systems known in the literature, even smaller ligament diameters and pore sizes as low as a few nanometers can be achieved.25
The process of dealloying itself, with its variety of adjustable parameters, strongly influences the properties of the resulting nanostructure such as pore- and ligament sizes, macroscopic shrinkage, internal stresses, oxide formation, or the concentration of the less noble component remaining in the porous network.26 In order to achieve a deeper understanding of the underlying mechanisms, the etching process is investigated actively in the literature, e.g. by computer simulations,1,27,28 X-ray29,30 and imaging techniques.31,32 However, all available data were either obtained ex situ or for microscopic portions of material (surfaces, thin films) only, mainly discussing atomistic processes at the etch front. In situ studies of the etching progress of macroscopic samples have not been presented so far.
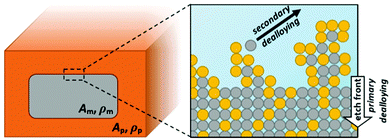
As shown by ex situ SEM studies,32 dealloying proceeds in two stages, referred to as ‘primary (or bulk) dealloying’ and ‘secondary (or ligament) dealloying’. Primary dealloying describes the progress of a sharp etching front into the master alloy, already creating a network with nanometer sized pores. However, in this primary etching step a certain amount of less noble atoms will remain beyond the surface inside the network ligaments. Diffusive restructuring of the formed ligaments in the following will expose further sacrificial atoms to the surface where they can be dissolved in a secondary dealloying step, while the etch front is further proceeding into the bulk material.32 The final structure of the nanoporous metal will thus decisively depend on the combination of these processes, which are illustrated below in Fig. 1.
Both primary and secondary dealloying, are associated with faradaic charge transfer. Therefore, monitoring the charge flow during a dealloying experiment using a macroscopic sample is not sufficient for evaluating separately the progress of the etching front (primary dealloying) or the status of the porous structure (secondary dealloying). A quantity perfectly capable of complementing the charge measurements is the electrical resistance, which is specifically sensitive to the primary dealloying process due to the associated reduction in the conductive cross section.
In this work we present the first dynamical analysis of porous network growth upon dealloying a macroscopic sample. The etching progress of solid solution alloys is investigated based on in situ resistometry data with nanoporous gold (np-Au) and platinum (np-Pt) as examples.
2 Experimental
Nanoporous gold (np-Au) and platinum (np-Pt) were produced from Ag73Au27 and Cu75Pt25 master alloys by dealloying. For the presented dealloying experiments a rectangular platelet of master alloy was contacted by five well annealed, flattened wires consisting of the more noble alloy component, which were clenched around the platelet in line. In the case of ductile Au this connection was sufficient for a stable signal, for Pt the contacts had to be fixed by a droplet of Crystalbond 509 glue (Aremco) to minimize electrical contact issues during the measurements. The alloy platelet was immersed into the dealloying electrolyte hanging on its wires, using the mid-positioned wire as working electrode contact to a PGZ-100 potentiostat (Radiometer Analytical) and the other four wires for four point resistance measurements with a Keithley 2400 Source Meter.†Table 1 summarizes details of the dealloying experiments presented here, including master alloys and dealloying potentials in reference to Ag/AgCl (Radiometer Analytical, saturated KCl). The applied parameters were chosen based on previous research, published by our group17,18,33 as well as others.34 The charge transfer during dealloying was calculated by continuously integrating the measured current i, corrected for leakages by subtracting a constant value determined from the transient at the end of the etching process. The dealloying experiments were stopped when the fading current had reached a stable value. Occasionally visible spikes in the dealloying curve are caused by coinciding measuring pulses from the ohmmeter: the four point current, which has to be sufficiently high for accurate resistance measurements, causes certain irregularities in the potentiostat's current curve, yet does not disturb the experiment as discussed in our previous work.18,35
| M [mg] | V 0 [mm3] | electrolyte | U [V] | |
|---|---|---|---|---|
| np-Au | 86 | 16 × 5 × 0.08 | 0.1 M AgNO3 | +1.300 |
| np-Pt | 52 | 12 × 3 × 0.12 | 1.0 M H2SO4 | +1.075 |
3 Results and discussion
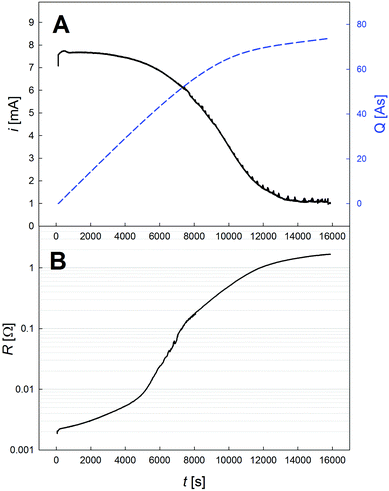
During the dealloying process, the master alloy cross section decreases at the expense of the emerging porous structure, which is illustrated in Fig. 1, showing the notations used for the resistometric model of dealloying presented in the following. A typical current transient of dealloying, recorded for np-Au, is shown in Fig. 2A. The sacrificial element, here Ag, is dissolved from the master alloy, along with a concomitant oxide formation, adding up to a total charge transfer Qtot of about 74 C in the present experiment. While the nanoporous structure is formed, the resistance (see Fig. 2B) increases by about three orders of magnitude from an initial value R0 (here 2.1 mΩ) to a final value Rfin (here 1.7 Ω).This enormous resistivity difference between the master alloy and the final porous structure is used here to develop a model which gives new insights into the etching process. As schematically illustrated in Fig. 1, during dealloying the master alloy backbone (index m) is surrounded by the porous structure (index p), each characterized by the resistance
 | (1) |
 | (2) |
During the major part of the experiment this conductance is dominated by the shrinking master alloy backbone (R/R0 ≈ A0/Am), since, as long as there is a substantial backbone left in the sample, the contribution of the porous structure to the overall conductance is negligible due to its much higher effective resistivity ρp compared to the alloy.
By using the resistance values R0 and Rfin, measured at the beginning and the end of the etching process, the sample length in eqn (2) can be substituted by l = R0/fin·A0/ρm/fin, leading to the expression
 | (3) |
This parallel circuit description is also rather stable with regards to thickness variations of the master alloy backbone along the sample that might arise during the etching process: in a linear approximation small variations |ΔA| ≪ A0 do not affect the resistance.
If the etching front was directly leaving behind the nanoporous structure in its final condition (in a single-step process), the cross sections Ap and Am at a given time during the etching process should simply be related to the charge Q′ transferred up to this time, if slight volume shrinkages37 due to dealloying are neglected, i.e.:
 | (4) |
However, due to the two processes involved in dealloying, the assumption of a simple proportionality between charge flow and relative porous cross section is invalid. The experimentally measured charge flow Q related to given cross sections Ap and Am will be smaller than Q′ of the single-step process, since further charge consumption will also take place in the porous structure until ρp = ρfin is reached by secondary dealloying. The ratio of these charges
 | (5) |
| ρp = ρm + a·(ρfin − ρm) ≈ a·ρfin. | (6) |
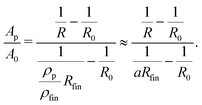
The approximation on the right side holds due to the huge resistivity difference ρm ≪ ρp. With this approximation (a ≈ ρp/ρfin) and the relations given in (4) and (5), eqn (3) can be transformed into a quadratic equation for a in which the degree of dealloying is determined exclusively by measurement parameters:
 | (7) |
Since primary and secondary dealloying together add up to the total charge flow, from the degree of dealloying a, i.e., the status of the porous structure, also the relative cross sections Ap/A0 and Am/A0 can be determined. Transforming eqn (2) with the aforementioned substitution for l gives
 | (8) |
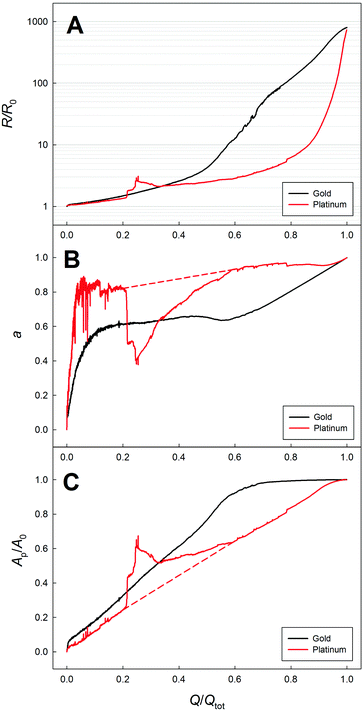
In the following the in situ resistometry data are evaluated in the framework of this model. For this purpose the relative resistance increase recorded during dealloying np-Au (black) and np-Pt (red) is shown in Fig. 3 as a function of transferred charge Q/Qtot, which beside the electrical resistance is the second parameter used for the model (eqn (7)). Compared to Fig. 2 this plot is more stretched at early stages of the dealloying experiment due to the higher charge transfer at the beginning. The data recorded for platinum do not possess the smoothness of the comparable signal recorded for nanoporous gold (Fig. 3A). This indicates that, in spite of fixing the wires on the sample surface as described above, the resistometric contacts are less stable than for gold due to lower ductility and stronger oxidation.18,33 Nevertheless the resistance trends are obvious: compared to np-Au the resistance of the np-Pt sample remains at a lower level during a larger part of the etching process and increases steeply at the end, where a total increase by about three orders of magnitude is observed for both samples.
 | ||
| Fig. 3 Increase of the electrical resistance R as a function of charge flow Q/Qtot recorded for nanoporous gold (black) and platinum (red) during dealloying (A) with the corresponding degree of dealloying a (B), and relative porous cross section area Ap/A0 (C) according to eqn (7) and (8). | ||
The corresponding degrees of dealloying a as well as the corresponding ratios Ap/A0 according to eqn (7) and (8) are presented in Fig. 3B and C. For platinum the contact issues in early stages of the experiment lead to an erratic behavior of the calculated curves, which is especially visible in the unphysical, sudden jump of the calculated properties at Q/Qtot of about 20%. In order to give a reasonable description of the actual trend, the curve was approximated linearly for Q/Qtot between 20% and 60% (dashed red lines).
The differences between the etching behavior of the two systems are obvious in all three sub-plots, showing a faster growth of the porous structure and a stronger pronounced secondary dealloying process in the case of gold. The observed trends, which will be discussed in detail in the following, can be assigned to the higher mobility of surface atoms as indicated by the lower melting point of Au.
For both metals a increases steeply at the beginning and then becomes approximately constant over a wide range of the experiment, before it starts to increase again, approaching the final state with a = 100%. However, the degree of dealloying reaches its constant regime at a significantly higher value of a in the case of platinum and remains constant for a longer range of charge transfer up to Q/Qtot of about 90%. Since the overall resistance of the samples is dominated by the remaining master alloy cross section over a wide range of the experiment, the faster resistance increase observed for gold (Fig. 3A) indicates that the etch front is progressing into the bulk faster with charge flow compared to platinum, which is in line with Fig. 3C. This faster growth of the porous structure is only possible, however, if the structure behind the etch front differs stronger from the final state. This means that more charge transfer by secondary dealloying takes place in the case of gold, which is confirmed by the generally lower degree of dealloying a. The smaller contribution to the total charge transfer by secondary dealloying in the case of Cu–Pt may be related to the formation of smaller ligaments, which is associated with a more thorough removal of Cu.33 Ligament sizes determined earlier in the literature for the here used dealloying systems of np-Au34 and np-Pt33 confirm the trends of significantly smaller/bigger ligaments for platinum/gold as also expected from the previous results.
With increasing a towards the end of the etching process, the contribution of secondary dealloying to the charge transfer gets stronger. The resistance increases further due to an ongoing decrease of the master alloy backbone (primary dealloying), leading to an enhanced contribution of the conduction in the porous structure, while concommitantly ρp increases due to further etching (secondary dealloying). At the end of the dealloying process Rfin is about three orders of magnitude higher than that of the initial master alloy. Clearly, this huge increase cannot be explained by classical descriptions for porous materials as given by Gibson and Ashby,36 which are based on the relative density φ*/φs of the porous structure (φ*) compared to the solid (φs). According to the Gibson–Ashby model a resistance increase by less than a factor of 4 would be expected in the case of the present np-Au platelet, based on the assumption φ*/φs ≈ 0.4 due to a complete removal of silver without outer dimensional changes.
Such an incompatibility with the Gibson–Ashby model has been reported previously for the mechanical properties of dealloyed materials.38,39 Besides a general weakness of the Gibson–Ashby model for describing porous structures with relatively high φ*/φs values due to overcounting of ligaments, also the special topology of dealloyed metals has to be taken into account: while the description by Gibson and Ashby is based on a perfectly connected polyhedral foam as model-structure, nanoporous metals prepared by dealloying contain a large fraction of broken or dangling ligaments. These unconnected network branches do not contribute to the macroscopic strength of the material as ‘load bearing ligaments’. Therefore the network connectivity has to be taken into account for a proper description.38 ‘Effective’ relative densities of dealloyed materials were found to be only 1/4 of the real relative densities.39
A similar concept may apply for the present case of electrical resistance, since conductive channels are only given by load bearing ligaments in the network. However, the sample oxidation during dealloying also makes an important contribution: for dealloyed, nanoporous platinum an electrical resistance decrease by about a factor of 10 was found to be associated with the reduction of the primary oxide.18 Therefore the high resistance of the dealloyed structure has to be considered as originating from a combination of porosity and oxide.
4 Conclusions
In conclusion, this study presents the first in situ resistometry experiments during dealloying, along with a model capable of describing the etching progress based on charge transfer and electrical resistance. Since the dealloying process is a combination of two mechanisms, denoted ‘primary (or bulk) dealloying’ and ‘secondary (or ligament) dealloying’, which are both associated with charge transfer, a thorough description of the etching progress cannot be given based on monitoring the charge flow only. In combination with resistometry however, a dynamical description of the alloy and porous cross section as well as of the etching progress in the already porous structure could be developed here.During the evolution of nanoporous gold and platinum, which are obtained from solid solution alloys, the electrical resistance of the samples increases in each case by about three orders of magnitude due to nanoporosity evolution and concomitant oxide formation. A comparison of the data obtained for both metals shows that primary dealloying is pronounced much stronger for platinum compared to gold. This behavior is assigned to the ligament sizes in the respective structures, which are known to scale inversely with the melting points.
The presented model will provide a significantly enhanced control over the dealloying of macroscopic solid solution samples. Future experiments should also be extended to more complex alloy types where the model description might require to be adjusted adequately. Especially the assumption of a porous network with negligible resistance contribution compared to the master alloy backbone may not trivially be valid for all cases of multiphase alloys. Moreover, systematic studies of the etching progress with regards to different experimental parameters such as alloy stoichiometries or etching rates may provide new insights into this technologically important corrosion processes.
Conflicts of interest
There are no conflicts to declare.References
- J. Erlebacher, M. J. Aziz, A. Karma, N. Dimitrov and K. Sieradzki, Nature, 2001, 410, 450–453 CrossRef CAS PubMed.
- X. Lang, H. Yuan, Y. Iwasa and M. Chen, Scr. Mater., 2011, 64, 923–926 CrossRef CAS.
- X. Lang, A. Hirata, T. Fujita and M. Chen, Nat. Nanotechnol., 2011, 6, 232–236 CrossRef CAS PubMed.
- V. Zielasek, B. Jürgens, C. Schulz, J. Biener, M. M. Biener, A. V. Hamza and M. Bäumer, Angew. Chem., Int. Ed., 2006, 45, 8241–8244 CrossRef CAS PubMed.
- T. Fujita, P. Guan, K. McKenna, X. Lang, A. Hirata, L. Zhang, T. Tokunaga, S. Arai, Y. Yamamoto, N. Tanaka, Y. Ishikawa, N. Asao, Y. Yamamoto, J. Erlebacher and M. Chen, Nat. Mater., 2012, 11, 775–780 CrossRef CAS PubMed.
- Y. Ding, M. Chen and J. Erlebacher, J. Am. Chem. Soc., 2004, 126, 6876–6877 CrossRef CAS PubMed.
- R. Zeis, A. Mathur, G. Fritz, J. Lee and J. Erlebacher, J. Power Sources, 2007, 165, 65–72 CrossRef CAS.
- A. Wittstock, J. Biener and M. Baumer, Phys. Chem. Chem. Phys., 2010, 12, 12919–12930 RSC.
- J.-F. Huang and I.-W. Sun, Adv. Funct. Mater., 2005, 15, 989–994 CrossRef CAS.
- F. Meng, X. Yan, J. Liu, J. Gu and Z. Zou, Electrochim. Acta, 2011, 56, 4657–4662 CrossRef CAS.
- H. Ji, X. Wang, C. Zhao, C. Zhang, J. Xu and Z. Zhang, CrystEngComm, 2011, 13, 2617–2628 RSC.
- S. H. Kim, J. B. Choi, Q. N. Nguyen, J. M. Lee, S. Park, T. D. Chung and J. Y. Byun, Phys. Chem. Chem. Phys., 2013, 15, 5782–5787 RSC.
- J. Biener, A. Wittstock, L. A. Zepeda-Ruiz, M. M. Biener, V. Zielasek, D. Kramer, R. N. Viswanath, J. Weissmüller, M. Bäumer and A. V. Hamza, Nat. Mater., 2009, 8, 47–51 CrossRef CAS PubMed.
- H.-J. Jin and J. Weissmüller, Adv. Eng. Mater., 2010, 12, 714–723 CrossRef CAS.
- H.-J. Jin and J. Weissmüller, Science, 2011, 332, 1179–1182 CrossRef CAS PubMed.
- A. K. Mishra, C. Bansal and H. Hahn, J. Appl. Phys., 2008, 103, 094308 CrossRef.
- P. Wahl, T. Traussnig, S. Landgraf, H.-J. Jin, J. Weissmüller and R. Würschum, J. Appl. Phys., 2010, 108, 073706 CrossRef.
- E.-M. Steyskal, Z. Qi, P. Pölt, M. Albu, J. Weissmüller and R. Würschum, Langmuir, 2016, 32, 7757–7764 CrossRef CAS PubMed.
- E.-M. Steyskal, C. Wiednig, N. Enzinger and R. Würschum, Beilstein J. Nanotechnol., 2016, 7, 1197–1201 CrossRef CAS PubMed.
- D. Pugh, A. Dursun and S. Corcoran, J. Mater. Res., 2003, 18, 216–221 CrossRef CAS.
- X. Wang, J. Frenzel, W. Wang, H. Ji, Z. Qi, Z. Zhang and G. Eggeler, J. Phys. Chem. C, 2011, 115, 4456–4465 CAS.
- X. Wang, Z. Zhang, H. Ji, J. Xu, X. Huang and Y. Ma, Appl. Surf. Sci., 2012, 258, 9073–9079 CrossRef CAS.
- H.-J. Jin, X.-L. Wang, S. Parida, K. Wang, M. Seo and J. Weissmüller, Nano Lett., 2010, 10, 187–194 CrossRef CAS PubMed.
- X. Wang, J. Sun, C. Zhang, T. Kou and Z. Zhang, J. Phys. Chem. C, 2012, 116, 13271–13280 CAS.
- Q. Chen and K. Sieradzki, Nat. Mater., 2013, 12, 1102–1106 CrossRef CAS PubMed.
- M. Graf, B. Roschning and J. Weissmüller, J. Electrochem. Soc., 2017, 164, C194–C200 CrossRef CAS.
- J. Erlebacher, J. Electrochem. Soc., 2004, 151, C614–C626 CrossRef CAS.
- P. Strasser, S. Koh and J. Greeley, Phys. Chem. Chem. Phys., 2008, 10, 3670–3683 RSC.
- F. U. Renner, A. Stierle, H. Dosch, D. M. Kolb, T. L. Lee and J. Zegenhagen, Phys. Rev. B: Condens. Matter Mater. Phys., 2008, 77, 235433 CrossRef.
- C. J. Dotzler, B. Ingham, B. N. Illy, K. Wallwork, M. P. Ryan and M. F. Toney, Adv. Funct. Mater., 2011, 21, 3938–3946 CrossRef CAS.
- T. P. Moffat, F.-R. F. Fan and A. J. Bard, J. Electrochem. Soc., 1991, 138, 3224–3235 CrossRef CAS.
- X.-L. Ye, N. Lu, X.-J. Li, K. Du, J. Tan and H.-J. Jin, J. Electrochem. Soc., 2014, 161, C517–C526 CrossRef.
- E.-M. Steyskal, M. Besenhard, S. Landgraf, Y. Zhong, J. Weissmüller, P. Pölt, M. Albu and R. Würschum, J. Appl. Phys., 2012, 112, 073703 CrossRef.
- J. Snyder, K. Livi and J. Erlebacher, J. Electrochem. Soc., 2008, 155, C464–C473 CrossRef CAS.
- E.-M. Steyskal, S. Topolovec, S. Landgraf, H. Krenn and R. Würschum, Beilstein J. Nanotechnol., 2013, 4, 394–399 CrossRef PubMed.
- L. J. Gibson and M. F. Ashby, Cellular solids – Structure and properties – Second edition, Cambridge University Press, 1999 Search PubMed.
- S. Parida, D. Kramer, C. A. Volkert, H. Rösner, J. Erlebacher and J. Weissmüller, Phys. Rev. Lett., 2006, 97, 035504 CrossRef CAS PubMed.
- N. Mameka, K. Wang, J. Markmann, E. T. Lilleodden and J. Weissmüller, Mater. Res. Lett., 2016, 4, 27–36 CrossRef.
- L.-Z. Liu, X.-L. Ye and H.-J. Jin, Acta Mater., 2016, 118, 77–87 CrossRef CAS.
Footnote |
| † For a more detailed description of the resistometry procedure, the reader is referred to our previous work on the tunable resistance of nanoporous Pt [18] and Pd [19]. |
| This journal is © the Owner Societies 2017 |


