
 Open Access Article
 This Open Access Article is licensed under a Creative Commons Attribution-Non Commercial 3.0 Unported Licence
Voltammetric and spectroscopic study of ferrocene and hexacyanoferrate and the suitability of their redox couples as internal standards in ionic liquids†
Ninett
Frenzel
 ,
Jennifer
Hartley
and
Gero
Frisch
*
,
Jennifer
Hartley
and
Gero
Frisch
*
Institut für Anorganische Chemie, TU Bergakademie Freiberg, Leipziger Str. 29, 09599 Freiberg, Germany. E-mail: gero.frisch@chemie.tu-freiberg.de
First published on 13th September 2017
Abstract
Ionic liquids and deep eutectic solvents have great potential in metallurgical applications as specialised solvents. In order to design ionometallurgical electrowinning and electrorefining processes, it is essential to characterise the electrochemical behaviour of metal complexes and compare potentials between relevant solvents. For such investigations, a universal reference redox couple would be desirable. In this study we investigate the speciation and electrochemical behaviour of ferrocenium/ferrocene and hexacyanoferrate(III/II) as possible reference couples for 15 different ionic media on platinum (Pt), glassy carbon (GC) and gold (Au) working electrodes. Amongst other parameters, formal electrode potentials, charge transfer coefficients, and rate constants were calculated. It was found that neither ferrocene nor hexacyanoferrate are universally suitable as redox standards in the liquids investigated. Nevertheless, hexacyanoferrate exhibits clear advantages in most of the strongly coordinating ionic liquids studied here.
1 Introduction
Ionic liquids (ILs) and Deep Eutectic Solvents (DESs) are commonly described as Designer Solvents. This is based on the rationale that amongst the large number of possible cation–anion combinations, there will be at least one that gives a solute any desired properties.1,2 For metallurgical applications, we have shown that control over metal complexation by judicious choice of the solvent anion allows manipulation of electrochemical series for metal extraction, refining and recycling processes.3 However, comparison of redox potentials between different solvents requires a solvent-independent reference system.In current ionic liquids research, quasi-reference electrodes are commonly employed. These involve the use of a wire, such as silver4–6 platinum,7–9 magnesium10 or aluminium,11 either directly in contact with the solution, or separated from the analyte via the means of a frit or Haber–Luggin capillary.12,13 With separation of the reference wire from the analyte, side reactions will be prevented. Additionally, if the quasi-reference and working electrode are made from the same material, the reference potential will be fixed at zero. This is convenient for specific applications such as controlling the potential in aluminium plating baths, by using an aluminium wire reference electrode, but does not allow comparison of redox potentials between solvents.
In aqueous media, the redox potentials of a wide range of different species and complexes are well defined14 due to the availability of stable reference electrodes, such as the AgCl/Ag or calomel electrodes, whose potentials are known relative to the standard hydrogen electrode. Most of these electrodes will not provide a suitable reference in ionic fluids, due to the presence of ill-defined liquid junction potentials, which will add an unknown, and possibly substantial, value to the reference potential.15 Substituting the aqueous electrolyte for an ionic liquid avoids this issue.16 In these types of reference electrodes, typically a metal wire is placed in a solution of known metal ion concentration, e.g. Ag/AgTf,14,17 Ag/AgBF4,18 Ag/AgNO3,19 or Ag/AgCl,16 dissolved in the same solvent as the test solution. However, redox potentials are not necessarily comparable between solvents due to differences in speciation and solubility of the redox active species. As the anionic component of each ionic liquid is varied, the speciation of the metal cation in the quasi-reference electrode will also change. Hence, quasi-reference electrodes will produce a stable, but liquid-dependent potential. To define fixed reference potentials in different ionic liquids, it is essential that quasi-reference electrodes be used in conjunction with an internal standard that is stable across a wide range of different solvents.19–21
Commonly used redox standards for comparing potentials between different IL media include the IUPAC-recommended ferrocene,22–26 bis(biphenyl)chromium,27 and cobaltocene.7,8,28–30 Yet, the use of ferrocene as internal standard can be problematic and there is, mostly anecdotal, evidence of the following issues:
(I) the solubility of ferrocene in some ionic liquids is not high enough to enable electrochemical measurements, especially in cases where high viscosity (i.e. slow mass transport) will slow down the electrode reaction;
(II) the ferrocenium ion can react with components of the ionic liquid, if the FeCp2+/0 redox potential and the anodic end of the potential window of the liquid are in the same range;
(III) the FeCp2+/0 redox potential can be highly dependent on solvation effects in different ILs;20,25,31
(IV) ferrocene has a significant vapour pressure and it is hence difficult to make solutions of exact concentrations, especially if the sample is heated.
Other redox couples used in IL media are I2/I3−,32 or Li+/Li,33 however these are less well studied and can be more situational.
In this study, we explore the redox chemistry of hexacyanoferrate in a range of ILs and DESs with anions of different ligand strength and attempt to evaluate its suitability as an internal redox standard. In particular, we evaluate parameters that verify their chemical stability and the reversibility of the electrode reaction. Whilst the redox potentials of hexacyanoferrate salts depend on solvent parameters such as ionic strength in aqueous solution,34 they have been used in the past as internal standards in ionic media.35 Here, we characterise the potassium salts of hexacyanoferrate(II) and (III), along with ferrocene, with respect to a reference which is either a fritted-off 0.1 M AgCl/Ag electrode in the solvent being studied, or an Ag wire quasi-reference. Redox behaviour and potentials are investigated via cyclic voltammetry, whereas UV-Vis or Raman spectroscopy are used to provide a measure of solute stability, by detecting any changes in speciation or other solvation effects. The electrochemical data have been modelled to evaluate reversibility and obtain parameters such as formal potentials, charge transfer coefficients, and rate constants.
2 Experimental
Structure formulae of all ionic solvents used in this study can be found in the ESI.† All DESs were made by the method described in previous publications.36,37 Mixtures were made with 1 mol eq. of choline chloride and 2 mol eq. of either 1,2-ethanediol (Ethaline), 1,2-propanediol (Propaline) or glycerol (Glyceline). The imidazolium-based ionic liquids, 1-ethyl-3-methylimidazolium acetate [C2mim][ac], 1-ethyl-3-methylimidazolium tetrafluoroborate [C2mim][BF4], 1-hexyl-3-methylimidazolium chloride [C6mim][Cl], 1-butyl-3-methylimidazolium dicyanamide [C4mim][DCN], 1-ethyl-3-methylimidazolium diethylphosphate [C2mim][DEP], 1-ethyl-3-methylimidazolium ethyl sulfate [C2mim][EtSO4], 1-butyl-3-methylimidazolium hydrogen sulfate [C4mim][HSO4], 1-ethyl-3-methylimidazolium bis(trifluoromethanesulfonylimide) [C2mim][NTf2], 1-ethyl-3-methylimidazolium trifluoromethanesulfonate [C2mim][OTf], 1-butyl-3-methylimidazolium hexafluorophosphate [C4mim][PF6], 1-ethyl-3-methylimidazolium thiocyanate [C2mim][SCN], and ethylammonium nitrate [EtA][NO3] (all >98% purity) were obtained from IoLiTec and used as received. Potassium hexacyanoferrate(II) trihydrate (99%, VVB Pharma Schering Adlershof), potassium hexacyanoferrate(III) (analytical grade, VEB Laborchemie Apolda), and ferrocene (98%, Aldrich) were tested for use as internal standards. Solutions were made with concentrations from 5 to 20 mM, with stirring at room temperature or 50 °C, and the same solutions were used for both spectroscopy and voltammetric analysis.Cyclic voltammetry (CV) investigations were carried out using a Gamry Instruments Interface1000 potentiostat controlled with Gamry Framework data acquisition software version 6.25. A three-electrode system was used, where the working electrode was a 3 mm diameter platinum or glassy carbon disc, or a 1 mm diameter gold disc, with a platinum wire counter electrode. The reference electrode was either a silver wire in a fritted-off solution of 0.1 M AgCl in the chloride-based liquids, or a silver wire quasi-reference electrode, separated from the analyte via a Haber–Luggin capillary in all other liquids. The working electrode was polished with 0.3 μm γ-alumina paste and rinsed with deionised water and acetone prior to each experiment. If not otherwise specified, all cyclic voltammograms were recorded at room temperature, with sweep rates varying from 5 to 100 mV s−1.
Ultraviolet-visible (UV-Vis) spectroscopy was carried out using a Jasco V670 UV/VIS/NIR spectrometer, with SpectraManager software. The sample path lengths were selected to ensure an absorbance below 4. Quartz cells of 1 mm path length were used for DES samples, and quartz slide cuvettes of 0.1 mm path length were used for the imidazolium samples, due to their higher viscosities and lower sample volumes. Vibrational spectroscopy was carried out using a Bruker RFS 100/S Raman spectrometer, with a Nd:YAG laser, operating at 1064 nm, using OPUS software, for samples where the intense colour of the neat IL prevented UV-Vis spectra being recorded or altered speciation was suspected.
DigiElch simulation software (ElchSoft) was used to obtain electrochemical parameters, such as formal potential with respect to the reference electrode ΔE, charge transfer coefficient α, and homogeneous rate constant ks from the measured voltammetric data. Fits were made on current vs. voltage data without compensation for resistance Ru or double layer capacitance. An example fit is shown in Fig. 1.
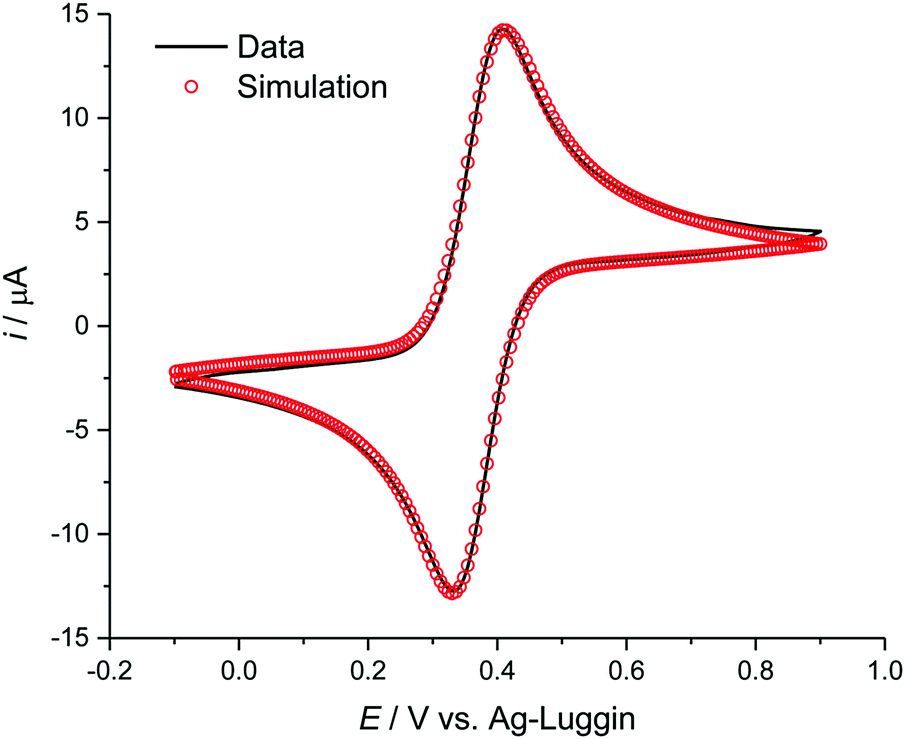 | ||
| Fig. 1 Cyclic voltammogram of ferrocene at 10 mM in [C4mim][OTf], simulated using DigiElch. | ||
During electrochemical measurements in ILs, double layer charging and solution resistance can occur. However, with the currents used here these are unlikely to be significant. Otherwise we would expect all peak potentials to vary with scan rate. During the measurements described here, we found several systems which we classified as electrochemically reversible, with peak potentials remaining stable across the different scan rates. This leads us to believe that uncompensated resistance is not a significant problem for these measurements.
In order to determine the water content of the samples, Karl-Fischer titration (Mettler Toledo Coulometric KF titrator) was carried out before and after all electrochemical measurements. Reported values are the average of a minimum of three measurements. The water content of the liquids used in this study varied from 0.1 to 1.0%, but some contained up to 3%. There were no efforts made to dry the liquids prior to measurement, as we aimed to emulate realistic conditions for ambient measurements. It was, however, carefully checked that speciation and important electrochemical parameters such as reversibility do not depend on water content under these conditions. Other parameters such as diffusion coefficients, which depend heavily on viscosity and hence water content, can be found in the ESI† but are not discussed further in this study.
3 Results and discussion
3.1 General considerations
In this study, complex stability and redox behaviour at Pt, GC and Au working electrodes were investigated for the IUPAC-recommended internal standard ferrocene, in comparison to the hexacyanoferrate(III/II) couple in 15 different ionic liquids. As mentioned previously, the usage of ferrocene as a “generic” internal standard in ILs should be handled with care. Cyclopentadienyl ligands have been observed interacting strongly with the hydrogen bonds of the IL, and the ferrocenium cation can build ion pairs with IL anions.20,21,31,38Hexacyanoferrate was selected for this investigation because cyanide is a strong ligand and is unlikely to be substituted. This is an advantage, as ligand exchange for a range of different anions has been observed to readily take place in chloride-rich DES media.39 It is also, especially in contrast to ferrocene, easier to handle and exhibits better stability40 and solubility20,25 in polar ionic solvents.
The redox potential of cyanoferrates can heavily depend on parameters such as ionic strength and pH. On the other hand, the same is true for the IUPAC-recommended reference couples such as ferrocene. One of the arguments for ferrocene is that the redox-active species have low or no charge, respectively and should hence be less prone to variation of chemical properties with ionic strength. In contrast, in an ionic solvent the redox potential between two highly, but similarly charged species, i.e. [Fe(CN6)]3− and [Fe(CN6)]4−, should be less sensitive to ionic strength compared to FeCp2 and [FeCp2]+ where one species is uncharged. Generally, speciation, ionic strength, and pH have a significant effect on the UV-Vis and Raman spectra of these ions,41–43 which allows facile quantitative and qualitative analysis of any issues that may affect comparability of redox potentials between solvents.
A redox process used as an internal standard has to conform to the following criteria: (I) the oxidised and reduced species should be sufficiently soluble in the solvent of choice20,24 and must form a stable species, ideally the same in each of the liquids.20 (II) The redox process must be electrochemically reversible, i.e. must exhibit fast electrode kinetics. In a cyclic voltammogram, this typically results in a peak potential separation of ca. 60 mV at 25 °C, a charge transfer coefficient of approximately α = 0.519,20,24 and a ratio between anodic and cathodic peak currents of Ipa/Ipc = 1. For such diffusion controlled redox processes, the Randles–Sevcik equation (eqn (1)) must be valid. According to this, the measured peak current density should be proportional to the square root of the sweep rate and to the concentration of the redox active species in solution:44
 | (1) |
Deviations from this behaviour indicate quasi-reversible or irreversible electrode kinetics. Quasi-reversible behaviour, i.e. symmetric drifting of peak potentials with scan rate, will allow for a meaningful reference by averaging peak potentials. Irreversible behaviour in the context of this study typically results from surface adsorption, preventing meaningful thermodynamic data from being obtained. The most obvious indicator of irreversible behaviour through surface adsorption is a peak current ratio that significantly deviates from a value of 1. High deviations indicate that the data should not be used. It is useful to keep in mind that Ipa/Ipc > 1 indicates adsorption of the reduced species, and Ipa/Ipc < 1 indicates adsorption of the oxidised species on the electrode surface.44,45
3.2 Speciation studies
A key criterion of an internal standard is that it forms a species that is stable over the course of an experiment, ideally across a range of different solvents. In order to assess the suitability of ferrocene and hexacyanoferrate(III) and -(II) as potential internal standards, UV-Vis and/or Raman spectra will be measured and compared for a range of different ILs with both strongly and weakly coordinating anions.In principle, ferrocene exhibits the typical UV-Vis bands known from conventional organic solvents, such as ethanol, in the following ionic liquids: [C2mim][BF4], [C2mim][DCN], [C2mim][EtSO4], [C4mim][HSO4], [C2mim][NTf2], [C2mim][OTf], [C2mim][PF6], and [EtA][NO3]. However, solvatochromic shifts of up to 15.5 nm were observable between the different solvents, e.g. the band maximum appears at 443 nm in [C2mim][BF4], and at 427.5 nm in [C2mim][DCN]. This indicates that the ferrocene species is strongly influenced by the different solvating properties of the ILs.
In [C2mim][ac], [C6mim][Cl], [C2mim][DEP], [C2mim][SCN], and the three DESs, no clearly defined absorption band is observed in the 440 nm region. The pure ionic liquids do not have any strong absorption in this region that could influence the spectra. In addition, these solutions have a deep red colour, in comparison to the orange hue of the solutions listed above. This would suggest that ferrocene is unstable under these conditions, possibly forming several species in the different ionic liquids. This can be illustrated using [C2mim][SCN] as an example: the UV-Vis spectrum exhibits an absorption band at 480 nm, which is typical for an Fe(III) thiocyanate complex.50–52 Therefore, ferrocene is not a suitable redox standard for these liquids.
![[thin space (1/6-em)]](https://www.rsc.org/images/entities/char_2009.gif) β = 43.9)53 it can be safely assumed that ligand exchange is insignificant in aqueous media. The equivalent stability constants in ionic media are unknown and ligand exchange for other (mostly weaker) complexes has been previously observed in a range of IL and DES media.39 To evaluate the stability of hexacyano complexes in ionic solvents, it is possible to compare UV-Vis or Raman spectra with the corresponding aqueous spectra.
β = 43.9)53 it can be safely assumed that ligand exchange is insignificant in aqueous media. The equivalent stability constants in ionic media are unknown and ligand exchange for other (mostly weaker) complexes has been previously observed in a range of IL and DES media.39 To evaluate the stability of hexacyano complexes in ionic solvents, it is possible to compare UV-Vis or Raman spectra with the corresponding aqueous spectra.
The solubility of potassium hexacyanoferrate(III) was high, with most liquids forming >100 mM solutions. Only in the hydrophobic ionic liquids [C2mim][NTf2] and [C4mim][PF6] the solubility was limited: whilst it was possible to produce a 2 mM solution in [C4mim][PF6],54 no significant amount of potassium hexacyanoferrate(III) would dissolve in [C2mim][NTf2], even after stirring for one month at 50 °C.
In the DESs Ethaline, Propaline and Glyceline, as well as the ionic liquid [C6mim][Cl], a series of absorption bands were observed at 272, 309, 324.5, and 431 nm, corresponding to a charge transition band and the 2T1g → 2E1g, 2T2u → 2T2g, 2T2g → 2A1g, and 2T1g → 2T2g transitions, respectively.55 The first of these bands was not taken into consideration due to the high absorption of the ionic solvents in this part of the spectrum. Fig. 2 and 3 compare the spectra of hexacyanoferrate(III) in these chloride-based liquids and water. The spectra are comparable between solvents with relatively small solvatochromic shifts, e.g. 2.5 nm between water and Ethaline. Changes in the spectra with concentration follow the Beer–Lambert law. Small deviations between the DESs and [C6mim][Cl] most likely originate from an error in pathlength, as a 100 μm glass slide cuvette had to be used due to the viscosity of the liquid. Based on the spectroscopic data, we conclude that there is no notable exchange of ligands in these liquids, despite the high activity of chloride in the solvent. The solvatochromic shift is significantly smaller than the shifts observed in the ferrocene spectra in Section 3.2.1.
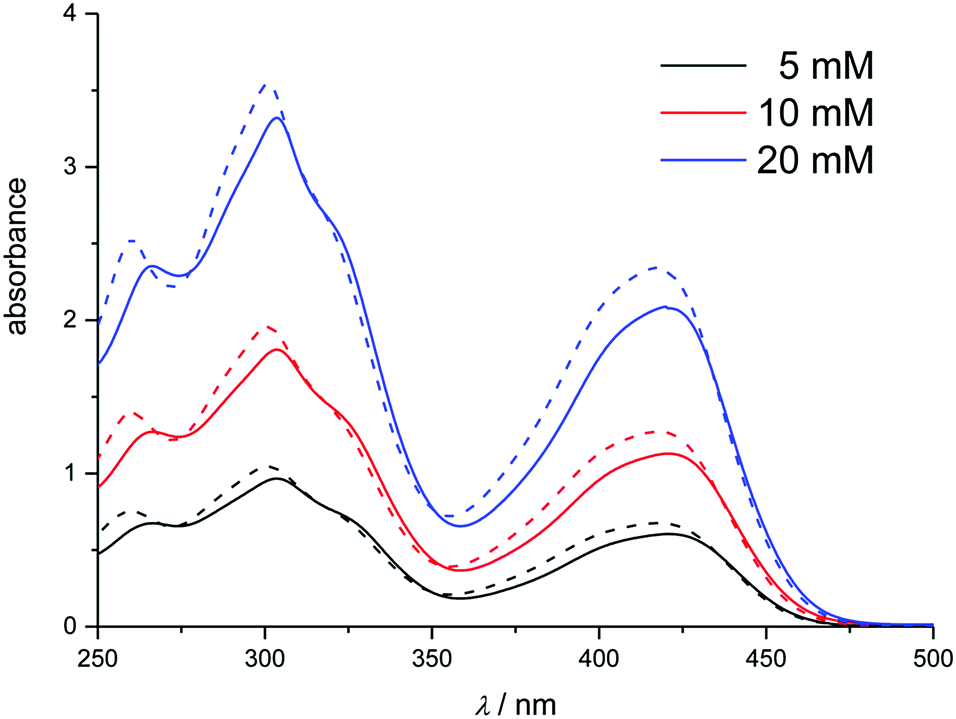 | ||
| Fig. 2 UV-Vis spectra of K3[Fe(CN)6] at 5, 10 and 20 mM in Ethaline (solid) and water (dashed). | ||
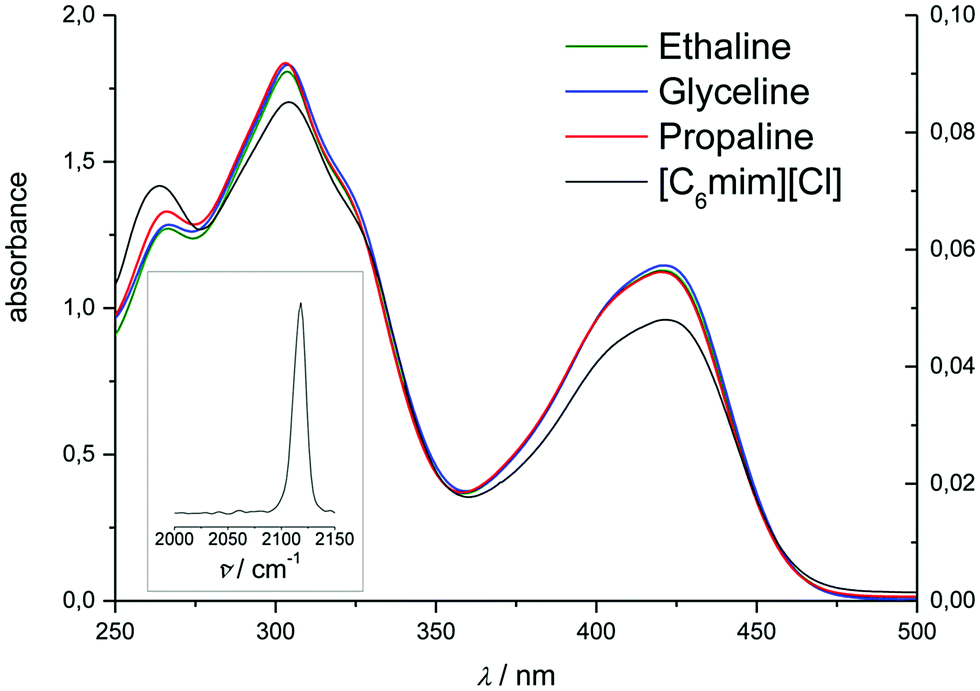 | ||
| Fig. 3 UV-Vis spectra of K3[Fe(CN)6] at 10 mM in Ethaline, Glyceline, Propaline (left-hand axis, 1 mm cuvette) and 5 mM [C6mim][Cl] (right-hand axis, 100 μm cuvette). Inset: Raman spectrum of K3[Fe(CN)6] in [C6mim][Cl]. | ||
UV-Vis spectra of hexacyanoferrate(III) solutions in [C2mim][ac], [C4mim][BF4], [C4mim][DCN], [C2mim][DEP], [C2mim][EtSO4], [C4mim][HSO4], [C2mim][OTf], [C4mim][PF6], and [EtA][NO3] exhibit the same overall pattern of the UV-Vis spectrum (Fig. 4). This would suggest that hexacyanoferrate(III) forms the same stable species as in the chloride-based systems. A slightly larger solvatochromic shift of up to 6.5 nm is observed compared to chloride-based liquids, indicating that hexacyanoferrate(III) has different solvation properties in the different media. On the other hand, the solvatochromic shift for ferrocene is significantly higher (15.5 nm), suggesting that the solvation of ferrocene has a greater dependence on the type of solvent used.20,21,31,38
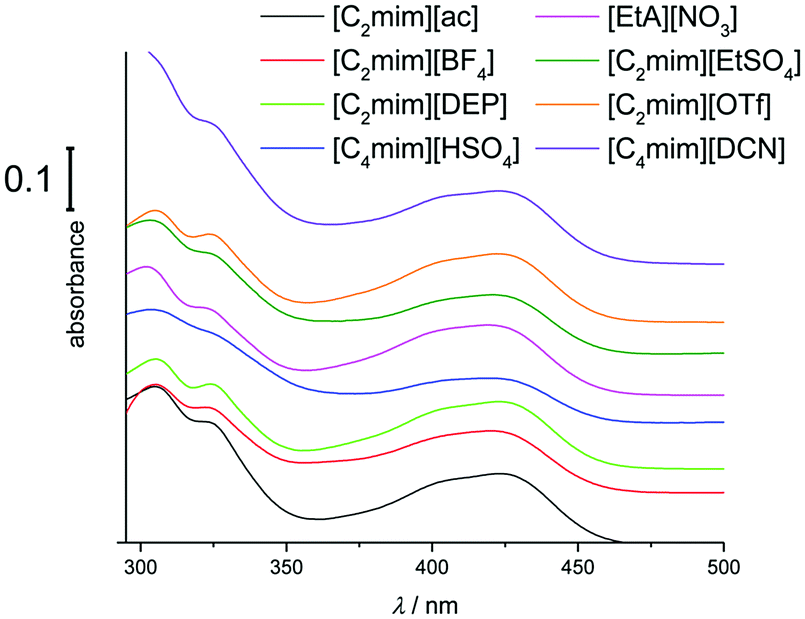 | ||
| Fig. 4 UV-Vis spectra of 10 mM K3[Fe(CN)6] in a range of ILs (1 mm cuvette). Spectra are offset for clarity. | ||
For those solutions containing sulfate or fluoride, the colour changed from yellow to blue-green over a time-span of days to months, depending on the solvent. Accordingly, the UV-Vis spectra display lower absorbance at 431 nm and an additional band develops around 500 to 900 nm (Fig. 5), characteristic of mixed-valent Fe(III)/(II)-cyanide colloids.55–57 This would suggest that hexacyanoferrate(III) is very slowly reduced in these solutions.
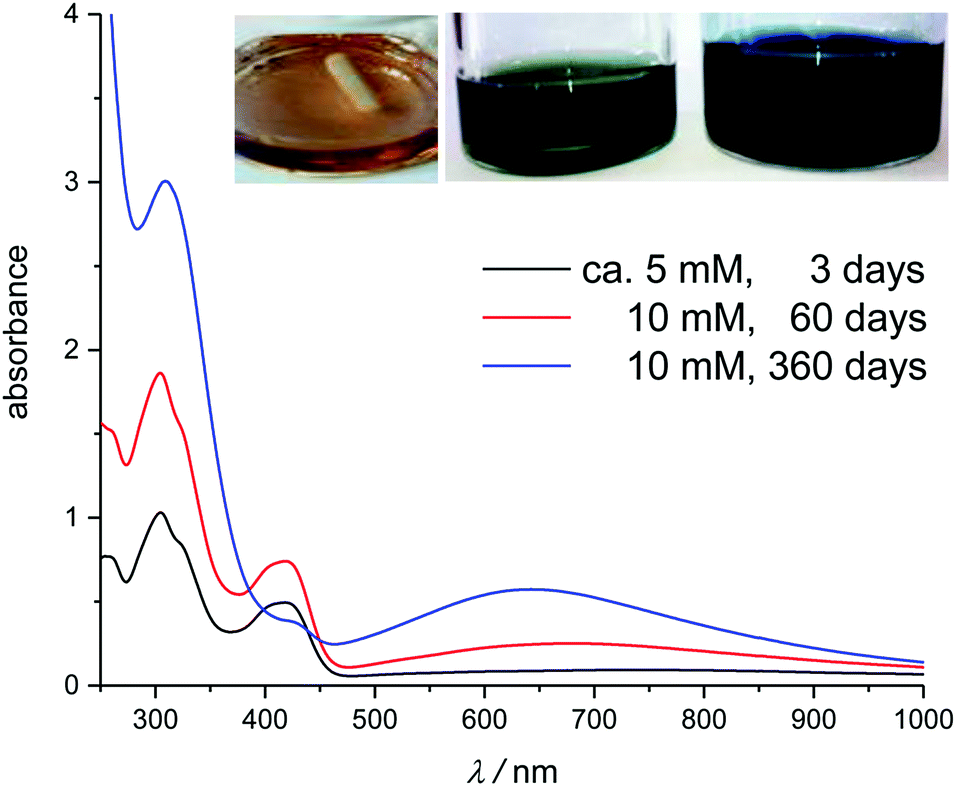 | ||
| Fig. 5 UV-Vis spectra of fresh and aged solutions of K3[Fe(CN)6] in [C4mim][HSO4]. Inset shows the aged solutions: 3 days (left), 60 days (middle) and 360 days (right). | ||
For [C2mim][SCN], no UV-Vis spectrum could be recorded due to the strong colour of the solution. Raman spectra show that hexacyanoferrate(III) is metastable in this solvent and this will be discussed further in Section 3.4.
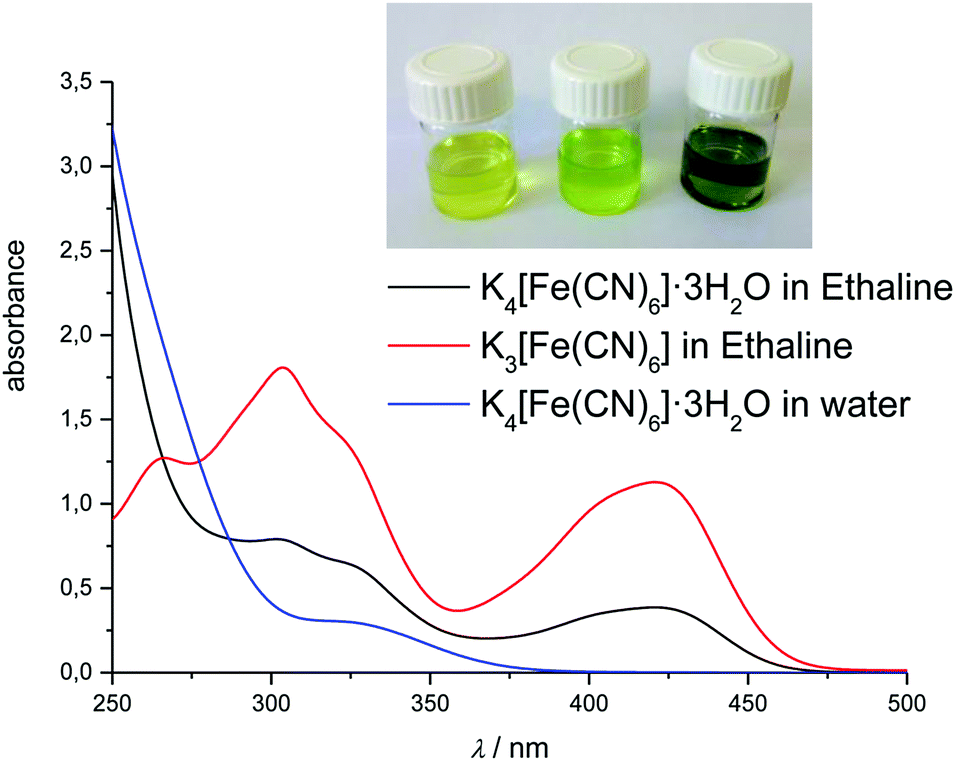 | ||
| Fig. 6 UV-Vis spectra of 10 mM K4[Fe(CN)6]·3H2O in Ethaline and water, and 10 mM K3[Fe(CN)6] in Ethaline. Inset, from left to right: K4[Fe(CN)6]·3H2O in degassed Ethaline, K4[Fe(CN)6] in normal Ethaline, and K3[Fe(CN)6] in normal Ethaline. | ||
In summary, neither ferrocene nor hexacyanoferrate form a stable species in all of the investigated ionic media. From these speciation studies, we conclude that ferrocene is only stable in [C2mim][BF4], [C4mim][DCN], [C2mim][EtSO4], [C4mim][HSO4], [C2mim][NTf2], [C2mim][OTf], [C4mim][PF6], and [EtA][NO3], whereas hexacyanoferrate(III) is stable over the course of an experiment in all the chloride-based liquids, [C2mim][ac], [C2mim][BF4], [C4mim][DCN], [C2mim][DEP], [C2mim][EtSO4], [C4mim][HSO4], [C2mim][OTf], [C4mim][PF6], and [EtA][NO3], with metastable speciation at room temperature in [C2mim][SCN]. Still, hexacyanoferrate(III) was found to undergo slow reduction in most liquids on a time-scale of days or months and hexacyanoferrate(II) would readily be oxidised in most liquids under atmospheric conditions.
3.3 Study of the electrochemical behaviour
To investigate the electrochemical behaviour of the ferrocenium/ferrocene (FeCp2+/0) and hexacyanoferrate(III/II), i.e. [Fe(CN)6]3−/4−, electrode processes, cyclic voltammetry (CV) was carried out on three different working electrode surfaces, namely platinum (Pt), glassy carbon (GC) and gold (Au) with special regard paid to the following criteria:• Peak potentials are independent of electrolyte concentration.
• Peak potential separation is approximately 60 mV.
• The charge transfer coefficient is close to 0.5, with a current density quotient close to 1.
• The rate constant is near 10−5 cm s−1, where typically in organic solvents it would be faster than 10−3 cm s−1.58
• Peak current densities are in agreement with the Randles–Sevcik equation (eqn (1)).
• Formal potentials are the same at different electrodes within one liquid.
All CVs were fitted using DigiElch to obtain values for redox potential, charge transfer coefficient, rate constant, and diffusion coefficient. Key findings for ΔE, α and ks are listed in Tables 1 and 2. An extensive overview of the other electrochemical parameters not presented here can be found in the ESI.†
| Ionic liquid | ΔE/V | α | k s/10−4 cm s−1 | S/% | |
|---|---|---|---|---|---|
| a This literature value does not agree with the trend seen for other liquids with similar viscosities, and is only included for completion. | |||||
| [C2mim][BF4] | Pt | 0.4615(4) |
0.78(3)
0.46(2) 60 |
15.8(9)
10 60 |
2.38 |
| GC | 0.4616(4) |
0.82(3)
0.49(1) 60 |
15.5(9)
12.6 60 |
2.19 | |
| Au | 0.4576(9) | 0.79(4) | 15(1) | 4.14 | |
| [C4mim][DCN] | Pt | 0.6718(6) | 0.47(4) | 12.9(9) | 2.13 |
| GC | 0.6542(7) | 0.50(4) | 14(1) | 1.81 | |
| Au | 0.6438(5) | 0.44(2) | 12.8(5) | 1.76 | |
| [C2mim][EtSO4] | Pt | 0.0404(2) | 0.51(2) | 8.2(2) | 1.50 |
| GC | 0.0423(3) | 0.50(2) | 8.5(3) | 1.69 | |
| Au | 0.0442(4) | 0.58(4) | 13.5(9) | 2.78 | |
| [C4mim][HSO4] | Pt | 0.531(2) | 0.59(3) | 0.43(2) | 3.56 |
| GC | 0.5377(6) | 0.58(3) | 0.51(3) | 3.98 | |
| [C2mim][NTf2] | Pt | 0.1793(8) |
0.53(2)
0.51 82 |
11.4(4) | 1.76 |
| GC | 0.1748(8) | 0.50(6) | 14.7(7) | 1.87 | |
| Au | 0.1687(4) | 0.74(3) | 13.6(7) | 2.94 | |
| [C2mim][OTf] | Pt | 0.3700(4) | 0.51(2) | 13.2(4) | 1.91 |
| GC | 0.3645(3) | 0.51(2) | 13.4(5) | 2.07 | |
| Au | 0.3522(2) | 0.49(2) | 16.7(9) | 1.65 | |
| [C4mim][PF6] | Pt | 0.170(1) | 0.53(3) | 3.6(3) | 2.57 |
| GC | 0.1840(4) | 0.49(1) | 3.6(1) | 2.39 | |
| Au | 0.2003(6) | 0.69(4) | 14(1) | 3.05 | |
| [EtA][NO3] | Pt | 0.0972(3) | 0.52(4) | 11.1(9) | 2.92 |
| GC | 0.0954(3) | 0.51(3) | 14.4(5) | 1.91 | |
| Au | 0.096(1) | 0.85(6) | 13(2) | 2.76 | |
| Ionic solvent | ΔE/V | α | k s/10−4 cm s−1 | S/% | |
|---|---|---|---|---|---|
| a Values for K3[Fe(CN)6] in [C2mim][SCN] from a 1 mM solution with sweep rates from 5 to 20 mV s−1. | |||||
| Ethaline | Pt | 0.0896(3) | 0.63(2) | 7.6(3) | 1.87 |
| GC | 0.0928(2) | 0.56(1) | 5.0(1) | 1.76 | |
| Au | 0.0953(7) | 0.81(2) | 5.4(3) | 4.35 | |
| Propaline | Pt | 0.0604(4) | 0.52(2) | 3.8(4) | 2.51 |
| GC | 0.0632(3) | 0.49(2) | 5.0(2) | 2.26 | |
| Au | 0.0670(6) | 0.84(2) | 3.9(2) | 3.00 | |
| Glyceline | Pt | 0.0964(3) | 0.50(2) | 1.80(6) | 2.31 |
| GC | 0.0971(3) | 0.49(2) | 2.2(1) | 2.47 | |
| Au | 0.0995(5) | 0.43(4) | 1.39(2) | 3.93 | |
| [C2mim][ac] | Pt | 0.1144(3) | 0.47(2) | 4.3(2) | 1.75 |
| GC | 0.1185(2) | 0.47(3) | 5.9(2) | 1.61 | |
| Au | 0.1308(7) | 0.68(2) | 3.2(2) | 4.8 | |
| [C2mim][BF4] | Pt | −0.2085(5) | 0.51(5) | 8.0(4) | 2.53 |
| GC | −0.217(1) | 0.52(8) | 5.2(8) | 4.33 | |
| Au | −0.1964(9) | 0.83(4) | 7.5(9) | 6.60 | |
| [C6mim][Cl] | Pt | 0.002(2) | 0.57(2) | 0.077(7) | 9.21 |
| GC | 0.017(2) | 0.52(2) | 0.10(2) | 8.44 | |
| Au | 0.021(2) | 0.58(3) | 0.19(2) | 8.12 | |
| [C2mim][DEP] | Pt | −0.0159(5) | 0.66(1) | 1.08(3) | 2.78 |
| GC | −0.0110(4) | 0.59(2) | 1.74(6) | 2.39 | |
| Au | −0.0148(6) | 0.62(1) | 0.65(2) | 3.44 | |
| [C4mim][HSO4] | Pt | 0.48(1) | 0.58(1) | 0.074(3) | 5.20 |
| GC | 0.479(1) | 0.53(3) | 0.21(1) | 6.05 | |
| [C2mim][SCN]a | Pt | 0.3664(5) | 0.53(1) | 1.16(3) | 2.08 |
| [EtA][NO3] | Pt | 0.0012(3) | 0.44(2) | 9.5(4) | 1.71 |
| GC | 0.0093(4) | 0.46(2) | 9.8(3) | 1.77 | |
| Au | 0.0160(5) | 0.66(3) | 11.1(5) | 2.38 | |
The electrochemical behaviour was investigated for those solvents in which ferrocene was found to be stable by spectroscopic methods (see Section 3.2.1), namely: [C2mim][BF4], [C4mim][DCN], [C2mim][EtSO4], [C4mim][HSO4], [C2mim][NTf2], [C2mim][OTf], [C4mim][PF6], and [EtA][NO3]. For Pt and GC electrodes, the rate constants determined here are in good agreement with values available from the literature.23,26,27,60–64 Yet, the transfer coefficient in [C2mim][BF4] was found to be significantly larger than the literature values (0.7 to 0.8 vs. 0.5), despite all other parameters being in good agreement. In the more viscous ionic liquid [C4mim][HSO4], clearly pronounced oxidation and reduction waves were observed but the peaks were broad and the difference in peak potential increased with sweep rate. The peak current densities only follow the Randles–Sevcik equation for sweep rates up to 20 mV s−1.65
At Au electrodes, either a substantial shift in potential or large deviations of the charge transfer coefficient from the ideal value of 0.5 were observed (see Table 1). Ugo et al. made similar observations and associated these to adsorption of the ferrocenium ion at sweep rates of 200 mV s−1.66 However, the charge transfer coefficient determined in the present work of 0.44, in combination with the peak current ratio of 1.3, indicates that ferrocene, rather than ferrocenium, is adsorbed at lower sweep rates (5 to 100 mV s−1).45 In both of the hydrophobic ILs investigated ([C2mim][NTf2] and [C4mim][PF6]) increased transfer coefficients (α ≈ 0.7), along with variations of the determined redox potential of up to 30 mV, were found when using the Au-electrode. In [C4mim][PF6], ferrocene is known to adsorb to gold surfaces and, upon oxidation, form a solid salt with [PF6]−.67
From these data, we conclude that ferrocene could be used as internal standard in the above media with the exception of [C4mim][HSO4], where the electrode process is quasi-reversible and the data should be used with caution. In all cases, care should be taken when using a gold electrode as adsorption processes are likely. Further, attention must be paid to the potential window, as gold is much easier to oxidise in many ionic liquids compared to conventional electrolytes.68 It is possible that the formal potential of the redox couple under investigation could be more positive than the gold stripping potential.
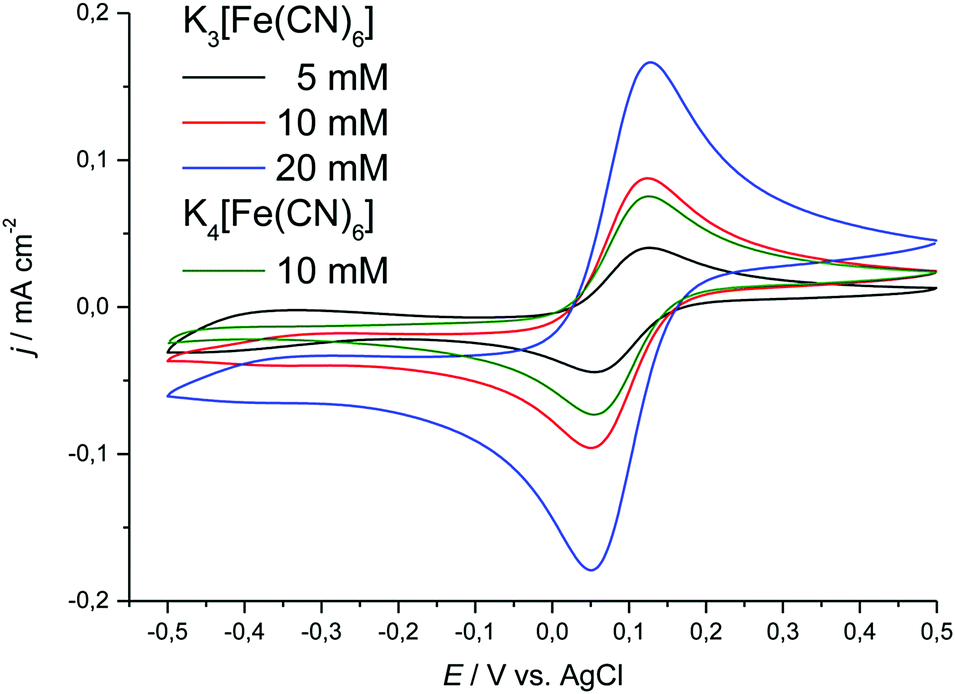 | ||
| Fig. 7 Cyclic voltammograms showing the effect of concentration on the location of the cathodic and anodic peak potentials for K3[Fe(CN)6] and K4[Fe(CN)6]·3H2O in Ethaline. Sweep rate was 20 mV s−1. | ||
 | ||
| Fig. 8 Cyclic voltammograms showing the effect of sweep rate on the location of the cathodic and anodic peak potentials for the examples of 10 mM K3[Fe(CN)6] in Ethaline (left), and linearity of current density vs. square-root of sweep rate in Ethaline for K3[Fe(CN)6] and K4[Fe(CN)6]·3H2O (▼ is oxidative sweep and ▲ is reductive sweep) (right). | ||
The peak separation at varying sweep rates is consistently around 70 to 90 mV, which is close to the expected value for a reversible process.69,70 Averaging the peak potentials for cathodic and anodic sweep on Pt results in a formal potential ΔE with respect to the 100 mM AgCl/Ag reference, which deviates by less than 5 mV between the different electrode surfaces. The transfer coefficient was found to be close to 0.5 on Pt and GC, with peak current ratios being close to 1. On Au, both of these parameters deviated significantly from the anticipated values, which could hint towards adsorption processes. The values indicate that in Ethaline and Propaline the oxidised species is adsorbed at sweep rates greater than 50 mV s−1, whilst in Glyceline the reduced species is adsorbed at sweep rates smaller than 20 mV s−1. However, the other electrochemical parameters, in particular absolute peak current densities and peak potentials, do not indicate a deviation from reversible behaviour. The heterogeneous rate constants determined here for DESs are 1.39 to 7.6 × 10⁻⁴ cm s−1, compared to values in aqueous solution of 1.3 × 10⁻³ cm s−1 and in 1-n-butyl-1-methylpyrrolodinium bis(trifluoromethylsulfonyl)imide of 1.8 × 10⁻⁴ cm s−1.71 Detailed data are shown in Table 2 and the ESI.†
(Quasi)reversible systems. Along with the DES discussed above, (quasi)reversible redox behaviour was observed for hexacyanoferrate(III/II) in the ILs [C2mim][ac], [C2mim][BF4], [C6mim][Cl], [C2mim][DEP], [C4mim][HSO4], and [EtA][NO3] when using Pt or GC electrodes. The peak separation values for the less viscous liquids are in the range of 70 to 80 mV, similar to Ethaline, with peak current ratios Ipa/Ipc of approximately 1, and a charge transfer coefficient around 0.5, which is expected for a reversible electrode reaction. Rate constants have a magnitude of around 10−4 cm s−1, aside from the liquids with viscosity above 0.5 Pa s, where they have a magnitude of 10−5 cm s−1. The values obtained for these parameters are displayed in Table 2 and the ESI.†
For the lower viscosity liquids [C2mim][ac], [C2mim][BF4], and [EtA][NO3], peak potentials were independent of sweep rate and peak current densities closely followed the Radles–Sevcik equation. For the highly viscous liquids [C2mim][DEP], [C4mim][HSO4] and [C6mim][Cl] (0.577, 1.572, and 18.089 Pa s at room temperature, respectively)72–74 peak potential separation increased with sweep rate. The data are further affected by a significant non-faradaic current. In [C2mim][DEP], the values for α are between 0.59 and 0.66, with all values of Ipa/Ipc < 1, decreasing with increasing sweep rate. This would indicate that in this particular liquid the oxidised species is weakly adsorbed onto the electrode surface, despite the apparently quasi-reversible redox behaviour.45 The average peak potential was independent of sweep rate in all three liquids, which means that for those quasi-reversible systems a meaningful potential could still be obtained. We hence propose that hexacyanoferrate is a better internal standard than ferrocene in [C6mim][Cl] and [C2mim][DEP] due to the fact that ferrocene does not form a stable species in these liquids.
When using a gold working electrode, large values of α were obtained, along with a peak current ratio Ipa/Ipc that varied with sweep rate, suggesting that possible adsorption of hexacyanoferrate species takes place at slow sweep rates.28,45 In [C4mim][HSO4], the hexacyanoferrate(III/II) couple is not observable at all on a gold working electrode, as the oxidation of gold takes precedence.
Non-reversible systems. For [C4mim][DCN], [C2mim][EtSO4], [C2mim][OTf], and [C4mim][PF6], adsorption processes or even completely irreversible reactions were observed on all three electrode surfaces. We will only comment briefly here on every system. Detailed data can be found in the ESI.†
During CV measurements of solutions of potassium hexacyanoferrate(III) in [C2mim][EtSO4] on a freshly polished electrode, several scans were required before the peak potentials stabilised. In addition, a second oxidation peak was observed. Variation of the potential range did not have an impact on this second oxidation peak, indicating that it is not related to the cathodic or anodic breakdown of the solvent. It is therefore possible that oxidation of two species is taking place in a similar manner to that found by Ugo et al. for ferrocene in [C4mim][DCN].66
Unusual redox behaviour was observed in both [C4mim][DCN] and [C2mim][OTf], where a decrease in current densities on any subsequent scans is observed, together with a drift in peak potential. In the [C2mim][OTf] system, a small amount of blue precipitate formed at the bottom of the sample tube, that increased with additional scans, which hints towards precipitation of a Prussian Blue phase. No blue precipitate was observed to form in the [C4mim][DCN] solution before, during, or after measurements. A similar electrochemical response was observed by Ugo et al.66 for a ferrocene derivative in [C4mim][DCN] during cyclic voltammetry on a gold working electrode. They proposed that this behaviour was also due to the effect of DCN adsorption modifying the Au surface.
Solutions of [C4mim][PF6] turned deep blue shortly after dissolution, characteristic of the formation of mixed-valent Fe(III)/(II) colloids. Qian et al. studied the effect of water content on the redox behaviour of potassium hexacyanoferrate(III) in [C4mim][PF6] and observed reversible behaviour,54 whereas Gao et al. found that potassium hexacyanoferrate(III) was not soluble in [C4mim][PF6] without the addition of a surfactant.75 The addition of water to our samples resulted in no change to the CV shape or peak potentials, merely the anticipated increase in current density due to the decrease in solution viscosity.
In summary, we propose that potassium hexacyanoferrate can function as an internal standard in the following ionic liquids: Ethaline, Propaline, Glyceline, [C2mim][ac], [C2mim][BF4] and [EtA][NO3]. In the more viscous ILs [C6mim][Cl] and [C2mim][DEP], hexacyanoferrate exhibits quasi-reversible behaviour but it is possible to obtain meaningful estimates of redox potentials.
For [C4mim][HSO4], our data indicate that ferrocene is more appropriate for use as internal standard, because the electron transfer reaction is faster, as indicated by the higher values for ks. In [C4mim][DCN], [C2mim][EtSO4], [C2mim][NTf2], [C2mim][OTf], and [C4mim][PF6], potassium hexacyanoferrate should not be used as an internal standard, due to the irreversible redox behaviour in those liquids, or poor solubility.
3.4 Stability and ligand exchange with the strong ligand thiocyanate
For this study, the behaviour of ferrocene and hexacyanoferrate in [C2mim][SCN] was of particular interest, as thiocyanate is a strong ligand. Of all liquids investigated here, [C2mim][SCN] is the most likely to replace ligands in the ferrocene or hexacyanoferrate complex.For ferrocene in [C2mim][SCN] it was observed that the solution changes colour irreversibly with both time and temperature. As discussed above (Section 3.2.1) the UV-Vis spectra of ferrocene in solutions of varying age suggest that ferrocene becomes oxidised and builds thiocyanate-based iron(III)-complexes (Fig. 9). CVs of both fresh and aged solutions are identical with those of the thiocyanate complex formed when dissolving FeCl3 in [C2mim][SCN]. This is independent of the preparation method, indicating that ferrocene is not stable in [C2mim][SCN] over the timescales of these experiments.
 | ||
| Fig. 9 Cyclic voltammograms of heated and non-heated samples of K3[Fe(CN)6] in [C2mim][SCN]. Sweep rate was 20 mV s−1. The CV of FeCl3 in [C2mim][SCN] is added for comparison purposes. Inset: Raman spectra for the heated and non-heated samples. Spectra have been offset for clarity. | ||
Due to the intense orange colour of [C2mim][SCN], UV-Vis spectra could not be recorded to confirm the speciation of Fe(III) in solution. On the other hand, due to SCN− generally being a strong ligand, verifying the speciation is particularly important in this solvent. Raman spectroscopy was therefore carried out to elucidate in which form the Fe(III) is present. In all of the [C2mim][SCN] samples, a major band at 2056 cm−1 was observed, corresponding to CN-valence vibration of the SCN− anion, either as part of the solvent or bound to iron.76 If any [Fe(CN)6]3− is present, an additional band would be expected around 2130 cm−1,77,78 whereas the vibrational stretch of the free CN− is expected to be around 2077 cm−1.79,80 If the band at 2130 cm−1 is not observed in a K3[Fe(CN)6] sample, ligand exchange must have taken place, either slowly over time or as a consequence of the sample preparation method.
In samples which had been prepared by dissolving K3[Fe(CN)6] at room temperature in [C2mim][SCN] a Raman band is observed at 2118 cm−1, indicating the presence of [Fe(CN)6]3− complexes (Fig. 9). Upon heating at 70 °C this band disappears from the spectrum over several hours and it must be assumed that CN− ligands have been replaced by SCN−.
The formal potential of the [Fe(CN)6]3−/4− redox couple in [C2mim][SCN] is more positive with respect to the silver wire quasi-reference than any of the DES or [C6mim][Cl] solutions (Fig. 9), indicating that Ag+ is more stable in the solution. This is consistent with observations made in previous research.35,39 Comparing peak potentials and peak currents as a function of sweep rate showed that the redox behaviour is diffusion controlled in [C2mim][SCN], which has a viscosity similar to DESs (0.02379 Pa s at 25 °C).81 Average peak potentials of the cathodic and anodic sweeps resulted in a formal potential of 0.371 V with respect to the Ag-wire reference electrode.
Ligand exchange upon heating is also reflected in the CVs, which exhibit a second redox couple with significantly higher Fe(III/II) electrode potential. This second couple coincides with the response obtained from solutions of FeCl3 in the same solvent (Fig. 9). We conclude that K3[Fe(CN)6] is metastable at room temperature in [C2mim][SCN]. As the sample is heated, [Fe(CN)6]3− decomposes slowly and an iron thiocyanate complex forms. However, the cyano-complex appears not to break apart during redox-cycling. For measurements at room temperature, K3[Fe(CN)6] is hence a better internal standard than ferrocene as long as solutions are not heated or left for extended periods.
4 Conclusions
In this work, the potassium hexacyanoferrate(III) and -(II) salts were investigated as internal standards for use in a range of DES and IL. The speciation and redox behaviours were compared to ferrocene, an IUPAC-recommended internal standard. Table 3 contains a summary of the most important findings.| Ionic solvent | Ferrocene | K3[Fe(CN)6] | Ferrocene | K3[Fe(CN)6] | |
|---|---|---|---|---|---|
| Stability (spectroscopic measurements) | Reversibility (constant peak potentials up to a sweep rate of…) | ||||
| Ethaline | Not stable | Stable | Pt | Irreversible | ≤20 mV s−1 |
| GC | Irreversible | ≤20 mV s−1 | |||
| Au | Irreversible | Adsorption effects | |||
| Propaline | Not stable | Stable | Pt | Irreversible | ≤10 mV s−1 |
| GC | Irreversible | ≤10 mV s−1 | |||
| Au | Irreversible | Adsorption effects | |||
| Glyceline | Not stable | Stable | Pt | Irreversible | ≤10 mV s−1 |
| GC | Irreversible | ≤10 mV s−1 | |||
| Au | Irreversible | Adsorption effects | |||
| [C2mim][ac] | Not stable | Stable | Pt | Irreversible | ≤10 mV s−1 |
| GC | Irreversible | ≤10 mV s−1 | |||
| Au | Irreversible | Adsorption effects | |||
| [C6mim][Cl] | Not stable | Stable | Pt | Irreversible | Adsorption effects |
| GC | Irreversible | Adsorption effects | |||
| Au | Irreversible | Adsorption effects | |||
| [C2mim][BF4] | Stable | Stable | Pt | ≤50 mV s−1 | ≤20 mV s−1 |
| GC | ≤100 mV s−1 | ≤50 mV s−1 | |||
| Au | ≤100 mV s−1 | Adsorption effects | |||
| [C4mim][DCN] | Stable | Stable | Pt | ≤20 mV s−1 | Irreversible |
| GC | ≤20 mV s−1 | Irreversible | |||
| Au | Adsorption effects | Irreversible | |||
| [C2mim][DEP] | Not stable | Stable | Pt | Irreversible | Adsorption effects |
| GC | Irreversible | Adsorption effects | |||
| Au | Irreversible | Adsorption effects | |||
| [C2mim][EtSO4] | Stable | Stable | Pt | ≤10 mV s−1 | Irreversible |
| GC | ≤10 mV s−1 | Irreversible | |||
| Au | Adsorption effects | Irreversible | |||
| [C4mim][HSO4] | Stable | Stable | Pt | <5 mV s−1 | <5 mV s−1 |
| GC | <5 mV s−1 | <5 mV s−1 | |||
| [C2mim][NTf2] | Stable | Not soluble | Pt | ≤20 mV s−1 | N/A |
| GC | ≤50 mV s−1 | N/A | |||
| Au | ≤50 mV s−1 | N/A | |||
| [C2mim][OTf] | Stable | Stable | Pt | ≤10 mV s−1 | Irreversible |
| GC | ≤20 mV s−1 | Irreversible | |||
| Au | ≤20 mV s−1 | Irreversible | |||
| [C4mim][PF6] | Stable | Stable | Pt | <5 mV s−1 | Irreversible |
| GC | <5 mV s−1 | Irreversible | |||
| Au | Adsorption effects | Irreversible | |||
| [C2mim][SCN] | Not stable | Metastable | Pt | Irreversible | <5 mV s−1 |
| [EtA][NO3] | Stable | Stable | Pt | ≤20 mV s−1 | Adsorption effects |
| GC | ≤20 mV s−1 | Adsorption effects | |||
| Au | ≤20 mV s−1 | Adsorption effects | |||
Spectroscopic studies in DES and IL media show that ferrocene is stable in the following liquids: [C2mim][BF4], [C2mim][DCN], [C2mim][EtSO4], [C4mim][HSO4], [C2mim][NTf2], [C2mim][OTf], [C4mim][PF6], and [EtA][NO3]. The UV-Vis spectra of these solutions show large solvatochromic shifts of up to 15.5 nm, indicating that ferrocene is strongly influenced by solvation effects. In Ethaline, Propaline, Glyceline, [C2mim][ac], [C6mim][Cl], [C2mim][DEP], and [C2mim][SCN], spectroscopic data suggest that ferrocene is not stable. In addition, solutions of accurate concentration are difficult to prepare, due to possible sublimation losses during the dissolution process, depending on temperature. For hexacyanoferrate(III), UV-Vis measurements indicate that no ligand exchange occurs in the liquids listed above, with the exception of [C2mim][SCN], where cyanide ligands are slowly replaced by thiocyanate at elevated temperature, and [C2mim][NTf2], where hexacyanoferrate is not soluble. The UV-Vis spectra exhibit solvation effects, observable by solvatochromic shifts of up to 6.5 nm, which is considerably smaller than for ferrocene. Mixed-valent iron(III/II) colloids have been observed for aged solutions in all sulfate- and fluoride-containing liquids. Spectroscopic measurements of hexacyanoferrate(II) solutions in DES media indicated that a significant proportion of the solute is oxidised under atmospheric conditions. The CVs and calculated peak potentials are nevertheless identical for both hexacyanoferrate(II) and hexacyanoferrate(III). This shows that [Fe(CN)6]3−/4− displays a robust redox behaviour under atmospheric conditions.
Electrochemical measurements showed that the formal potential of the ferrocene/ferrocenium redox couple was always more positive in comparison to the hexacyanoferrate(III/II) couple, as expected from their standard potentials. This can affect the suitability of ferrocene as a redox standard on gold electrodes because gold exhibits a relatively low oxidation potential in many ionic solvents and hence may be oxidised at a similar potential to ferrocene. For ferrocene, reversible or quasi-reversible redox behaviour was observed on Pt or GC electrodes at sweep rates of 5 to 100 mV s−1, in all solutions in which the analyte was stable. The same is true for hexacyanoferrate with the exception of [C4mim][DCN], [C2mim][EtSO4], [C2mim][OTf], and [C4mim][PF6], in which irreversible behaviour was observed. In the particularly viscous liquids, [C6mim][Cl], [C2mim][DEP] and [C4mim][HSO4], deviations from reversible behaviour were present, with peak separation increasing noticeably with sweep rate above 20 mV s−1.
On Au electrodes, adsorption processes were often observed to take place, indicated by a substantial deviation of the transfer coefficient from 0.5, which always correlates with the peak current ratio being significantly above or below 1.
In general, the rate constants for ferrocene are an order of magnitude larger than those for hexacyanoferrate(III). Further, the water content of the liquids affected their viscosity and hence diffusion coefficients, but did not seem to affect formal potentials or reversibility of the electrode reactions.
We conclude that both ferrocene and hexacyanoferrate do not represent a universally usable internal redox standard for ionic liquids. There are many cases where the IUPAC-recommended ferrocene exhibited irreversible electrode kinetics. Further, with strongly coordinating anions such as chloride, acetate, or thiocyanate, ferrocene was not even stable in solution. Solutions of hexacyanoferrate were stable in all liquids investigated on the time scale of a typical voltammetric experiment. These solutions were subject to slow reduction or oxidation, in particular under atmospheric conditions, but these processes were slow and freshly prepared solution of hexacyanoferrate(III) were stable over the course of a series measurements. The solubility of hexacyanoferrate is not sufficient in the hydrophobic ionic liquids studied here. For both redox couples, care should be taken when using an Au electrode due to adsorption effects. Therefore, the choice of internal redox standard in ionic liquids remains a decision that has to be made individually for every series of experiments. We do, however, believe that hexacyanoferrate has clear advantages in many strongly coordinating ionic liquids, mainly due to its stability with respect to ligand exchange.
Conflicts of interest
There are no conflicts of interest to declare.Acknowledgements
The authors would like to thank the German Research Foundation for funding (DFG grant FR 3458/2-1) and the Dr. Erich Krüger Foundation for essential analytical equipment.References
- J. D. Holbrey and K. R. Seddon, Clean Prod. Processes, 1999, 1, 223 Search PubMed.
- P. Wasserscheid and W. Keim, Angew. Chem., Int. Ed., 2000, 39, 3773 CrossRef.
- A. P. Abbott, R. C. Harris, F. Holyoak, G. Frisch, J. Hartley and G. R. T. Jenkin, Green Chem., 2015, 17, 2172 RSC.
- M. Quinn, Z. Ding, R. Moulton and A. J. Bard, Langmuir, 2002, 18, 1734 CrossRef.
- D. R. MacFarlane, J. Golding, S. Forsyth, M. Forsyth and G. B. Deacon, Chem. Commun., 2001, 1430 RSC.
- A. P. Abbott, A. A. Al-Barzinjy, P. D. Abbott, G. Frisch, R. C. Harris, J. Hartley and K. S. Ryder, Phys. Chem. Chem. Phys., 2014, 16, 9047 RSC.
- R. J. Brown, P. J. Dyson, D. J. Ellis and T. Welton, Chem. Commun., 2001, 1862 RSC.
- P. A. Suarez, V. M. Selbach, J. E. L. Dullius, S. Einloft, C. M. S. Piatnicki, D. S. Azambuja, R. F. D. Souza and J. Dupont, Electrochim. Acta, 1997, 42, 2533 CrossRef CAS.
- F. Endres and C. Schrodt, Phys. Chem. Chem. Phys., 2000, 2, 5517 RSC.
- Y. NuLi, J. Yang, J. L. Wang, J. Q. Xu and P. Wang, Electrochem. Solid-State Lett., 2005, 8, C166 CrossRef CAS.
- D. M. Ryan, T. L. Riechel and T. Welton, J. Electrochem. Soc., 2002, 149, A371 CrossRef CAS.
- B. D. Cahan, Z. Nagy and M. A. Genshaw, J. Electrochem. Soc., 1972, 119, 64 CrossRef CAS.
- G. Coffey, L. Pederson, D. Ponds, P. Rieke and E. Thomsen, Solid State Ionics, 2007, 178, 827 CrossRef CAS.
- A. J. Bard, R. Parsons and J. Jordan, Standard Potentials in Aqueous Solutions, Marcel Dekker, New York, 1985 Search PubMed.
- K. Izutsu, Electrochemistry in Nonaqueous Solutions, Wiley-VCH, 2002 Search PubMed.
- A. P. Abbott, G. Frisch, H. Garrett and J. Hartley, Chem. Commun., 2011, 47, 11876 RSC.
- M. Yamagata, N. Tachikawa, Y. Katayama and T. Miura, Electrochim. Acta, 2007, 52, 3317 CrossRef CAS.
- Y. Katayama, T. Endo and K. Toshima, J. Electrochem. Soc., 2014, 161, D87 CrossRef CAS.
- A. Saheb, J. Janata and M. Josowicz, Electroanalysis, 2006, 18, 405 CrossRef CAS.
- A. A. Torriero, J. Sunarso and P. C. Howlett, Electrochim. Acta, 2012, 82, 60 CrossRef CAS.
- A. A. Torriero, Electrochim. Acta, 2014, 137, 235 CrossRef CAS.
- G. Gritzner and J. Kuta, Pure Appl. Chem., 1984, 45, 61 Search PubMed.
- E. I. Rogers, D. S. Silvester, D. L. Poole, L. Aldous, C. Hardacre and R. G. Compton, J. Phys. Chem. C, 2008, 112, 2729 CAS.
- P. de Vreese, K. Haerens, E. Matthijs and K. Binnemans, Electrochim. Acta, 2012, 76, 242 CrossRef CAS.
- C. Zhao, G. Burrell, A. A. J. Torriero, F. Separovic, N. F. Dunlop, D. R. MacFarlane and A. M. Bond, J. Phys. Chem. B, 2008, 112, 6923 CrossRef CAS PubMed.
- A. Lewandowski, L. Waligora and M. Galinski, Electroanalysis, 2009, 21, 2221 CrossRef CAS.
- L. Waligora, A. Lewandowski and G. Gritzner, Electrochim. Acta, 2009, 54, 1414 CrossRef CAS.
- V. M. Hultgren, A. W. Mariotti, A. M. Bond and A. G. Wedd, Anal. Chem., 2002, 74, 3151 CrossRef CAS PubMed.
- R. S. Stojanovic and A. M. Bond, Anal. Chem., 1993, 65, 56 CrossRef CAS.
- A. Lewandowski, L. Waligora and M. Galinski, J. Solution Chem., 2013, 42, 251 CrossRef CAS PubMed.
- A. A. J. Torriero, J. Sunarso, M. Forsyth and C. Pozo-Gonzalo, Phys. Chem. Chem. Phys., 2013, 15, 2547 RSC.
- P. Bonhôte, A.-P. Dias, N. Papageorgiou, K. Kalyanasundaram and M. Grätzel, Inorg. Chem., 1996, 35, 1168 CrossRef.
- V. R. Koch, L. A. Dominey, C. Nanjundiah and M. J. Ondrechen, J. Electrochem. Soc., 1996, 143, 798 CrossRef CAS.
- V. Gutmann, G. Gritzner and K. Danksagmüller, Inorg. Chim. Acta, 1976, 17, 81 CrossRef CAS.
- A. P. Abbott, G. Frisch, S. J. Gurman, A. R. Hillman, J. Hartley and F. Holyoak, Chem. Commun., 2011, 47, 10031 RSC.
- A. P. Abbott, D. Boothby, G. Capper, D. L. Davies and R. K. Rasheed, J. Am. Chem. Soc., 2004, 126, 9142 CrossRef CAS PubMed.
- A. P. Abbott, G. Capper, D. L. Davies, R. K. Rasheed and V. Tambyrajaha, Chem. Commun., 2003, 70 RSC.
- A. A. Torriero and P. C. Howlett, Electrochem. Commun., 2012, 16, 84 CrossRef CAS.
- J. M. Hartley, C.-M. Ip, G. C. H. Forrest, K. Singh, S. J. Gurman, K. S. Ryder, A. P. Abbott and G. Frisch, Inorg. Chem., 2014, 53, 6280 CrossRef CAS PubMed.
- J. P. Hurvois and C. Moinet, J. Organomet. Chem., 2005, 690, 1829 CrossRef CAS.
- A. E. Johnson and A. B. Meyers, J. Phys. Chem., 1996, 100, 7778 CrossRef CAS.
- M. Noel and P. N. Anantharaman, Analyst, 1985, 110, 1095 RSC.
- M. H. Chakrabarti and E. P. L. Roberts, J. Chem. Soc. Pak., 2008, 30, 817 CAS.
- A. J. Bard and L. R. Faulkner, Electrochemical methods. Fundamentals and applications, Wiley, New York, 2nd edn, 2001 Search PubMed.
- R. H. Wopschall and I. Shain, Anal. Chem., 1967, 39, 1514 CrossRef CAS.
- Y. Yamaguchi, W. Ding, C. T. Sanderson, M. L. Borden, M. J. Morgan and C. Kutal, Coord. Chem. Rev., 2007, 251, 515 CrossRef CAS.
- M. S. Inkpen, S. Du, M. Hildebrand, A. J. P. White, N. M. Harrison, T. Albrecht and N. J. Long, Organometallics, 2015, 34, 5461 CrossRef CAS.
- S. Quintal, S. Fedi, J. Barbetti, P. Pinto, V. Félix, M. G. Drew, P. Zanello and M. J. Calhorda, J. Organomet. Chem., 2011, 696, 2142 CrossRef CAS.
- K. Tahara, T. Akita, S. Katao and J.-i. Kikuchi, Dalton Trans., 2014, 43, 1368 RSC.
- B. Kratochvil and R. Long, Anal. Chem., 1970, 42, 43 CrossRef CAS.
- D. Hornero-Méndez, A. Pérez-Gálvez and M. I. Mínguez-Mosquera, J. Am. Oil Chem. Soc., 2001, 78, 1151 CrossRef.
- K. Ozutsumi, M. Kurihara and T. Kawashima, Talanta, 1993, 40, 599 CrossRef CAS PubMed.
- M. T. Beck, Pure Appl. Chem., 1987, 59, 1703 CrossRef CAS.
- Q. Qian, P. Yu, H. Cheng, X. Wang, L. Yang and L. Mao, Electroanalysis, 2011, 23, 2870 CrossRef CAS.
- J. B. Ayers and W. H. Waggoner, J. Inorg. Nucl. Chem., 1971, 33, 721 CrossRef CAS.
- Q. Sheng, R. Liu and J. Zheng, Nanoscale, 2012, 4, 6880 RSC.
- G. Clavel, J. Larionova, Y. Guari and C. Guerin, Chemistry, 2006, 12, 3798 CrossRef CAS PubMed.
- L. Xiao, E. J. F. Dickenson, G. G. Wildgoose and R. G. Compton, Electroanalysis, 2010, 22, 269 CrossRef CAS.
- D. Y. Kim, J. C. Yang, H. W. Kim and G. M. Swain, Electrochim. Acta, 2013, 94, 49 CrossRef CAS.
- E. Barrado, R. A. S. Couto, M. B. Quinaz, J. L. F. C. Lima and Y. Castrillejo, J. Electroanal. Chem., 2014, 720, 139 CrossRef.
- J. Fuller, R. T. Carlin and R. A. Osteryoung, J. Electrochem. Soc., 1997, 144, 3881 CrossRef CAS.
- B. N. Siraj, G. Grampp, S. Landgraf and K. Punyain, Z. Phys. Chem., 2013, 227, 105 CrossRef.
- A. W. Taylor, P. Licence and A. P. Abbott, Phys. Chem. Chem. Phys., 2011, 13, 10147 RSC.
- J. B. Shotwell and R. A. Flowers II, Electroanalysis, 2000, 12, 223 CrossRef CAS.
- E. E. L. Tanner, K. Y. Foong, M. M. Hossain, C. Batchelor-McAuley, L. Aldous and R. G. Compton, J. Phys. Chem. C, 2016, 120, 8405 CAS.
- P. Ugo, L. M. Moretto, M. de Leo, A. P. Doherty, C. Vallese and S. Pentlavalli, Electrochim. Acta, 2010, 55, 2865 CrossRef CAS.
- V. M. Hultgren, A. W. A. Mariotti, A. M. Bond and A. G. Wedd, Anal. Chem., 2002, 74, 3151 CrossRef CAS PubMed.
- D. Jones, J. Hartley, G. Frisch, M. Purnell and L. Darras, Palaeontol. Electron., 2012, 15.2.4T, 1 Search PubMed.
- R. S. Nicholson and I. Shain, Anal. Chem., 1964, 36, 706 CrossRef CAS.
- D. K. Gosser, Cyclic voltammetry. Simulation and analysis of reaction mechanisms, VCH, New York, N.Y., 1993 Search PubMed.
- N. Tachikawa, Y. Katayama and T. Miura, J. Electrochem. Soc., 2007, 154, F211–F216 CrossRef CAS.
- N. A. Ghani, N. A. Sairi, M. K. Aroua, Y. Alias and R. Yusoff, J. Chem. Eng. Data, 2014, 59, 1737 CrossRef CAS.
- E. P. Grishina, L. M. Ramenskaya, M. S. Gruzdev and O. V. Kraeva, J. Mol. Liq., 2013, 177, 267 CrossRef CAS.
- E. Gómez, B. González, Á. Domínguez, E. Tojo and J. Tojo, J. Chem. Eng. Data, 2006, 51, 696 CrossRef.
- Y. Gao, N. Li, L. Zheng, X. Zhao, S. Zhang, B. Han, W. Hou and G. Li, Green Chem., 2006, 8, 43 RSC.
- W. Krasser and H. W. Nürnberg, Z. Naturforsch., 1970, 25a, 1394 Search PubMed.
- R. A. Nyquist, C. L. Putzig and M. A. Leugers, The handbook of infrared and raman spectra of inorganic compounds and organic salts: (a 4-volume set), Academic Press, vol. 2, 1997 Search PubMed.
- I. Carpani, M. Berrettoni, M. Giorgetti and D. Tonelli, J. Phys. Chem. B, 2006, 110, 7265 CrossRef CAS PubMed.
- G. C. Lukey, J. S. J. van Deventer, S. T. Huntignton, R. L. Chowdhury and D. C. Shallcross, Hydrometallurgy, 1999, 53, 233 CrossRef CAS.
- B. Bozzini, G. P. De Gaudenzi and C. Mele, J. Electroanal. Chem., 2004, 563, 133 CrossRef CAS.
- M. Larriba, P. Navarro, J. García and F. Rodríguez, J. Chem. Thermodyn., 2014, 79, 266 CrossRef CAS.
- N. Fietkau, A. D. Clegg, R. G. Evans, C. Villagrán, C. Hardacre and R. G. Compton, ChemPhysChem, 2006, 7, 1041 CrossRef CAS PubMed.
Footnote |
| † Electronic supplementary information (ESI) available. See DOI: 10.1039/c7cp05483a |
| This journal is © the Owner Societies 2017 |