 Open Access Article
Creative Commons Attribution 3.0 Unported Licence
DFT study of the structure, chemical ordering and molecular adsorption of Pd–Ir nanoalloys†
Tian-E
Fan
 ab,
Ilker
Demiroglu
b,
Heider A.
Hussein
bc,
Tun-Dong
Liu
*a and
Roy L.
Johnston
 *b
*b
aDepartment of Automation, Xiamen University, Xiamen, 361005, China. E-mail: ltd@xmu.edu.cn
bSchool of Chemistry, University of Birmingham, Edgbaston, Birmingham B15 2TT, UK. E-mail: r.l.johnston@bham.ac.uk
cDepartment of Chemistry, College of Science, University of Kufa, Najaf, Iraq
First published on 26th September 2017
Abstract
The structures and surface adsorption sites of Pd–Ir nanoalloys are crucial to the understanding of their catalytic performance because they can affect the activity and selectivity of nanocatalysts. In this article, density functional theory (DFT) calculations are performed on bare Pd–Ir nanoalloys to systematically explore their stability and chemical ordering properties, before studying the adsorption of CO on the nanoalloys. First, the structural stability of 38-atom and 79-atom truncated octahedral (TO) Pd–Ir nanoalloys are investigated. Then the adsorption properties and preferred adsorption sites of CO on 38-atom Pd–Ir nanoalloys are considered. The PdshellIrcore structure, which has the lowest energy of all the considered isomers, exhibits the highest structural stability, while the PdcoreIrshell configuration is the least stable. In addition, the adsorption strength of CO on Ir atoms is found to be greater than on Pd for Pd–Ir nanoclusters. The preferred adsorption sites of CO on pure Pd and Ir clusters are in agreement with calculations and experiments on extended Pd and Ir surfaces. In addition, d-band center and charge effects on CO adsorption strength on Pd–Ir nanoalloys are analyzed by comparison with pure clusters. The study provides a valuable theoretical insight into catalytically active Pd–Ir nanoalloys.
1. Introduction
Nanosized clusters or nanoparticles are new materials, which differ from individual atoms and bulk materials; showing unique chemical and physical properties.1 Metal nanoclusters are of interest as catalysts due to their high surface–volume ratio and high proportion of low-coordinated active sites.2 Among metallic nanoclusters, palladium–iridium (Pd–Ir) nanoalloys have been considered as important catalysts in a number of chemical and physical applications.3–8 For example, Pd–Ir nanoalloys act as catalysts for a range of organic reactions, including olefin hydrogenation and tetralin hydro-conversion through selective ring opening.9 They are also applied in the preferential oxidation of CO for the elimination of impurities in H2 production.10 Palladium (Pd) is regarded as one of the best catalysts, owing to its excellent reactivity and stability, being the only bulk metal that can form a hydride phase at ambient temperature and pressure.11 Pd–Ir is a demixing system in the bulk, exhibiting miscibility gaps with relatively high critical temperatures,12,13 but miscibility is enhanced at the nanoscale.7,9 Nanoalloying Pd and Ir not only enhances the catalytic activity, due to the synergistic effect of atomic configuration and electronic structures of the component metals, but also improves the selectivity of catalysts.14For Pd–Ir nanoalloys, their (geometric and electronic) structures are crucial to the understanding of their catalytic performances because the activity and selectivity are closely associated with structure. The catalytic performance also depends on composition, surface segregation and chemical ordering, and these characteristics of alloyed NPs can be controlled to tune their optical, electrical, and catalytic properties.15–17 Moreover, both theory and experiment show that the binding of ligands can change the chemical ordering and the structures of nanoalloys.18–20 The surface sites and the bonding of adsorbates under reaction conditions can also affect the surface structure and change the activity and the selectivity of nanocatalysts. Surface segregation of Pd has been reported to occur in the presence of reactive gases such as CO and O2,21,22 and the binding of CO molecules is commonly used as a probe to identify the nature of metal surface adsorption sites.23,24 Pd–Ir nanoalloys are often used as catalysts in the preferential oxidation of CO (PROX).8,10
The Pd–Ir system has rarely been studied computationally,25–29 and relatively few catalytic studies have been devoted to Pd–Ir nanoalloys.9,27,30 In this study, the structure and chemical ordering of bare and CO-adsorbed Pd–Ir nanoalloys have been investigated theoretically by using density functional theory (DFT). The mixing energy and the effect of CO adsorption on Pd–Ir nanoalloys have been considered. Since the d-band model31 is particularly important for understanding metal–adsorbate bond formation and trends in reactivity, the d-band center is calculated to analyze the adsorption strength caused by metal–adsorbate interaction. This article is structured as follows. Section 2 briefly describes the calculation methods. Section 3 presents the calculated results, discussion and comparison with available experimental results for bare Pd–Ir and CO-adsorbed Pd–Ir nanoalloys. The main conclusions are summarized in the fourth section.
2. Methodology
2.1 Model
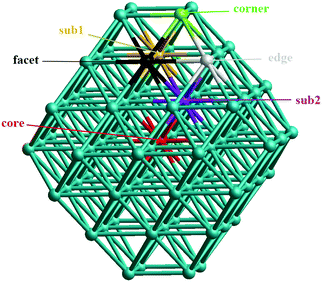
In our atomistic calculation, the (fcc packing) truncated octahedron (TO) having six {100} and eight {111} facets, has been chosen as the nanoparticle model to study 38-atom and 79-atom Pd–Ir nanoalloys (Fig. 1). The TO structure is frequently adopted in theoretical and experimental studies,32,33 because of its high symmetry (Oh) and it being a fragment of a face-centered cubic crystal (fcc). The sizes of 38 and 79 atoms have been selected to describe the trend of structural stability for Pd–Ir nanoalloys with different compositions and configurations, which enables predictions for larger experimental fcc-based nanoparticles.Binary nanoalloys present increasing structural complexity compared with unary nanoclusters because the two components can have variable compositions and exhibit various chemical ordering patterns.14 For example, there are ordered, Janus, ball–cup, core–shell, sandwich structures and so on in nanoalloys,34 some structures are shown in Fig. 2. Here, the preferred position for a single Pd or Ir dopant in 38-atom and 79-atom nanoclusters is first investigated, considering the unique positions for single-atom substitutions. These dopant sites are shown in Fig. 1 for the 79-atom TO.
For other compositions, we have constructed several configurations for 38-atom and 79-atom Pd–Ir nanoalloys. The configurations studied for 38-TO are shown in Fig. 2. The ball–cup structures are generated by embedding (but not completely covering) one type of atom in the other.35 The Janus alloy particle is formed by dividing the TO structure into discrete Pt and Ir regions, sharing a single (approximately) planar interface. The cluster Janus-Pd19Ir19 has a perfect half Pd and half Ir structure. Ordered structures are created by alternating Pd and Ir layers in the (100) or (111) directions and by occupying different fcc crystal positions with Pd or Ir. The core–shell structures have a core of one metal, completely surrounded by a shell of the other metal. Sandwich structures have a layer of one metal, sandwiched by layers of the other metal. In addition, to compare relative stabilities of different clusters with the same compositions, we also build the hex and centroid structures. For example, hex-Pd32Ir6 has 6 Ir atoms forming a hexagonal ring surrounding one of the (111) facets of TO38, while centroid-Pd32Ir6 has 6 Ir atoms occupying the centres of 6 (111) facets of TO, in a D3d symmetry arrangement.
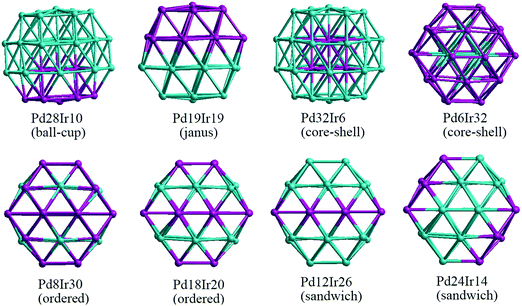 | ||
| Fig. 2 38-TO Pd–Ir nanoalloys with different compositions and configurations. In this (and later figures) Pd atoms are shown in blue and Ir atoms in purple. | ||
For molecular adsorption studies, the CO molecule has been chosen for adsorption on TO 38-atom Pd–Ir nanoalloys. The possible adsorption sites on the surface of TO-shaped nanoparticles are grouped into eight symmetry-inequivalent sites, as shown in Fig. 3. The sites include both (111) and (100) facets. 1 and 2 are the atop sites, on the center of the (111) facet and the edge atom between (111) and (100) facets, respectively. 3, 4 and 5 are bridge sites, respectively on the (111) facet, between the (111) and (100) facets, and between two (111) facets. 6 and 7 are (fcc) and (hcp) hollow sites on the (111) facet, 8 is the hollow site on the (100) facet. Calculations are performed by placing a single CO molecule at each of these sites and carrying out local DFT minimization.
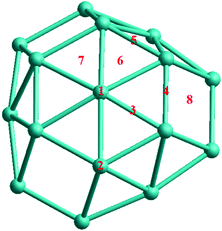 | ||
| Fig. 3 The eight unique sites for CO molecular adsorption on the surface of 38-atom TO Pd–Ir nanoalloys. | ||
2.2 DFT calculations
In this study, all calculations are performed using the DFT method, as implemented in the Vienna ab initio Simulation Package (VASP) code.36 The interaction between valence electrons and ionic cores is described by the projector augmented wave (PAW) method.37,38 The generalized gradient approximation (GGA) is employed within the Perdew–Burke–Ernzerhof (PBE) parameterization for the exchange–correlation energy functional.39 All the calculations are spin-polarized, and the valence electrons are treated explicitly. To avoid spurious periodic interactions, the bare clusters are placed into a sufficiently large supercell to ensure ∼10 Å separation by vacuum. All calculated clusters are locally geometrical optimized at the DFT level, where all cluster atoms, are relaxed until the forces on the atoms are lower than 0.01 eV Å−1, and the electronic ground states are determined by requiring a total energy convergence of 10−6 eV. In order to test the correctness of our computational methodology (VASP/PBE), a comparison of calculated and experimental lattice parameters (a), cohesive energies (Ec) and bulk modulus (B) for bulk fcc Pd and Ir has been made. As shown in the ESI,† the experimental and calculated values are in good agreement.2.3 Energies
For the stability comparison of Pd–Ir nanoalloys with different compositions and different configurations, a mixing (or excess) energy term (Δ) is calculated using:40 | (1) |
The average binding energy Eb is given by:
 | (2) |
The adsorption energy of a CO molecule on Pd–Ir clusters is calculated as the difference between the total energies of the combined system and separated ones, which is expressed by:
| Eads = Etot(combined) − Etot(cluster) − Etot(adsorbate) | (3) |
To compare the properties of alloyed clusters and pure clusters, the d-band center is calculated as:28,41
 | (4) |
3. Results and discussion
3.1 Bare Pd–Ir nanoalloys
First, to investigate the site preference for Pd and Ir dopants in the TO Pd–Ir nanoalloys, we calculate the mixing energy of Pd–Ir nanoalloys with only one dopant atom. The results are listed in Table 1. For the 38-TO cluster, a single Ir dopant in the Pd cluster preferentially occupies a core site (having the most negative Δ value), but it is most unfavourable in the corner (with largest positive Δ). Conversely, the most favourable position for a Pd dopant is the corner site, and it is demixing in the core site. The results (in terms of most and least stable sites) for 79-TO are the same as for 38-TO. The stability order for a single Ir dopant in 79-TO Pd clusters is core > subsurface > facet > edge > corner. On the contrary, for a Pd dopant, the stability order is corner > edge > facet > subsurface > core, only the corner position has negative mixing energy, which is similar to the Pd dopant in TO-38 Pd–Ir nanoalloys.| Position | Pd37Ir1 | Pd1Ir37 | Pd78Ir1 | Pd1Ir78 |
|---|---|---|---|---|
| Core | −0.412 | 1.170 | −0.181 | 1.596 |
| Facet | −0.055 | 0.318 | 0.216 | 0.292 |
| Corner | 0.449 | −0.088 | 0.803 | −0.348 |
| Edge | — | — | 0.453 | 0.225 |
| Sub1 | — | — | −0.069 | 0.682 |
| Sub2 | — | — | −0.117 | 0.853 |
The observed dopant site preferences are in agreement with the higher cohesive energy of Ir (6.93 eV) than Pd (3.94 eV);42 the fact that the metal–metal bond strengths are in the order Ir–Ir > Ir–Pd > Pd–Pd;43 and the lower (111) surface energy of Pd (0.824 eV per atom) compared to Ir (1.225 eV per atom).44
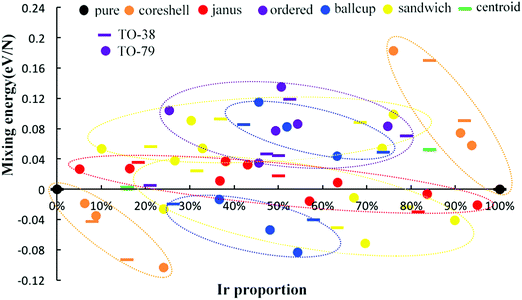
The relative structural stabilities of Pd–Ir nanoalloys is determined by calculating the mixing energies for different compositions and configurations, as shown in Fig. 4 and 5. Fig. 4 describes the variation of mixing energies of 38-atom Pd–Ir nanoalloys with increasing Ir composition. From this figure, one can see that the PdshellIrcore structure is the most stable configuration of all the isomers considered (having the most negative) mixing energy, because the Pd atoms on the surface are beneficial to lowering the total energy of Pd–Ir nanoalloys. This is consistent with the results for single dopants in Pd–Ir clusters, since Ir atoms preferentially occupy core sites. Conversely, the PdcoreIrshell isomer is the least stable structure, which is also consistent with the site preference of Pd doping, which is unfavourable in core sites. In addition, for different chemical orderings of Pd–Ir nanoalloys with the same composition, taking hex-Pd32Ir6, centroid-Pd32Ir6 and core–shell-Pd32Ir6 nanoalloys as examples, one can see the mixing energy (Δ) of hex > centroid > core–shell structures, which means for the same compositions, the stability of core–shell > centroid > hex. Similarly, the stability of Janus-Pd19Ir19 is higher than that of ordered-Pd19Ir19, because of the much higher strength of the Ir–Ir bonds. Moreover, for the Janus-type configurations with different compositions, Ir-rich clusters are most stable among all considered compositions. For ordered-structures, the Pd-rich cluster has the lowest mixing energy (0.176 eV) among all ordered structures. Interestingly, for both sandwich-type and ball–cup-type arrangements, the slightly Ir-rich structures have lowest mixing energies with mixing energies of −1.904 eV and −1.525 eV, respectively.
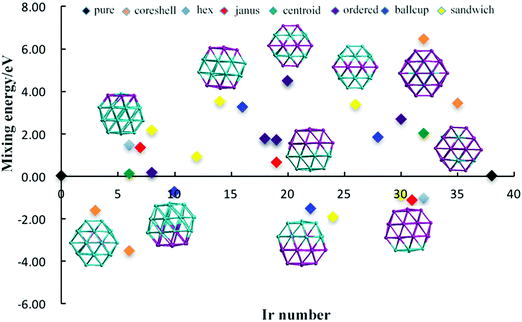 | ||
| Fig. 4 Mixing energy of 38-TO Pd–Ir nanoalloys with different compositions and configurations. Different colours represent different configurations. | ||
To investigate the structural stability of Pd–Ir nanoalloys with different compositions and configurations, we calculate the mixing energies per atom of 38-atom and 79-atom Pd–Ir alloys with increasing Ir composition. As shown in Fig. 5, the stability trend found for 38-TO also applies for 79-TO Pd–Ir nanoclusters. The same configurations of 38-atom and 79-atom Pd–Ir clusters are grouped in the coloured ellipses. Interestingly, for the core–shell group, one can see that the mixing energies of the core–shell structures and the corresponding pure clusters form a straight line for both PdshellIrcore and PdcoreIrshell. Since Ir atoms prefer to occupy core sites, when the core sites of the PdshellIrcore structure are gradually replaced by Pd atoms, the mixing energy of the core–shell structure increases, until Δ = 0 eV for the pure Pd clusters. To distinguish the stability of sandwich structures sandwiched by Pd atoms or Ir atoms, we divide them into sandwich-Pd structures (Pd sandwiching Ir) and sandwich-Ir ones (Ir sandwiching Pd). The general stability order for both 38-atom and 79-atom Pd–Ir nanoalloys is PdshellIrcore > PdcupIrball > sandwich-Pd > Janus > sandwich-Ir > ordered ≈ PdballIrcup > PdcoreIrshell. Although the mixing energies of the sandwich-type and Janus-type structures range from positive to negative values with increasing Ir proportion, the other arrangements either have all positive or all negative Δ values, indicating the consistency of the mixing or demixing tendency of a given configuration.
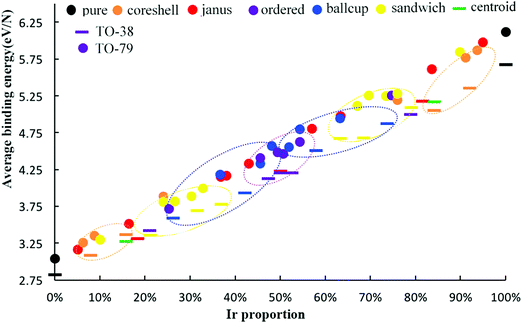
To further measure the stability of Pd–Ir clusters with different compositions and configurations, we calculate the average binding energy of alloy Pd–Ir clusters, as shown in Fig. 6. It can be clearly observed that the average binding energies of Pd–Ir clusters increase as the proportion of Ir becomes larger, because Ir–Ir and Pd–Ir bonds are stronger than Pd–Pd bonds. From this figure, we can obtain the stability order of Pd–Ir clusters: PdcoreIrshell > sandwich-Pd > PdcupIrball > ordered > PdballIrcup > PdcoreIrshell. By comparing the results of the average binding energy and mixing energy calculations, only the order of the ball–cup and sandwich configurations are reversed.
3.2 CO adsorption
To investigate the best adsorption site of a CO molecule on TO 38-atom Pd–Ir nanoalloys and the effect of alloying on CO adsorption strength, we compare the adsorption energies (Eads) of CO on several alloying configurations with pure Pd38 and Ir38 TO clusters in eight surface adsorption sites, as shown in Table 2. As a representative for alloyed clusters, core–shell (Pd32Ir6 and Pd6Ir32) and Janus (Pd19Ir19–Pd and Pd19Ir19–Ir) clusters are selected.| Site | Pure Pd | PdshellIrcore | Janus-Pd | Janus-Ir | PdcoreIrshell | Pure Ir |
|---|---|---|---|---|---|---|
| 1 (centre-atop) | −1.31 | −1.51 | −1.49 | −2.75 | −2.60 | −2.47 |
| 2 (edge-atop) | −1.64 | −1.67 | −1.69 | −2.59 | −2.75 | −2.58 |
| 3 (111-bridge) | −2.12 | −1.82 | −2.16 | −1.99 | −2.06 | −1.96 |
| 4 (111–100 bridge) | −1.95 | −1.92 | −2.17 | −2.32 | −2.37 | −2.45 |
| 5 (111–111 bridge) | −2.11 | −2.03 | −2.01 | −2.28 | −2.41 | −2.25 |
| 6 (fcc-hollow) | −2.12 | −2.05 | −2.16 | −2.75 | −2.06 | −2.24 |
| 7 (hcp-hollow) | −2.02 | −1.97 | −2.14 | −1.99 | −2.06 | −2.44 |
| 8 (fourfold-hollow) | −1.96 | −1.75 | −2.16 | −2.41 | −2.37 | −2.45 |
For the pure Pd cluster, the preferred position for adsorption of the CO molecule is site 6 (the fcc-hollow on the (111) facet), which has the most negative adsorption energy −2.12 eV, followed by the bridge site between two (111) facets (site 5, −2.11 eV). This agrees with a previous study showing that fcc and hcp hollow sites are the favoured sites for CO on the extended Pd(111) surface, and the bridge site is the second most stable.45 Our calculations of CO adsorption on extended Pd(111), Pd(100), Ir(111) and Ir(100) surfaces, also show that hollow sites are preferred on Pd(111) surfaces with Eads = −2.05 eV and −2.07 eV for fcc hollow and hcp hollow sites, respectively, as shown in Table 3. For the Pd(100) surface, the bridge-adsorption site is energetically most favourable for CO adsorption, in agreement with CO previous study.46 The adsorption on the bridge site on the (111) facet (site 3) of the pure Pd cluster also has a reported adsorption energy of −2.12 eV, since CO adsorption on the (111)-bridge is unstable (the site is not a local minimum), and the CO molecule relaxes to a neighbouring fcc-hollow (site 6).
| Site | Pd(111) | Pd(100) | Ir(111) | Ir(100) |
|---|---|---|---|---|
| Atop | −1.43 | −1.51 | −1.99 | −2.28 |
| Bridge | −2.04 | −1.94 | −1.65 | −2.12 |
| fcc/hcp-hollow | −2.05/−2.07 | — | −1.59/−1.67 | — |
| Four-fold-hollow | — | −1.89 | — | −1.74 |
For the pure Ir38 cluster, the atop site on the edge (site 2) is found to be the favoured position, followed by the atop site in the centre of the (111) facet. This result agrees with the extended Ir surface calculations listed in Table 3, where the atop sites are found to be preferred on both the Ir(111) and Ir(100) surfaces. In previous computational and experimental studies of CO on Ir surfaces, the atop site was reported to be the most favourable site for CO on Ir(111) and Ir(100) surfaces.47,48 It is worth noting that on the pure Ir cluster, the CO molecule in hollow sites (the (111)-fcc-hollow, (111)-hcp-hollow and (100)-fourfold-hollow) all relax to neighbouring bridge positions (site 4 or site 5), probably because the corner atoms of the (111) facet have lower coordination numbers and bind CO more strongly. CO binding on the pure Ir cluster is significantly stronger (with more negative Eads values) than on the pure Pd cluster for all adsorption sites. Comparing the adsorption energies for the most strongly binding sites for Ir38 and Pd38, Eads is 0.46 eV lower for Ir38 than Pd38.
Moving to Pd–Ir nanoalloys, for the core–shell type, the fcc-hollow position (site 6) of CO on the PdshellIrcore (Pd32Ir6) cluster is found to be the preferred site, as for the pure Pd cluster, followed by the bridge position between two (111) facets (site 5). The adsorption strength of CO on the PdshellIrcore cluster is lower than on the pure Pd cluster, for all sites except the atop sites. For the PdcoreIrshell (Pd6Ir32) cluster, the edge atop site (site 2) is found to be the most favourable, as for the pure Ir cluster. For almost all sites, the adsorption strength of CO on PdcoreIrshell is stronger than on the pure Ir cluster, except for those sites where CO relaxes to other sites. The difference in the adsorption energies for the best sites on the PdcoreIrshell and PdshellIrcore clusters is greater (0.70 eV) than for the pure metal clusters (0.46 eV), reflecting the strengthening of Ir–CO and weakening of Pd–CO binding on going from the pure to the core–shell clusters.
For Janus structures (Pd19Ir19), the underlying Pd or Ir layers again affect the adsorption strength of CO on the other metal, but in a less straightforward way than for the core–shell clusters. As seen in Table 2, the adsorption energies of CO on Janus-Pd (i.e. the Pd part of the Janus cluster) are generally more negative (indicating stronger Pd–CO binding). The bridge site between the (111) and (100) facets is the preferred site for CO on Janus-Pd (site 4), different from the pure Pd cluster and PdshellIrcore cluster, which favour the fcc-hollow (site 6), though the difference in Eads is only 0.01 eV. The adsorption energies on Janus-Ir (i.e. the Ir part of the Janus cluster) are generally more negative (indicating stronger Ir–CO binding) than for the pure Ir cluster. The strongest binding site (more negative adsorption energy) is the centre-atop position (site 1), in contrast to the pure Ir and PdcoreIrshell clusters, which favour the edge-atop position (site 2). Again, the adsorption of CO on Ir is significantly greater than on Pd, with a difference in Eads of the favoured sites of 0.58 eV (i.e. intermediate between that for pure and core–shell clusters).
From Table 2, we see that the fcc hollow site (site 6) is energetically the most favorable position for CO adsorption on Pd, except for the Janus-Pd cluster, while the atop site on the edge (site 2) is found to be the most favorable site for Ir, except the Janus-Ir cluster. Therefore, for comparison of the adsorption strength of CO for several alloying configurations and the pure clusters, we select several Pd–Ir configurations with CO adsorption on sites 2 and 6 as representatives, as shown in Fig. 7. Comparing the pure clusters with core–shell and Janus nanoalloys, we observe that the adsorption strength on one particular metal (Pd or Ir) is affected by the presence of the other metal, whether it is in direct contact with the adsorbing metal atom or not.
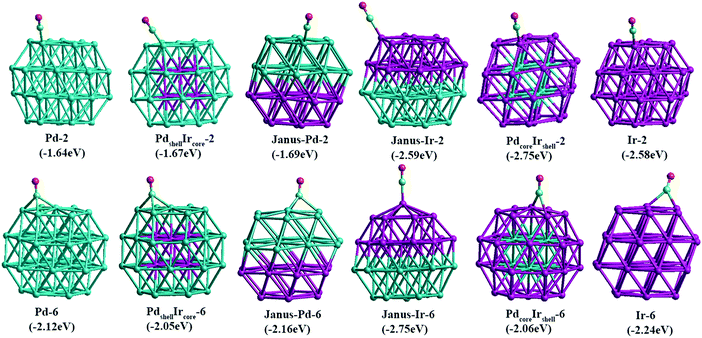 | ||
| Fig. 7 Adsorption energies and structures of CO on edge-atop (site 2) and fcc hollow (site 6) sites for 38-atom TO pure Pd and Ir cluster and core–shell and Janus Pd–Ir nanoalloys. | ||
For CO adsorption on Pd, the situation is complex. Due to the presence of Ir atoms, the CO adsorption strength on the PdshellIrcore cluster decreases (Eads becomes less negative) while on the Janus-Pd cluster the adsorption strength is greater (more negative Eads) compared to pure Pd38. For CO adsorption on Ir, CO molecules adsorbed on the fcc hollow site (site 6) relax to other positions, but the adsorption strength on both PdcoreIrshell and Janus-Ir clusters still increases compared to pure Ir38, indicating a positive effect of the underlying Pd atoms. Comparing these results with previous studies of CO adsorption on Au–Rh nanoalloys,45 the strengthening of Ir–CO binding in the presence of Pd and the weakening of Pd–CO binding in the presence of Ir as seen for the PdshellIrcore cluster, could be attributed to a mechanical (strain) effect, whereby (as the metal–metal bond strengths are in the order Ir–Ir > Ir–Pd > Pd–Pd) underlying Ir atoms impose greater rigidity to the Pd atoms, decreasing the Pd–CO binding. Conversely, underlying Pd atoms reduce the rigidity of the Ir atoms, allowing stronger Ir–CO binding. However, this argument doesn’t apply for all binding sites, and, in particular, does not apply to Janus-Pd, where the presence of Ir leads to an increase in Pd–CO binding strength (more negative Eads). Therefore, electronic effects must also be investigated.
3.3 Alloying effect on adsorption strength
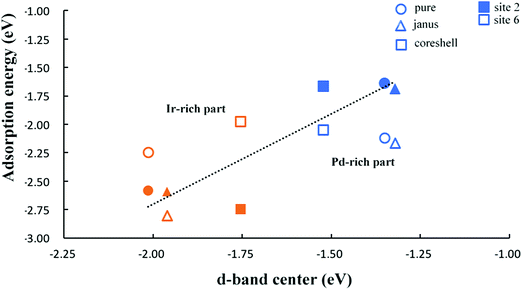
To further investigate trends in the adsorption strength of CO molecular adsorption on pure clusters and Pd–Ir nanoalloys, we calculate the d-band centers of several Pd–Ir configurations. Fig. 8, shows the relationship between CO adsorption energies and the d-band centers of the clusters. According to the definition of the d-band model, an upshift in the d-band center (less negative value) is expected to correspond to stronger CO adsorption strength (more negative Eads). For adsorption of CO on Pd, it follows the relationship of d-band center and adsorption strength by comparing the d-band centers of PdshellIrcore and Janus-Pd clusters with pure Pd38. Since we can clearly observe a significant downshift in the d-band centre for PdshellIrcore and a small upshift for Janus-Pd, which corresponds to weaker CO adsorption on PdshellIrcore and stronger adsorption on Janus-Pd, compared to Pd38.For CO adsorption on Ir, we observe an upshift of the d-band centers for both Janus-Ir and PdcoreIrshell clusters, when compared with pure Ir38, for both sites, though the upshift for Janus-Ir is small. This follows the change of adsorption strength, since the adsorption of CO on Ir is stronger (more negative Eads) for all alloy configurations on site 2 compared to pure Ir38, consistent with the prediction of the d-band model. However, for CO adsorption on site 6, the Ir-rich clusters do not always follow the trend of d-band center and adsorption strength, because CO adsorption on site 6 of Ir-rich clusters is unstable, CO moving to other sites. Fig. 8 also shows that the adsorption strength on site 6 is stronger than on site 2 for Pd–CO binding, while for Ir–CO binding, the adsorption strength on site 2 is not always better than on site 6 since CO on hollow sites is generally not stable, relaxing to neighboring sites (e.g. bridging sites), as can be seen in Fig. 7.
To analyze the charge effect on the adsorption strength of alloy clusters relative to their corresponding pure clusters, we calculate the charges on the (111) layer of bare clusters and charge transfer between clusters and the CO adsorbate. These, along with the d-band centers and the metal–CO and C–O distances are shown in Table 4. The Pd layer charges for PdshellIrcore and Janus-Pd clusters are more positive than for the pure Pd cluster due to the effect of alloying with Ir. Conversely, the Ir layer charges become less positive when alloyed with Pd, though the electronegativity of Ir is equal to Pd (having the value 2.20). Meanwhile, the charge transferred from Janus-Ir and PdcoreIrshell clusters CO adsorbed on site 2 is more negative than for the pure Ir cluster. Perhaps, as Ir has fewer d electrons than Pd, this leads to d electron transfer from Pd to Ir.
| Cluster | d-Center | Layer charge | Charge transfer | d C–O | d M–C | E ads |
|---|---|---|---|---|---|---|
| Site 2 | ||||||
| Pure-Pd | −1.351 | 0.183 | −0.413 | 1.162 | 1.842 | −1.641 |
| PdshellIrcore | −1.522 | 0.201 | −0.414 | 1.163 | 1.854 | −1.667 |
| Janus-Pd | −1.320 | 0.314 | −0.405 | 1.162 | 1.853 | −1.693 |
| Janus-Ir | −1.960 | 0.075 | −0.598 | 1.173 | 1.838 | −2.593 |
| PdcoreIrshell | −1.755 | 0.270 | −0.577 | 1.171 | 1.839 | −2.747 |
| Pure-Ir | −2.014 | 0.448 | −0.551 | 1.172 | 1.839 | −2.584 |
| Site 6 | ||||||
| Pure-Pd | −1.351 | 0.183 | −0.589 | 1.198 | 2.081, 2.037, 2.036 | −2.118 |
| PdshellIrcore | −1.522 | 0.201 | −0.581 | 1.197 | 2.051, 2.054, 2.088 | −2.050 |
| Janus-Pd | −1.320 | 0.314 | −0.590 | 1.2 | 2.052, 2.033, 2.052 | −2.164 |
| Janus-Ir | −1.960 | 0.075 | −0.608 | 1.174 | 1.801 | −2.750 |
| PdcoreIrshell | −1.755 | 0.270 | −0.665 | 1.191 | 2.043, 2.065 | −2.063 |
| Pure-Ir | −2.014 | 0.448 | −0.646 | 1.193 | 2.026, 2.026 | −2.244 |
4. Conclusions
The mixing properties of bare Pd–Ir clusters, the adsorption effect and preferred adsorption sites of the CO molecule on 38-atom Pd–Ir nanoclusters have been investigated theoretically using DFT methods. In agreement with the lower surface and cohesive energy of Pd than Ir, the calculations show that PdshellIrcore clusters are the most stable structures and PdcupIrball clusters are the second most stable, with negative mixing energies for all considered isomers, while PdcoreIrshell is the highest energy configuration, with large positive mixing energies. These results are also consistent with the site preference for Pd and Ir dopants in the TO Pd–Ir nanoalloys. The general stability order for both 38-atom and 79-atom Pd–Ir nanoclusters is PdshellIrcore > PdcupIrball > sandwich-Pd > Janus > sandwich-Ir > ordered ≈ PdballIrcup > PdcoreIrshell. Moreover, the Ir atoms exhibit significantly stronger adsorption of CO molecules than Pd atoms. The preferred binding site of CO on the pure Pd cluster is the fcc-hollow on the (111) facet, while the atop site on the edge atom between (111) and (100) facets is found to be the most favorable position for CO on the pure Ir cluster. These results agree with the favored binding sites for CO on extended Pd and Ir surfaces. In addition, the d-band center of the pure and nanoalloy clusters has been calculated to understand the adsorption strength of CO molecules on different clusters. Adsorption strength is found to follow the position of the d-band center in most, but not all cases. Charge effects have also been studied, correlating with the increase or decrease of adsorption strength, but the possible role of mechanical (strain) effects remains to be determined.In future studies, we will investigate the effect of oxide supports (such as Al2O3) on the structures and stabilities of Pd–Ir nanoalloys and on the adsorption of CO and other molecules, as well as reactions between adsorbed molecules.
Conflicts of interest
There are no conflicts to declare.Acknowledgements
RLJ is grateful to Dr Laurent Piccolo (University of Lyon 1, France) for useful discussions. This work was funded by the Graduate School of Xiamen University (T.-E Fan). H. A. Hussein is grateful to the University of Kufa and the Ministry of Higher Education and Scientific Research (Iraq) for the award of a PhD scholarship. Calculations were performed on the following HPC facilities: The University of Birmingham BlueBear facility (http://www.bear.bham.ac.uk/bluebear) and the UK's national HPC facility, ARCHER, via membership of the UK's HPC Materials Chemistry Consortium, which is funded by EPSRC (EP/L000202), and the EPSRC Critical Mass Grant (EP/J010804/1) TOUCAN.References
- R. W. Murray, Chem. Rev., 2008, 108, 2688 CrossRef CAS PubMed.
- B. Hammerand and J. K. Norskov, Nature, 1995, 376, 238 CrossRef.
- K. Persson, A. Ersson, K. Jansson, N. Iverlund and S. Jaras, J. Catal., 2005, 231, 139 CrossRef CAS.
- A. S. Rocha, E. L. Moreno, G. P. M. da Silva, J. L. Zotin and A. C. Faro Jr., Catal. Today, 2008, 133, 394 CrossRef.
- S. Y. Shen, T. S. Zhao and J. B. Xu, Electrochim. Acta, 2010, 55, 9179 CrossRef CAS.
- Y. M. Lopez-De Jesús, C. E. Johnson, J. R. Monnier and C. T. Williams, Top. Catal., 2010, 53, 1132 CrossRef.
- F. Morfin, S. Nassreddine, J. L. Rousset and L. Piccolo, ACS Catal., 2012, 2, 2161 CrossRef CAS.
- C. Zlotea, F. Morfin, T. S. Nguyen, N. T. Nguyen, J. Nelayah, C. Ricolleau, M. Latroche and L. Piccolo, Nanoscale, 2014, 6, 9955 RSC.
- L. Piccolo, S. Nassreddine, M. Aouine, C. Ulhaq and C. Geantet, J. Catal., 2012, 292, 173 CrossRef CAS.
- F. Morfin, S. Nassreddine, J. L. Rousset and L. Piccolo, ACS Catal., 2012, 2, 2161 CrossRef CAS.
- L. Piccolo, S. Nassreddine, G. Toussaint and C. Geantet, ChemSusChem, 2012, 5, 1717 CrossRef CAS PubMed.
- P. E. A. Turchi, V. Drchal and J. Kudrnovský, Phys. Rev. B: Condens. Matter Mater. Phys., 2006, 74, 064202 CrossRef.
- B. Kolb, S. Müller, D. B. Botts and G. L. W. Hart, Phys. Rev. B: Condens. Matter Mater. Phys., 2006, 74, 144206 CrossRef.
- R. Ferrando, J. Jellinek and R. L. Johnston, Chem. Rev., 2008, 108, 845 CrossRef CAS PubMed.
- S. Alayoglu, A. U. Nilekar, M. Mavrikakis and B. Eichhorn, Nat. Mater., 2008, 7, 333 CrossRef CAS PubMed.
- L. Kesavan, R. Tiruvalam, M. H. Ab Rahim, M. I. Bin Saiman, D. I. Enache, R. L. Jenkins, N. Dimitratos, J. A. Lopez-Sanchez, S. H. Taylor, D. W. Knight, C. J. Kiely and G. J. Hutchings, Science, 2011, 331, 195 CrossRef CAS PubMed.
- S. Khanal, N. Bhattarai, J. J. Velazquez-Salazar, D. Bahena, G. Soldano, A. Ponce, M. M. Mariscal, S. Mejia-Rosalesc and M. Jose-Yacaman, Nanoscale, 2013, 5, 12456 RSC.
- K. J. Andersson, F. Calle-Vallejo, J. Rossmeisl and I. Chorkendorff, J. Am. Chem. Soc., 2009, 131, 2404 CrossRef CAS PubMed.
- F. Tao, M. E. Grass, Y. Zhang, D. R. Butcher, J. R. Renzas, Z. Liu, J. Y. Chung, B. S. Mun, M. Salmeron and G. A. Somorjai, Science, 2008, 322, 932 CrossRef CAS PubMed.
- F. Tao, M. E. Grass, Y. Zhang, D. R. Butcher, F. Aksoy, S. Aloni, V. Altoe, S. Alayoglu, J. R. Renzas, C. Tsung, Z. Zhu, Z. Liu, M. Salmeron and G. A. Somorjai, J. Am. Chem. Soc., 2010, 132, 8697 CrossRef CAS PubMed.
- V. Soto-Verdugo and H. Metiu, Surf. Sci., 2007, 601, 5332 CrossRef CAS.
- A. Dhouib and H. Guesmi, Chem. Phys. Lett., 2012, 521, 98 CrossRef CAS.
- G. Ertl, M. Neumann and K. M. Streit, Surf. Sci., 1977, 64, 393 CrossRef CAS.
- O. Cairon and H. Guesmi, Phys. Chem. Chem. Phys., 2011, 13, 11430 RSC.
- W. Bouderbala, A.-G. Boudjahem and A. Soltani, Mol. Phys., 2014, 112, 1789 CrossRef CAS.
- J. B. A. Davis, S. L. Horswell, L. Piccolo and R. L. Johnston, J. Organomet. Chem., 2015, 792, 190 CrossRef CAS.
- J. B. A. Davis, S. L. Horswell and R. L. Johnston, J. Phys. Chem. A, 2013, 118, 208 CrossRef PubMed.
- J. B. A. Davis, R. L. Johnston, L. Rubinovich and M. Polak, J. Chem. Phys., 2014, 141, 224307 CrossRef PubMed.
- T. H. Andriamiharintsoa, A. Rakotomahevitra, L. Piccolo and C. Goyhenex, J. Nanopart. Res., 2015, 17, 217 CrossRef.
- B. Coq and F. J. Figueras, J. Mol. Catal. A: Chem., 2001, 173, 117 CrossRef CAS.
- L. L. Wang and D. D. Johnson, J. Am. Chem. Soc., 2009, 131, 14023 CrossRef CAS PubMed.
- Y. Sun, B. Wiley, Z. Y. Li and Y. Xia, J. Am. Chem. Soc., 2004, 126, 9399 CrossRef CAS PubMed.
- F. Baletto, C. Mottet and R. Ferrando, Phys. Rev. Lett., 2003, 90, 135504 CrossRef CAS PubMed.
- D. Cheng, W. Wang, S. Huang and D. Cao, J. Phys. Chem. C, 2008, 112, 4855 CAS.
- L. O. Paz-Borbon, A. Gupta and R. L. Johnston, J. Mater. Chem., 2008, 18, 4154 RSC.
- G. Kresse and J. Hafner, Phys. Rev. B: Condens. Matter Mater. Phys., 1993, 47, 558 CrossRef CAS.
- P. E. Blöchl, Phys. Rev. B: Condens. Matter Mater. Phys., 1994, 50, 17953 CrossRef.
- G. Kresse and D. Joubert, Phys. Rev. B: Condens. Matter Mater. Phys., 1999, 59, 1758 CrossRef CAS.
- J. P. Perdew, K. Burke and M. Ernzerhof, Phys. Rev. Lett., 1996, 77, 3865 CrossRef CAS PubMed.
- R. Ferrando, A. Fortunelli and G. Rossi, Phys. Rev. B: Condens. Matter Mater. Phys., 2005, 72, 085449 CrossRef.
- I. Demiroglu, Z. Y. Li, L. Piccolo and R. L. Johnston, Catal. Sci. Technol., 2016, 6, 6916 CAS.
- V. Rosato, M. Guillope and B. Legrand, Philos. Mag. A, 1989, 59, 321 CrossRef.
- J. E. Bercaw, A. C. Durrell, H. B. Gray, J. C. Green, N. Hazari, J. A. Labinger and J. R. Winkler, Inorg. Chem., 2010, 49, 1801 CrossRef CAS PubMed.
- L. Vitos, A. V. Ruban, H. L. Skriver and J. Kollar, Surf. Sci., 1998, 411, 186 CrossRef CAS.
- D. Loffreda, D. Simon and P. Sautet, Surf. Sci., 1999, 425, 68 CrossRef CAS.
- A. Eichler and J. Hafner, Phys. Rev. B: Condens. Matter Mater. Phys., 1998, 57, 10110 CrossRef CAS.
- W. P. Krekelberg, J. Greeley and M. Mavrikakis, J. Phys. Chem. B, 2004, 108, 987 CrossRef CAS.
- I. A. Erikat, B. A. Hamad and J. M. Khalifeh, Eur. Phys. J. B, 2009, 67, 35 CrossRef CAS.
Footnote |
| † Electronic supplementary information (ESI) available. See DOI: 10.1039/c7cp04811d |
| This journal is © the Owner Societies 2017 |

