
 Open Access Article
 This Open Access Article is licensed under a Creative Commons Attribution-Non Commercial 3.0 Unported Licence
Orientational ordering of water in extended hydration shells of cations is ion-specific and is correlated directly with viscosity and hydration free energy
Yixing
Chen
 ,
Halil I.
Okur
,
Chungwen
Liang
and
Sylvie
Roke
*
,
Halil I.
Okur
,
Chungwen
Liang
and
Sylvie
Roke
*
Laboratory for fundamental BioPhotonics (LBP), Institute of Bio-engineering (IBI), and Institute of Materials Science (IMX), School of Engineering (STI), and Lausanne Centre for Ultrafast Science (LACUS), École Polytechnique Fédérale de Lausanne (EPFL), CH-1015, Lausanne, Switzerland. E-mail: sylvie.roke@epfl.ch
First published on 7th August 2017
Abstract
Specific ion effects in aqueous solutions are investigated at the molecular, nanoscopic and macroscopic levels. Femtosecond elastic second harmonic scattering (fs-ESHS) is used here to assess the chemical effects of ions on molecular and nanoscopic length scales of water, probing changes in the charge distribution around ions as well as structural orientational order of water molecules in extended hydration shells. We measured >0.05 M electrolyte solutions with a series of chloride salts (LiCl, NaCl, KCl, CsCl, RbCl, NH4Cl, MgCl2, CaCl2, and SrCl2). Ion specificity is observed in both the local electronic anisotropy and the nanoscopic orientational ordering of water. Both observables are influenced more by cations with larger valencies and smaller sizes and follow a direct Hofmeister trend. These ion-induced structural changes in the hydrogen-bond network of water are strongly correlated with the viscosity B-coefficient and the Gibbs free energy of hydration of ions. Such a connection between the nanoscopic and macroscopic changes provides a possibility to construct a molecular model for specific ion effects in aqueous solutions.
Introduction
Inorganic ions play specific and irreplaceable roles in various physical, chemical, and biological processes in aqueous solutions, from colloid assembly and bubble coalescence to protein folding and enzyme activities, typically observed at and above the physiological concentration of electrolytes (∼0.1 M).1–6 Specific ion effects are shown to be present in various macroscopic properties of bulk aqueous solutions, such as viscosity of electrolyte solutions and solvation free energy of ions.7–9 Recent work also shows that changes occur at the molecular level.10–12 Neutron and X-ray diffraction studies that measure the structure factor of ionic hydration shells report ion-specific coordination numbers of alkali ions.13–16 The electronic state of ion hydrating water molecules was probed by X-ray absorption spectroscopy. It was found that cations with a low charge density weaken the hydrogen (H)-bonds of hydrating water molecules whereas cations with a high charge density cause the formation of strong H-bonds.17,18 Raman spectroscopy,19,20 vibrational dynamics measurements,21–24 and ensemble infrared photodissociation spectroscopy25,26 probe the O–H stretch modes of hydrating water molecules in the vicinity of ions. These studies showed that different ions perturb the water network and restrain the dynamics of water molecules to different extents, leading to ion-specific changes in the spectra of O–H stretch regions. Changes in the complex permittivity of electrolyte solutions as probed by dielectric spectroscopy measurements indicated that small and highly charged cations align and irrotationally bind water in the first hydration shell.27 Auger electron spectroscopy studies of ultrafast charge delocalization phenomena in electrolyte solutions showed that cations with larger charges induce a slower electron-hopping rate to the oxygen of hydrating water molecules.28,29 Computer simulations that calculated the radial distribution and orientation of water molecules in the ionic hydration shells4,19,23,30–33 showed that ions induce distinct changes in the water network that involve changing the number of H-bonds per water molecule and affecting the reorientation of individual water molecules.All the above studies report specific ion effects on the structure and dynamics of water molecules in the first few hydration shells of ions in aqueous solutions. However, the mechanism of specific (cat)ion effects is not fully understood.34 A well-known example is the high selectivity of ion channels for either K+ or Na+ ions, which cannot be explained simply by a difference in geometry alone.35,36 Another example is that Na+ is essential to regulate blood pressure but toxic at a high intracellular concentration, whereas K+ is not toxic and serves as the major intracellular monovalent ion.37 Although some recent molecular dynamics studies38–41 have reported ion-induced water ordering over nanoscale distances, there is no molecular-level experimental evidence for long-range specific ion effects on the bulk water structure. An overarching molecular model based on combined experimental data and theory that explains how specific ion effects extend from the first few hydration shells of ions to the bulk water network and lead to macroscopic effects in the bulk properties of electrolyte solutions is still lacking. To help with this issue, a technique that is able to probe hydrating water at the molecular level and is also sensitive to longer range structural changes in extended hydration shells is needed. Femtosecond elastic second harmonic scattering (fs-ESHS) has recently been shown to access molecular level properties of electrolyte solutions up to nanoscale distances.39,42 Specifically, fs-ESHS studies on electrolyte solutions with ionic strengths in the range of 1 μM to 100 mM found a universal long-range (∼20 nm) influence of ions on the H-bond network of water molecules, which can be qualitatively explained as a perturbation in the water–water correlations induced by the total electrostatic field of the ions in solution.39,43 As a second-order nonlinear process, fs-ESHS selectively probes both local electronic anisotropy of individual molecules and nanoscopic structural anisotropy (i.e. orientational order) in a liquid. Electronic anisotropy gives rise to an incoherent response and structural anisotropy gives rise to a coherent response that reflects the orientational order of molecules, whereas no second harmonic (SH) intensity is generated in a centrosymmetric environment composed of centrosymmetric molecules. The coherent and incoherent contributions can be investigated separately using different polarization combinations of the incoming and outgoing electromagnetic waves. The sensitivity to the orientational order as well as the electronic charge distribution suggests that fs-ESHS could also provide molecular level insight into specific ion effects in more concentrated aqueous solutions. As the orientational order in the H-bond network is related directly to the formation and breaking of H-bonds, a connection with macroscopic properties of electrolyte solutions, such as viscosity and the Gibbs free energy of hydration, is worth investigating.
Here, we probe aqueous solutions, with ionic strengths >0.05 M, of a series of chloride salts (LiCl, NaCl, KCl, CsCl, RbCl, NH4Cl, MgCl2, CaCl2, and SrCl2) with fs-ESHS. We observe ion specificity in both the local electronic anisotropy and the nanoscopic orientational ordering of water in extended hydration shells. Both observables are influenced more by cations with larger valencies and smaller sizes and follow a direct Hofmeister trend. We also find that the ion-induced orientational ordering in the water network, revealed by a linear increase in the fs-ESHS intensity of the coherent response as a function of the electrolyte concentration, is strongly correlated with the viscosity B-coefficient and the Gibbs free energy of hydration of ions. These findings are of particular interest, given that cations play a critical role in biologically relevant aqueous systems. The observed connection between the molecular (electronic anisotropy), nanoscopic (orientational ordering of water) and macroscopic (viscosity/hydration free energy) observables will further our understanding of the hydration of ions as well as specific ion effects in aqueous solutions and will open a route to the development of a multiscale model.
The present work is structured as follows: we first introduce the theoretical background of fs-ESHS, followed by the Materials and methods section. Then we present theoretical calculations of the SH intensity of aqueous solutions of a series of chloride salts. The incoherent SH responses from single spherical ions with different radii and single water molecules are considered first. The coherent SH intensity is calculated for electrolyte solutions based on Debye–Hückel (DH) theory, in which a dielectric continuum, a gas of water dipoles and statistical distributions of ions that follow from the linearized Boltzmann distribution are assumed. We compare these relatively simplistic theoretical results with the data of fs-ESHS measurements of electrolyte solutions for the incoherent and coherent responses separately. We find that the experiments contain many details about the intricate relationship of water and ions that are not captured by the models. Finally, we correlate the fs-ESHS responses obtained in different polarization combinations with the viscosity B-coefficient and Gibbs free energy change of hydration to show a connection between the nanoscopic and macroscopic observations. Such a connection evidently warrants further investigation into the atomistic details that underlie the presented experiments.
Theoretical background of fs-ESHS
In a fs-ESHS process in an aqueous electrolyte solution, SH polarization P(2)(2ω) is induced in the focal volume of incident electromagnetic waves E(ω) with frequency ω and wavevector kω. P(2)(2ω) is the source of SH light with frequency 2ω and wavevector k2ω. The SH response of a molecule is characterized by its second-order hyperpolarizability, β(2)(2ω; ω, ω) = β(2). When an electrostatic field E(0) is present, the third-order hyperpolarizability β(3)(2ω; ω, ω, 0) = β(3) will also contribute to the emitted SH light. The emitted fs-ESHS intensity I(2ω)J measured at a scattering angle θ = 90° (Fig. 1A) in a polarization state J is:44,45 | (1) |
 represents the sum over molecules in a unit volume of the focus of the incident light. The indices J, K, L, and M denote the polarization states of the involved electromagnetic fields. They are ordered from high (left) to low frequency (right). The scattering vector q is defined as q ≡ k2ω − 2kω. The fs-ESHS intensity I(2ω) can be considered as arising from a self-correlation term that is incoherent (〈
![[small beta, Greek, macron]](https://www.rsc.org/images/entities/i_char_e0c3.gif) JKL2〉incoh) and a cross-correlation term that is coherent (〈JKL2〉coh), which changes eqn (1) to44
JKL2〉incoh) and a cross-correlation term that is coherent (〈JKL2〉coh), which changes eqn (1) to44 | (2) |
 | ||
| Fig. 1 (A) Sketch of the fs-ESHS experiment and the different coordinate systems. P(S) represents linear polarized light parallel (perpendicular) to the scattering plane (i.e., the XZ plane). (B) Illustration of possible incoherent contributions to the fs-ESHS responses of spherical ions (row 1 and 2) and water molecules (row 3) in an electrolyte solution. The centrosymmetric ions have a vanishing second-order hyperpolarizability (β(2) = 0), while the non-centrosymmetric water molecules have a non-zero hyperpolarizability. When an electrostatic field is present, the centrosymmetry around the ion is broken and SH photons can emerge. The non-zero polarization combinations in a collinear excitation geometry are: PPP, PSS, SSS, and SPP. This three-letter code for the polarization state, from left to right, denotes the polarization state of each participating photon from high frequency to low frequency. (C) Illustration of possible coherent contributions to the fs-ESHS responses of ions (left) and water molecules (right). For the ion response the electrostatic field from other ions is on average vanishing, leading to a vanishing coherent contribution as summarized by the equations (Eion–ion(0) represents the electrostatic field from ions on a central ion). For the water response, the second-order hyperpolarizability of water is non-zero, as is the electrostatic field from the surroundings, ensuring that both are sources of coherent SH light, as summarized by the right equations (Eion–H2O(0) represents the electrostatic field from ions on water molecules). These responses correspond to changes in the structural orientational correlations in the solution and can only be probed in the PPP and PSS polarization combinations. The inset illustrates two correlated water molecules connected by a H-bond. The black arrows represent two directions along which the H-bond can be broken (via bending or stretching). Within this decomposition, fs-ESHS is only sensitive to the bending motion of the H-bond.39 | ||
Materials and methods
Sample preparation
MgCl2 (99.99%, Sigma-Aldrich), CaCl2 (99.99%, Sigma-Aldrich), SrCl2 (99.99%, Sigma-Aldrich), LiCl (99.999%, Sigma-Aldrich), NaCl (99.999%, Acros), NH4Cl (99.9995%, Fluka), RbCl (99.95%, Sigma-Aldrich), CsCl (99.9995%, Fluka), and KCl (99.999%, Acros) were used as received without further purification. All samples were prepared by dissolving the electrolytes in degassed ultra-pure water (18.2 MΩ cm, Millipore, Inc.) to obtain a 5 ml stock solution at a high concentration by using a 5 ± 0.025 ml volumetric flask (Duran) at room temperature. The stock solutions were filtered (0.1 μm PVDF membrane filters, Millex-VV, Millipore) and then diluted to the desired concentration. The relative error in the reported electrolyte concentrations is 0.5%.Femtosecond elastic second harmonic scattering (fs-ESHS)
190 fs laser pulses centered at 1028 nm with a repetition rate of 200 kHz were used to probe the samples. The input pulses were linearly polarized using a Glan-Taylor polarizer (GT10-B, Thorlabs) and a zero-order half-wave plate (WPH05M-1030), and were cleaned using a longpass filter (FEL0750, Thorlabs). The cleaned laser pulses were then focused into a cylindrical glass sample cell (4.2 mm inner diameter) using a plano-convex lens (f = 75 mm, LA1608-B, Thorlabs). The focused laser pulses had a beam waist of ∼35 μm diameter and a Rayleigh length of ∼0.94 mm. The pulse energy at the sample was 0.3 μJ (incident laser power P = 60 mW). The generated fs-ESHS light was filtered using a bandpass filter (ET525/50m, Chroma) and was collected at a scattering angle of 90° using a gated photomultiplier tube (PMT, H7421-40, Hamamatsu). The polarization of the collected fs-ESHS light was analyzed using a Glan-Taylor polarizer (GT10-A, Thorlabs). The acceptance angle for collecting the fs-ESHS light was set to 11.4° and each data point was acquired with an acquisition time of 50 × 1 s (50 × 2 × 105 pulses) and a gate width of 10 ns. The fs-ESHS intensity of pure H2O was measured between every two samples and was used to monitor and correct for laser fluctuations. All liquid samples were stored and measured in sealed glass sample cells at room temperature (T = 297 K). The reproducibility of fs-ESHS measurements of electrolyte solutions was 1–3%. More details of the fs-ESHS experiment system can be found in ref. 39 and 46.Fits to the fs-ESHS data
The fs-ESHS data were fitted with a linear function:| y = kx + b | (3) |
 | (4) |
Molecular dynamics simulations
Polarizable molecular dynamics (MD) simulations were performed using the TINKER 7.1 package49 to calculate the electrostatic field E(0) on an ion. The Amoeba14 model50 was chosen for the water molecules, and the Amoeba ion parameters51 for the sodium and chloride ions. Cubic simulation boxes, with a side of 5 nm, were prepared by combining ∼4000 water molecules with randomly distributed pairs of ions, up to the concentration of 2 M. After initial equilibration of 100 ps, simulations were run for 500 ps, and snapshots of the instantaneous configurations of water and ions were saved for every 100 fs. During equilibration in the NPT ensemble, the velocity Verlet method was used with 1.0 fs integration time steps. The system temperature was kept at 298 K using an Andersen thermostat with a coupling time of 0.1 ps. The system pressure was kept at 1.0 atm using a Berendsen barostat with a coupling time of 2.0 ps. The particle mesh Ewald method52 was used to evaluate the long-range electrostatic interaction, and the real space cutoff for Ewald summation as well as for van der Waals interactions was set to 12.0 angstroms. The convergence threshold of 10−5 D was applied during calculation of self-consistent induced dipoles. During production runs in the NVT ensemble, Langevin dynamics with a velocity Verlet integrator was employed. The Langevin dynamics used a friction coefficient of 1.0 ps−1. The system pressure was kept at 1.0 atm using the Nosé–Hoover thermostat53 with a coupling time of 0.1 ps.Results and discussion
A. Theory: expected fs-ESHS response from electrolyte solutions
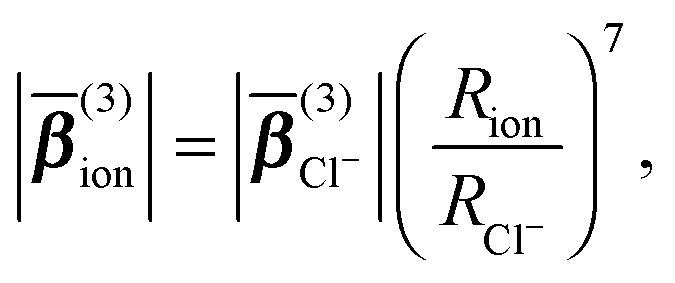
For an ionic solution, incoherent SH intensity from electronic anisotropy within individual water molecules or ions may be expected. We can also consider whether there are coherent contributions from structural orientational order between water molecules or ions to the fs-ESHS response. Both contributions are illustrated in Fig. 1B and C and will be considered below. In what follows we will first calculate the incoherent SH intensity from individual ions by using the results from a MD simulation in combination with a simple scaling law for β(3) (which is used for describing non-resonant nonlinear optical interactions).54 Single spherical ions with different radii will be considered. The incoherent SH intensity from water molecules will be discussed briefly as well. Then, we will focus on the expected coherent SH intensity from water molecules as induced by ions. To estimate this coherent SH intensity from electrolyte solutions we make use of a mean field DH model.39 In this DH model, the medium is considered as a dielectric continuum. It is also assumed that the statistical distribution of ions follows the linearized Boltzmann distribution. Water molecules are considered as a non-interacting gas of dipoles.The average magnitude of β(3) of the chloride ion was calculated previously using quantum chemistry calculations:55 . Knowing this value, we can compute β(3) for other spherical ions by using the following scaling law for non-resonant nonlinear optical processes:54
 | (5) |
Iion(2ω) ∝ c{(|![[small beta, Greek, macron]](https://www.rsc.org/images/entities/b_i_char_e0c3.gif) (3)cation||Ecation(0)|)2 + j(|(3)anion||Eanion(0)|)2}, (3)cation||Ecation(0)|)2 + j(|(3)anion||Eanion(0)|)2}, | (6) |
| Cations | Mg2+ | Ca2+ | Sr2+ | Li+ | Na+ | NH4+ | Rb+ | Cs+ | K+ | Cl− |
| R (nm) | 0.065 | 0.099 | 0.116 | 0.068 | 0.095 | 0.148 | 0.149 | 0.169 | 0.133 | 0.181 |
In contrast to spherical ions, the molecular hyperpolarizability is nonzero for dipolar water molecules  , which thus gives rise to the leading-order contribution to the incoherent SH emission. Values of β(2) of liquid water were obtained from an ab initio study by Gubskaya and Kusalik.58 The incoherent response is expected to contribute to all four accessible polarization states (PPP, PSS, SPP, and SSS). The three-letter code for the polarization state, from left to right, denotes the polarization state of each participating photon from high frequency to low frequency. P(S) represents the polarization direction of light parallel (perpendicular) to the XZ horizontal scattering plane in Fig. 1A.
 and
and  . Structural correlations or orientational order is represented by the second term in eqn (2). Ion-induced long-range changes in the orientational order of water molecules were recently observed in aqueous electrolyte solutions.39 This orientational order gives rise to an ion-induced coherent SH water signal in only two (PPP, PSS) of the four accessible polarization states (with collinear illumination). The orientational order that is probed in this way reports for a significant part on the breaking and formation of H-bonds.39 As illustrated in the inset of Fig. 1C, the motion of water molecules can be thought of as arising from bending and stretching motions of the H-bond. Coherent fs-ESHS probes orientational correlations and is therefore sensitive to bending of the H-bond, but not to stretching of the H-bond for which the orientational correlation between two water molecules does not change.
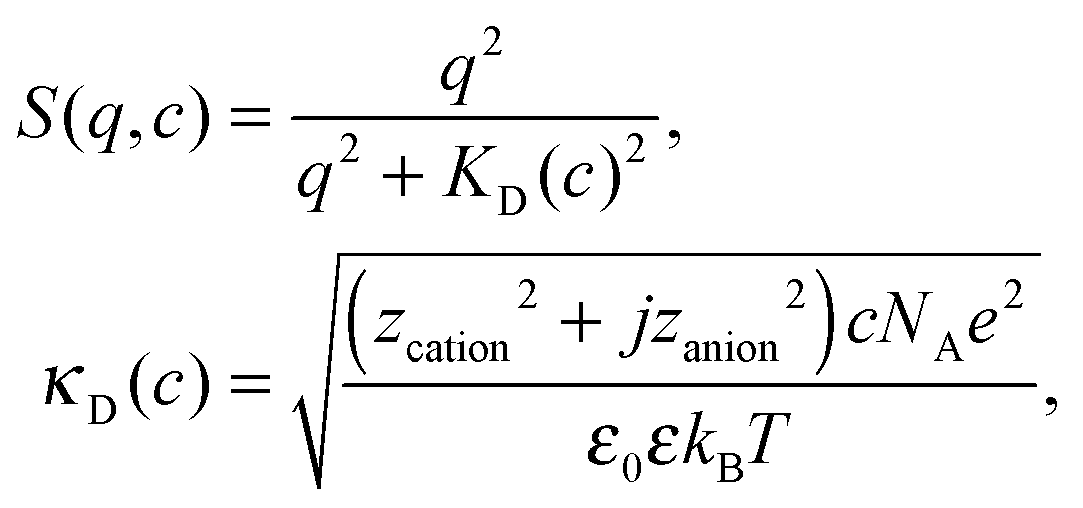
The orientational order of water can be qualitatively (not quantitatively) described by a DH model.39 The coherent fs-ESHS intensity is found to be related to the structure factor S(q,c) of a gas of water dipoles in contact with ions:39
| Icoh(2ω)J ∝ c|P(2)i–w(2ω)J|2S(q,c), | (7) |
 | (8) |
For the coherent PPP fs-ESHS intensity measured at a scattering angle θ of 90° the orientational distribution of water dipoles can be computed in terms of ion–dipole interactions and thermal fluctuations. Using the linearized Boltzmann distribution we find the second-order polarization that is induced in the water molecules:39,59
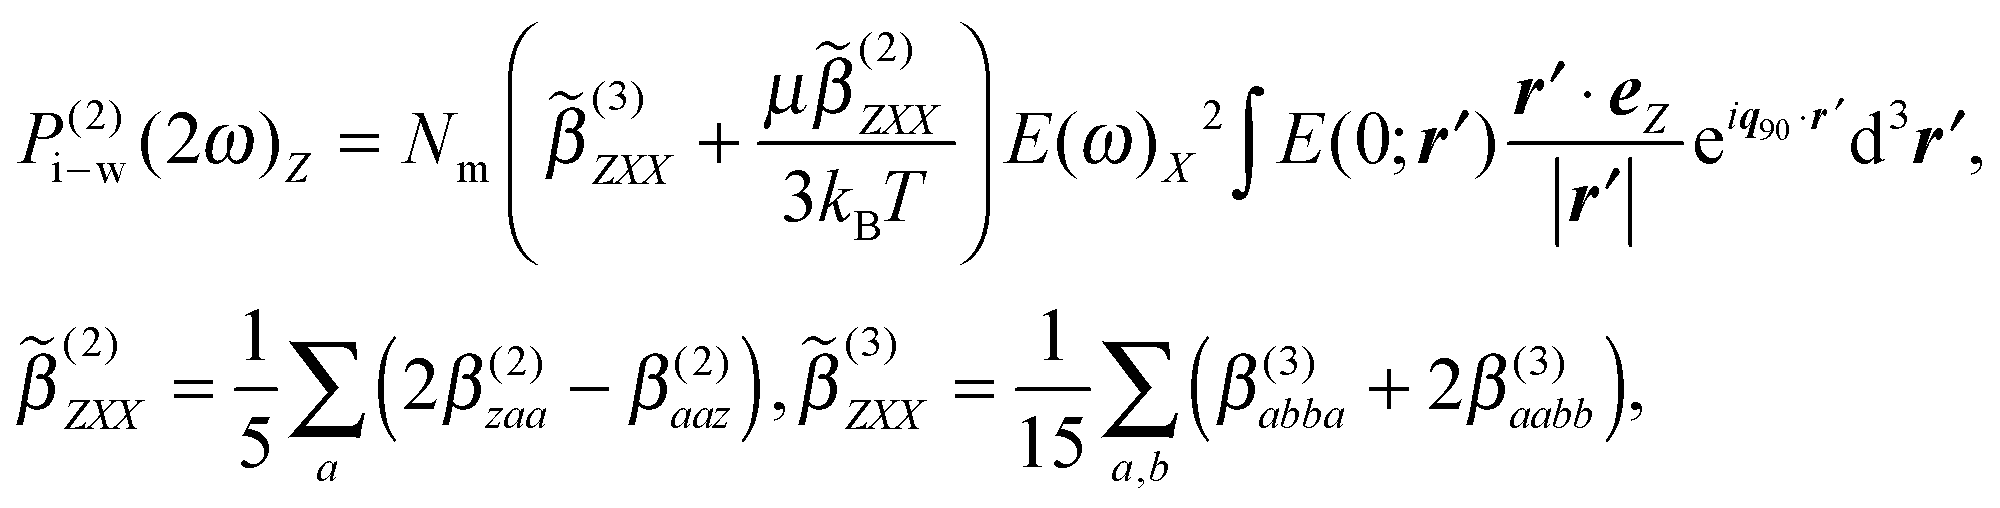 | (9) |
 . With E(0;r′) of a single ion given by the Coulomb equation, the integral
  , in which f(0) is the local field factor for the ionic electrostatic field. Note that the linearization of the Boltzmann distribution to obtain
  in eqn (9) is typically valid for ion–dipole distances exceeding 1 nm, i.e. |r′| ≥ 1 nm, so that the single ion single dipole interaction energy is much weaker than the thermal energy kBT. As mentioned, in this calculation, water molecules are approximated as an ideal gas, for which water–water interactions are neglected. Using eqn (7)–(9), we compute the coherent SH response of water molecules in an electrolyte solution arising from the orientational correlations between water molecules induced by the total electrostatic field in solution originating from the ions. When there are no ions, there are thus no correlations between the water molecules.
(3)ion| ∝ R7, eqn (5)) and that the Cl− ion (R = 0.181 nm) is much bigger in size than any of the studied cations (0.065 nm < R < 0.169 nm, see Table 1). In addition, |Eanion(0)| is more than twice larger than |Ecation(0)|. The contribution from cations to Iion(2ω) is thus negligible. The difference between the divalent and monovalent series is caused by the different number of Cl− ions in solution; when the curves are corrected for the number difference in Cl− ions this difference vanishes.
in eqn (9) is typically valid for ion–dipole distances exceeding 1 nm, i.e. |r′| ≥ 1 nm, so that the single ion single dipole interaction energy is much weaker than the thermal energy kBT. As mentioned, in this calculation, water molecules are approximated as an ideal gas, for which water–water interactions are neglected. Using eqn (7)–(9), we compute the coherent SH response of water molecules in an electrolyte solution arising from the orientational correlations between water molecules induced by the total electrostatic field in solution originating from the ions. When there are no ions, there are thus no correlations between the water molecules.
(3)ion| ∝ R7, eqn (5)) and that the Cl− ion (R = 0.181 nm) is much bigger in size than any of the studied cations (0.065 nm < R < 0.169 nm, see Table 1). In addition, |Eanion(0)| is more than twice larger than |Ecation(0)|. The contribution from cations to Iion(2ω) is thus negligible. The difference between the divalent and monovalent series is caused by the different number of Cl− ions in solution; when the curves are corrected for the number difference in Cl− ions this difference vanishes.
 | ||
| Fig. 2 Computed SH intensities from electrolyte solutions. (A) The incoherent SH intensities from individual ions are calculated based on eqn (5) and (6) for a cationic series of chloride salts. All monovalent and divalent cations behave approximately in the same way so that the curves overlap. (B) The coherent SH intensities of electrolyte solutions are calculated based on the DH theory (eqn (5)–(7)) for monovalent and divalent cations. There is no ion specificity in the calculated SH intensity. | ||
The coherent concentration dependent response for bulk water is shown in Fig. 2B. The intensity increases at a very low electrolyte concentration. As discussed previously,39 this increase is caused by the combined electric field of all the ions inducing orientational correlations between the water molecules (see also ref. 43). As was noted in ref. 39, the actual increase in orientational order is 6 times smaller and displays an isotope effect of a factor of ∼3. The reported difference in ref. 39 between the experimental data (which is also shown here in Fig. 3C but with a linear concentration scale) and the theoretical DH curve in the concentration range from 1 μM to 100 mM is probably caused by the fact that the DH model neglects H-bonding. For the present study we note that the DH model does not include any ion specificity, and the SH intensity remains constant up to 4 M.
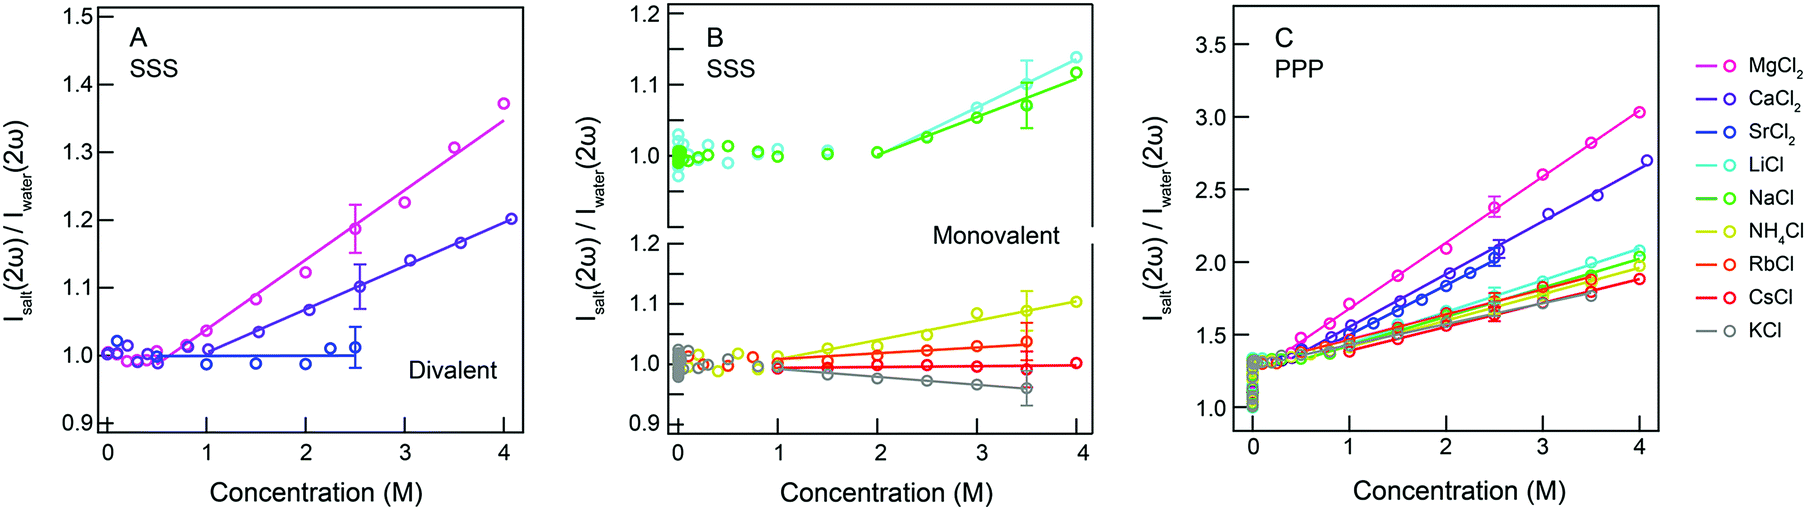 | ||
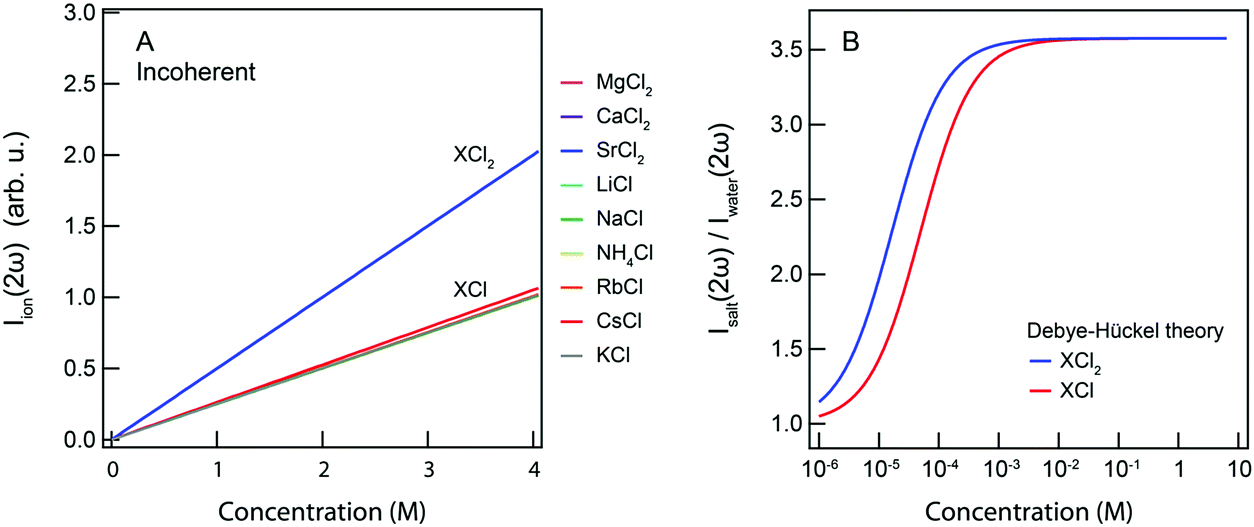
| Fig. 3 Measured fs-ESHS intensities of electrolyte solutions. The fs-ESHS intensities (Isalt(2ω)) of electrolyte solutions for the chloride salt series were measured in SSS (A and B) and PPP (C) polarization combinations. Isalt(2ω) is normalized by the intensity of pure water (Iwater(2ω)) measured in the same polarization combination. The solid lines represent a linear fit of the fs-ESHS intensity. Note that the computed y-scale in Fig. 2A cannot be compared to the measured y-scale in Fig. 3. | ||
B. Experiments: fs-ESHS from electrolyte solutions
The fs-ESHS intensities (Isalt(2ω)) from aqueous electrolyte solutions were measured in SSS (Fig. 3A and B) and PPP (Fig. 3C) polarization combinations at a scattering angle of θ = 90° for electrolyte concentrations up to 4 M (or approaching solubility limits for SrCl2, RbCl, and KCl). Fig. 3A and B present only incoherent responses and Fig. 3C presents both coherent and incoherent responses. The values for Isalt(2ω) are normalized by that of pure water (Iwater(2ω)) measured in the same polarization combination. In both cases the curves were fit with a linear function of the form:| Isalt(2ω)/Iwater(2ω) = kPPP(SSS)·c + b, | (10) |
As shown in Fig. 3A and B, the measured incoherent response differs from ion to ion, and kSSS changes from negative (K+) to almost zero (Cs+) and to positive (other cations). The linear increase is observed to start at c > 0.8 M (Mg2+) or higher concentrations (c > 2 M, Na+ and Li+). The obtained fit values are given in Table 2. Comparing Fig. 2A to Fig. 3A and B, we observe differences between the computation and the measurement: the presence of ion specificity is not predicted by the theory nor is the large onset concentration of the intensity increase in Fig. 3A and B. Instead of incoherent single ion contributions that mainly arise from Cl− anions there must be another effect that dominates the SSS fs-ESHS intensity. As we have seen in eqn (2) the incoherent response of water is another source of fs-ESHS intensity. This response, which depends on the electronic structure of water, can possibly be influenced by ions in highly concentrated electrolyte solutions.28,29,60,61 The measured intensity changes start to appear at ion![[thin space (1/6-em)]](https://www.rsc.org/images/entities/char_2009.gif) :water ratios of about 1:14 (NaCl) or 1:23 (MgCl2). At such concentrations ion-induced changes in the electronic structure of the hydration shells may be playing a role that could comprise charge transfer effects or ion pairing. Within this explanation, a decreasing intensity then implies that K+ ions reduce the electronic anisotropy to a more spherical distribution of electron density, whereas an increase in intensity increases the amount of electronic anisotropy in the hydration shells. Cs+ and Sr2+ do not or hardly influence the response of water, which means that the electronic structure of the closely associated water molecules is not different from that of bulk water. MgCl2 and CaCl2 do influence the electronic anisotropy in the neighboring water molecules, with Mg2+ having a bigger influence than Ca2+. This is expected because of the double valency and smaller size of Mg2+ compared to Ca2+. For the ions Li+, Na+, NH4+, Rb+, and Cs+ the amount of distortion is governed by the size of the ion.62,63 Why K+ has an opposite effect on the electronic structure of water cannot be explained by the size and charge difference with respect to the other ions. In fact, in order to reduce the electronic anisotropy of the first hydration shell, the lone pair electron of the oxygen of water needs to shift towards the hydrogens of the same hydrating water molecule. The distribution of the lone pair electrons of the oxygen of water highly depends on the local environment, which can be changed by water H-bonding or the presence of ions, as indicated by previous oxygen K-edge X-ray emission spectroscopy measurements on liquid water.64
:water ratios of about 1:14 (NaCl) or 1:23 (MgCl2). At such concentrations ion-induced changes in the electronic structure of the hydration shells may be playing a role that could comprise charge transfer effects or ion pairing. Within this explanation, a decreasing intensity then implies that K+ ions reduce the electronic anisotropy to a more spherical distribution of electron density, whereas an increase in intensity increases the amount of electronic anisotropy in the hydration shells. Cs+ and Sr2+ do not or hardly influence the response of water, which means that the electronic structure of the closely associated water molecules is not different from that of bulk water. MgCl2 and CaCl2 do influence the electronic anisotropy in the neighboring water molecules, with Mg2+ having a bigger influence than Ca2+. This is expected because of the double valency and smaller size of Mg2+ compared to Ca2+. For the ions Li+, Na+, NH4+, Rb+, and Cs+ the amount of distortion is governed by the size of the ion.62,63 Why K+ has an opposite effect on the electronic structure of water cannot be explained by the size and charge difference with respect to the other ions. In fact, in order to reduce the electronic anisotropy of the first hydration shell, the lone pair electron of the oxygen of water needs to shift towards the hydrogens of the same hydrating water molecule. The distribution of the lone pair electrons of the oxygen of water highly depends on the local environment, which can be changed by water H-bonding or the presence of ions, as indicated by previous oxygen K-edge X-ray emission spectroscopy measurements on liquid water.64
| Cation series | MgCl2 | CaCl2 | SrCl2 | LiCl | NaCl | NH4Cl | RbCl | CsCl | KCl | |
|---|---|---|---|---|---|---|---|---|---|---|
| k PPP (M−1) | 0.45 | 0.36 | 0.34 | 0.22 | 0.20 | 0.18 | 0.17 | 0.16 | 0.14 | |
| k SSS (M−1) | 0.111 | 0.064 | 0.001 | 0.068 | 0.054 | 0.035 | 0.020 | 0.001 | −0.013 | |
| Onset (M) | PPP | 0.21 | 0.36 | 0.49 | 0.42 | 0.47 | 0.47 | 0.15 | 0.59 | 0.15 |
| SSS | 0.79 | 0.94 | — | 2.00 | 1.99 | 0.75 | 1.12 | — | — | |
Turning now to the combined coherent and incoherent contributions (Fig. 3C), we observe that in the PPP polarization combination the fs-ESHS intensities show the same type of behavior: The fs-ESHS intensity increases linearly with electrolyte concentration. There are, however, two notable differences: Fig. 3C displays an increase of a larger magnitude (from 1.3 to 3 instead of from 1 to 1.3 for MgCl2) as well as an onset concentration that is up to a factor of 5 lower, bringing the ion:water ratios to hundreds of water molecules per ion. It is unlikely that at such low concentrations ions already induce a significant perturbation in the distribution of electronic charges of the hydration shell which is necessary to change β(2).17 For such low onset concentrations, and to generate a bigger change in the PPP fs-ESHS intensity, ion-induced structural correlations between water molecules are needed.
As reported recently,39 such ion-induced orientational correlations or orientational order are present in electrolyte solutions and can be observed with fs-ESHS in the PPP polarization combination for ionic strengths as low as 10 μM. These correlations occur as a weak response of the H-bond network of water to the electric field of the ions and lead to an increasing relative fs-ESHS intensity up to ∼1.3. The same response was observed for 21 different electrolytes.39Fig. 3C shows that for increasing salt concentrations the normalized intensities start to diverge, which may be a consequence of the hydration shells becoming smaller and being influenced by the charge, electronic structure, and size of the ions. It can be seen in Fig. 3C that all the slopes are positive and that kPPP follows the order: K+ < Cs+ < Rb+ < NH4+ < Na+ < Li+ < Sr2+ < Ca2+ < Mg2+, which resembles a direct cationic Hofmeister series (with K+ and NH4+ as exceptions).3,65 The exception of NH4+ is likely due to its H-bonding with water molecules, which induces changes in the orientational order of hydrating water molecules. A possible reason for the special behavior of K+ might be that the water network becomes more disordered and the hydration shell becomes looser, as indicated by the larger ion–water oxygen distance than the oxygen–oxygen distance as well as the large ion-hydrogen distance measured by neutron diffraction.16,66 It can be seen that small divalent ions have the biggest influence on kPPP and thus the most restricting influences on the rotational motion (or H-bond bending mode) of water molecules. In contrast, larger monovalent ions have a smaller influence on restricting the H-bond bending mode and lead to a lesser increase in the orientational order of water as represented by the PPP fs-ESHS intensity.
Fig. 2B shows the computed coherent relative SH intensity based on the DH theory. This curve reflects ion-induced orientational order in a dipolar gas of water molecules. This model does not describe the experimental data well. It can be seen that the DH model fails to capture the observed ion specificity. It does, however, show the extent over which ions could influence the orientational order of water if all water–water interactions would be turned off. As can be seen, at 4 M, the MgCl2 curve reaches a relative intensity of Isalt(2ω)/Iwater(2ω) = 3, which is close to the limiting value of the DH theory, namely ∼3.5 (assuming the values for β(2) reported by Gubskaya and Kusalik58). This suggests that, at such high salt concentrations, the Mg2+–water interactions strongly contribute to the orientational order of water molecules. In previous X-ray Raman and small angle X-ray scattering studies by Nilsson and coworkers,18 Mg2+ has also been shown to have strong interactions with water molecules and form tightly bound hydration shells.
As we have seen previously, ion-induced changes to the orientational order of water lead to changes in the free energy of the H-bond network of bulk water at electrolyte concentrations below 100 mM.39 We might expect similar changes, showing ion specificity, to occur as well in the macroscopic properties of bulk water that are sensitive to water–water interactions, at electrolyte concentrations higher than 100 mM. Two of the most well-known candidates are the viscosity of electrolyte solutions and the Gibbs free energy change of hydration of electrolytes, both bulk properties that display ion specificity.7,8,11,67,68
C. Macroscopic properties of aqueous solutions of electrolytes
| η/η0 = 1 + Ac1/2 + Bc, | (11) |
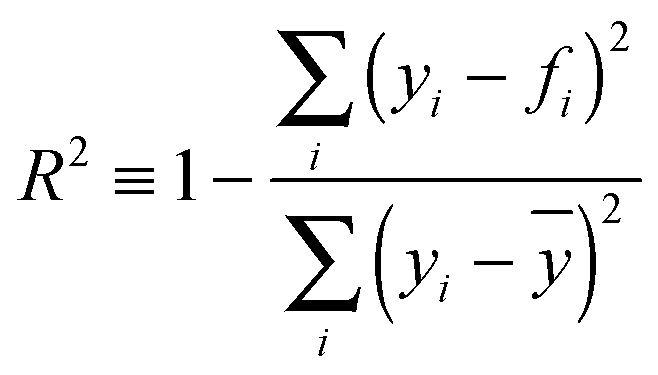
Ion-induced orientational order of water molecules can be understood as a restriction of the motion of water molecules. This restriction may influence the fluidity of the liquid and the motion of other objects in water and thus is related to changes in the viscosity. From Fig. 3C we observe that the onset electrolyte concentration of the linear increase of the PPP fs-ESHS intensity coincides with the concentration range where the B-coefficient starts to dominate (i.e. 0.05–0.1 M). As we have seen that the PPP fs-ESHS intensity is a measure of the ion-induced orientational order of water molecules, a correlation between the electrolyte-induced PPP fs-ESHS intensity increase and the viscosity B-coefficient may be expected. In Fig. 4A we correlate kPPP of the linear fit of the fs-ESHS intensity (Fig. 3C) with literature values7 of the viscosity B-coefficient for different electrolytes. The viscosity values are reproduced in Table 3 for completeness. The quality of the correlation is indicated by R2, the coefficient of determination. A perfect correlation is achieved with R2 = 1.48 It can be seen that there exists a very good correlation (R2 = 0.97) between the B-coefficient and kPPP. This correlation can be qualitatively explained by noting that viscosity is determined by the rate at which H-bonds are broken and formed, which is what the fs-ESHS experiment probes (as illustrated in Fig. 1C).
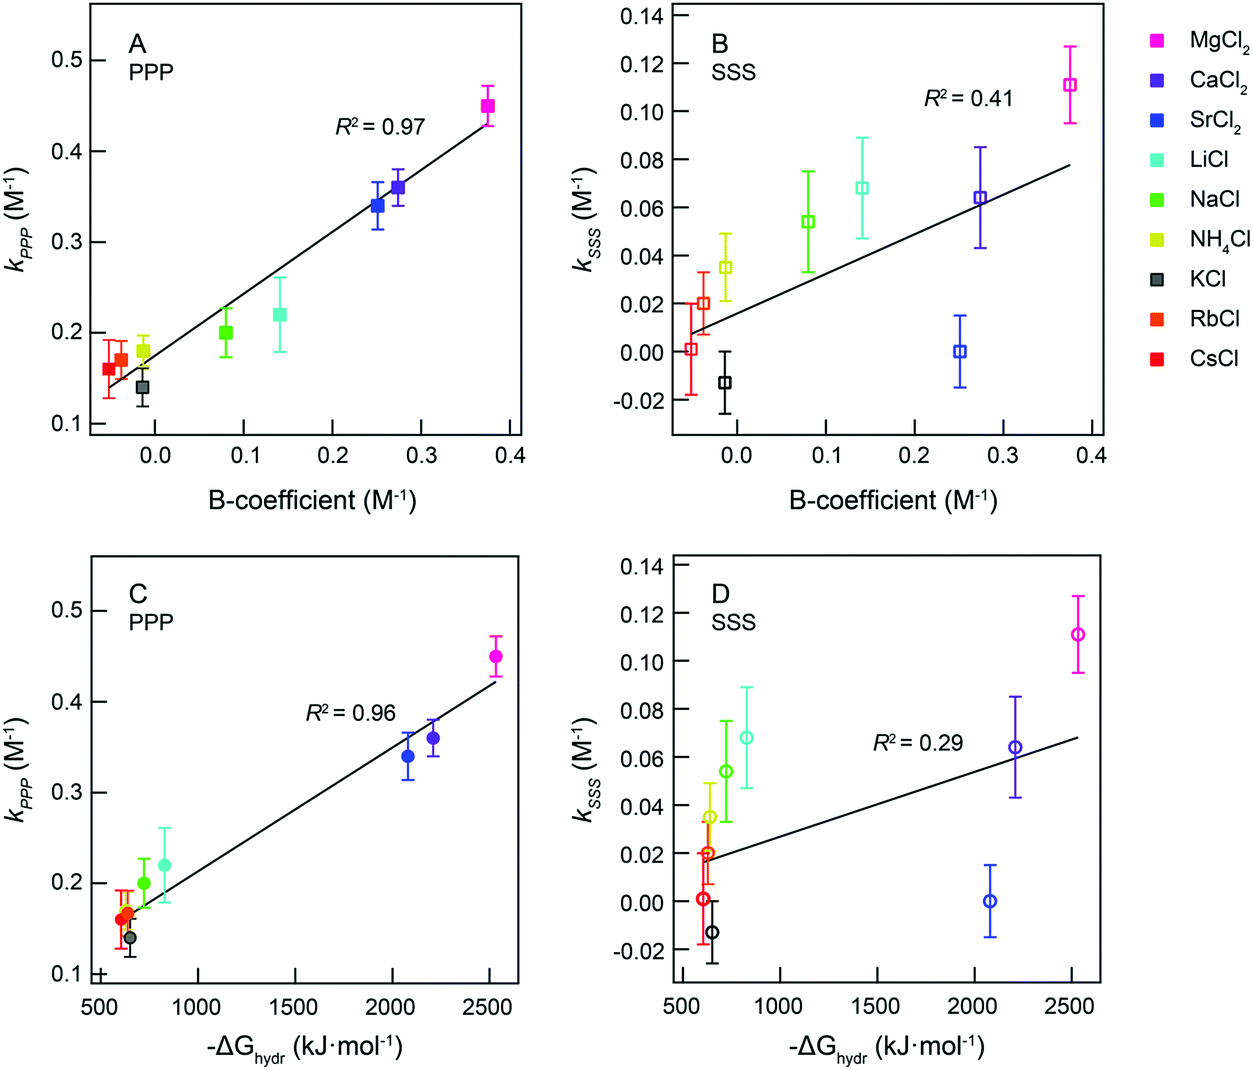 | ||
| Fig. 4 Correlation between fs-ESHS increase and viscosity and Gibbs free hydration energy. (A) kPPPvs. the viscosity B-coefficient for the monovalent and divalent cationic series of Fig. 3C. (B) kSSSvs. the viscosity B-coefficient for the monovalent and divalent cationic series in Fig. 3A and B. (C) kPPPvs. the Gibbs free energy change of hydration of electrolytes (−ΔGhydr) for the monovalent and divalent cationic series of Fig. 3C. (D) kSSSvs. −ΔGhydr for the monovalent and divalent cationic series in Fig. 3A and B. The error bar in k represents the 95% confidence interval of the linear fit of the fs-ESHS intensity to eqn (10). The values for the viscosity B-coefficient and hydration Gibbs free energy are taken from ref. 7 and 8, respectively. They are reproduced in Table 3. | ||
| Cation series | MgCl2 | CaCl2 | SrCl2 | LiCl | NaCl | NH4Cl | RbCl | CsCl | KCl |
|---|---|---|---|---|---|---|---|---|---|
| B-Coefficient (M−1) | 0.375 | 0.274 | 0.251 | 0.141 | 0.080 | −0.013 | −0.038 | −0.052 | −0.014 |
| −ΔGhydr (kJ mol−1) | 2532 | 2209 | 2080 | 828 | 722 | 639 | 628 | 605 | 651 |
In contrast, as can be seen in Fig. 4B, no clear correlation between kSSS and the viscosity B-coefficient can be observed (R2 = 0.41). The linear change of the SSS fs-ESHS intensity also starts at electrolyte concentrations much higher than 0.05 M (e.g. 2 M for LiCl). Thus the electronic structure changes in the hydrating water molecules are not correlated with the B-coefficient. This is not entirely unexpected: viscosity is a property that depends more on intermolecular interactions than on changes in the molecular electronic structure.56
The viscosity B-coefficient of electrolyte solutions dominates the influence of ions on the structure of water for electrolyte concentrations >0.05 M.7 A recent neutron diffraction study66 reasons that ion induced viscosity changes are not caused by changes in the H-bond network of water as the viscosity B-coefficient is correlated with the difference between the oxygen–oxygen distance in pure water and the ion–oxygen distance in an electrolyte solution. The experimental data supporting this argument are, however, incomplete since neutron diffraction is only sensitive to the first few hydration shells. Here, we observe a strong correlation between the viscosity B-coefficient and the ion-induced orientational order in water as measured by fs-ESHS, which reports on changes in hundreds of water molecules (i.e. the extended hydration shell). Qualitatively, this correlation can be understood since the ions pose a restriction to the degrees of freedom in the H-bond network. As the resistance of water to objects moving through it is determined by the breaking and formation of H-bonds it is clear that there can indeed be a connection. The viscosity of electrolyte solutions is thus highly related to the ion-induced distortions in the H-bond network of water.
In Fig. 4C and D, we correlate the rate of change in the fs-ESHS intensity (Fig. 3) – kPPP and kSSS – with literature values8 of −ΔGhydr, respectively. As Fig. 4C shows, a strong correlation exists between ΔGhydr and kPPP for the cation series of chloride salts, with R2 = 0.96. Cations, that induce larger orientational order in the water network, characterized by a larger kPPP, are correlated with a larger value of −ΔGhydr. This means that ions, which constrain more water molecules, generate a bigger (negative) increase in the free energy of hydration. Mg2+ interacts with more water molecules than Cs+, which is energetically more favorable. As such, smaller ions with larger valencies induce larger structural changes in the water network that lead to a larger reduction in the Gibbs free energy of the water network for the ion hydration. ΔGhydr is thus highly related to the ion-induced distortions in the H-bond network of water. In contrast, there is no clear correlation (R2 = 0.29) between kSSS and −ΔGhydr, as shown in Fig. 4D. The ion-induced electronic changes, in the hydrating water molecules, are not correlated with the change in the total free energy of the solution. We can explain the correlation by noting that, ΔGhydr mainly results from the ion–water and water–water interactions related to the orientational order of water molecules.
Thus, we find that the viscosity B-coefficient, −ΔGhydr, and kPPP increase in magnitude following a direct cation Hofmeister series.3,65 It is also evident that for these three observable changes in the H-bond network play an important role. Recent MD simulations performed by Thomas and Elcock32 show that the influence of ions on the relative number of H-bonds per water molecule in electrolyte solutions is ion specific and follows a direct Hofmeister series. Connecting both aspects there is a qualitative explanation for the observed correlations. What the exact molecular mechanism is for the observed increase in the fs-ESHS response and what the exact mechanism is behind the correlation observed in Fig. 4 need to be investigated in more detail. In addition, more sophisticated atomistic simulations that calculate the electronic anisotropy as well as the induced orientational order will be useful. Then, with such models both the fs-ESHS response and the viscosity need to be computed with various degrees of precision (and length/time scales).
Conclusions
We have probed ion-induced electronic and structural changes in water, for a cation series of chloride salts using fs-ESHS. For both the incoherent and coherent responses specific ion effects are observed above concentrations of ∼1 M and ∼0.1 M, respectively. Comparing the changes in the molecular electronic anisotropy (incoherent response), as measured with fs-ESHS in the SSS polarization combination to theoretical considerations, we conclude that the spherical cations themselves do not significantly contribute to the measured fs-ESHS response.As described in the theoretical description, an ion specific SSS response is rather originating from ion-induced changes in the electronic structure of water molecules adjacent to the ion. Positive changes as much as 37% (Mg2+, 4 M) and negative changes of – 4% (K+, 3.5 M) indicate the extent of the impact of the ions on the electronic structure of hydrating water molecules. The increased responses are stronger for smaller ions with larger valencies. The K+-induced reduction in the fs-ESHS response is, however, anomalous. It means that K+ reduces the overall electronic anisotropy of water, for example via a redistribution of charge in an H-bonding event. The difference in hydration between K+ and Na+ is particularly interesting in light of the unusual sensitivity of ion channels to either one of the species,35,36 and our experimental data might prove to be useful in elucidating the molecular cause of the functional difference.
The coherent PPP fs-ESHS response reports mainly on ion-induced changes in the structural orientational order of water in the extended hydration shells of the ions. Specific effects are observed that follow a Hofmeister trend. Here smaller ions lead to a larger increase in the fs-ESHS response, and the increasing valency also results in higher fs-ESHS intensity. The measured trend shows how cations restrict the orientational freedom of water, which is more effectively achieved for smaller ions with larger charges. A comparison to Debye-Hückel theory, which predicts the SH response for ions interacting with a dipolar gas of uncorrelated water molecules, suggests that Mg2+–water interactions, at a Mg2+ concentration of 4 M, strongly contribute to the orientational order of water molecules.
That such a reduction in the orientational freedom of water molecules might also influence macroscopic properties of bulk water was tested by examining correlations of the probed change in orientational order with the viscosity B-coefficient and the Gibbs free energy change of hydration (ΔGhydr). Both the B-coefficient and ΔGhydr are correlated well with the linear increase in the PPP fs-ESHS response. These observations show a possible connection between these three observables. This is exciting because the first two observables report on ion–water interactions at a macroscopic scale and the last observable at a molecular scale. A connection between these properties with the aid of more advanced theory than what is used here would undoubtedly further our understanding of the hydration of ions. This connection would also make it possible to connect the molecular and macroscopic properties of water with atomistic details. Given the omnipresent role that ions and water play in physics, chemistry, biology, and medicine this study is relevant for a wide variety of phenomena. The observed specific cation effects in both the electronic structure as well as the orientational ordering of water molecules provide us with a handle to understand and verify models aimed at understanding specific ion effects in water at both the molecular and macroscopic levels.
Conflicts of interest
There are no conflicts to declare.Acknowledgements
This work was supported by the Julia Jacobi Foundation, the Swiss National Science Foundation (grant number 200021_140472), and the European Research Council (grant number 616305).References
- P. Lo Nostro and B. W. Ninham, Chem. Rev., 2012, 112, 2286–2322 CrossRef CAS PubMed.
- K. Collins, Methods, 2004, 34, 300–311 CrossRef CAS PubMed.
- W. Kunz, Specific Ion Effects, World Scientific Publishing Company, 2010 Search PubMed.
- P. Jungwirth and D. J. Tobias, Chem. Rev., 2006, 106, 1259–1281 CrossRef CAS PubMed.
- V. S. J. Craig, Curr. Opin. Colloid Interface Sci., 2004, 9, 178–184 CrossRef CAS.
- H. I. Okur, J. Hladílková, K. B. Rembert, Y. Cho, J. Heyda, J. Dzubiella, P. S. Cremer and P. Jungwirth, J. Phys. Chem. B, 2017, 121, 1997–2014 CrossRef CAS PubMed.
- H. D. B. Jenkins and Y. Marcus, Chem. Rev., 1995, 95, 2695–2724 CrossRef CAS.
- Y. Marcus, Ion properties, Marcel Dekker, New York, 1997 Search PubMed.
- W. Kunz, P. Lo Nostro and B. W. Ninham, Curr. Opin. Colloid Interface Sci., 2004, 9, 1–18 CrossRef CAS.
- H. Ohtaki and T. Radnai, Chem. Rev., 1993, 93, 1157–1204 CrossRef CAS.
- P. Hünenberger and M. Reif, Single-Ion Solvation: Experimental and Theoretical Approaches to Elusive Thermodynamic Quantities, Royal Society of Chemistry, 2011 Search PubMed.
- H. J. Bakker, Chem. Rev., 2008, 108, 1456–1473 CrossRef CAS PubMed.
- R. Mancinelli, A. Botti, F. Bruni, M. A. Ricci and A. K. Soper, Phys. Chem. Chem. Phys., 2007, 9, 2959–2967 RSC.
- I. Howell and G. W. Neilson, J. Phys.: Condens. Matter, 1996, 8, 4455–4463 CrossRef CAS.
- S. Bouazizi, S. Nasr, N. Jaîdane and M.-C. Bellissent-Funel, J. Phys. Chem. B, 2006, 110, 23515–23523 CrossRef CAS PubMed.
- S. Ansell, A. C. Barnes, P. E. Mason, G. W. Neilson and S. Ramos, Biophys. Chem., 2006, 124, 171–179 CrossRef CAS PubMed.
- I. Waluyo, D. Nordlund, U. Bergmann, D. Schlesinger, L. G. M. Pettersson and A. Nilsson, J. Chem. Phys., 2014, 140, 244506 CrossRef PubMed.
- I. Waluyo, C. Huang, D. Nordlund, U. Bergmann, T. M. Weiss, L. G. M. Pettersson and A. Nilsson, J. Chem. Phys., 2011, 134, 064513 CrossRef PubMed.
- J. D. Smith, R. J. Saykally and P. L. Geissler, J. Am. Chem. Soc., 2007, 129, 13847–13856 CrossRef CAS PubMed.
- Q. Sun, Vib. Spectrosc., 2012, 62, 110–114 CrossRef CAS.
- K. J. Tielrooij, N. Garcia-Araez, M. Bonn and H. J. Bakker, Science, 2010, 328, 1006–1009 CrossRef CAS PubMed.
- I. A. Heisler and S. R. Meech, Science, 2010, 327, 857–860 CrossRef CAS PubMed.
- S. Funkner, G. Niehues, D. A. Schmidt, M. Heyden, G. Schwaab, K. M. Callahan, D. J. Tobias and M. Havenith, J. Am. Chem. Soc., 2012, 134, 1030–1035 CrossRef CAS PubMed.
- A. W. Omta, M. F. Kropman, S. Woutersen and H. J. Bakker, Science, 2003, 301, 347–349 CrossRef CAS PubMed.
- J. S. Prell, J. T. O'Brien and E. R. Williams, J. Am. Chem. Soc., 2011, 133, 4810–4818 CrossRef CAS PubMed.
- J. T. O'Brien and E. R. Williams, J. Am. Chem. Soc., 2012, 134, 10228–10236 CrossRef PubMed.
- R. Buchner and G. Hefter, Phys. Chem. Chem. Phys., 2009, 11, 8984 RSC.
- N. Ottosson, G. Öhrwall and O. Björneholm, Chem. Phys. Lett., 2012, 543, 1–11 CrossRef CAS.
- N. Ottosson, M. Odelius, D. Spångberg, W. Pokapanich, M. Svanqvist, G. Öhrwall, B. Winter and O. Björneholm, J. Am. Chem. Soc., 2011, 133, 13489–13495 CrossRef CAS PubMed.
- G. Stirnemann, E. Wernersson, P. Jungwirth and D. Laage, J. Am. Chem. Soc., 2013, 135, 11824–11831 CrossRef CAS PubMed.
- Y. Marcus, Chem. Rev., 2009, 109, 1346–1370 CrossRef CAS PubMed.
- A. S. Thomas and A. H. Elcock, J. Am. Chem. Soc., 2007, 129, 14887–14898 CrossRef CAS PubMed.
- M. Carrillo-Tripp, H. Saint-Martin and I. n. Ortega-Blake, J. Chem. Phys., 2003, 118, 7062 CrossRef CAS.
- Y. J. Zhang and P. S. Cremer, Annu. Rev. Phys. Chem., 2010, 61, 63–83 CrossRef CAS PubMed.
- Y. Zhou, J. H. Morais-Cabral, A. Kaufman and R. MacKinnon, Nature, 2001, 414, 43–48 CrossRef CAS PubMed.
- S. Varma and S. B. Rempe, Biophys. J., 2007, 93, 1093–1099 CrossRef CAS PubMed.
- K. D. Collins, Biophys. Chem., 2006, 119, 271–281 CrossRef CAS PubMed.
- S. J. Irudayam and R. H. Henchman, J. Chem. Phys., 2012, 137, 034508 CrossRef PubMed.
- Y. Chen, H. I. Okur, N. Gomopoulos, C. Macias-Romero, P. S. Cremer, P. B. Petersen, G. Tocci, D. M. Wilkins, C. Liang, M. Ceriotti and S. Roke, Sci. Adv., 2016, 2, e1501891 Search PubMed.
- U. Baul, J. M. P. Kanth, R. Anishetty and S. Vemparala, J. Chem. Phys., 2016, 144, 104502 CrossRef PubMed.
- A. P. Gaiduk and G. Galli, J. Phys. Chem. Lett., 2017, 8, 1496–1502 CrossRef CAS PubMed.
- H. I. Okur, Y. Chen, D. M. Wilkins and S. Roke, Chem. Phys. Lett., 2017, 684, 433–442 CrossRef CAS.
- D. M. Wilkins, D. E. Manolopoulos, S. Roke and M. Ceriotti, J. Chem. Phys., 2017, 146, 181103 CrossRef.
- R. Bersohn, Y. H. Pao and H. L. Frisch, J. Chem. Phys., 1966, 45, 3184 CrossRef CAS.
- S. Roke and G. Gonella, Annu. Rev. Phys. Chem., 2012, 63, 353–378 CrossRef CAS PubMed.
- N. Gomopoulos, C. Lutgebaucks, Q. Sun, C. Macias-Romero and S. Roke, Opt. Express, 2013, 21, 815–821 CrossRef CAS PubMed.
- G. H. Golub and C. F. Van Loan, Matrix Computations, Johns Hopkins University Press, 3rd edn, 1996 Search PubMed.
- N. R. Draper and H. Smith, Applied Regression Analysis, Wiley, 1998 Search PubMed.
- J. W. Ponder, TINKER: Software Tools for Molecular Design, version 7.0, accessed May 20, 2017, http://dasher.wustl.edu/tinker/ Search PubMed.
- M. L. Laury, L.-P. Wang, V. S. Pande, T. Head-Gordon and J. W. Ponder, J. Phys. Chem. B, 2015, 119, 9423–9437 CrossRef CAS PubMed.
- A. Grossfield, P. Ren and J. W. Ponder, J. Am. Chem. Soc., 2003, 125, 15671–15682 CrossRef CAS PubMed.
- T. Darden, D. York and L. Pedersen, J. Chem. Phys., 1993, 98, 10089 CrossRef CAS.
- G. J. Martyna, M. E. Tuckerman, D. J. Tobias and M. L. Klein, Mol. Phys., 1996, 87, 1117–1157 CrossRef CAS.
- R. W. Boyd, Nonlinear Opt., Academic Press, New York, 2008 Search PubMed.
- V. Kello, B. O. Roos and A. J. Sadlej, Theor. Chim. Acta, 1988, 74, 185–194 CrossRef CAS.
- P. Atkins and J. de Paula, Atkins Physical Chemistry, Oxford University Press, 2010 Search PubMed.
- J. N. Israelachvili, Intermolecular and Surface Forces, Academic Press, 2010 Search PubMed.
- A. V. Gubskaya and P. G. Kusalik, Mol. Phys., 2001, 99, 1107–1120 CrossRef CAS.
- D. P. Shelton and J. E. Rice, Chem. Rev., 1994, 94, 3–29 CrossRef CAS.
- D. Feller, E. D. Glendening, D. E. Woon and M. W. Feyereisen, J. Chem. Phys., 1995, 103, 3526 CrossRef CAS.
- M. D. Baer and C. J. Mundy, Faraday Discuss., 2013, 160, 89–101 RSC.
- M. Dal Peraro, S. Raugei, P. Carloni and M. L. Klein, ChemPhysChem, 2005, 6, 1715–1718 CrossRef CAS PubMed.
- M. Soniat and S. W. Rick, J. Chem. Phys., 2012, 137, 044511 CrossRef PubMed.
- T. Tokushima, Y. Harada, O. Takahashi, Y. Senba, H. Ohashi, L. G. M. Pettersson, A. Nilsson and S. Shin, Chem. Phys. Lett., 2008, 460, 387–400 CrossRef CAS.
- J. Traube, J. Phys. Chem., 1909, 14, 452–470 CrossRef.
- T. Corridoni, R. Mancinelli, M. A. Ricci and F. Bruni, J. Phys. Chem. B, 2011, 115, 14008–14013 CrossRef CAS PubMed.
- G. Jones and M. Dole, J. Am. Chem. Soc., 1929, 51, 2950–2964 CrossRef CAS.
- W. M. Cox and J. H. Wolfenden, Proc. R. Soc. A, 1934, 145, 475–488 CrossRef CAS.
- K. D. Collins, Biophys. J., 1997, 72, 65–76 CrossRef CAS PubMed.
| This journal is © the Owner Societies 2017 |