
 Open Access Article
 This Open Access Article is licensed under a
 Creative Commons Attribution 3.0 Unported Licence
Lysine-based amino-functionalized lipids for gene transfection: the protonation state in monolayers at the air–liquid interface†
Stephanie
Tassler
a,
Christian
Wölk
b,
Christopher
Janich
b,
Bodo
Dobner
b and
Gerald
Brezesinski
 *a
*a
aMax Planck Institute of Colloids and Interfaces, Science Park Potsdam-Golm, Am Mühlenberg 1, 14476 Potsdam, Germany. E-mail: brezesinski@mpikg.mpg.de
bMartin-Luther-University (MLU) Halle-Wittenberg, Institute of Pharmacy, Wolfgang-Langenbeck-Straße 4, 06120 Halle (Saale), Germany
First published on 11th July 2017
Abstract
Cationic lipids are considered as non-viral carriers for genetic material used in gene therapy. They have no carcinogenic potential and cause low immune response compared to existing viral systems. The protonation degree of these cationic lipids is a crucial parameter for the binding behavior of polynucleotides (e.g., DNA). Newly synthesized peptide-mimic lysine-based amino-functionalized lipids have been investigated in 2D models as monolayers at the air–liquid interface. Standard surface pressure – area isotherms have been measured to prove the layer stability. Total reflection X-ray fluorescence (TRXF) has been used as a surface sensitive analytical method to estimate the amount of counterions at the head groups. Using a standard sample as a reference, the protonation degree of these cationic lipids can be quantified on buffers with different pH values. It is found that the protonation degree depends linearly on the packing density of the lipid monolayer.
1. Introduction
After the introduction of human gene therapy1 in 1972 and the first successful lipid mediated transfection2 in 1987, this concept is considered as one of the most promising tools to heal monogenic diseases like cystic fibrosis and sickle-cell anemia.3 Also, AIDS, cardiovascular disorders and neurological diseases like Parkinson's disease and Alzheimer's disease are a matter of particular interest. Most of all, cancer is a highly addressed subject in this field.4–6 Gene therapy requires the insertion of genetic material or the replacement of defective genes by healthy ones – the so-called gene transfection.7Since it is impossible for pure DNA, a polyanionic macromolecule which is degraded by extracellular and intracellular enzymes, to penetrate the cell membrane, specific carriers are required to overcome cellular barriers and efficiently deliver extracellular gene material into eukaryotic cells and release the DNA into the cell nucleus. Furthermore, the carrier systems have a protective effect against enzymatic degradation. Viruses are natural nucleic acid carriers which overcome cellular barriers and protect the genetic cargo by encapsulation with proteins and lipids. Despite the high transfection efficiency of viral systems, toxicity to the human body and the creation of immune responses are big drawbacks. An alternative approach is the lipid mediated non-viral gene transfer.8,9 Thereby, a complex of cationic lipids, neutral helper lipids and DNA – a so-called lipoplex10,11 – is used. The lipoplex should be positively charged to interact with the negatively charged cell membrane2,12,13 for endocytosis and be stable enough to escape from the endosome into the cell before its fusion with lysosomes and lysis by enzymes. On the other hand, the DNA needs to be released from the carrier, preferentially close to the cell nucleus. So, the complex should not be too stable.
Up to now, there is no ‘master recipe’ to design the ultimate lipoplex. The transfection efficiency depends on the lipoplex properties, for instance charge (in particular, the N/P ratio, cationic lipid – helper lipid ratio), the lipoplex structure14,15 and pH sensitivity,16,17 as well as on the environment (cell type, ionic strength, temperature, and pH value).
There are some common conceptions18 about basic structural properties. All these parameters predict the complex stability and the pathways19 of the lipoplex. In this work, Langmuir monolayers20–22 at the air–liquid interface have been used as model systems to determine the protonation degree of new transfection lipids, which is a crucial parameter for determining the binding efficiency of DNA. For this purpose, eight different cationic lipids were selected (Fig. 1), which are modified in their head group and alkyl chain structures. To demonstrate that the protonation degree is tightly linked to the packing density, lipids with different molecular area requirements due to their structural properties (head group size, number of charged groups, and chain pattern) have been used. Lipids with the same head group structure but different chain patters (introduction of double bonds for increasing fluidity) and lipids with the same chain pattern but different head groups (increasing charge and size) were investigated. The occupied area per molecule increases with chain fluidity and increasing head group size. As has been already proved, total reflection X-ray fluorescence (TRXF) is a brilliant method to estimate the protonation rates of cationic lipids23 and to quantify DNA binding to a lipid monolayer at the air–liquid-interface.24 Also, the coordination affinities of amyloidogenic peptides at the hydrophobic–hydrophilic interface in presence of Cu2+ and Zn2+ in the subphase have been studied by TRXF.25
 | ||
| Fig. 1 Chemical formulas of the novel peptide-mimic lysine-based amino-functionalized lipids. | ||
2. Materials
For the experiments, 1 mM stock solutions of cationic lipids were prepared in chloroform![[thin space (1/6-em)]](https://www.rsc.org/images/entities/char_2009.gif) :methanol in a ratio of 8:2 (v:v) (CHCl3: J. T. Baker, Netherlands; stabilized with 0.75% of ethanol, CH3OH: Merck, Germany; purity >99.9%). For the quantification of the TRXF results, dioctadecyldimethylammonium bromide (DODAB), purchased from Fluka, was used as a reference. The chemicals for the buffer subphases were purchased from Sigma-Aldrich. In the pH range from 3 up to 10, 1,4-diazabicyclo(2,2,2)octane (pKa1 = 4.2, pKa2 = 8.2), 2-morpholinoethylamine (pKa1 = 4.8, pKa2 = 9.5), 1,3-bis(tris(hydroxymethyl)methylamino)propane (pKa1 = 6.8, pKa2 = 9.0) or piperazine (pKa1 = 5.7, pKa2 = 9.8) was used as the basic species. Because of the high fluorescence yield, Br− was used as the only anion to interact with the positively charged head group. Therefore, HBr was chosen as the acid species in a constant concentration of 2 mM. The subphase with pH 2.6 was obtained by using only water and HBr acid. Milli-Q Millipore water with a specific resistance of 18.2 MΩ cm was used for all measurements and sample preparations. The synthesis and the analytical data of the lipids TH10, TH14, TH4 and OH4 have been already described.26,27 The transfection lipids OO10, OO4, OH14 and OO14 were synthesized using the same procedures. The analytical data are listed below and contain information about the characterization of the compounds by thin layer chromatography, ESI-MS, HRMS, 1H-NMR and 13C-NMR.
:methanol in a ratio of 8:2 (v:v) (CHCl3: J. T. Baker, Netherlands; stabilized with 0.75% of ethanol, CH3OH: Merck, Germany; purity >99.9%). For the quantification of the TRXF results, dioctadecyldimethylammonium bromide (DODAB), purchased from Fluka, was used as a reference. The chemicals for the buffer subphases were purchased from Sigma-Aldrich. In the pH range from 3 up to 10, 1,4-diazabicyclo(2,2,2)octane (pKa1 = 4.2, pKa2 = 8.2), 2-morpholinoethylamine (pKa1 = 4.8, pKa2 = 9.5), 1,3-bis(tris(hydroxymethyl)methylamino)propane (pKa1 = 6.8, pKa2 = 9.0) or piperazine (pKa1 = 5.7, pKa2 = 9.8) was used as the basic species. Because of the high fluorescence yield, Br− was used as the only anion to interact with the positively charged head group. Therefore, HBr was chosen as the acid species in a constant concentration of 2 mM. The subphase with pH 2.6 was obtained by using only water and HBr acid. Milli-Q Millipore water with a specific resistance of 18.2 MΩ cm was used for all measurements and sample preparations. The synthesis and the analytical data of the lipids TH10, TH14, TH4 and OH4 have been already described.26,27 The transfection lipids OO10, OO4, OH14 and OO14 were synthesized using the same procedures. The analytical data are listed below and contain information about the characterization of the compounds by thin layer chromatography, ESI-MS, HRMS, 1H-NMR and 13C-NMR.
OO10: C47H91N5O3, 744.25 g mol−1. Rf: 0.25 (CHCl3/methanol/NH3, 80/20/2, v/v/v); ESI-MS: 744.5 [M + H]+; HRMS calc. 744.7195 Da (C47H92N5O3 [M + H]+), found 744.7195 Da; 1H-NMR (CDCl3, 500 MHz, 27 °C) δ[ppm] = 0.88 [t, 3J(H,H) = 6.8 Hz, 6H, 2 × –CH3], 1.26–1.90 [m, 56H, –CH2-alkyl, –(CH2)3CH2NH2], 1.95–2.01 [m, 8H, 2 × –CH2CH![[double bond, length as m-dash]](https://www.rsc.org/images/entities/char_e001.gif) CHCH2–], 2.71 [t, 3J(H,H) = 6.5 Hz, 2H, –(CH2)3CH2NH2], 2.82 [t, 3J(H,H) = 6.0 Hz, 2H, –NHCH2CH2NH2], 3.05 [t, 3J(H,H) = 7.4 Hz, 1H, –COCH(oleyl)CO–], 3.14–3.36 [m, 4H, 2 × –CH2NHCO–], 4.31–4.35 [m, 1H, –COCH(NHCO–)CH2–], 5.31–5.37 [m, 4H, 2 × –CHCH–], 6.43–6.45 [m, 1H, oleyl–NHCO–], 7.02–7.03 [m, 1H, –NHCH2CH2NH2], 7.33 [d, 3J(H,H) = 7.7 Hz, 1H, –COCH(NHCO–)CH2–]; 13C-NMR (CDCl3, 125 MHz, 27 °C), δ[ppm] = 14.1, 22.6, 22.7, 26.9, 27.2, 27.6, 29.17, 29.28, 29.29, 29.38, 29.39, 29.48, 29.58, 29.63, 29.68, 29.71, 31.5, 31.7, 31.9, 32.1, 32.3, 32.5, 32.6, 39.6, 41.2, 41.4, 41.5, 42.1, 53.4, 55.0, 129.7, 129.9, 130.2, 130.4, 170.8, 171.1, 171.2.
CHCH2–], 2.71 [t, 3J(H,H) = 6.5 Hz, 2H, –(CH2)3CH2NH2], 2.82 [t, 3J(H,H) = 6.0 Hz, 2H, –NHCH2CH2NH2], 3.05 [t, 3J(H,H) = 7.4 Hz, 1H, –COCH(oleyl)CO–], 3.14–3.36 [m, 4H, 2 × –CH2NHCO–], 4.31–4.35 [m, 1H, –COCH(NHCO–)CH2–], 5.31–5.37 [m, 4H, 2 × –CHCH–], 6.43–6.45 [m, 1H, oleyl–NHCO–], 7.02–7.03 [m, 1H, –NHCH2CH2NH2], 7.33 [d, 3J(H,H) = 7.7 Hz, 1H, –COCH(NHCO–)CH2–]; 13C-NMR (CDCl3, 125 MHz, 27 °C), δ[ppm] = 14.1, 22.6, 22.7, 26.9, 27.2, 27.6, 29.17, 29.28, 29.29, 29.38, 29.39, 29.48, 29.58, 29.63, 29.68, 29.71, 31.5, 31.7, 31.9, 32.1, 32.3, 32.5, 32.6, 39.6, 41.2, 41.4, 41.5, 42.1, 53.4, 55.0, 129.7, 129.9, 130.2, 130.4, 170.8, 171.1, 171.2.
OO4: C51H101N7O3, 860.39 g mol−1. Rf: 0.09 (CHCl3/methanol/NH3, 65/35/5, v/v/v); ESI-MS: 860.6 [M + H]+; HRMS calc. 860.8039 Da (C51H102N7O3 [M + H]+), found 860.8060 Da; 1H-NMR (CDCl3, 500 MHz, 27 °C) δ[ppm] = 0.85 [t, 3J(H,H) = 6.8 Hz, 6H, 2 × –CH3], 1.24–1.88 [m, 56H, –CH2-alkyl, –(CH2)3CH2NH2], 1.93–1.99 [m, 8H, 2 × –CH2CHCHCH2–], 2.45–2.56 [m, 6H, –CH2N(CH2CH2NH2)2], 2.64–2.76 [m, 6H, 3 × –CH2NH2], 3.04–3.41 [m, 5H, 2 × –CH2NHCO–, –COCH(oleyl)CO–], 4.31–4.37 [m, 1H, –COCH(NHCO–)CH2–], 5.27–5.35 [m, 4H, 2 × –CHCH–], 7.16–7.17/7.83–7.98/8.16–8.23 [3 × m, 3H; 3 × –NHCO–]; 13C-NMR (CDCl3/CD3OD, 125 MHz, 27 °C), δ[ppm] = 12.9, 21.8, 22.11, 22.14, 26.1, 26.3, 28.3, 28.4, 28.50, 28.58, 28.62, 28.7, 28.83, 28.88, 28.92, 28.98, 30.4, 31.0, 31.1, 31.7, 36.6, 36.7, 38.0, 38.1, 38.6, 38.7, 40.1, 40.2, 48.4, 52.69, 52.74, 52.85, 55.26, 55.33, 128.9, 129.0, 129.4, 129.5, 170.4, 170.5, 170.8, 171.5, 171.6.
OH14: C51H101N7O4, 879.39 g mol−1. Rf: 0.10 (CHCl3/methanol/NH3, 65/35/5, v/v/v); ESI-MS: 876.7 [M + H]+; HRMS calc. 876.7988 Da (C51H102N7O4 [M + H]+), found 876.7977 Da; 1H-NMR (CDCl3, 500 MHz, 27 °C) δ[ppm] = 0.87 [t, 3J(H,H) = 6.8 Hz, 6H, 2 × –CH3], 1.23–1.83 [m, 66H, –CH2-alkyl, 2 × –(CH2)3CH2NH2], 1.95–2.02 [m, 4H, –CH2CHCHCH2–], 2.68–2.73 [m, 4H, 2 × –CH2NH2], 3.02 [t, 3J(H,H) = 7.4 Hz, 1H, –COCH(hexadecyl)CO–], 3.13–3.44 [m, 7H, 3 × –CH2NHCO–, –COCHNH2CH2–], 4.28–4.32 [m, 1H, –COCH(NHCO–)CH2–], 5.32–5.37 [m, 2H, –CHCH–], 6.70/7.69/7.74 [3 × s, 3H, 3 × –NHCO–], 7.39 [d, 3J(H,H) = 6.8 Hz, 1H, –COCH(NHCO–)CH2–]; 13C-NMR (CDCl3, 125 MHz, 27 °C), δ[ppm] = 14.1, 22.7, 22.8, 22.9, 27.0, 27.2, 27.6, 29.28, 29.34, 29.5, 29.6, 29.7, 29.8, 31.8, 31.9, 32.0, 32.6, 32.8, 34.9, 38.7, 39.6, 40.0, 41.57, 41.64, 53.4, 54.9, 55.0, 129.7, 130.0, 130.2, 130.4, 170.8, 171.39, 171.41, 176.3.
OO14: C53H103N7O4, 902.43 g mol−1. Rf: 0.18 (CHCl3/methanol/NH3, 65/35/5, v/v/v); ESI-MS: 902.6 [M + H]+; HRMS calc. 902.8144 Da (C53H104N7O4 [M + H]+), found 902.8160 Da; 1H-NMR (CDCl3, 500 MHz, 27 °C) δ[ppm] = 0.88 [t, 3J(H,H) = 6.9 Hz, 6H, 2 × –CH3], 1.27–1.87 [m, 62H, –CH2-alkyl, 2 × –(CH2)3CH2NH2], 1.96–2.01 [m, 8H, 2 × –CH2CHCHCH2–], 2.70–2.76 [m, 4H, 2 × –CH2NH2], 3.01 [t, 3J(H,H) = 7.1 Hz, 1H, –COCH(oleyl)CO–], 3.16–3.48 [m, 7H, 3 × –CH2NHCO–, –COCHNH2CH2–], 4.26–4.31 [m, 1H, –COCH(NHCO–)CH2–], 5.34–5.38 [m, 4H, 2 × –CHCH–], 6.53–6.55/7.66–7.68/7.60–7.74 [3 × m, 3H, 3 × –NHCO–], 7.31–7,36 [m, 1H, –COCH(NHCO–)CH2–]; 13C-NMR (CDCl3/CD3OD, 125 MHz, 27 °C), δ[ppm] = 13.5, 22.1, 22.26, 22.33, 26.6, 26.8, 27.1, 28.8, 28.9, 29.1, 29.30, 29.35, 29.39, 29.6, 29.7, 30.4, 30.5, 31.1, 31.2, 31.5, 32.2, 34.2, 38.5, 38.7, 39.2, 39.3, 39.88, 39.92, 40.0, 53.0, 53.2, 53.6, 54.2, 54.3, 129.3, 129.6, 129.8, 130.0, 170.7, 171.2, 171.8, 172.0, 175.9, 176.0.
3. Methods
3.1 π/A-Isotherms
The molecular area A was measured in a Langmuir trough equipped with a Wilhelmy balance. A fixed temperature of 20 °C with an accuracy of ±0.1 °C was adjusted by an external water bath. A movable barrier compressed the lipid monolayer with a speed of 5 Å2 molecule−1 min−1 to the desired surface pressure π. The lipid solutions were spread carefully from a microsyringe (Hamilton, Switzerland) onto the aqueous subphases. 10 min were given before compression to allow the solvent to evaporate.3.2 Total Reflection X-ray fluorescence
TRXF measurements were carried out at the High-Energy Materials Science (HEMS) Beamline P0728,29 at PETRA III, DESY, Hamburg, Germany. The experimental setup includes a Langmuir trough in an air-tight aluminum container with a Kapton window, which is covered with lead in order to reduce scattering. The lipid monolayer was compressed to different target surface pressures (5 mN m−1 and 30 mN m−1), which were kept constant during the measurements. All experiments were performed in air at room temperature. The monochromatic synchrotron X-ray beam entered the hutch with a fixed photon energy of 60 keV (λ = 0.21 Å). The beamline P07 is equipped with an Amptek XR-100T CdTe fluorescence detector (Amptek, Bedford, U.S.A.). The cadmium telluride (heavy element)-diode has acceptable energy resolution and high efficacy at higher energies (up to 100 keV).3.3 X-ray reflectivity
Specular X-ray reflectivity (XRR) experiments were performed at the same beamline P07 as the described for the TRXF experiments. The set-up geometry was adjusted to αi = αr = α. The intensity of the reflected beam was measured as a function of the vertical incident angle αi using a NaI scintillation detector. The incident angle was varied stepwise in order to scan a range from 0.01 Å−1 to 0.55 Å−1 of Qz (vertical scattering vector component Qz = (4π/λ)sin(αr)). X-ray reflectivity data yield the electron density profile ρ along z normal to the surface and may be used to determine the layer thickness. The background scattering from, e.g., the subphase, was measured at 2θhor = 0.7° and subtracted from the signal measured at 2θhor = 0°. The reflectivity data were inverted by applying a model-independent approach including linear combinations of b-splines.30 The obtained electron density profile was interpreted by assuming a symmetrical electron density distribution in submolecular units of a lipid (for instance alkyl chains and head groups).
The experimental setup and evaluation procedure have been described in detail elsewhere.31–33
4. Results and discussion
4.1 Structural properties
The novel transfection lipids have a malonic acid-based lysine-containing backbone in common (Fig. 1). The cationic group of the lipids is represented by primary amines (R–NH2). In dependence on the pH value of the subphase, these groups are either protonated or deprotonated. This behavior can be clearly seen in the π/A-isotherms (Fig. 2). At low pH values, a liquid-expanded (LE) phase state is expected due to electrostatic repulsions between the charged (protonated) lipid head groups. They occupy large molecular areas. Here, a high surface pressure is needed to force them into a condensed phase state with high packing density. At high pH values, the lipids are uncharged and occupy smaller molecular areas. | ||
| Fig. 2 π/A-Isotherms of TH10 (A) and OO10 (B) at 20 °C on HBr buffers with different pH values. | ||
Head group 10 is the smallest head group in this investigation. It has only two primary amine groups. Head group 14 has an additional lysine moiety and therefore three primary amine groups. Both head groups have a small ethylene diamine spacer. In contrast to 10, head group 4 has a branched tris(2-aminoethyl)amine spacer and three primary amine groups (Fig. 1).
DNA is a polyelectrolyte and its charge state is therefore sensitive to the pH value. At physiological pH 7.4, DNA is negatively charged due to the phosphate backbone (PO2−). At lower pH values, the charges will be balanced by the protons (H+), hence it is neutral at pH 3, at which the lipids are almost fully protonated. pH 3 is the limit for our experiments due to possible hydrolysis of the phosphate groups and the breaking of H-bonds due to repulsion of positive charges (depurination of DNA). At the same time, pH 10 is the upper limit. The pKa values of guanine and thymine are 9.6 and 10.5, respectively.34 Therefore, these bases will be deprotonated at higher pH values and exist as negatively charged conjugated bases.35 As a result, the N–H⋯N hydrogen bond between GC and T–A will be disrupted.
4.2 π/A-Isotherms
At pH 3, TH10 is in a liquid-expanded phase state up to a surface pressure of 35 mN m−1 (Fig. 2A). Above this lateral pressure, a plateau appears indicating a first-order phase transition. In this region, the liquid-expanded phase (LE) and the condensed phase (LC) coexist. The pressure is almost constant over a certain range of molecular areas (depending on the temperature) and increases drastically at the end of the plateau. Now, the lipid monolayer is in the fully condensed phase state (the chains are in all-trans conformation). In contrast, TH10 is in a fully condensed phase state at pH 7 and 10. Since the amine groups are deprotonated, there is no electrostatic repulsion and the lipids can be packed tightly even at low surface pressures due to strong van der Waals interactions between the chains.TH14, which exhibits an additional lysine group in the head, is in a liquid-expanded phase state with chain segments in gauche conformation at pH 3 (ESI,† Fig. S7). At pH 5.5, the LE–LC phase transition occurs at πtr = 20 mN m−1, and at pH 7.4, a transition pressure of πtr = 10 mN m−1 has been determined. Both isotherms have a hump directly before the plateau. The hump indicates that an over-compression is needed to introduce the nucleation process.36 At pH 10, the monolayer of TH14 is fully condensed. The LE–LC transition pressure decreases continuously with increasing pH.
TH4 is in a liquid-expanded phase state at pH 3 and also at pH 7. However, the molecular area decreases with increasing pH due to a lower protonation state (ESI,† Fig. S4). At pH 9 and 10, TH4 undergoes a first-order phase transition (LE to LC) at a surface pressure of 23 mN m−1. The expected variations of the protonation degree in the investigated pH range have less influence on the isotherms (mostly the LE phase).
At low pH values, the protonation of the amine groups is strong enough to introduce electrostatic repulsions between the lipid head groups. Since all investigated lipids are essentially uncharged (deprotonated) at pH 8, using only isotherm measurements is not sufficient to estimate the protonation rate of such molecules.
The large molecular areas observed for the monolayers of OO10, OO4 and OO14 indicate that these lipids form fluid monolayers at all investigated pH values (Fig. 2B and ESI,† Fig. S6 and S9). This can be explained by the fact that these lipids have unsaturated chains which decrease the phase transition temperature37 in bulk and increase the phase transition pressure in monolayers.
None of the investigated lipids is in a condensed phase state at all pH values indicating a strong influence of the electrostatic repulsion due to the protonation of the amine groups in competition with the van der Waals attraction between neighboring chains. The smaller the head group and the higher the number of charges per lipid, the stronger the electrostatic repulsion within the lipid monolayer.
4.3 TRXF measurements
TRXF was used in order to quantify the amount of negatively charged bromide ions attracted to the positively charged lipid monolayer in dependence on the subphase pH. The bromide anions are detected at the surface (mainly in the Helmholtz part of the electrical double layer) due to a strong Br Kα line around 11.9 keV and a weak Br Kβ line around 13.3 keV.40 The fluorescence intensity of bromide is proportional to the Br− amount and can be directly coupled to the protonation degree of the cationic lipids. To avoid competition between counterions, just bromide containing buffers have been used with a constant concentration of 2 mM. The basic buffer substances were not surface active. The fluorescence spectra of the pure buffer were measured first and subtracted from the spectra taken with the different buffer solutions covered with the corresponding lipid monolayer.
For all investigated lipids, the same tendency was observed. With increasing pH value of the Br− containing subphase, the fluorescence intensity of the Br Kα and Br Kβ lines decreased. Selected X-ray fluorescence (XRF) spectra of TH10 are presented in Fig. 3A and of OO10 in Fig. 3B. In most cases, the signal intensity was already close to zero at pH 8.
 | ||
| Fig. 3 Selected X-ray fluorescence spectra of TH10 (A) and OO10 (B) at π = 30 mN m−1 on HBr buffer at pH 3 (■), pH 5 (○), pH 6 (△), pH 7 (*) and pH 10 (□). | ||
For further comparison, the integral intensity of the Br Kα fluorescence line was translated into the protonation degree to obtain titration curves of the cationic lipids. Thereby, we follow the procedure described in the literature.23 This procedure is based on molecular areas determined from the π/A-isotherms and the XF intensity determined for DODAB (one charge per molecule) monolayers. Since DODAB has a quaternary ammonium head group, it is permanently positively charged independent of the environmental pH value. The fluorescence signal intensity I is directly proportional to the concentration of the bromide counterion allowing the quantification of the protonation rate p of the lipid molecules
 | (1) |
cos(t) with the maximum length lmax of a stretched alkyl chain,41,42 the thickness z amounts to 19.1 Å.
The thickness of the fluid monolayers OO10 and OO4 was determined by XRR. The electron density profiles were described by a two-box model. The molecular area determined from the isotherm and the number of electrons in the hydrophobic part of the molecule were used as constraints during the fitting procedure. The hydrocarbon chain layer has a thickness of z = (14.2 ± 0.5) Å in the case of OO10 and z = (13.5 ± 0.5) Å for OO4 at pH 3 (ESI,† Fig. S12 and S13).
Surprisingly, the use of a very simple model allows satisfactory determination of z
 | (2) |
| Lipid | C surf [molecule Å−2] | I [arb. units] | z [Å] | z m [Å] from GIXD or XRR* |
|---|---|---|---|---|
| DODAB | 1/50 | 1096 | 18.8 | 19.1 |
| TH10 | 1/54 | 1789 | 14.4 | — |
| OO10 | 1/65 | 1681 | 14.3 | 14.2 ± 0.5* |
| TH4 | 1/78 | 2031 | 10 | — |
| OH4 | 1/77 | 1898 | 11.4 | — |
| OO4 | 1/82 | 2046 | 11.3 | 13.5 ± 0.5* |
| TH14 | 1/65 | 1848 | 12.8 | — |
| OH14 | 1/64 | 2115 | 14.2 | — |
| OO14 | 1/74 | 1969 | 12.6 | — |
| Lipid | Protonation degree | One charge [%] | Two charges [%] | Three charges [%] |
|---|---|---|---|---|
| DODAB | 1 (reference) | 100 | — | — |
| TH10 | 1.66 (±0.17) | 34 | 66 | — |
| OO10 | 1.96 (±0.2) | 4 | 96 | — |
| TH4 | 2.48 (±0.25) | — | 52 | 48 |
| OH4 | 2.37 (±0.24) | — | 63 | 37 |
| OO4 | 2.82 (±0.28) | — | 18 | 82 |
| TH14 | 1.96 (±0.2) | 4 | 96 | — |
| OH14 | 2.27 (±0.23) | — | 73 | 27 |
| OO14 | 2.40 (±0.24) | — | 60 | 40 |
 | ||
| Fig. 4 Protonation degree determined from the integral X-ray fluorescence intensity of the Br Kα line of the lipids compared to DODAB (black star) at 30 mN m−1. (A) TH10 (■) and OO10 (○), (B) TH14 (■), OH14 (△) and OO14 (○), (C) TH4 (■), OH4 (△) and OO4 (○). Dotted lines are for guiding the eye only. | ||
Head group 10 has two amine groups in the head group structure, which are in the case of the unsaturated lipid OO10 almost completely protonated. For TH10, 34% of the molecules carry only one charge and 66% of the molecules are fully protonated. Both lipids are deprotonated at pH 8. In general, OO10 is more strongly protonated than TH10 because of its lower packing density reducing the electrostatic repulsion.
Also, the lipids with head group 14 follow the tendency of increasing protonation with increasing fluidization of the lipid chains, which causes a looser packing at the air–liquid interface. Head group 14 contains three primary amine groups and an ethylene diamine spacer. From NMR measurements, it is known that these amine groups do not have the same physical–chemical properties as the amine groups of head group 4 due to the different structure. The chemical environment is different which is quite obvious comparing the coupling constant of TH14 (lipid 2b in ref. 26) and TH4 (lipid 4b in ref. 26).26 The saturated lipid TH14 has the lowest protonation state at pH 3 compared to the lipids with the same head group but unsaturated chains. The majority (96%) of TH14 molecules have two protonated amino groups. Full protonation of all three amino groups was not achieved. It was not possible to prepare pH solutions below pH 2.5 by keeping the Br− concentration constant at 2 mM. If we follow the line (Fig. 4B), full protonation can be expected at pH 0.78. The change in the chain structure (exchange of a tetradecyl with an oleyl chain) causes an increase in the protonation degree. Now 73% of the OH14 molecules have two charged amine groups in the head group and even 27% of the molecules have three charges. By replacing the saturated hexadecyl chain with a second oleyl chain (OO14) the packing density decreases drastically (increased molecular area). This leads to a stronger protonation. 60% of the lipids have now two charged amine groups and 40% of the molecules are fully protonated at pH 3. At pH 8.8, the bromide fluorescence intensity is zero, since all amine groups are deprotonated.
The lipids TH4, OH4 and OO4 have a branched tris(2-aminoethyl)amine spacer, which offers three amine groups to be protonated. The lipids including a saturated chain (TH4 and OH4) have, as expected, a tighter packing than OO4 (two oleyl chains). As a result, the protonation of the amine groups is hindered, which is reflected in the protonation degree. At pH 3, around 52% of the TH4 molecules have two charged amine groups in the head structure and 48% of the lipids are fully protonated. Surprisingly, OH4 has a slightly smaller protonation degree than TH4. 63% of the molecules have two charges, while 37% of the lipids have three protonated amine groups. The area requirement of TH4 and OH4 is similar. OO4 is in a fluid phase state at all investigated subphase pH values. As expected, it exhibits the highest protonation degree of the lipids with head group 4 and at the same time it also has the highest protonation degree among all investigated lipids. 82% of the OO4 molecules are fully protonated, while 18% of the molecules have only two charged amine groups. These results demonstrate again that a lower packing density allows more amine groups to be protonated. All lipids are deprotonated at pH 9.
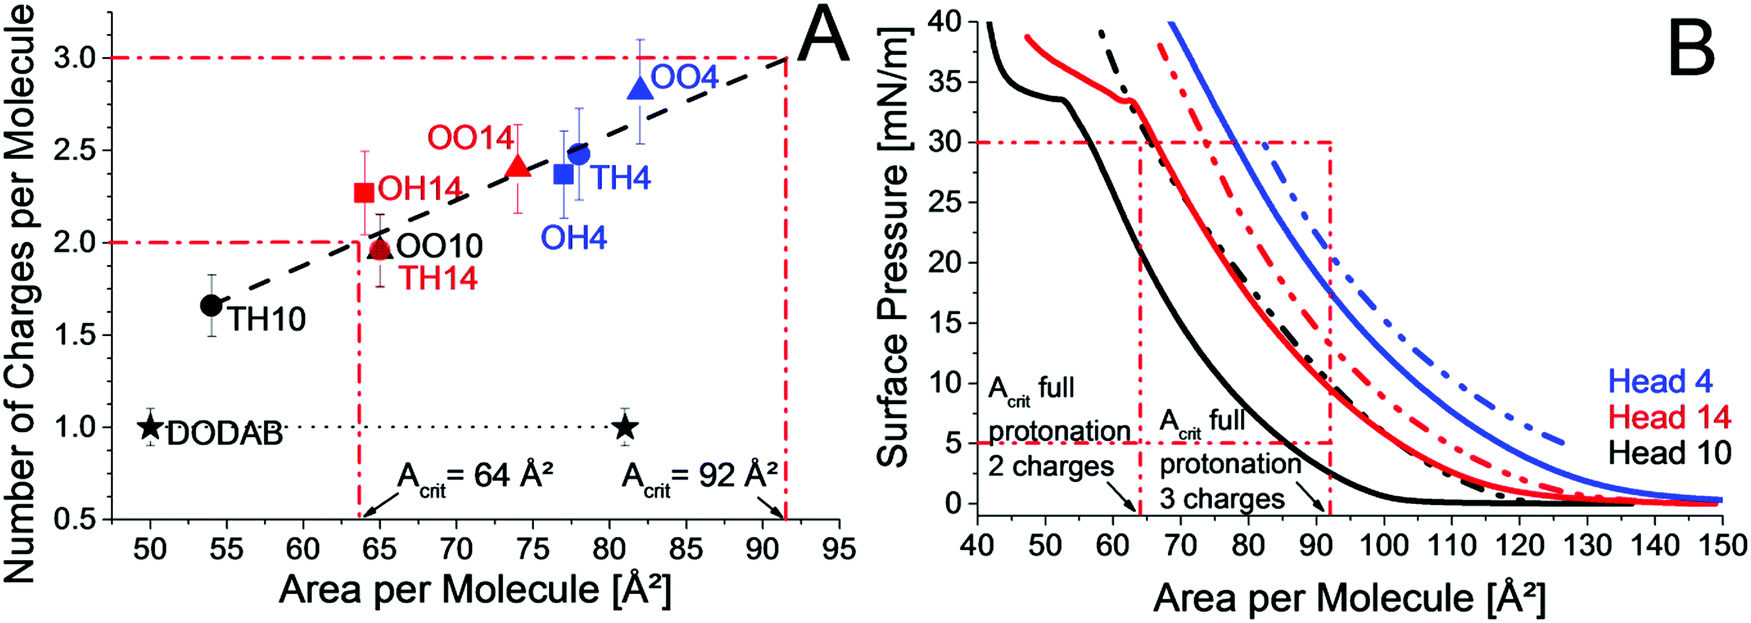 | ||
| Fig. 5 (A) Protonation state of TH10 (black dot), OO10 (black triangle), TH14 (red dot), OH14 (red square), OO14 (red triangle), TH4 (blue dot), OH4 (blue square) and OO4 (blue triangle) at 30 mN m−1 on HBr buffer pH 3 at 20 °C; the black dashed line denotes the linear fit, the black dotted line is for guiding the eye only, the red dashed-dotted line represents the maximal number of charges and critical molecular areas for full protonation, and the reference DODAB is given by a black star. (B) π/A-Isotherms of TH10 (straight black line), OO10 (dashed-dotted black line), TH14 (red straight line), OO14 (red dashed-dotted line), TH4 (blue straight line) and OO4 (blue dashed-dotted line) at 20 °C on HBr buffer pH 3. Acrit is the critical area for complete protonation. | ||
Nevertheless, the head group structure plays a crucial role. The accessibility of protonable groups has a large influence on the protonation state. All lipids with head group 4, namely TH4, OH4 and OO4, have a higher protonation degree than the corresponding lipids with head group 14 (TH14, OH14 and OO14). Both head groups contain three primary amine groups, but the head group structure is different. The additional lysine in head group 14 might lead to intermolecular H-bonds with neighboring lipid molecules (–CO–HN–). In that case, the α-amine group would be particularly suitable for such interactions. Subsequently, the α-amine group is occupied and head group 14 acts like a head group with only two available primary amine groups. Further, the branched spacer tris(2-aminoethyl)amine has a larger area requirement leading to a higher protonation degree. From the linear dependence in Fig. 5A the critical area, which is necessary for full protonation, can be obtained.
Fig. 5B shows the π/A-isotherms of TH10, OO10, TH14, OO14, TH4 and OO4. While TH10 has the smallest area per molecule due to less repulsion arising from only two chargeable amine groups and two saturated chains, OO10 requires a larger molecular area due to the unsaturated chains. In contrast to TH10, OO10 requires more space at 30 mN m−1 than needed for full protonation (64 Ų per molecule). Therefore, OO10 is fully protonated at 30 mN m−1 and TH10 is not. TH14, OO14, TH4 and OO4 are not fully protonated because their molecular areas at 30 mN m−1 are below the critical area for full protonation (Acrit), which amounts in the case of three protonable amine groups to 92 Å2 per molecule. At lower surface pressures, where the disposable area is above 92 Å2, full protonation should be possible. Indeed, OO4 is fully protonated at pH 3 and a surface pressure of only 5 mN m−1 (area per molecule: 126 Å2) in contrast to 30 mN m−1 (area per molecule: 82 Å2). For OO10 and OO4, the protonation was higher for monolayers at 5 mN m−1 than for monolayers at 30 mN m−1 at all investigated pH values below pH 8 (ESI,† Fig. S10 and S11). Above pH 8, the amine groups are not charged. Unfortunately, OO10 and OO4 are the only lipid monolayers measured at 5 mN m−1. Interestingly, OO10 and TH14 have an identical protonation state most probably due to similar molecular areas at pH 3. The results are a good example for tuning the protonation state of lipids by changing the chain pattern or the head group structure. The introduction of one additional lysine moiety (TH14) in the head group structure leads to a higher protonation degree compared to TH10. The same increase can be obtained by changing the chain pattern from saturated (TH10) to unsaturated (OO10). The transition to a branched head group (TH10 to TH4) yields an even higher protonation degree. But the most pronounced change in the protonation state is obtained by the combination of structural adjustments in the head group structure as well as in the chain pattern (OO4). Therefore, the increase in protonation does not arise from only one part of the lipid, but by the combination of them. The same applies to the transfection efficiency. The transfection efficiency is not determined solely by one structural domain of the cationic lipid, but by the combination of them.
 , where H+ is the acid, A− the conjugate base, and HA the neutralized species. If the neutralizing reaction is completed, there will be a jump in the titration curve, where the pH value drastically changes. The important point for the calculation of the pKa value is where only half of the species is neutralized because here [A−] = [HA] and therefore Ka only depends on the concentration of hydronium ions as Ka = [H+]. The relationship between the pH, pKa, [HA] and [A−] is described by the Henderson–Hasselbalch43 approximation:
 | (3) |
The pKa depends strongly on the properties of the chemical structure such as charge, the choice of atoms (their electronegativity values), their ability to be stabilized through resonance, inductive effects to stabilize conjugated bases and their orbital hybridization (increasing acidity with increasing s character sp3, sp2 and sp for hydrocarbons). For the transfection lipids, the pKa increases slightly with increasing chain fluidity (decreasing packing density). All investigated transfection lipids have a smaller pKa value than lysine itself (Table 3), indicating that their readiness to act as proton donors is higher.
| pKa value | |
|---|---|
| Lysine (solution) | 10.3 (ε-amino) and 8.9 (α-amino) |
| TH10 | 5 |
| OO10 | 5.6 |
| TH4 | 5.9 |
| OH4 | — |
| OO4 | 6 |
| TH14 | 4.3 |
| OH14 | — |
| OO14 | 5.1 |
5. Conclusion
Several newly synthesized lysine-based amino-functionalized lipids have been investigated over a wide range of subphase pH using film balance and TRXF techniques to estimate their protonation properties. These findings are important for further interpretation of DNA adsorption experiments46 and finally to find lead structures with high transfection efficiency. The results demonstrate that the lipids with the smallest head group 10 are deprotonated at pH 8 and the lipids with head groups 4 and 14 are deprotonated at pH 9, whereas at pH 3, the majority of molecules in the monolayers of TH10, OO10, TH4, OH4, OO4, TH14, OH14 and OO14 have at least two protonated groups. For the lipid OO4, even 82% of the molecules are fully protonated (three charged amine groups). In fact, the protonation degree of the unsaturated lipids was always higher compared to the saturated lipid with the same head group, which can be explained by the effect of chain fluidization due to double bonds. In general, a smaller packing density (lower charge density) gives more space for protonation (linear dependence). Furthermore, it was shown that the lipids with head group 4 (containing the branched tris(2-aminoethyl)amine spacer) have the highest protonation degrees.The next important question is how to relate the protonation degree at a certain pH with the binding of DNA. DNA goes only to the interfaces if the interaction with the interfaces is more favorable than the interactions of this polyelectrolyte with the subphase molecules. The adsorption behavior of DNA is a competition between an attractive surface potential and the entropic repulsion, which keeps the polyelectrolyte in the subphase. Since there is a charged monolayer at the interface, the electrostatic interactions between DNA and lipid monolayers depend on the charge density of the DNA and lipids,47 salt concentration,48 and pH value.49 In case a DNA chain segment adsorbs at the charged monolayer, the system loses translation energy equal to the thermic energy (kBT, where kB is the Boltzmann constant and T the temperature), but increases the entropy due to the released counterions (Z·kBT, where Z is the charge of the counterion). As a result, the surface charge decreases and consequently an equilibrium of adsorption and desorption will be established. For polyelectrolytes, this phenomenon is described as the Manning condensation.50 This means that even if there is only a weak charge at the interface, which attracts a small amount of DNA, this will attract more DNA to the interface. In addition, the DNA, which is already present at the interfaces, affects the potential of the electrical double layer in the way that the surface pH changes in accordance with the Boltzmann equation. Thus, this leads to an increase in the protonation degree of the present lipid monolayer and results in further binding of DNA molecules.23,24 Another important observation is the influence of salts, always present in biological systems, on the adsorption behavior. During adsorption, highly charged DNA replaces univalent ions in the EDL near the charged monolayer. Increasing salt concentration (decreasing Debye length) leads to a more compact ionic atmosphere around the DNA. This decreases the effective charge of DNA in solution and leads to an increasing amount of adsorbed DNA necessary for the compensation of the monolayer surface charge.24 This observation is of great importance for applications in gene transfection.
All these fundamental findings are important for determining the structure–activity relationship, which leads to a more optimized lipid structure for gene transfection.18,51,52 The transfection efficiency is not determined solely by one structural domain of the cationic lipid, but by the combination of them. The chemical structure of the lipid determines physical–chemical properties like the lipoplex structure,53 charge density and lipoplex size,54,55 which influence the cellular up-take and DNA release. Some lipids might have more binding capacity for DNA, but for successful transfection it is also necessary to release the material at a certain point. An optimum charge density would be high enough to avoid endosomal entrapment and low enough to release DNA efficiently.56,57 But even with an optimized structure, the transfection efficiency depends on additional parameters like the cell type and N/P ratio. In future, we are going to correlate our presented findings with DNA adsorption experiments and in vitro experiments on different cell lines and at several N/P ratios.
Conflicts of interest
There are no conflicts of interest to declare.Abbreviations
| a.u. | Arbitrary units |
| π/A-Isotherm | Surface pressure/molecular area-isotherm |
| ct-DNA | Calf thymus deoxyribonucleic acid |
| DODAB | Dioctadecyldimethylammonium bromide |
| HRMS | High resolution mass spectrometry (electron spray coupled orbitrap) |
| ESI-MS | Electron spray ionization mass spectrometry |
| GIXD | Grazing incidence X-ray diffraction |
| NMR | Nuclear magnetic resonance |
| OH14 | N-{6-Amino-1-[N-(9Z)-octadec-9-enylamino]-1-oxohexan-(2S)-2-yl}-N′-[2-(N-{(2S)-2,6-diamino-1-oxohexyl}amino)ethyl]-2-hexadecylpropandiamide |
| OH4 | N-{6-Amino-1-[N-(9Z)-octadec-9-enylamino]-1-oxohexan-(2S)-2-yl}-N′-{2-[N,N-bis(2-aminoethyl)amino]ethyl}-2-hexadecylpropandiamide |
| OO10 | N-(2-Aminoethyl)-N′-{6-amino-1-[N-(9Z)-octadec-9-enylamino]-1-oxohexan-(2S)-2-yl}-2-[(9Z)-octadec-9-enyl]propandiamide |
| OO14 | N-{6-Amino-1-[N-(9Z)-octadec-9-enylamino]-1-oxohexan-(2S)-2-yl}-N′-[2-(N-{(2S)-2,6-diamino-1-oxohexyl}amino)ethyl]-2-[(9Z)-octadec-9-enyl]propandiamide |
| OO4 | N-{6-Amino-1-[N-(9Z)-octadec-9-enylamino]-1-oxohexan-(2S)-2-yl}-N′-{2-[N,N-bis(2-aminoethyl)amino]ethyl}-2-[(9Z)-octadec-9-enyl]propandiamide |
| pKa | Acid dissociation constant |
| TH10 | N-(2-Aminoethyl)-N′-[6-amino-1-oxo-1-(N-tetradecylamino)hexan-(2S)-2-yl]-2-hexadecylpropandiamide |
| TH14 | N-[6-Amino-1-oxo-1-(N-tetradecylamino)hexan-(2S)-2-yl]-N′-[2-(N-{(2S)-2,6-diamino-1-oxohexyl}amino)ethyl]-2-hexadecylpropandiamide |
| TH4 | N-[6-Amino-1-oxo-1-(N-tetradecylamino)hexan-(2S)-2-yl]-N′-{2-[N,N-bis(2-aminoethyl)amino]ethyl}-2-hexadecylpropandiamide |
| TRXF | Total reflection X-ray fluorescence |
| XRR | X-ray reflectivity |
Acknowledgements
This work was supported by the Max Planck Society. We thank DESY, Hamburg, Germany for beam time and for providing excellent facilities and support, especially Uta Rütt and Olof Gutowski. We are grateful to Joana Oliveira and Janos Keller for help at the beamline and Irina Berndt for the precisely measured π/A-isotherm of DODAB (all from MPI-KGF). Open Access funding provided by the Max Planck Society.References
- T. Friedman and R. Roblin, Science, 1972, 175, 949–955 Search PubMed.
- P. L. Felgner, T. R. Gadek, M. Holm, R. Roman, H. W. Chan, M. Wenz, J. P. Northrop, G. M. Ringold and M. Danielsen, Proc. Natl. Acad. Sci. U. S. A., 1987, 84, 7413–7417 CrossRef CAS.
- T. P. O'Connor and R. G. Crystal, Nat. Rev. Genet., 2006, 7, 261–276 CrossRef PubMed.
- T. C. Liu and D. Kirn, Gene Ther., 2008, 15, 877–884 CrossRef CAS PubMed.
- M. Morille, C. Passirani, A. Vonarbourg, A. Clavreul and J.-P. Benoit, Biomaterials, 2008, 29, 3477–3496 CrossRef CAS PubMed.
- J. Vrij, R. A. Willemsen, L. Lindholm and R. C. Hoeben, Hum. Gene Ther., 2010, 21, 795–805 CrossRef PubMed.
- A. C. Oliveira, M. P. Ferraz, F. J. Monteiro and S. Simões, Acta Biomater., 2009, 5, 2142–2151 CrossRef CAS PubMed.
- D. Luo and W. M. Saltzman, Nat. Biotechnol., 2000, 18, 33–37 CrossRef CAS PubMed.
- X. Gao, K.-S. Kim and D. Liu, AAPS J., 2007, 9, 92–104 CrossRef PubMed.
- A. P. Dabkowska, D. J. Barlow, R. A. Campbell, A. V. Hughes, P. J. Quinn and M. J. Lawrence, Biomacromolecules, 2012, 13, 2391–2401 CrossRef CAS PubMed.
- Z. Du, M. M. Munye, A. D. Tagalakis, M. D. I. Manunta and S. L. Hart, Sci. Rep., 2014, 4, 7107 CrossRef PubMed.
- N. Düzgünes and P. L. Felgner, Methods Enzymol., 1993, 221, 303–306 Search PubMed.
- L. Wasungu and D. Hoekstra, J. Controlled Release, 2006, 116, 255–264 CrossRef CAS PubMed.
- I. Koltover, T. Salditt, J. O. Rädler and C. R. Safinya, Science, 1998, 281, 78–81 CrossRef CAS PubMed.
- S. Chesnoy and L. Huang, Annu. Rev. Biophys. Biomol. Struct., 2000, 29, 27–47 CrossRef CAS PubMed.
- J. F. Allemand, D. Bensimon, L. Jullien, A. Bensimon and V. Croquette, Biophys. J., 1997, 73, 2064–2070 CrossRef CAS PubMed.
- V. Budker, V. Gurevich, J. E. Hagstrom, F. Bortzov and J. A. Wolff, Nat. Biotechnol., 1996, 14, 760–764 CrossRef CAS PubMed.
- D. Niculescu-Duvaz, J. Heyes and C. J. Springer, Curr. Med. Chem., 2003, 10, 1233–1261 CrossRef CAS PubMed.
- K. Ewert, N. L. Slack, A. Ahmad, H. M. Evans, A. J. Lin, C. E. Samuel and C. R. Safinya, Curr. Med. Chem., 2004, 11, 133–149 CrossRef CAS PubMed.
- G. Brezesinski and H. Möhwald, Adv. Colloid Interface Sci., 2003, 100–102, 563–584 CrossRef CAS PubMed.
- C. Stefaniu, G. Brezesinski and H. Möhwald, Adv. Colloid Interface Sci., 2014, 208, 197–213 CrossRef CAS PubMed.
- H. Möhwald and G. Brezesinski, Langmuir, 2016, 32, 10445–10458 CrossRef PubMed.
- M. N. Antipina, B. Dobner, O. V. Konovalov, V. L. Shapovalov and G. Brezesinski, J. Phys. Chem. B, 2007, 111, 13845–13850 CrossRef CAS PubMed.
- V. L. Shapovalov, M. Dittrich, O. V. Konovalov and G. Brezesinski, Langmuir, 2010, 26, 14766–14773 CrossRef CAS PubMed.
- M. Hoernke, B. Koksch and G. Brezesinski, ChemPhysChem, 2011, 12, 2225–2229 CrossRef CAS PubMed.
- C. Wölk, S. Drescher, A. Meister, A. Blume, A. Langner and B. Dobner, Chem. – Eur. J., 2013, 19, 12824–12838 CrossRef PubMed.
- C. Janich, C. Wölk, S. Taßler, S. Drescher, A. Meister, G. Brezesinski, B. Dobner and A. Langner, Eur. J. Lipid Sci. Technol., 2014, 116, 1184–1194 CrossRef CAS.
- N. Schell, R. V. Martins, F. Beckmann, H. U. Ruhnau, R. Kiehn and A. Schreyer, in Stress Evaluation in Materials Using Neutrons and Synchrotron Radiation, ed. A. R. Pyzalla, A. Borbely and H. P. Degischer, 2008, vol. 571–572, pp. 261–266 Search PubMed.
- N. Schell, A. King, F. Beckmann, T. Fischer, M. Mueller and A. Schreyer, in Mechanical Stress Evaluation by Neutrons and Synchrotron Radiation Vi, ed. H. G. Brokmeier, M. Muller, P. K. Pranzas, A. Schreyer and P. Staron, 2014, vol. 772, pp. 57–61 Search PubMed.
- J. S. Pedersen and I. W. Hamley, J. Appl. Crystallogr., 1994, 27, 36–49 CrossRef.
- C. A. Helm, H. Möhwald, K. Kjær and J. Als-Nielsen, Europhys. Lett., 1987, 4, 697–703 CrossRef CAS.
- M. Schalke, P. Krüger, M. Weygand and M. Lösche, Biochim. Biophys. Acta, Biomembr., 2000, 1464, 113–126 CrossRef CAS.
- T. R. Jensen and K. Kjaer, in Novel Methods to Study Interfacial Layers, ed. D. Möbius and R. Miller, Elsevier Science, 2001, vol. 11, pp. 205–254 Search PubMed.
- V. Verdolino, R. Cammi, B. H. Munk and H. B. Schlegel, J. Phys. Chem., 2008, 112, 16860–16873 CrossRef CAS PubMed.
- J. L. Wood, Biochem. J., 1974, 143, 775–777 CrossRef CAS PubMed.
- C. Stefaniu, A. Ries, O. Gutowski, U. Ruett, P. H. Seeberger, D. B. Werz and G. Brezesinski, Langmuir, 2016, 32, 2436–2444 CrossRef CAS PubMed.
- G. Wang, S. Li, H. Lin, E. E. Brumbaugh and C.-h. Huang, J. Biol. Chem., 1999, 274, 12289–12299 CrossRef CAS PubMed.
- D. Marsh, Biochim. Biophys. Acta, 1996, 1286, 183–223 CrossRef CAS.
- V. L. Shapovalov, M. E. Ryskin, O. V. Konovalov, A. Hermelink and G. Brezesinski, J. Phys. Chem. B, 2007, 111, 3927–3934 CrossRef CAS PubMed.
- http://xdb.lbl.gov/Section1/Periodic_Table/Br_Web_data.htm (April 2017).
- A. I. Kitaigorodskii, Organic Chemical Crystallography, Consultants Bureau, New York, 1961 Search PubMed.
- J. N. Israelachvili, Intermolecular and Surface Forces, Saunders College Publishing, 1985 Search PubMed.
- C. G. Knight and T. Stephens, Biochem. J., 1989, 258, 683–687 CrossRef CAS PubMed.
- K. B. Parizi, X. Xu, A. Pal, X. Hu and H. S. P. Wong, Sci. Rep., 2017, 7, 41305 CrossRef CAS PubMed.
- R. E. G. V. Hal, J. C. T. Eijkel and P. Bergveld, Adv. Colloid Interface Sci., 1996, 69, 31–62 CrossRef.
- A. Martin-Molina, G. Luque-Caballero, J. Faraudo, M. Quesada-Perez and J. Maldonado-Valderrama, Adv. Colloid Interface Sci., 2014, 206, 172–185 CrossRef CAS PubMed.
- H. G. M. Van de Steeg, M. A. C. Stuart, A. Dekeizer and B. H. Bijsterbosch, Langmuir, 1992, 8, 2538–2546 CrossRef CAS.
- J. Papenhuijzen, H. A. Vanderschee and G. J. Fleer, J. Colloid Interface Sci., 1985, 104, 540–552 CrossRef CAS.
- G. J. Fleer, M. A. Cohen Stuart, J. M. H. M. Scheutjens, T. Cosgrove and B. Vincent, Polymers at Interfaces, Chapman & Hall, 1993 Search PubMed.
- G. S. Manning, J. Chem. Phys., 1969, 51, 924–933 CrossRef CAS.
- M. Dittrich, M. Heinze, C. Wölk, S. S. Funari, B. Dobner, H. Möhwald and G. Brezesinski, ChemPhysChem, 2011, 12, 2328–2337 CrossRef CAS PubMed.
- B. Martin, M. Sainlos, A. Aissaoui, N. Oudrhiri, M. Hauchecorne, J.-P. Vigneron, J.-M. Lehn and P. Lehn, Curr. Pharm. Des., 2005, 11, 375–394 CrossRef CAS PubMed.
- K. Ewert, N. L. Slack, A. Ahmad, H. M. Evans, A. J. Lin, C. E. Samuel and C. R. Safinya, Curr. Med. Chem., 2004, 11, 133–149 CrossRef CAS PubMed.
- P. C. Ross and S. W. Hui, Gene Ther., 1999, 6, 651–659 CrossRef CAS PubMed.
- K. Ewert, A. Ahmad, H. M. Evans and C. R. Safinya, Expert Opin. Biol. Ther., 2005, 5, 33–53 CrossRef CAS PubMed.
- A. Ahmad, H. M. Evans, K. Ewert, C. X. George, C. E. Samuel and C. R. Safinya, J. Gene Med., 2005, 7, 739–748 CrossRef CAS PubMed.
- Y. H. Xu and F. C. Szoka, Biochemistry, 1996, 35, 5616–5623 CrossRef CAS PubMed.
Footnote |
| † Electronic supplementary information (ESI) available: π/A-Isotherms and corresponding surface Gibbs elasticity, TRXF and XRR data. See DOI: 10.1039/c7cp03107f |
| This journal is © the Owner Societies 2017 |