 Open Access Article
Creative Commons Attribution 3.0 Unported Licence
Ion dynamics in halogen-free phosphonium bis(salicylato)borate ionic liquid electrolytes for lithium-ion batteries†
Faiz Ullah
Shah
 *a,
Oleg I.
Gnezdilov
 b and
Andrei
Filippov
 *ab
*ab
aChemistry of Interfaces, Luleå University of Technology, Luleå, SE-97187, Sweden. E-mail: faisha@ltu.se; Andrei.Filippov@ltu.se
bInstitute of Physics, Kazan Federal University, 420008 Kazan, Russia
First published on 30th May 2017
Abstract
This study was focused on the investigation of ion dynamics in halogen-free, hydrophobic, and hydrolytically stable phosphonium bis(salicylato)borate [P4,4,4,8][BScB] ionic liquid electrolytes for lithium-ion batteries. The structure and purity of the synthesized ionic liquid and lithium bis(salicylato)borate Li[BScB] salt were characterized using 1H, 13C, 31P, and 11B NMR spectroscopy. The Li[BScB] salt was mixed with an ionic liquid at the concentrations ranging from 2.5 mol% to 20 mol%. The physicochemical properties of the resulting electrolytes were characterized using thermal analysis (TGA and DSC), electrical impedance spectroscopy, and pulsed-field gradient (PFG) NMR and ATR-FTIR spectroscopy. The apparent transfer numbers of the individual ions were calculated from the diffusion coefficients of the cation and anion as determined via the PFG NMR spectroscopy. NMR and ATR-FTIR spectroscopic techniques revealed dynamic interactions between the lithium cation and bis(salicylato)borate anion in the electrolytes. The ion–ion interactions were found to increase with the increasing concentration of the Li[BScB] salt, which resulted in ionic clustering at the concentrations higher than 15 mol% of Li salt in the ionic liquid.
Introduction
Over the past decade, an exponentially growing interest has been seen in the use of electrical energy storage devices not only for portable consumer electronics but also for transportation technologies including buses, trams, cars, and motorcycles. Lithium-ion batteries play an important role in modern electronics due to their high energy density.1 The conventional organic electrolytes have a number of drawbacks such as volatility, tedious purification process, higher environmental impact, flammability, and low ionic conductivity.2 These problems are limiting their applicability in lithium-ion batteries in terms of safety and performance. For example, the most common conventional electrolyte used in the commercially available lithium-ion batteries is the LiPF6 salt dissolved in a mixture of ethylene carbonate (EC) and diethyl carbonate (DEC).3,4 LiPF6 is thermally unstable and decomposes at elevated temperatures, producing LiF and PF5. PF5 is proven to undergo hydrolysis, forming HF and PF3O that are highly reactive to both positive and negative electrodes.5 Extensive research efforts are being made to develop novel and safe electrolytes for lithium-ion batteries to improve the safety of the energy storage devices. Ionic liquids possess a combination of properties that makes them excellent electrolytes for batteries in terms of enhanced performance, safety, and stability.6Ionic liquids (ILs) are salts composed of cations and anions and are liquids at or below 100 °C.7 Some of their properties include high polarity, non-volatility, high thermal stability, high ionic conductivity, and high chemical and electrochemical stability; moreover, they remain liquid over a wide temperature range. These properties can be tuned to optimize their performance for a variety of applications. The design potential originates from a large number of possible cations and anions that can be combined into an almost unlimited number of ionic liquids.8,9 Due to the unique physicochemical properties of ILs, they are considered as the most suitable replacement for the organic electrolytes currently used in lithium batteries.10 The potential of a variety of ILs as electrolytes for lithium-ion batteries has been investigated during the past decade.11 Most of these ionic liquid electrolytes contain halogenated anions and different cations including pyrrolidinium, imidazolium, choline, and phosphonium.12–15
There are a number of limitations of the conventional ionic liquid electrolytes that need to be tackled to improve the safety and performance of lithium-ion batteries.16,17 (1) Most of the ionic liquid electrolytes contain halogenated anions such as BF4−, PF6−, etc., which are sensitive to moisture and thus produce toxic and corrosive products upon hydrolysis. Therefore, halogen-free ionic liquid electrolytes are desirable for improving the safety and performance of the batteries. (2) There should be weak interactions between Li+ and the anion of the ionic liquid to achieve fast ionic mobility between electrodes. (3) The ionic liquid electrolytes should be hydrophobic with low affinity to water to enhance the battery life. Very little attention has been devoted to the design of new salts and ionic liquids as electrolytes for lithium device applications.
A great interest in the use of halogen-free orthoborate-based lithium salts and their derivatives, including lithium bis[1,2-benzenediolato(2-)-O,O′]borate Li[BBB],18 lithium bis[2,3-naphtha-lene-diolato(2-)-O,O′]borate Li[BNB],19 lithium bis[2,2-biphenyldiolato(2-)-O,O′]borate Li[BBPB],20 lithium bis[croconato]borate Li[BCB],21 and lithium bis(salicylato)borate Li[BScB],22,23 as potential candidates for lithium batteries has been noticed. All these orthoborate anions have shown an extensive charge delocalization due to their strong electron-withdrawing substituents. This is one of the main reasons for the high ionic conductivity, wide electrochemical stability window, and high thermal stability of these orthoborate anions. Aromaticity of these orthoborate anions is another reason for their stability. The salts based on these anions, also known as Hückel anions, are promising electrolytes for lithium batteries, providing excellent electrochemical properties as compared to other similar salts.24,25
Some other orthoborate-based lithium salts that are not aromatic have been extensively investigated for their applications in lithium batteries. These anions include lithium bis(malonato)borate, lithium bis(oxalato)borate, and their derivatives.26,27 It has been found that Li[BOB] dissolved in 1-ethyl-3-methyl-imidazolium tetrafluoroborate IL is a promising electrolyte for rechargeable lithium batteries using a lithium alloy anode.28 Over the past few decades, a number of studies have reported that Li[BOB] possesses unique electrochemical properties that make this salt an attractive alternative electrolyte for lithium-ion batteries.29–34
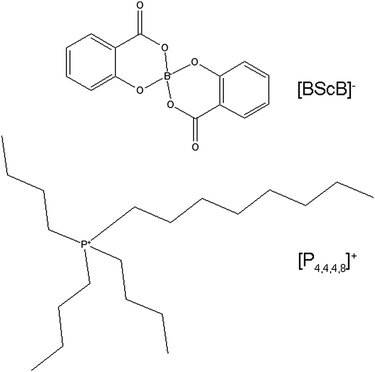
Despite the excellent electrochemical properties of orthoborate anions, not much attention has been paid to the ion dynamic mechanisms of these anions as electrolytes for lithium batteries. To the best of our knowledge, this is the first report on the investigation of ion dynamics of orthoborate-based ionic liquid electrolytes via electrical impedance spectroscopy (EIS) and pulsed-field gradient (PFG) NMR spectroscopy. EIS provides information about the overall ion transport, whereas PFG NMR spectroscopy allows the determination of individual self-diffusion coefficients of the cations and anions. A combination of these two techniques provides deeper insights into the ion dynamics in ionic liquid electrolytes. In this study, we investigated the mechanism of ion dynamics in halogen-free and hydrolytically stable electrolytes based on tributyloctylphosphonium bis(salicylato)borate [P4,4,4,8][BScB] IL mixed with a lithium bis(salicylato)borate Li[BScB] salt. The structures and abbreviations of the cation and anion of the ionic liquid are shown in Fig. 1. The Li[BScB] salt was dissolved in the IL at various concentrations ranging from 2.5 mol% to 20 mol%. The investigation of the physical and transport properties as a function of lithium salt concentration in [P4,4,4,8][BScB] IL was carried out using ionic conductivity, thermal analysis, FT-IR spectroscopy, and PFG NMR measurements.
Experimental
Sample preparation
The ionic liquid [P4,4,4,8][BScB] and lithium salt Li[BScB] were synthesized as described in our previous publication.35 The structure and purity of the products were confirmed using 1H, 13C, 31P, and 11B NMR spectroscopy. All the NMR spectra are provided in the ESI.† A total of six electrolyte samples were prepared via the dissolution of Li[BScB] salt in [P4,4,4,8][BScB] IL in different concentrations ranging from 2.5 mol% to 20 mol%. A maximum solubility of 20 mol% of Li[BScB] salt in [P4,4,4,8][BScB] IL was obtained at room temperature without crystallization. All the samples were dried in a vacuum oven at 60 °C for more than 2 days before performing the experiments. Water content was determined via Karl Fischer titration using 917 coulometer (Metrohm). Triplicate measurements were performed, and the mean values have been reported together with standard deviation (SD). The water content of the neat [P4,4,4,8][BScB] was 0.039% ± 0.002. The composition and water content of the electrolytes are shown in Table 1.| mol% of Li[BScB] | mol% of [P4,4,4,8][BScB] | Molality (mol kg −1) | Water content (%) ± SD |
|---|---|---|---|
| 2.5 | 97.5 | 0.043 | 0.050 ± 0.003 |
| 5 | 95 | 0.088 | 0.066 ± 0.004 |
| 7.5 | 92.5 | 0.140 | 0.034 ± 0.002 |
| 10 | 90 | 0.186 | 0.035 ± 0.005 |
| 15 | 85 | 0.295 | 0.083 ± 0.008 |
| 20 | 80 | 0.418 | 0.067 ± 0.006 |
Nuclear magnetic resonance spectroscopy
The structure and purity of the synthesized lithium salt and ionic liquid were characterized using Bruker Ascend Aeon WB 400 (Bruker BioSpin AG, Fällanden, Switzerland) NMR spectrometer. DMSO and CDCl3 were used as solvents for the lithium salt and ionic liquid, respectively. The working frequency was 400.21 MHz for 1H, 100.63 MHz for 13C, 162.01 MHz for 31P, and 128.40 MHz for 11B. Data were processed using the Bruker Topspin 3.5 software.Pulsed-field gradient diffusometry
Pulsed-field gradient (PFG) NMR measurements were performed using a Bruker Avance III (Bruker BioSpin AG, Fällanden, Switzerland) NMR spectrometer. The working frequency was 400.27 MHz for 1H and 155.56 MHz for 7Li. Data were processed using the Bruker Topspin 3.1 software. NMR self-diffusion measurements were performed via1H with a PFG NMR probe Diff50 (Bruker) with a maximum amplitude of the magnetic field gradient pulse of 30 T m−1. The sample was placed in a standard 5 mm glass sample tube and closed with a plastic stopper to avoid contact with air. Prior to measurements, the sample was equilibrated at a specific temperature for 30 min.Details of the PFG NMR technique used for measuring the molecular diffusion coefficients can be found in the literature.36 The primary information for the diffusion is contained in the diffusion decay (DD) of the NMR stimulated echo amplitude A. For the stimulated echo pulse sequence used, diffusion decay of A in the case of the simple non-associating molecular liquid can be described by the following equation:37
A(g,δ,td) = A(0)![[thin space (1/6-em)]](https://www.rsc.org/images/entities/char_2009.gif) exp(−γ2g2δ2Dtd) exp(−γ2g2δ2Dtd) | (1) |
Thermal analysis
Thermogravimetric analysis (TGA) was performed using a Perkin Elmer 8000 TGA apparatus. Temperature-ramped TGA experiments were carried out at a heating rate of 10 °C min−1. Herein, 2–4 mg of the ionic liquid sample was used for each experiment. All the TGA experiments were performed using nitrogen gas as the inert carrier gas.Differential scanning calorimetry (DSC) experiments were performed using a Perkin Elmer DSC 6000 apparatus. About 2–5 mg of the ionic liquid sample was packed in an aluminium pan for each experiment. DSC data were obtained during both cooling and heating cycles in the temperature range from −70 °C to 100 °C at the scanning rate of 10 °C min−1. The glass transition temperatures Tg were determined as the onset of the transition on the DSC graphs. An inert nitrogen gas was supplied to the instrument at a constant flow of 20 mL min−1 to preserve a dry environment inside the sample chamber.
Ionic conductivity
The ionic conductivity of the electrolytes was measured using a Metrohm Autolab PGSTAT302N electrochemical workstation with the FRA32M module for impedance measurements controlled by the Nova 2.02 software. A frequency range from 1 Hz to 1 MHz with an AC voltage amplitude of 50 mVrms was used for the measurements. A 70 μL closed cell (70 μL solvent) from RHD instruments was used for the measurements. The measurements were performed in temperature range from 0 °C to 100 °C within an uncertainty of ±0.1 °C. A two-electrode setup was used for the ionic conductivity measurements. Pt-wire with a diameter of 0.25 mm was used as the working electrode, and a 70 μL platinum crucible served as the sample container as well as a counter electrode. Both electrodes were polished with a Kemet diamond paste 0.25 μm prior to each measurement. The cell constant of the conductivity cell was determined via a 100 μS cm−1 KCl standard solution (Kcell = 17.511 cm−1) obtained from Metrohm. The cell was thermally equilibrated for at least 20 min before each measurement.Infrared spectroscopy
Attenuated total reflection Fourier transform infrared (ATR-FTIR) spectra were obtained using a Bruker IFS 80v vacuum Fourier transform infrared spectrometer equipped with a deuterated triglycine sulphate (DTGS) detector and diamond ATR accessory. All spectra were obtained at room temperature (∼22 °C) using the double side forward-backward acquisition mode. A total number of 256 scans were co-added and signal-averaged at an optical resolution of 4 cm−1.Results and discussion
Fig. 2 represents the DSC heating traces of the neat [P4,4,4,8][BScB] and [P4,4,4,8][BScB] mixed with various concentrations of Li[BScB]. The neat [P4,4,4,8][BScB] reveals the glass transition temperature (Tg) at 230 K, which is in a good agreement with that reported in literature.35 The glass transition temperatures are strongly affected by the addition of lithium salt to the IL. A decrease in the glass transition temperature is observed when Li[BScB] salt is added to the IL. The Tg value increases from 230 K for the neat IL to 250 K for the sample with 20 mol% of lithium salt in the IL. An increase in Tg has been previously observed upon the addition of lithium or sodium salt to ILs.38 The increase in Tg upon the addition of lithium salt is due to the increase in the ion–ion attractions that lead to higher glass transition temperatures.39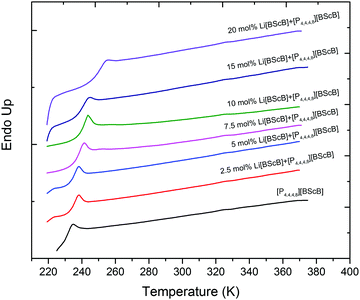 | ||
| Fig. 2 DSC curves for neat [P4,4,4,8][BScB] and [P4,4,4,8][BScB] with different concentrations (mol%) of Li[BScB] salt. | ||
The thermal stability of the neat [P4,4,4,8][BScB] and [P4,4,4,8][BScB] mixed with Li[BScB] salt was investigated using thermogravimetric analysis. The variable-temperature TGA data for neat [P4,4,4,8][BScB] (solid black line) and [P4,4,4,8][BScB] mixed with Li[BScB] salt (dotted coloured lines) are shown in Fig. 3. The TGA data for the neat [P4,4,4,8][BScB] reveal that major weight loss occurs in two steps; the onset temperature of the first step of decomposition is at ca. 450 K and the onset of the second step is at ca. 600 K. The addition of Li[BScB] salt has no significant effect on the first thermal process; however, a slight effect is observed on the second thermal process. It is clearly seen that the second thermal process occurs at lower temperatures when up to 10 mol% of Li[BScB] salt is added to the IL. However, the second thermal decomposition is delayed in the case of the samples with concentrations higher than 10 mol% of Li[BScB] salt in the IL. Particularly, the electrolytes with 15 mol% and 20 mol% of Li[BScB] salt in the IL have shown slightly higher thermal stability as compared to the neat IL and IL with lower Li salt concentrations.
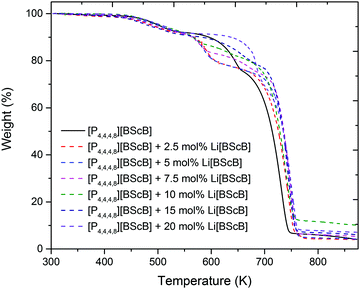 | ||
| Fig. 3 TGA thermograms of neat [P4,4,4,8][BScB] and [P4,4,4,8][BScB] with different concentrations (mol%) of Li[BScB] salt. | ||
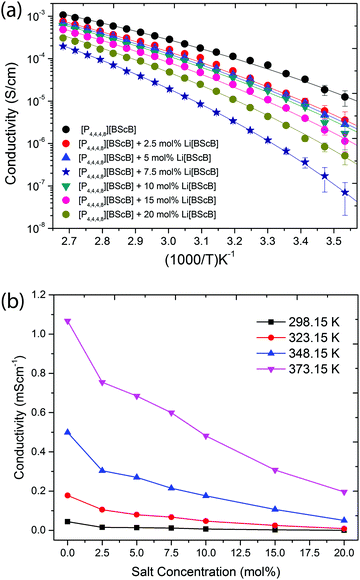
The ionic conductivities of the neat [P4,4,4,8][BScB] and [P4,4,4,8][BScB] with various concentration of the Li[BScB] salt are shown in Fig. 4. Fig. 4a represents the Arrhenius plot of conductivity and Fig. 4b demonstrates the concentration-dependent ionic conductivity at various temperatures. As expected, the ionic conductivity increases with the increase in temperature for all the systems examined herein, whereas it decreases across the entire measured temperature range with the increase in the concentration of Li salt. The decrease in the ionic conductivity with the addition of lithium salt is due to the increase in the viscosity of the electrolyte. An increase in viscosity upon the addition of lithium salt is expected due to stronger ionic bonds in the electrolyte, slowing down the mobility of ions in the liquid. One of the reasons for this decrease in the ionic mobility is the stronger Coulombic interactions between small lithium ions and the bis(salicylato)borate anions as compared to the interactions between the larger phosphonium cations and the bis(salicylato)borate anions. Thus, the decrease in ionic conductivity with the addition of lithium salts is due the stronger Coulombic interactions that lead to a decrease in the ionic mobility of the electrolytes.
For the ionic conductivity of the ILs, the Vogel–Fulcher–Tammann (VFT) equation is
 | (2) |
| Li[BScB] (mol%) | σ 0 (S cm−1) | B (K) | T 0 (K) | E σ (kJ mol−1 K−1) | T g(onset) (K) | T g(midpoint) (K) |
|---|---|---|---|---|---|---|
| 0.0 | 0.20 ± 0.01 | 1041 ± 8 | 175 ± 10 | 8.7 ± 0.1 | 230 | 235 |
| 2.5 | 0.34 ± 0.02 | 1200 ± 9 | 175 ± 10 | 10.0 ± 0.1 | 233 | 238 |
| 5.0 | 0.38 ± 0.01 | 1296 ± 7 | 175 ± 10 | 10.8 ± 0.1 | 235 | 240 |
| 7.5 | 0.44 ± 0.06 | 1350 ± 8 | 175 ± 10 | 11.2 ± 0.1 | 237 | 241 |
| 10.0 | 0.46 ± 0.02 | 1425 ± 10 | 175 ± 10 | 11.8 ± 0.1 | 239 | 243 |
| 15.0 | 0.50 ± 0.03 | 1560 ± 13 | 175 ± 10 | 13.0 ± 0.1 | 240 | 244 |
| 20.0 | 0.79 ± 0.10 | 1867 ± 7 | 175 ± 10 | 15.5 ± 0.1 | 250 | 254 |
The Tg values extracted from the DSC curves are larger for neat [P4,4,4,8][BScB] and IL mixed with Li[BScB] salt as compared to the reference T0 values. The Tg − T0 values are in the range from 55 K to 75 K, and the T0/Tg values are in the range from 0.70 to 0.76. The Tg values are always larger than the vitreous transition temperature (Tg > T0), and according to an empirical approximation, the T0/Tg ≈ 0.75 and Tg − T0 ≈ 50 K for ionic liquids.41 The larger Tg − T0 values have been previously reported for ionic liquid electrolytes, suggesting decoupling of the conductivity from Tg and onset of ionic mobility at temperatures below the glass transition temperature.42
PFG NMR spectroscopy was employed to obtain further insights into the ionic mobility of the ions in the electrolytes. High intensity NMR signals were obtained for [P4,4,4,8]+ cation, [BScB]− anion, and Li+ cation. Diffusion decays were easily measured in the dynamic range of up to 3–4 decimal orders. Therefore, the achieved uncertainties in the diffusion coefficients were in the range of 0.2–2.1%. This was estimated from the distribution of points in diffusion decays and from the reproducibility of the values of diffusion coefficients in consequent series of measurements.
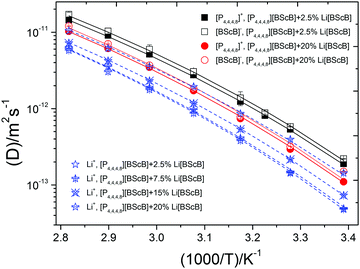
Fig. 5 demonstrates a monotonous increase of diffusivities with temperature that does not perfectly follow the Arrhenius dependence. As expected, diffusivity of [BScB]− anion is always slightly (by factor 1.03–1.14) higher than that of [P4,4,4,8]+ cation due to the smaller size of the anion. Li+ diffusivity is lowered by a factor of ∼2.3 as compared to the [P4,4,4,8]+ and [BScB]− diffusivity. It was found that increase in the concentration of the Li[BScB] salt in the IL leads to a monotonous decrease in the mobilities of all the three ions present in the system.
Arrhenius type of equation,43 which describes the temperature dependence of Ds, has a form
 | (3) |
 | (4) |
| Li[BScB] (mol%) | Ion diffusion | D 0 × 10−8 (m2 s−1) | B (K) | T 0 (K) | E D (kJ mol−1 K−1) |
|---|---|---|---|---|---|
| 2.5 | [P4,4,4,8]+ | 3.48 ± 0.09 | 1299 ± 8 | 188 ± 10 | 10.8 ± 0.1 |
| [BScB]− | 4.33 ± 0.05 | 1311 ± 13 | 188 ± 10 | 10.9 ± 0.1 | |
| Li+ | 2.11 ± 0.12 | 1276 ± 12 | 188 ± 10 | 10.6 ± 0.1 | |
| 7.5 | Li+ | 2.52 ± 0.02 | 1365 ± 4 | 188 ± 10 | 11.3 ± 0.1 |
| 15 | [P4,4,4,8]+ | 3.60 ± 0.02 | 1357 ± 12 | 188 ± 10 | 11.3 ± 0.1 |
| [BScB]− | 4.50 ± 0.16 | 1400 ± 13 | 188 ± 10 | 11.6 ± 0.1 | |
| Li+ | 2.58 ± 0.05 | 1446 ± 9 | 188 ± 10 | 12.0 ± 0.1 | |
| 20 | [P4,4,4,8]+ | 3.71 ± 0.07 | 1368 ± 15 | 188 ± 10 | 11.4 ± 0.1 |
| [BScB]− | 4.52 ± 0.06 | 1337 ± 42 | 188 ± 10 | 11.1 ± 0.2 | |
| Li+ | 2.73 ± 0.34 | 1419 ± 13 | 188 ± 10 | 11.8 ± 0.1 | |
From the Table 3, we can see that the difference in the diffusion of ions in [P4,4,4,8][BScB] containing Li[BScB] salt is mainly related to the activation energy ED. For the electrolyte containing 2.5 mol% and 20 mol% of Li[BScB], D0 are in the order T0(Li+) < T0([P4,4,4,8]+) < T0([BScB]). D0 and ED for all the ions were found to increase with the increase in the salt concentration. This means that diffusivities as well as energy barriers for diffusion increases at higher salt contents.
When we compared the parameters for ionic conductivity (Table 2) and diffusivity (Table 3), some obvious similarities and differences were observed. σ0 increased with the increase in the concentration of the Li[BScB] salt in the IL that may mean that ionic conductivity is largely contributed by the Li[BScB] salt rather than by the neat IL.
The effect of the Li[BScB] salt concentration in the IL on the diffusion of Li+ is shown in Fig. 6. It reveals a monotonous decrease in the Li+ diffusion coefficient with an increase in the Li[BScB] salt concentration in the IL. Generally, this trend is similar to the trend of diffusion of [P4,4,4,8]+ and [BScB]− ions with the increase in the Li[BScB] concentration. The apparent transference numbers of the individual ions were determined from the self-diffusion coefficients of all the ions present in the electrolyte using the following equation, as previously reported.45,46
 | (5) |
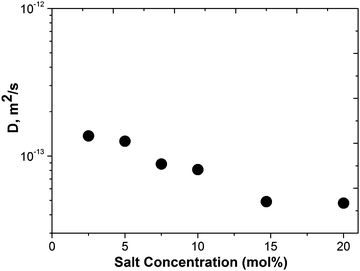 | ||
| Fig. 6 Dependence of the Li+ diffusion coefficient on the molar concentration of the Li[BScB] salt in [P4,4,4,8][BScB] IL at 295 K. | ||
| Li[BScB] (mol%) | 295 K | 355 K | ||||
|---|---|---|---|---|---|---|
| t Li | t [P4,4,4,8]+ | t [BScB]− | t Li | t [P4,4,4,8]+ | t [BScB]− | |
| 2.5 | 0.009 | 0.452 | 0.539 | 0.009 | 0.447 | 0.545 |
| 15 | 0.040 | 0.466 | 0.494 | 0.047 | 0.414 | 0.539 |
| 20 | 0.040 | 0.355 | 0.606 | 0.054 | 0.384 | 0.562 |
There are few plausible explanations for the lower transference number of Li+ cation in the phosphonium orthoborate-based IL electrolytes. First is the relatively lower solubility (up to 20 mol%) of the Li[BScB] salt in the IL at room temperature. The lithium transference number can be significantly increased if larger amount of lithium salt is dissolved in the IL. Second, the size of the anion is much larger than those of the typical halogenated anions such as BF4, PF6, and NTf2. Third, the PFG NMR method underestimates the diffusion coefficients of the charged species. Martins et al. have calculated the lithium transference number in phosphonium-based ionic liquids using both NMR and electrochemical methods and have found that the values calculated from the electrochemical method are 2–3 fold larger than the values calculated from the NMR method.50 These authors have explained that NMR method underestimates the diffusion coefficient of charged species because it considers all the species and aggregates between lithium cation and the anion that are larger than the small charged Li+ cation. Thus, their low diffusion coefficients decrease the overall diffusion coefficient and transference number of Li+ cation.
7Li NMR spectra of the Li[BScB] salt dissolved in the [P4,4,4,8][BScB] IL demonstrate a single resonance line. The 7Li NMR spectra for 2.5 mol%, 15 mol%, and 20 mol% electrolytes as a function of temperature are shown in Fig. 7. It was observed that the line broadening of the 7Li NMR spectra increased with an increase in the concentration of the Li[BScB] salt in the IL and decreased with an increase in temperature. For higher Li[BScB] concentrations (15 mol% and 20 mol%), the value of Δω increased by a factor of 3–4 than that for the lowest (2.5 mol%) salt concentration in the IL. Via increasing the concentration of Li[BScB] salt in the IL, the 7Li NMR resonance line is split into two lines. The splitting of the resonance line indicates that a cluster is being formed at the concentrations higher than 15 mol% of Li salt in the IL. The splitting is more evident for 20 mol% of Li salt, as shown in Fig. 7c. Interestingly, the splitting of the 7Li NMR resonance line is more clearly seen at a temperature higher than 315.15 K. It suggests that Li+ cation has been transported between two different chemical environments with slightly different chemical shifts.
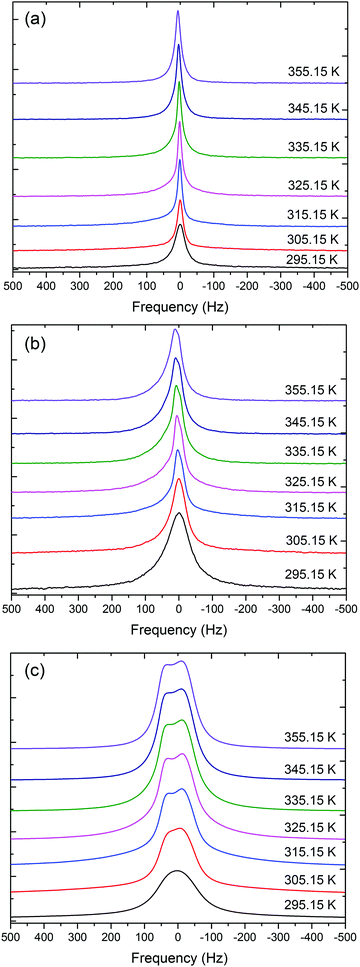 | ||
| Fig. 7 The 7Li NMR spectra of (a) 2.5 mol%, (b) 15 mol%, and (c) 20 mol% of Li[BScB] in [P4,4,4,8][BScB]. | ||
The 7Li NMR spectral line broadening non-monotonously decreases as the temperature increases from 295 K to 355 K. In the beginning of this temperature range (295–315 K), Δω sharply decreases by factors of 1.2 for 2.5 mol% and 1.9 for 15 mol%. However, above 315 K, it reaches a plateau region as in the case of the 2.5 mol% concentration or slowly and monotonously decreases further, as can be seen in the case of 20 mol% concentration. A graphical representation of the variation of 7Li NMR spectral line broadening with temperature for 2.5 mol% and 20 mol% concentrations of the Li[BScB] salt in [P4,4,4,8][BScB] is shown in Fig. S8 in the ESI.†
Chemical shift of the center of the line is slightly dependent on the Li[BScB] concentration in the IL, whereas it changes as the temperature increases (Fig. S9 in the ESI†). The temperature dependence of the chemical shift demonstrates two regions with different behaviors. In the temperature range 295–310 K, no significant change in the chemical shift was observed. At higher temperatures, 310–355 K, the chemical shift almost linearly moved in the high-field side with temperature. Slopes of the linear dependences of chemical shift relative to the chemical shift value at 295 K are ∼1.16 × 10⁻³ ppm K−1 for 2.5% of Li[BScB] and ∼7.21 × 10⁻⁴ ppm K−1 for 20% of Li[BScB] in the IL. Thus, at 310–325 K, the chemical shift is higher for the system with 20% of Li[BScB], whereas at 340–355 K, the chemical shift is higher for the system with 2.5% of Li[BScB].
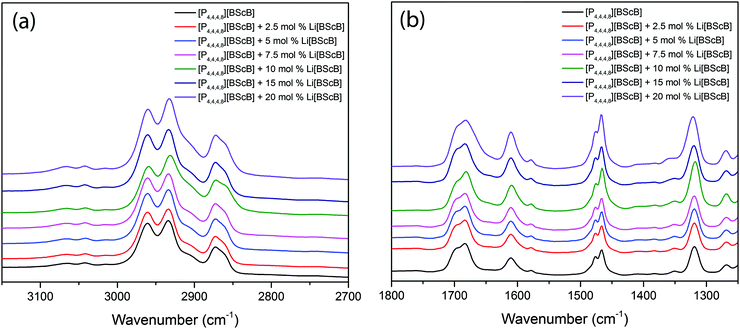
FTIR spectroscopy was employed to obtain deeper insights into the interaction of Li+ ion with the [BScB]− anion in these electrolytes. Fig. 8 shows the FTIR spectra of the neat [P4,4,4,8][BScB] and [P4,4,4,8][BScB] mixed with different concentrations of Li[BScB] salt in the IL in the frequency range from 3150 cm−1 to 2700 cm−1 (Fig. 8a) and from 1800 cm−1 to 1250 cm−1 (Fig. 8b). A comparison of the FTIR spectra for neat [P4,4,4,8][BScB] and Li[BScB] salt is shown in Fig. S10 in the ESI.† The stretching vibrations around 3050 cm−1 and in the frequency range from 3000 to 2850 cm−1 are assigned to the aromatic and aliphatic C–H groups, respectively. The vibrations around 1700 cm−1 are assigned to C![[double bond, length as m-dash]](https://www.rsc.org/images/entities/char_e001.gif) O stretching, those around 1600 cm−1 to the aromatic ring vibrations, and those between 1300 cm−1 and 1350 cm−1 are attributed to the B–O stretching. Obviously, no significant shift in the vibrations is observed in the FTIR spectra when Li[BScB] salt is added to the [P4,4,4,8][BScB] IL. The C
O stretching, those around 1600 cm−1 to the aromatic ring vibrations, and those between 1300 cm−1 and 1350 cm−1 are attributed to the B–O stretching. Obviously, no significant shift in the vibrations is observed in the FTIR spectra when Li[BScB] salt is added to the [P4,4,4,8][BScB] IL. The C![[double bond, length as m-dash]](https://www.rsc.org/images/entities/char_e001.gif) O stretching vibration around 1700 cm−1 is slightly broader for the concentrations higher than 15 mol% Li salt in the IL as compared that for lower concentrations, <15 mol%. This broadness reveals dynamic interactions between Li+ cations and [BScB]− anion.
O stretching vibration around 1700 cm−1 is slightly broader for the concentrations higher than 15 mol% Li salt in the IL as compared that for lower concentrations, <15 mol%. This broadness reveals dynamic interactions between Li+ cations and [BScB]− anion.
Consistent with other studies, the measured ionic conductivity and diffusivities of the ions showed that overall ionic mobility increased with the increasing temperature and decreased with the increasing salt concentration in the IL.51–54 The NMR and FTIR measurements suggest strong dynamic interactions between Li+ cations and [BScB]− anions that are concentration and temperature dependent. The aromatic [BScB]− anion may be coordinated through the delocalized electrons, one oxygen atom or two, and/or may be coordinated to a single Li+ cation or more. The strong dynamic interactions may lead to ionic clustering at higher concentrations of Li salt in the IL. Ionic clustering has been previously observed at higher concentrations of NaFSI salt in the C3mPyr ionic liquid.55
Conclusions
We investigated ion dynamics in halogen-free and hydrophobic orthoborate-based ionic liquid electrolytes. Tributyloctylphosphonium bis(salicylato)borate [P4,4,4,8][BScB] IL and lithium bis(salicylato)borate Li[BScB] salt were synthesized and characterized using 1H, 13C, 31P, and 11B NMR spectroscopy. It was found that the maximum solubility of the Li[BScB] salt in [P4,4,4,8][BScB] IL at room temperature is 20 mol%. The DSC data revealed a slight increase in the glass transition temperature upon the addition of the Li[BScB] salt to the IL, suggesting stronger ion–ion interactions in the electrolytes. No significant effect on the thermal degradation is observed upon the addition of Li[BScB] salt to the IL. An increase in the ionic conductivity is observed as a function of temperature and decrease is found with the addition of Li[BScB] salt to the IL. It revealed that the addition of lithium salts led to stronger Coulombic interactions between lithium cations and the anions that result in the decrease in the ionic mobility of the electrolytes. The PFG NMR data suggested that lithium ions were more mobile at higher temperatures and lower Li[BScB] concentrations. The 7Li NMR resonance line is split into two lines at higher Li salt concentrations, suggesting dynamic interactions between lithium cation and the [BScB]− anion. ATR-FTIR spectroscopy revealed spectral line broadening for [P4,4,4,8][BScB] mixed with Li[BScB] salt at concentrations higher than 15 mol%. This study will motivate researchers to design and synthesize new halogen-free and hydrolytically stable electrolytes to enhance the safety and performance of energy storage devices.Acknowledgements
The Norrbotten Research Council (NoFo) and the Swedish Research Council are gratefully acknowledged for the financial support. NMR spectrometer, TGA, DSC, and Metrohm Autolab PGSTAT302N electrochemical workstation have been purchased from the funds raised by the Kempe Foundation and Luleå University of Technology. NMR measurements were partly carried out using the equipment of the Federal Centre of Collective Facilities of Kazan Federal University.References
- V. Etacheri, R. Marom, R. Elazari, G. Salitra and D. Aurbach, Challenges in the development of advanced Li-ion batteries: a review, Energy Environ. Sci., 2011, 4, 3243–3262 CAS.
- L. Xia, L. Yu, D. Hu and G. Z. Chen, Electrolytes for electrochemical energy storage, Mater. Chem. Front., 2017, 1, 584–618 RSC.
- P. G. Bruce, S. A. Freunberger, L. J. Hardwick and J. M. Tarascon, Li-O2 and Li-S batteries with high energy storage, Nat. Mater., 2011, 11, 19–29 CrossRef PubMed.
- K. Xu, Electrolytes and interphases in Li-ion batteries and beyond, Chem. Rev., 2014, 114, 11503–11618 CrossRef CAS PubMed.
- E. Zinigrad, L. Larush-Asraf, J. Gnanaraj, M. Sprecher and D. Aurbach, On the thermal stability of LiPF6, Thermochim. Acta, 2005, 438, 184–191 CrossRef CAS.
- D. R. MacFarlane, N. Tachikawa, M. Forsyth, J. M. Pringle, P. C. Howlett, G. D. Elliott, J. H. Davis, Jr, M. Watanabe, P. Simon and C. A. Angell, Energy applications of ionic liquids, Energy Environ. Sci., 2014, 7, 232–250 CAS.
- K. Seddon, Ionic liquids: designer solvents for green synthesis, Chem. Eng., 2002, 730, 33–35 CAS.
- J. Hallett and T. Welton, Room-temperature ionic liquids: solvents for synthesis and catalysis, Chem. Rev., 2011, 111, 3508–3576 CrossRef CAS PubMed.
- N. Plechkova and K. Seddon, Applications of ionic liquids in the chemical industry, Chem. Soc. Rev., 2008, 37, 123–150 RSC.
- J. H. Shin, W. A. Henderson and S. Passerini, Ionic liquids to the rescue? Overcoming the ionic conductivity limitations of polymer electrolytes, Electrochem. Commun., 2003, 5, 1016–1020 CrossRef CAS.
- M. Barghamadi, A. S. Best, A. I. Bhatt, A. F. Hollenkamp, M. Musameh, R. J. Rees and T. Ruther, Lithium–sulfur batteries-the solution is in the electrolyte, but is the electrolyte a solution?, Energy Environ. Sci., 2014, 7, 3902–3920 CAS.
- H. Yoon, A. S. Best, M. Forsyth, D. R. MacFarlane and P. C. Howlett, Physical properties of high Li-ion content N-propyl-N-methylpyrrolidinium bis(fluorosulfonyl)imide based ionic liquid electrolytes, Phys. Chem. Chem. Phys., 2015, 17, 4656–4663 RSC.
- M. Hilder, G. M. A. Girard, K. Whitbread, S. Zavorine, M. Moser, D. Nucciarone, M. Forsyth, D. R. MacFarlane and P. C. Howlett, Physicochemical characterization of a new family of small alkyl phosphonium imide ionic liquids, Electrochim. Acta, 2016, 202, 100–109 CrossRef CAS.
- S. N. Chavan, A. Tiwari, T. C. Nagaiah and D. Mandal, Ether and siloxane functionalized ionic liquids and their mixtures as electrolyte for lithium-ion batteries, Phys. Chem. Chem. Phys., 2016, 18, 16116–16126 RSC.
- T. Yong, L. Zhang, J. Wang, Y. Mai, X. Yan and X. Zhao, Novel choline-based ionic liquids as safe electrolytes for high-voltage lithium-ion batteries, J. Power Sources, 2016, 328, 397–404 CrossRef CAS.
- S. Giri, S. Behera and P. Jena, Superhalogens as building blocks of halogen-free electrolytes in lithium-ion batteries, Angew. Chem., 2014, 126, 14136–14139 CrossRef.
- A. Basile, H. Yoon, D. R. MacFarlane, M. Forsyth and P. C. Howlett, Investigating non-fluorinated anions for sodium battery electrolytes based on ionic liquids, Electrochem. Commun., 2016, 71, 48–51 CrossRef CAS.
- J. Barthel, M. Wuhr, R. Buestrich and H. J. Gores, A new class of electrochemically and thermally stable lithium salts for lithium battery electrolytes: I. Synthesis and properties of lithium bis[1,2-benzenediolato(2-)-O,O′]borate, J. Electrochem. Soc., 1995, 142, 2527–2531 CrossRef CAS.
- J. Barthel, R. Buestrich, E. Carl and H. J. Gores, A new class of electrochemically and thermally stable lithium salts for lithium battery electrolytes: III. Synthesis and properties of some lithium organoborates, J. Electrochem. Soc., 1996, 143, 3572–3575 CrossRef CAS.
- M. Handa, S. Fukuda, Y. Sasaki and K. Usami, Use of a chelate complex with boron as a lithium salt for lithium battery electrolytes, J. Electrochem. Soc., 1997, 144, L235–L237 CrossRef CAS.
- Z. M. Xue., Y. Z. Ding and C. H. Chen, A DFT study of electronic structures, energies, and molecular properties of lithium bis[croconato]borateand its derivatives, Electrochim. Acta, 2007, 53, 990–997 CrossRef CAS.
- Y. Sasaki, M. Handa, K. Kurashima, T. Tonuma and K. Usami, Application of lithium organoborate with salicylic ligand to lithium battery electrolyte, J. Electrochem. Soc., 2001, 148, A999–A1003 CrossRef CAS.
- D. Aurbach, J. S. Gnanaraj, W. Geissler and M. Schmidt, Vinylene carbonate and Li salicylatoborate as additives in LiPF3(CF2CF3)3 solutions for rechargeable Li-ion batteries, J. Electrochem. Soc., 2004, 151, A23–A30 CrossRef CAS.
- L. Niedzicki, E. Karpierz, M. Zawadzki, M. Dranka, M. Kasprzyk, A. Zalewska, M. Marcinek, J. Zachara, U. Domanska and W. Wieczorek, Lithium cation conducting TDI anion-based ionic liquids, Phys. Chem. Chem. Phys., 2014, 16, 11417–11425 RSC.
- P. Jankowski, W. Wieczorek and P. Johansson, New boron based salts for lithium-ion batteries using conjugated ligands, Phys. Chem. Chem. Phys., 2016, 18, 16274–16280 RSC.
- C. Liao, K. S. Han, L. Baggetto, D. A. Hillesheim, R. Custelcean, E. S. Lee, B. Gue, Z. Bi, D. Jiang, G. M. Veith, E. W. Hagaman, G. M. Brown, C. Bridges, M. P. Paranthaman, A. Manthiram, S. Dai and X. G. Sun, Synthesis and characterization of lithium bis(fluoromalonato)borate for lithium-ion battery applications, Adv. Energy Mater., 2014, 4, 1301368 CrossRef.
- K. Xu, S. S. Zhang, U. Lee, J. L. Allen and T. R. Jow, LiBOB: Is it an alternative salt for lithium ion chemistry?, J. Power Sources, 2005, 146, 79–85 CrossRef CAS.
- H. Saruwatari, T. Kuboki, T. Kishi, S. Mikoshiba and N. Takami, Imidazolium ionic liquids containing LiBOB electrolyte for lithium battery, J. Power Sources, 2010, 195, 1495–1499 CrossRef CAS.
- K. Xu, S. Zhang, T. R. Jow, W. Xu and C. A. Angell, LiBOB as salt for lithium-ion batteries: a possible solution for high temperature operation, Electrochem. Solid-State Lett., 2002, 5, A26–A29 CrossRef CAS.
- K. Amine, J. Liu, S. Kang, I. Belharouak, Y. Hyung, D. Vissers and G. Henriksen, Improved lithium manganese oxide spinel/graphite Li-ion cells for high-power applications, J. Power Sources, 2004, 129, 14–19 CrossRef CAS.
- J. Liu, Z. Chen, S. Busking, I. Belharouak and K. Amine, Effect of electrolyte additives in improving the cycle and calendar life of graphite/Li1.1[Ni1/3Co1/3Mn1/3]0.9O2 Li-ion cells, J. Power Sources, 2007, 174, 852–855 CrossRef CAS.
- K. Xu, S. Zhang, B. A. Poese and T. R. Jow, Lithium bis(oxalato)borate stabilizes graphite anode in propylene carbonate, Electrochem. Solid-State Lett., 2002, 5, A259–A262 CrossRef CAS.
- M. Matsui, K. Dokko, Y. Akita, H. Munakata and K. Kanamura, Surface layer formation of LiCoO2 thin film electrodes in non-aqueous electrolyte containing lithium bis(oxalate)borate, J. Power Sources, 2012, 210, 60–66 CrossRef CAS.
- A. Swiderska-Mocek and D. Naparstek, Physical and electrochemical properties of lithium bis(oxalate)borate-organic mixed electrolytes in Li-ion batteries, Electrochim. Acta, 2016, 204, 69–77 CrossRef CAS.
- F. U. Shah, S. Glavatskih, D. R. MacFarlane, M. Forsyth and O. N. Antzutkin, Novel halogen-free chelated orthoborate–phosphonium ionic liquids: synthesis and tribophysical properties, Phys. Chem. Chem. Phys., 2011, 13, 12865–12873 RSC.
- P. T. Callaghan, Principles of nuclear magnetic resonance microscopy, Clarendon, Oxford, 1991 Search PubMed.
- J. E. Tanner, Use of the stimulated echo in NMR diffusion studies, J. Chem. Phys., 1970, 52, 2523–2526 CrossRef CAS.
- H. Yoon, H. Zhu, A. Hervault, M. Armand, D. R. MacFarlane and M. Forsyth, Physicochemical properties of N-propyl-N-methylpyrrolidinium bis(fluorosulfonyl) imide for sodium metal battery applications, Phys. Chem. Chem. Phys., 2014, 16, 12350–12355 RSC.
- P. Johansson, Electronic structure calculations on lithium battery electrolyte salts, Phys. Chem. Chem. Phys., 2007, 9, 1493–1498 RSC.
- M. H. Cohen and D. Turnbull, Molecular transport in liquids and gases, J. Chem. Phys., 1959, 31, 1164–1169 CrossRef CAS.
- M. Galinski, A. Lewandowski and I. Stepniak, Ionic liquids as electrolytes, Electrochim. Acta, 2006, 51, 5567–5580 CrossRef CAS.
- C. R. Pope, M. Kar, D. R. MacFarlane, M. Armand, M. Forsyth and L. A. O’Dell, Ion dynamics in a mixed-cation alkoxy-ammonium ionic liquid electrolyte for sodium device applications, ChemPhysChem, 2016, 17, 3187–3195 CrossRef CAS PubMed.
- P. Atkins and J. de Paula, Atkin's Physical Chemistry, Oxford University Press, 10th edn, 2014, p. 1008 Search PubMed.
- A. Noda, K. Hayamizu and M. Watanabe, Pulsed-gradient spin-echo 1H and 19F ionic diffusion coefficient, viscosity, and ionic conductivity of non-chloroaluminate room-temperature ionic liquids, J. Phys. Chem. B, 2001, 105, 4603–4610 CrossRef CAS.
- T. Frömling, M. Kunze, M. Schönhoff, J. Sundermeyer and B. Roling, Enhanced lithium transference numbers in ionic liquid electrolytes, J. Phys. Chem. B, 2008, 112, 12985–12990 CrossRef PubMed.
- B. Gélinas, M. Natali, T. Bibienne, Q. P. Li, M. Dolle and D. Rochefort, Electrochemical and transport properties of ions in mixtures of electroactive ionic liquid and propylene carbonate with a lithium salt for lithium-ion batteries, J. Phys. Chem. C, 2016, 120, 5315–5325 Search PubMed.
- A. Fernicola, F. Croce, B. Scrosati, T. Watanabe and H. Ohno, LiTFSI-BEPyTFSI as an improved ionic liquid electrolyte for rechargeable lithium batteries, J. Power Sources, 2007, 174, 342–348 CrossRef CAS.
- H. Yoon, P. C. Howlett, A. S. Best, M. Forsyth and D. R. MacFarlane, Fast charge/discharge of Li metal batteries using an ionic liquid electrolyte, J. Electrochem. Soc., 2013, 160, A1629–A1637 CrossRef CAS.
- H. B. Han, K. Liu, S. W. Feng, S. S. Zhou, W. F. Feng, J. Nie, H. Li, X. J. Huang, H. Matsumoto, M. Armand and Z. B. Zhou, Ionic liquid electrolytes based on multi-methoxyethyl substituted ammoniums and perfluorinated sulfonimides: preparation, characterization, and properties, Electrochim. Acta, 2010, 55, 7134–7144 CrossRef CAS.
- V. L. Martins, N. Sanchez-Ramirez, M. C. C. Ribeiro and R. M. Torresi, Two phosphonium ionic liquids with high Li+ transport number, Phys. Chem. Chem. Phys., 2015, 17, 23041–23051 RSC.
- G. M. A. Girard, M. Hilder, H. Zhu, D. Nucciarone, K. Whitbread, S. Zavorine, M. Moser, M. Forsyth, D. R. MacFarlane and P. C. Howlett, Electrochemical and physicochemical properties of small phosphonium cation ionic liquid electrolytes with high lithium salt content, Phys. Chem. Chem. Phys., 2015, 17, 8706–8713 RSC.
- M. Kerner, N. Plylahan, J. Scheers and P. Johansson, Ionic liquid based lithium battery electrolytes: fundamental benefits of utilising both TFSI and FSI anions?, Phys. Chem. Chem. Phys., 2015, 17, 19569–19581 RSC.
- M. Forsyth, G. M. A. Girard, A. Basile, M. Hilder, D. R. MacFarlane, F. Chen and P. C. Howlett, Inorganic–organic ionic liquid electrolytes enabling high energy-density metal electrodes for energy storage, Electrochim. Acta, 2016, 220, 609–617 CrossRef CAS.
- S. Horiuchi, M. Yoshizawa-Fujita, Y. Takeoka and M. Rikukawa, Physicochemical and electrochemical properties of N-methyl-nmethoxymethylpyrrolidinium bis(fluorosulfonyl)amide and its lithium salt composites, J. Power Sources, 2016, 325, 637–640 CrossRef CAS.
- M. Forsyth, H. Yoon, F. Chen, H. Zhu, D. R. MacFarlane, M. Armand and P. C. Howlett, Novel Na+ ion diffusion mechanism in mixed organic−inorganic ionic liquid electrolyte leading to high Na+ transference number and stable, high rate electrochemical cycling of sodium cells, J. Phys. Chem. C, 2016, 120, 4276–4286 CAS.
Footnote |
| † Electronic supplementary information (ESI) available. See DOI: 10.1039/c7cp02722b |
| This journal is © the Owner Societies 2017 |

