
 Open Access Article
 This Open Access Article is licensed under a
 Creative Commons Attribution 3.0 Unported Licence
Ultrasensitive and reproducible SERS platform of coupled Ag grating with multibranched Au nanoparticles
Yevgeniya
Kalachyova
ab,
David
Mares
c,
Vitezslav
Jerabek
c,
Pavel
Ulbrich
d,
Ladislav
Lapcak
e,
Vaclav
Svorcik
a and
Oleksiy
Lyutakov
 *ab
*ab
aDepartment of Solid State Engineering, University of Chemistry and Technology, 166 28 Prague, Czech Republic. E-mail: lyutakoo@vscht.cz
bDepartment of Technology of Organic Substances and Polymer Materials, Tomsk Polytechnic University, 634050 Tomsk, Russia
cDepartment of Microelectronics, Faculty of Electrical Engineering, Czech Technical University, Prague, Czech Republic
dDepartment of Biochemistry and Microbiology, University of Chemistry and Technology, Prague, Czech Republic
eCentral Laboratories, University of Chemistry and Technology, Prague, Czech Republic
First published on 11th May 2017
Abstract
Surface-enhanced Raman scattering (SERS) spectroscopy is an extremely sensitive analytical technique that is capable of identifying the vibration signatures of target molecules up to single-molecule sensitivity. In this work, the ultrahigh sensitivity of SERS has been achieved through the immobilization of sharp-edges specific nanoparticles – so-called gold multibranched NPs (AuMs) on the silver grating surface through the biphenyl dithiol. This approach allows combining the extremely high SERS enhancement factor (better than that in the case of AuMs immobilized on the flat Ag film) with perfect reproducibility of Raman signals. The grating was created on the polymer substrate using the excimer laser modification and further metal deposition and has an “active” area 5 × 10 mm2, enabling the macroscale SERS substrate preparation. The wet-chemistry synthesized AuMs were then immobilized on the grating surface and the produced structure allows SERS measurements with a portable Raman spectrophotometer. The prepared structures were checked using the AFM, UV-Vis, and Raman spectroscopy techniques.
Introduction
The surface plasmons (SPs) of metallic nanostructures have broad application prospects in photocatalysis, nanophotonics, medicine, and sensorics.1–4 In particular, in the field of surface-enhanced Raman spectroscopy (SERS), the application of surface plasmon phenomena represents a unique method for the detection of biomolecules, drugs, explosives, organic pollutants, heavy metals as well as in situ monitoring of chemical reactions.5–10 Taking into account the basic requirements for the analysis of these compounds, an analytical approach must satisfy several requirements: (i) be fast and straightforward, (ii) achieve the detection limits that are as low as possible, and (iii) give reproducible and reliable results. SERS satisfies two of these three requirements: recent progress in this field allows taking measurements using the portable spectrophotometers,11,12 and with up to one-molecule-level sensitivity, which was implemented in the last millennium.13,14 However, the last requirement of reproducibility remains one of the biggest challenges in the SERS field. There are various research projects that achieved the creation of a reproducible substrate,15,16 but the achievement of high detection limit and reproducibility of results (desirably using the portable Raman spectrophotometer) remains a problem.More common methods to realize the uniformity of SERS response (i.e. reproducibility of results) and high detection limit require the electron beam lithography.17 However, in this case the preparation of a large area substrate is complicated. Some alternative techniques allow the development of plasmonic structures with uniform distribution of plasmon hot spots through the top-down approach, like self-assembly.18 On the other hand, a significant SERS enhancement can be achieved through the utilization of nanostructures with a high amount of the so-called hot-spots,19i.e. nanoparticles with the star or urchin-like symmetry.20,21 Application of these nanoparticles and their assembly22,23 was reported for the detection of the various molecules in both medical24,25 and safety26 fields. However, utilization of gold nanostars is limited by the inhomogeneity of the hot spot distribution, thus making it impossible to predict the enhancement factor along the SERS-active substrate. In order to overcome this problem, the immobilization or growth of gold nanoparticles with shape edges on the different substrates was proposed.27,28
Ideally, the immobilization of Au nanostars can be performed on the metal surface, as this method allows increasing the Raman response29 further and using the well-known thiol chemistry for monolayer formation.30–32 In this work, the immobilization of gold nanoshaped particles on the patterned metal grating surface was proposed and studied. Special attention was paid to the parameter of the structure and its effect on the resulting SERS enhancement. Moreover, the investigation of the “space” where the plasmon is focused was also performed, with the aim of estimating the potential impact of such a structure for further SERS applications. SERS substrates were prepared by the creation of Ag grating followed by the grafting of the Au nanostructure to the Ag surface. Prepared structures were checked using the AFM, UV-Vis, and Raman spectroscopy techniques.
Results and discussion
A schematic representation of the creation of surface plasmon polariton (SPP) coupled with a localized surface plasmon (LSP) structure is depicted in Fig. 1. The flat polymer thin film was patterned using an excimer laser beam at the relatively large scale (5 × 10 mm2). Then the Ag layer was deposited on the periodically modulated surface. The parameters of Ag sputtering were optimized in our previous studies.7,33 In the next step, the BFDT (biphenyl-4,4′-dithiol) molecules were grafted on the grating surface using the common thiol-based chemistry procedure. Finally, the AuMs were immobilized on the surface of Ag using the BFDT as anchors (Fig. 1). The proposed structure can excite both, SPP and LSP resonances, because of the presence of sharp tips on AuMs and the periodical nature of the neighboring Ag grating. Moreover, it can be expected that the SPP-LSP coupling will result in more homogenous distribution and more pronounced intensity of the plasmon hot spots, leading to a homogeneous and high SERS response. | ||
| Fig. 1 Schematic representation of the LSP–SPP coupled system preparation: (a) patterning of the Su-8 surface; (b) sputtering of the silver layer; (c) grafting of BFDT molecules; (d) grafting of AuMs through the BFDT linkers. | ||
Creation of the periodical structure on the polymer surface was confirmed using the AFM technique. Taking into account the fact that the optimal wavelength for SPP excitation is the strong function of grating periodicity (P), the experimental parameters were varied with the aim to achieve different values of grating periodicity. The AFM results are presented in Fig. 2, which shows the AFM images of gratings realized by the surface laser pattering under the different angles of the incident laser beam. Simultaneous changing of laser beam pulses allows us to keep the grating amplitude (A) at a constant level, with the aim to maintain this parameter unchanged.
 | ||
| Fig. 2 Surface morphology measured on the patterned polymer surface with various periodicities (P): (a) P1 – 240 nm; (b) P2 – 280 nm; (c) P3 – 370 nm. | ||
The AuMs structure was studied using SEM and TEM microscopy (see Fig. 3). Both methods confirm the synthesis of nanoparticles with an edge shape. Such structures can efficiently excite LSP, with very high concentration of energy at the ends of sharp edges. Unprecedented light energy focusing results in the huge SERS response. Consequently, the large enhancement factor allows the detection of the zepto-level of the targeted molecule concentration that was reported in the literature for the Au nanostructures with a similar shape.30 However, the repeatability of SERS results obtained using the AuMs remains an unresolved issue. In this work, the combination of LSP, excited on the AuMs edges with the SPP further excited on the Ag grating was used to overcome the severe reproducibility problem and to create an SERS substrate with a high enhancement factor and good reproducibility.
 | ||
| Fig. 3 TEM images of the prepared and used AuMs (inset SEM image). | ||
Grafting of AuMs on the grating structure was studied using AFM techniques. The results are presented in the Fig. 4, which shows the different stages of the AuM immobilization through the BFDT bridges. In particular, Fig. 4(a) shows the grating structure after the BFDT attachment, before the sample has been immersed in the solution of AuMs. It is evident that the grating structure is not affected by the BFDT structure since the “thiol chemistry” is known to form a monomolecular structure. Fig. 4(b) shows the results of AuMs grafting after 24 hours of sample immersing in the solution. As is evident, the entrapping of Au nanoparticles occurs, but the grating surface is not entirely covered. Finally, Fig. 4(c) shows the surface morphology after sample immersion for 48 hours. The grating structure is screened by the attached AuMs, which indicates the full covering of the pristine surface during the reaction time.34
 | ||
| Fig. 4 Surface morphology measured on the: (a) patterned polymer surface covered by silver layer; (b) patterned polymer surface covered by silver layer with grafted AuMs after sample immersing during the 12 hours; (c) patterned polymer surface covered by silver layer with grafted AuMs after sample immersing during the 24 hours. | ||
It is well known that the proximity of noble metal nanostructures to each other can induce a significant shift of their plasmon resonance wavelength position.35 With the aim to estimate the mean positions (SPP in the case of Ag grating and LSP in the case of AuMs), as well as their potential shift, resulting from the plasmonic coupling, a series of UV measurements (presented in Fig. 5, including the UV-Vis spectra of AuMs, Ag grating and the coupled plasmonic structure) were done. In the case of Au, the grating spectra were measured with polarized light, to induce more efficient and apparent SPP excitation. The spectra of AuMs show a high and wide plasmon resonance absorption peak, with the maximum located at the 785 nm, which is typical for such kind of nanoparticles. Pronounced SPP resonance is located in the closed wavelength range (Fig. 5), which is a necessary condition for successful SPP-LSP coupling.36 Grafting of AuMs to the Ag grating surface results in the slight shift of resonance position by ca. 30 nm toward longer wavelengths.
 | ||
| Fig. 5 Absorption spectra of: (i) Ag grating, (ii) AuMs (inset foto of AuMs in water solution), and (iii) silver grating with grafted AuMs. | ||
In the SERS experiments, the AuMs were grafted to the surface of silver gratings with different periodicity (indicated as the P1 = 240 nm, P2 = 280 nm, P3 = 370 nm, see the Fig. 6) and various Ag thicknesses. Raman excitation was performed using two wavelengths 630 and 785 nm. Before the SERS measurements, a typical analyte – R6G was deposited on the top of the prepared samples. As a result, two molecules, able to give significant SERS response, are presented in the system: (i) the BFDT molecules, located between the grating and AuMs and (ii) R6G molecules, located at the sample surface (i.e. in the space above and between AuMs). As is evident from Fig. 6, the apparent SERS responses were observed from both molecules, but the enhancement phenomenon is a strong function of the applied wavelength. In the case of 630 nm excitation, the Raman spectra correspond to the R6G typical response. When the 785 nm excitation wavelength is applied, the R6G peaks disappear (or become insignificant), and the BFDT response is dominant. This fact indicates that the plasmon intensity is distributed differently. When the excitation wavelength is close to the plasmon maximum of both kinds of metal nanostructures, the plasmon energy is focused in the gap between the AuMs and the Ag grating. When the applied excitation wavelength is shifted, compared to the plasmon absorption maximum, the efficient energy is mainly focused between the AuMs (the place where R6G molecules are located).
 | ||
| Fig. 6 SERS spectra from the samples consisting of gratings with different periodicity and silver thickness grafted through BFDT linkers with AuMs and additionally covered with R6G molecules. | ||
Another parameter, which can significantly affect the SERS intensity, is the grating parameter. Fig. 6 shows the change of more pronounced Raman peaks (for BFDT and R6G, depending on the excitation wavelength) as the function of Ag thickness for three different periodicities. As can be expected, each applied wavelength has its “optimum” wavelength and metal thickness.7 In particular, when the 630 nm wavelength excitation was applied, a more pronounced response was measured for the 20 nm thick metal layer with 240 nm periodicity of the grating. When the 785 nm excitation wavelength was used, the optimal Ag thickness was found to be 38 nm, and the periodicity of 280 nm gives better results.
Another parameter, which is typically used for plasmonic substrate characterization is the SERS enhancement factor (EF). To demonstrate the advantages of AuMs coupled with silver grating series of measurements and calculations was performed. The R6G solution was deposited, on the flat silver film, silver grating and AuMs coupled to the flat silver surface and the silver grating. Measurements and calculations were performed for both excitation wavelengths (630 and 785 nm). The results are presented in Table 1. In the case of 785 nm, no significant difference in the Raman spectra was observed – the signal from the BFDT molecules, located between the AuMs and the silver grating surface, was mainly observed. In the case of 630 nm excitation, it is evident that the highest enhancement factor was measured for AuMs coupled to the silver grating. A several orders of magnitude lower EF was obtained in the case of AuMs grafted on the flat silver surface. However, this value is still higher than the EF of R6G deposited on the silver grating surface or on the flat silver surface.
| Sample | EF (λex = 630 nm) | EF (λex = 785 nm) |
|---|---|---|
| Ag flat | 103 | 102 |
| Ag flat/AuMs | 108 | 103 |
| Ag grating | 104 | — |
| Ag grating/AuMs | 1011 | — |
Sandwiching of the analyte molecules between the AuMs and Ag films was reported for detection at the zepto-molar level. This approach implements light focussing at the nanometer scale between the Ag surface and grafted Au nanostars.30 However, it is difficult to expand this approach to the range of non-thiolated molecules. Oppositely, this work finds that it is not necessary to sandwich the analyte molecule, but it is possible to utilize a suitable combination of the periodical structure, nanoparticle shape, and excitation wavelength to make the proposed SERS substrate applicable for the analysis of “top deposited” molecules. To study the plasmon energy concentration under the 630 nm excitation in the space between the AuMs, as well as the impact of the neighboring Ag grating, a series of numerical simulations was performed. The results are given in Fig. 7, which shows the distribution of the electric field between the AuMs located on the dielectric support, smooth Ag layer and the patterned (grating) surface. It is evident that when the 630 nm excitation wavelength was applied, the intensity of plasmon was located between the AuMs. The level of the energy concentration is the strong function of the adjacent substrate. A low energy focus was observed in the case of the dielectric substrate (Fig. 7a). A significant increase of plasmon intensity was observed for the AuMs located on the metal thin film (Fig. 7b) and the strongest enhancement was observed for AuMs grafted onto the optimized Ag grating surface (Fig. 7c). It must be additionally noted, that in the case of 630 nm excitation the light is dominantly focused into the space between AuMs. In this case the possible signal from BFDT molecules, located between the grating and AuMs, is suppressed and the measured SERS spectra mostly arise from the top-deposited targeted molecules.
 | ||
| Fig. 7 Electric field distribution on the AuMs array under the illumination by 630 nm: (a) in the dielectric environment; (b) deposited on the flat silver surface; (c) grafted to the silver grating. | ||
One of the most important parameters characterizing the effectiveness of SERS substrates is the minimal detectable concentration of an analyte. To estimate this parameter, a series of measurements with different R6G concentrations were performed and results are presented in Fig. 8A. 630 nm excitation wavelength was applied since it was found to be optimal for focusing light between the AuMs. As is evident from Fig. 8A the detection of R6G up to 10−11 concentration is possible. The dependence of the SERS peak intensity (depicted in Fig. 8A) on the R6G concentration is shown in Fig. 8A inset. At higher concentrations, an approximately linear dependence is observed, while at smaller concentrations the dependence becomes nonlinear. Additional measurements were also performed with the aim of estimating the response of BFDT, grafted to the silver grating under the excitation with 630 nm and without the presence of AuMs (Fig. 8B). Additionally, the SERS response of R6G (785 nm excitation) was measured on the AuMas, deposited on the flat silicon surface (without the silver grating) – Fig. 8C. From the obtained results, it is evident (Fig. 8B) that the SERS response of the grafted BFDT molecules is only slightly enhanced by the presence of AuMs. This result could be expected, since the light is focused into the space between AuMs where the BFDT molecules are not present (Fig. 7). In the case of R6G molecules, deposited on the AuMs without the silver grating, the SERS response was weak in comparison with that obtained with the AuMs–Ag grating silver system.
 | ||
| Fig. 8 (A) SERS response of R6G deposited on the coupled Ag grating – AuMs from the solution with different concentrations (excitation wavelength – 630 nm); (B) effect of AuMs coupling on SERS response of BFDT molecules, grafted to Ag grating; (C) SERS spectra of R6G deposited on the AuMs/Si surface (excitation wavelength – 785 nm). | ||
Finally, the estimation of the SERS reproducibility was performed. The results are presented in Fig. 9, which shows both, the inaccuracy between the SERS measurements carried out on the one sample surface (the error bars) and the variation of SERS signal between the different samples (the height of columns). The measurements were performed using two excitation wavelengths dependent on the more pronounced response of BFDT (785 nm excitation) or R6G (630 nm). The Raman peaks depicted in the top part of Fig. 9 images were evaluated. As is evident from Fig. 9, the deviation of SERS response in the framework of one sample is less than 8.7%, and the deviation between the individual samples is approximately 8.9%. A better convergence of statistical analysis was observed for the excitation with 785 nm (i.e. the response of BFDT), which can be attributed to some inhomogeneities of R6G deposition.
 | ||
| Fig. 9 Study of reproducibility prepared samples by SERS method (along the one sample surface – errors bars; between the different samples – columns heights) by: (i) 785 nm excitation wavelength (BFDT-related peaks is used as marker) and (ii) 630 nm excitation wavelength (R6G related peak is used as marker). | ||
Conclusion
Plasmonically coupled SERS substrates were prepared by the creation of a Ag grating (supported the SPP excitation) followed by the grafting of AuMs onto the Ag surface. The prepared structures were checked using the AFM, UV-Vis, and Raman spectroscopy techniques. The grating parameters were optimized with the aim to achieve the highest SERS response for two typical Raman wavelengths (630 nm and 785 nm). It was found that, depending on the wavelength used, the plasmon is preferentially focused between the metal nanoparticles and grating surface, or in the space between the metal nanoparticles. This result was confirmed from both, experimental and theoretical points of view. Plasmon coupling and SPP-LSP interplay allow the achievement of a high SERS enhancement and its comparison to the array of metal nanoparticles deposited in the dielectric environment, or on the flat metal films. Additionally, excellent reproducibility of SERS response was achieved. The realized enhancement allows the application of a portable Raman spectrophotometer for SERS analysis. From the viewpoint of sensitivity and reproducibility, the prepared SERS substrates have key advantages for various analytical applications, from in situ monitoring up to the detection of certain chemical reactions on a molecular level.Experimental section
Materials
Chloroauric acid tetrahydrate (HAuCl4·4H2O, 99.9%), silver nitrate (AgNO3, 99.0%), and ascorbic acid (AA, 99.0%) were purchased from Sigma-Aldrich. All chemical reagents were used as received without further purification. Deionized water was used throughout the experiments.Preparation of Au nanoparticles
Gold multibranched nanoparticles (AuMs) were synthesized using a known procedure.37 100 μL of 10 mM aqueous HAuCl4 solution was mixed with 3 mL of deionized water, and then 6 μL of 10 mM aqueous AgNO3 solution was added under magnetic stirring for 30 s. After the solutions had been thoroughly mixed, 2 μL of 100 mM ascorbic acid was “quickly” added, and the solution was stirred vigorously for 10 s at room temperature (RT). When the reducing agent was added, the color of the mixture changed immediately from yellow to dark blue, indicating the formation of AuMs. Then the AuMs were dispersed in 3 mL of water and were purified three times by centrifugation at 5000 rpm for 10 min.34 For further use, the resultant precipitates were redissolved in deionized water.Preparation of Ag grating
Polymer films (solution of epoxy resin – photoresist, Su-8, purchased from Microchem) were spin-coated (1000 rpm) from a solution onto freshly cleaned glass substrates (supplied by Glassbel Ltd, CR) during 30 min. The prepared samples were dried at 50 °C for 24 h and irradiated by UV-source for 30 min. After UV-irradiation, the samples were dried at 90 °C for 2 h.The flat polymer surface was patterned by a KrF excimer laser (COMPexPro 50F, Coherent, Inc., wavelength 248 nm, pulse duration 20–40 ns, repetition rate 10 Hz). The laser beam was polarized linearly with a cube of UV-grade fused silica with an active polarization layer. The samples were irradiated under various angles 40, 50 and 60° with respect to the film surface normal with 3300, 3500 and 3800 laser pulses respectively with laser fluences from 9 mJ cm−2.33 The aperture with an area of 5 × 10 mm2 was used. As a result, the periodic surface structures were created on the polymer surface.
Silver was then deposited onto a patterned surface by a vacuum sputtering (DC Ar plasma, gas purity of 99.995%, a gas pressure of 4 Pa, a discharge power of 7.5 W). The deposition of silver was accomplished from the Ag target (purity of 99.99%, provided by Safina, CR). Prepared gratings were covered by silver films of different thicknesses (from 5 to 50 nm).
Samples grafting with AuMs
Freshly prepared samples of Ag gratings were immersed into a methanol solution of BFDT (5 × 10⁻³ mol L−1) for 24 h. After incubation, the samples modified by BFDT were washed with methanol and immersed into solutions of AuMs for 12 h and 24 h.32 Finally, the samples were cleaned in an ultrasonic bath (in distilled water) and dried under a N2 flow. The procedure for sample preparation is illustrated in Fig. 1.Rhodamine 6G (R6G) was supplied from Sigma-Aldrich, dissolved in methanol (10−7 mol L−1 solution) and added by dropping solution onto sample surface before SERS measurements.
Diagnostic methods
TEM images of AuMs were obtained on a JEOL JEM-1010 instrument operated at 80 kV (JEOL Ltd., Japan).For characterization of the sample surface and nanomechanical mapping before and after surface modification, the peak force AFM technique was used. Surface mapping was performed using Icon (Bruker) set-up on a 3 × 3 μm2 sample area.
UV-Vis absorption spectra were measured using a Lambda 25 UV/Vis/NIR spectrometer (PerkinElmer, USA) in the spectral range of 400–900 nm at a scanning rate of 240 nm min−1 and a data collection interval of 1 nm.
Raman scattering was measured on a Nicolet Almega XR spectrometer (Laser power 30 mW) Raman spectrometers with 630 and 785 nm excitation wavelengths. Spectra were measured 10 times, each of them with 30 s accumulation times.
SERS EF calculations
For the calculation of the SERS enhancement factor, the thin layer of R6G (10−7 mol L−1 solution) was deposited on the prepared SERS active substrates and appropriated control surface (flat silver film, silver grating, coupled silver grating and AuMs, and a silicon background as the reference substrate) were done. Calculation of SERS EF was performed according to the standard relation, which can be expressed as: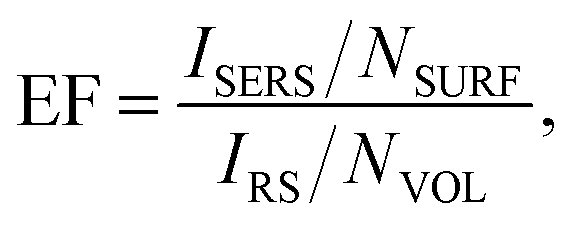 | (1) |
Simulation methods
The design, modeling and the optimization of the structures containing AuMs were conducted using the RSoft Photonic Component Design Suite software package with the aim to maximize the plasmon energy concentration considering Raman excitation wavelengths that were to be used. The structures were modeled in time in a fully vectorial spatial domain using the Finite-Difference Time-Domain (FDTD) method. Given the size of the nanoparticles in the nanometer range, the simulations were done with very fine resolution 0.1 nm to obtain precise results. The model was constructed having in mind real parameters of the materials from which the layers and nanoparticles were fabricated. The modeling was done using a threefold approach. Firstly, a preliminary model of the AuMs located on the dielectric support was made. Secondly, the AuMs were based on the smooth Ag layer. Thirdly, in the last model, the AuMs were based on the optimized patterned (grating) surface to enhance the plasmon energy concentration further.Acknowledgements
This work was supported by the GACR under the projects 15-19209S, 15-19485S and P108/12/G108 (VS) and partly by the Grant Agency of the CTU in Prague, grant no. SGS16/057/OHK3/2T/16.References
- K. Awazu, M. Fujimaki, C. Rockstuhl, J. Tominaga, H. Murakami, Y. Ohki, N. Yoshida and T. Watanabe, J. Am. Chem. Soc., 2008, 130, 1676–1680 CrossRef CAS PubMed.
- S. Lal, S. Link and N. J. Halas, Nat. Photonics, 2007, 1, 641–648 CrossRef CAS.
- O. Lyutakov, O. Hejna, A. Solovyev, Y. Kalachyova and V. Svorcik, RSC Adv., 2014, 4, 50624–50630 RSC.
- J. Svanda, Y. Kalachyova, P. Slepicka, V. Svorcik and O. Lyutakov, ACS Appl. Mater. Interfaces, 2016, 8, 225–231 CAS.
- L. Zhang, W.-F. Dong, Z.-Y. Tang, J.-F. Song, H. Xia and H.-B. Sun, Opt. Lett., 2010, 35, 3297–3299 CrossRef CAS PubMed.
- Y. Zeng, L. H. Wang, L. W. Zeng, A. G. Shen and J. M. Hu, Talanta, 2017, 162, 374–379 CrossRef CAS PubMed.
- Y. Kalachyova, D. Mares, O. Lyutakov, M. Kostejn, L. Lapcak and V. Svorcik, J. Phys. Chem. C, 2015, 119, 9506–9512 CAS.
- Q. Cui, G. Shen, X. Yan, L. Li, H. Möhwald and M. Bargheer, ACS Appl. Mater. Interfaces, 2014, 6, 17075–17081 CAS.
- L. Xu, H. Yin, W. Ma, H. Kuang, L. Wang and C. Xu, Biosens. Bioelectron., 2015, 67, 472–476 CrossRef CAS PubMed.
- W. Ma, M. Sun, L. Xu, L. Wang, H. Kuang and C. Xu, Chem. Commun., 2013, 49, 4989–4991 RSC.
- R. J. G. Rubira, S. A. Camacho, P. H. B. Aoki, F. V. Paulovich, O. N. Oliveira and C. J. L. Constantino, J. Mater. Sci., 2016, 51, 3182–3190 CrossRef CAS.
- S. Y. Qiu, F. S. Zhao, O. Zenasni, J. T. Li and W. C. Shih, ACS Appl. Mater. Interfaces, 2016, 8, 29968–29976 CAS.
- H. X. Xu, E. J. Bjerneld, M. Kall and L. Borjesson, Phys. Rev. Lett., 1999, 83, 4357–4360 CrossRef CAS.
- A. M. Michaels, M. Nirmal and L. E. Brus, J. Am. Chem. Soc., 1999, 121, 9932–9939 CrossRef CAS.
- S. R. Si, W. K. Liang, Y. H. Sun, J. Huang, W. L. Ma, Z. Q. Liang, Q. L. Bao and L. Jiang, Adv. Funct. Mater., 2016, 26, 8137–8145 CrossRef CAS.
- Y. W. Wang, K. C. Kao, J. K. Wang and C. Y. Mou, J. Phys. Chem. C, 2016, 120, 24382–24388 CAS.
- M. K. Fan, G. F. S. Andrade and A. G. Brolo, Anal. Chim. Acta, 2011, 693, 7–25 CrossRef CAS PubMed.
- H. W. Duan, M. Kuang, D. Y. Wang, D. G. Kurth and H. Mohwald, Angew. Chem. Int. Ed., 2005, 44, 1717–1720 CrossRef CAS PubMed.
- C. G. Khoury and T. Vo-Dinh, J. Phys. Chem. C, 2008, 112, 18849–18859 CAS.
- S. Atta, T. V. Tsoulos and L. Fabris, J. Phys. Chem. C, 2016, 120, 20749–20758 CAS.
- J. K. Register, A. M. Fales, H. N. Wang, S. J. Norton, E. H. Cho, A. Boico, S. Pradhan, J. Kim, T. Schroeder, N. A. Wisniewski, B. Klitzman and T. Vo-Dinh, Anal. Bioanal. Chem., 2015, 407, 8215–8224 CrossRef CAS PubMed.
- L. Xu, H. Kuang, C. Xu, W. Ma, L. Wang and N. A. Kotov, J. Am. Chem. Soc., 2012, 134, 1699–1709 CrossRef CAS PubMed.
- L. Xu, W. Yan, W. Ma, H. Kuang, X. Wu, L. Liu, Y. Zhao, L. Wang and C. Xu, Adv. Mater., 2015, 27, 1706–1711 CrossRef CAS PubMed.
- M. Wang, X. W. Cao, W. B. Lu, L. Tao, H. Zhao, Y. Wang, J. Dong and W. P. Qian, J. Nanosci. Nanotechnol., 2016, 16, 6711–6718 CrossRef CAS.
- G. Lu, T. Z. Forbes and A. J. Haes, Analyst, 2016, 141, 5137–5143 RSC.
- A. Li, L. Tang, D. Song, S. Song, W. Ma, L. Xu, H. Kuang, X. Wu, L. Liu, X. Chen and C. Xu, Nanoscale, 2016, 8, 1873–1878 RSC.
- N. I. Evcimen, S. Coskun, D. Kozanoglu, G. Ertas, H. E. Unalanbc and E. N. Esenturk, RSC Adv., 2015, 5, 101656 RSC.
- Z. Novotna, A. Reznickova, N. Slepickova Kasalkova, O. Kvítek, Z. Kolska and V. Svorcik, Appl. Surf. Sci., 2014, 307, 217–223 CrossRef CAS.
- R. Alvarez-Puebla, L. M. Liz-Marzan and F. J. G. de Abajo, J. Phys. Chem. Lett., 2010, 1, 2428–2434 CrossRef CAS.
- L. Rodriguez-Lorenzo, R. Alvarez-Puebla, I. Pastoriza-Santos, S. Mazzucco, O. Stephan, M. Kociak, L. M. Liz-Marzan and F. J. G. de Abajo, J. Am. Chem. Soc., 2009, 131, 4616–4618 CrossRef CAS PubMed.
- P. Zheng, M. Li, R. Jurevic, S. K. Cushing, Y. Liu and N. Wu, Nanoscale, 2015, 7, 11005–11012 RSC.
- Y. Kalachyova, D. Mares, V. Jerabek, K. Zaruba, P. Ulbrich, L. Lapcak, V. Svorcik and O. Lyutakov, J. Phys. Chem. C, 2016, 120, 10569–10577 CAS.
- Y. Kalachyova, O. Lyutakov, P. Slepicka, R. Elashnikov and V. Svorcik, Nanoscale Res. Lett., 2014, 9, 591 CrossRef PubMed.
- Y. Kalachyova, A. Olshtrem, O. A. Guselnikova, P. S. Postnikov, R. Elashnikov, P. Ulbrich, S. Rimpelova, V. Svorcik and O. Lyutakov, ChemistryOpen, 2017, 6, 254–260 CrossRef CAS PubMed.
- S. K. Ghosh and T. Pal, Chem. Rev., 2007, 107, 4797–4862 CrossRef CAS PubMed.
- L. Lin and A. Roberts, Opt. Express, 2011, 19, 2626–2633 CrossRef CAS PubMed.
- L. C. Cheng, J. H. Huang, H. M. Chen, T. C. Lai, K. Y. Yang, R. S. Liu, M. Hsiao, C. H. Chen, L. J. He and D. P. Tsai, J. Mater. Chem., 2012, 22, 2244–2253 RSC.
| This journal is © the Owner Societies 2017 |